PROVINCIAL TREASURY ANNUAL REPORT VOTE 12
170
PROVINCIAL TREASURY 2018/19 ANNUAL REPORT VOTE 12
Transcript of PROVINCIAL TREASURY ANNUAL REPORT VOTE 12
PROVINCIAL TREASURY
2018/19
PROVINCIAL TREASURY ANNUAL REPORT VOTE 12 2018/19CONTACT INFORMATIONPrivate Bag X0029, Bhisho, 5605Tel 040 101 0157 | Fax 040 101 [email protected]
gemprint 043 722 0755 (60624)
ANNUAL REPORTVOTE 12

ANNUAL REPORT FOR 2018/19 FINANCIAL YEAR - VOTE 12: EASTERN CAPE PROVINCIAL TREASURY 1
ANNUAL REPORTVOTE 12
2018/19 FINANCIAL YEAR

ANNUAL REPORT FOR 2018/19 FINANCIAL YEAR - VOTE 12: EASTERN CAPE PROVINCIAL TREASURY2
PR: 121/2019
ISBN: 978-0-621-47278-0
Title of Publications: Eastern Cape: 2019/20 Provincial Treasury Annual Report
ANNUAL REPORT FOR 2018/19 FINANCIAL YEAR - VOTE 12: EASTERN CAPE PROVINCIAL TREASURY 3
CONTENTS
PART A: GENERAL INFORMATION ............................................................................................................................. 5
1.1. Department’s General Information ............................................................................................................................7
1.2. List of Abbreviations .................................................................................................................................................8
1.3. Foreword by the MEC .............................................................................................................................................10
1.4. Report of the Accounting Officer ............................................................................................................................12
1.5. Statement of responsibility and confirmation of accuracy for the annual report ....................................................17
1.6. Strategic Overview ..................................................................................................................................................181.6.1. Vision ..........................................................................................................................................................181.6.2. Mission .......................................................................................................................................................181.6.3. Values .........................................................................................................................................................18
1.7. Legislative and other Mandate ................................................................................................................................18
1.8. Organisational Structure .........................................................................................................................................19
2. PART B: PERFORMANCE INFORMATION ........................................................................................................ 21
2.1. Auditor-General’s Report: Predetermined Objectives ............................................................................................23
2.2. Overview of Departmental Performance .................................................................................................................252.2.1. Service delivery environment ......................................................................................................................252.2.2. Service Delivery Improvement Plan ............................................................................................................272.2.3. Organisational environment ........................................................................................................................292.2.4. Key policy developments and legislative changes .....................................................................................30
2.3. Strategic Outcome Oriented Goals .........................................................................................................................31
2.4. Performance Information by Programme ................................................................................................................312.4.1. Programme 1: Administration .....................................................................................................................312.4.2. Programme 2: Sustainable Resource Management ...................................................................................392.4.3. Programme 3: Asset and Liability Management .........................................................................................472.4.4. Programme 4: Financial Governance .........................................................................................................522.4.5. Programme 5: Municipal Financial Governance .........................................................................................592.4.6. Transfer payments ......................................................................................................................................662.4.7. Conditional Grants ......................................................................................................................................662.4.8. Donor Funds ...............................................................................................................................................662.4.9. Capital Investment ......................................................................................................................................67
3. PART C: GOVERNANCE ................................................................................................................................... 69
3.1. Introduction .............................................................................................................................................................71
3.2. Risk Management ...................................................................................................................................................71
3.3. Fraud and Corruption ..............................................................................................................................................71
3.4. Minimising conflict of interest .................................................................................................................................72
3.5. Code of Conduct .....................................................................................................................................................72
3.6. Health, Safety and Environmental Issues................................................................................................................72
3.7. Portfolio Committees ..............................................................................................................................................73
3.8. Scopa Resolutions ..................................................................................................................................................76
3.9. Prior Modifications to Audit Reports .......................................................................................................................76

ANNUAL REPORT FOR 2018/19 FINANCIAL YEAR - VOTE 12: EASTERN CAPE PROVINCIAL TREASURY4
3.10. Internal Control Unit ................................................................................................................................................76
3.11. Internal Audit and Audit Committee ........................................................................................................................763.11.1. Internal Audit ...............................................................................................................................................763.11.2. Audit Committee .........................................................................................................................................77
3.12. Audit Committee Report .........................................................................................................................................78
4. PART D: HUMAN RESOURCE MANAGEMENT ................................................................................................. 81
4.1. Introduction .............................................................................................................................................................83
4.2. Legislation that Govern HR Management ...............................................................................................................83
4.3. Human Resources Oversight Statistics ..................................................................................................................864.3.1 Expenditure .................................................................................................................................................864.3.2 Employment and vacancies ........................................................................................................................884.3.3 Filling of SMS Posts....................................................................................................................................904.3.4 Job evaluation ............................................................................................................................................914.3.5 Employment changes .................................................................................................................................924.3.6 Employment equity .....................................................................................................................................964.3.7 Signing of Performance Agreements by SMS Members ............................................................................994.3.8 Performance Rewards ..............................................................................................................................1004.3.9 Foreign workers ........................................................................................................................................1024.3.10 Leave utilisation for the period 1 January 2018 to 31 December 2018 ....................................................1024.3.11 AIDS & health promotion programmes .....................................................................................................1044.3.12 Labour relations ........................................................................................................................................1054.3.13 Skills development ....................................................................................................................................1064.3.14 Injury on duty ............................................................................................................................................1084.3.15 Utilisation of consultants ..........................................................................................................................108
5. PART E: FINANCIAL INFORMATION .............................................................................................................. 109
5.1. Report of the auditor-general to the Eastern Cape Provincial Legislature on vote no. 12: Eastern Cape Provincial Treasury .........................................................................................................................111
5.2. Annual Financial Statements (for the year ended 31 March 2019) .......................................................................1165.2.1. Appropriation Statement ..........................................................................................................................1165.2.2. Notes to the Appropriation Statement ......................................................................................................1305.2.3. Statement of Financial Performance ........................................................................................................1345.2.4. Statement of Financial Position ................................................................................................................1355.2.5. Statement of Changes in Net Assets ........................................................................................................1365.2.6. Cash Flow Statement ...............................................................................................................................1375.2.7. Accounting Policies ..................................................................................................................................1385.2.8. Notes to the Annual Financial Statements ...............................................................................................1435.2.9. Unaudited Annexures to the Annual Financial Statements ......................................................................164

5
EASTERN CAPEPROVINCIAL TREASURY
2018/19
ANNUAL REPORTVOTE 12
PART A: GENERAL INFORMATION

6 ANNUAL REPORT FOR 2018/19 FINANCIAL YEAR - VOTE 12: EASTERN CAPE PROVINCIAL TREASURY

ANNUAL REPORT FOR 2018/19 FINANCIAL YEAR - VOTE 12: EASTERN CAPE PROVINCIAL TREASURY 7
1.1. DEPARTMENT’S GENERAL INFORMATIONEASTERN CAPE PROVINCIAL TREASURY
DEPARTMENTAL DETAILS PHYSICAL ADDRESS:
Tyamzashe BuildingPhalo AvenueBhisho5605
POSTAL ADDRESS:
Eastern Cape Provincial TreasuryPrivate Bag X0029Bhisho5605
Ms Nomawethu Skoti-MawongaTel: (040) 101 0157Fax: (040) 101 0725Email: [email protected]

ANNUAL REPORT FOR 2018/19 FINANCIAL YEAR - VOTE 12: EASTERN CAPE PROVINCIAL TREASURY8
1.2. LIST OF ABBREVIATIONS
AC Audit Committee MCS Modified Cash Standards
ACCF Audit Committee Chairpersons Forum MEC Member of the Executive Council
AFS Annual Financial Statements MFMA Municipal Finance Management Act
AGSA Auditor General MPAT Management Performance Assessment Tool
AO Accounting Officer MTBPS Medium Term Budget Policy Statement
APP Annual Performance Plan MTEC Medium Term Expenditure Committee
BAS Basic Accounting System MTEF Medium Term Expenditure Framework
BPM Business Process Mapping MTSF Medium Term Strategic Framework
CAE Chief Audit Executive MSCOA Municipal Standard Chart of Accounts
CBC Cabinet Budget Committee MuniMECMunicipalities and Member of the Executive Council
CD Chief Director NDP National Development Plan
CFO Chief Financial Officer NHI National Health Insurance
CoE Compensation of Employees NTR National Treasury Regulations
COGTA Cooperative Governance and Traditional Affairs OHSA Occupational Health and Safety Act
CRO Chief Risk Officer OD Organisational Development
CSD Central Supplier Database OHSA Occupational Health and Safety Act
DEDEATDepartment of Economic Development, Environ-mental Affairs and Tourism
OTP Office of The Premier
DFI Development Finance Institute PAIP Provincial Audit Improvement Plan
DoE Department of Education PCMT Provincial Coordinating Monitoring Team
DoH Department of Health PDP Provincial Development Plan
DoRA Division of Revenue Act PERSAL Personnel and Salary System
DPSA Department of Public Service and Administration PFMA Public Finance Management Act
DRDARDepartment of Rural Development and Agrarian Reform
PIAS Provincial Internal Audit Services
DPW Department of Public Works PISF Provincial Infrastructure Strategic Framework
ECPT Eastern Cape Provincial Treasury PMG Paymaster General
ECPGDSCEastern Cape Provincial Government Debt Steer-ing Committee
PMDSPerformance Management and Development System
EWMP Employee Wellness Management Policy PPP Public Private Partnership
EXCO Executive Council PRF Provincial Revenue Fund
FASSETFinance and Accounting Services Sector Educa-tion and Training Authority.
PSETAPublic Service Sector Education and Training Authority
FFC Finance and Fiscal Commission PSC Project Steering Committee
FIS Financial Information System PSLVDCProvincial State Land Vetting and Disposal Com-mittee
FM Financial Management QAR Quality Assurance reviews
FMCMM Financial management capability maturity model RMC Risk Management Committee

ANNUAL REPORT FOR 2018/19 FINANCIAL YEAR - VOTE 12: EASTERN CAPE PROVINCIAL TREASURY 9
GAAP Generally Accepted Accounting Practice SA South Africa
GRAP Generally Recognised Accounting Practice SAPS South African Police Service
HDI Historically Disadvantaged Individuals SABC South African Broadcasting Corporation
HoD Head of Department SALGA South African Local Government Association
HR Human Resource SANRAL South African National Road Agency Limited
HRD Human Resource Development SAQA South African Qualifications Authority
HRIP Human Resource Improvement Plan SEZ Specialised Economic Zone
HRM Human Resource Management SCM Supply Chain Management
IA Internal Audit SCMO Supply Chain Management Office
IAA Internal Audit Activity SCOA Standard Chart of Accounts
IBAC Interim Bid Advisory Committee SCOPA Select Committee on Public Accounts
ICT Information and Communications Technology SDIP Service Delivery Improvement Plan
IDMS Infrastructure Delivery Management System SIPDMStandard for Infrastructure Procurement and Delivery Management
IIASA Institute of Internal Auditors of South Africa SHERQ Safety, Health, Environment, Risk and Quality
IFMS Integrated Financial Management Systems SMS Senior Management Service
IKM Innovations and Knowledge Management SMMEs Small, Medium and Micro-Enterprises
IPPF International Professional Practices Framework SPU Special programmes Unit
IT Information Technology ToR Terms of Reference
LED Local Economic Development SOP Standard Operating Procedures
LEDPFLocal Economic Development Procurement Framework
SDM Service Delivery Model
LOGIS Logistical Information System UAMP User Asset Management Plan
KRAs Key Result Areas
ANNUAL REPORT FOR 2018/19 FINANCIAL YEAR - VOTE 12: EASTERN CAPE PROVINCIAL TREASURY10
1.3. FOREWORD BY THE MEC In the year under review, the Provincial Treasury continued to adhere unwaveringly to its mandate of ensuring sustainable management of fi nancial resources in order to improve the quality of life in the province. The service delivery environment in which Provincial Treasury operated continued to be plagued by challenges emanating from a slow global and national economic growth, which resulted in high unemployment rates and a constrained fi scal situation.
We seized the moment of positivity that prevailed which could lead to more investments and job creation in the province through, amongst others, infrastructure delivery. Whilst supporting departments and municipalities to enhance fi nancial management and economic development, we put in place stringent measures that expedited infrastructure spending.
We implemented the fi scal consolidation policy with a particular focus on cost containment measures, management of the wage bill and enhancing own revenue generation. We intensifi ed efforts to curb expenditure on non-core items to ensure that departments carry service delivery commitments to the fullest. Provincial Treasury continued to play an active role in the centralisation of authorisation of appointments on PERSAL through our participation in the Provincial Coordinating Monitoring Team (PCMT) whose mandate is to optimise the utilisation of human capital and promote fi scal discipline in the province. As part of the Revenue Enhancement initiatives, we supported departments to intensify revenue collection on identifi ed sources, which has resulted in exceeding projected targets.
Through the implementation of the Local Economic Development Procurement Framework (LEDPF), we have managed to retain more than half of our goods and services budget within the province to benefi t local SMMEs. We further identifi ed commodities that are manufactured in the province to build local economy and create jobs. We continued to engage departments to facilitate payment of creditors on time to ensure that SMME cash fl ows and fi nancial sustainability is improved.
Improving fi nancial management in our municipalities remained a key priority in the year under review. Provincial Treasury engaged provincial departments that owe municipalities for services rendered to help improve their cash fl ows and enable them to pay their creditors, especially payments to ESKOM and other major creditors. Improvement of municipal fi nancial performance and governance towards effective and effi cient use of public resources was heightened by providing support to all municipalities. We implemented the municipal Standard Charts of Accounts (mSCoA) in all municipalities and ensured that proper reporting is in place. As part of support on mSCOA implementation, we facilitated engagements between municipalities and Financial System Vendors to address a number of system challenges.
We continued to monitor the implementation of the Provincial Audit Improvement Plan (PAIP) throughout the year under review. Coupled with the implementation of the Financial Management Accountability Model, audit improvements were noticed in departments and public entities. We have continued to support municipalities by strengthening governance structures including participation in their audit committees and assessment of the effectiveness of their internal audits and risk management functions.
The Department put more effort in the capacitation of its staff through various skills development programmes. The automation of our business processes has also contributed to good management practises and effi cient service delivery. I thank the Head of Department, Mr Daluhlanga Majeke, and the Provincial Treasury staff for their support and hard work.
HON MEC HONORABLE MLUNGISI MVOKO

ANNUAL REPORT FOR 2018/19 FINANCIAL YEAR - VOTE 12: EASTERN CAPE PROVINCIAL TREASURY 11
I, Mlungisi Mvoko, MEC for Finance, in terms of the requirements of Section 65(1)(a) of the Public Finance Management Act and Chapter 1 of the Public Service Regulations, do hereby table the Annual Report for the 2018/19 fi nancial year.
HONORABLE MLUNGISI MVOKOMEC FOR FINANCE30 August 2019

ANNUAL REPORT FOR 2018/19 FINANCIAL YEAR - VOTE 12: EASTERN CAPE PROVINCIAL TREASURY12
1.4. REPORT OF THE ACCOUNTING OFFICERThis report presents progress on the implementation of the department’s strategic objectives in the 2018/19 financial year as outlined in the Annual Performance Plan. This performance information further helps to identify areas of improvement that could be addressed with a view to realising organisational outcomes.
Notwithstanding the economic challenges the country experienced in the 2018/19 financial year, the Eastern Cape Provincial Treasury has steadfastly carried out its mandate of ensuring proper allocation, management and utilisation of financial resources in an efficient and sustainable manner in line with the National Development Plan (NDP) and the Provincial Development Plan. Plans are being implemented within a constrained fiscal environment and low potential growth that requires the department to continue to institute measures that promote fiscal discipline. Areas that would have a maximum impact in improving the lives of the people and foster economic growth in the province were prioritised.
The department cumulatively achieved 121 or 96% of the planned 126 Annual Performance Plan (APP) targets as at 31 March 2019. During the same period, Provincial Treasury (PT) spent R440.995 million (95.3%) against the projected expenditure of R462.690 million.
The current sluggish economic performance and low economic growth forecasts for the country requires the department to continue implementing cost containment measures and monitoring them closely. Various measures have been put in place to curb the unsustainable rise in personnel costs in the province which include the centralisation of authorisation of appointments on PERSAL and participating in the Provincial Coordinating Monitoring Team (PCMT) to optimise the utilisation of human capital. Efforts to reduce personnel spending are done being cognisant of not compromising the services delivered.
Challenges due to muted economic growth and declining government revenues necessitated efforts to explore ways of enhancing and increasing provincial revenue despite the current tight fiscal environment. A final research report on the newly identified sources of revenue was approved and processes are underway to facilitate the implementation of the proposed revenue strategies that will help build a fiscal buffer. The province collected an aggregated amount of R1.961 billion and thus recorded an over collection of R547.079 million.
The rationalisation of provincial public entities is underway including the framework for Board appointments and remuneration with the intention to strengthen and improve financial management and governance in these entities in order to maximise economic benefits in the province.
PT has committed itself to the implementation of LED Procurement Framework and support to provincial departments to promote local content and procurement opportunities for local suppliers. Consideration is given to women, persons with disabilities and youth in departmental procurement spend. PT procured goods and services from local suppliers for R33. 7 million for the entire financial year. About 16% of females comprising 0.2% female youth benefitted from procurement. Of the total amount of R4 .6 billion spent on procurement in the province, R2. 5 billion (55%) was spent on Eastern Cape based suppliers, whilst suppliers were also assisted to register on the Central Supplier Database (CSD) and obtain a LOGIS number to enable them to do business with government. Ongoing engagements with departments to facilitate payment of creditors within a 30-day period is continuing to ensure that SMMEs cash flows and financial sustainability is improved. On average, PT took 8 days to pay suppliers during the period under review.
PT continues to implement the Infrastructure Development Management System (IDMS) and the Provincial Infrastructure Development Framework (PIDF). Ongoing support is being provided to departments to
MR. D MAJEKEACCOUNTING OFFICER

ANNUAL REPORT FOR 2018/19 FINANCIAL YEAR - VOTE 12: EASTERN CAPE PROVINCIAL TREASURY 13
implement the Standard for Infrastructure Procurement and Delivery Management (SIPDM). Significant progress was made on the implementation of social infrastructure projects, resulting in improvements in road infrastructure and electrification of selected municipal areas, amid various project implementation challenges.
PT continued to implement the Financial Management Accountability Model to ensure good governance and accountability in the departments. To improve audit outcomes in the province, PT is continuing to co-ordinate audit improvement strategies through the implementation and monitoring of the Provincial Audit Intervention Plan (PAIP). Coupled with audit improvement strategies, the department continued with financial management support to provincial departments and municipalities (including mSCOA implementation in municipalities).
In order to improve policy, programme and project performance, PT has embarked on the evaluation of projects to assess their impact, value for money and sustainability. An evaluation report on the impact of PT’s intervention in the provincial Department of Health has been finalised. The report’s recommendations will inform PT’s support and intervention strategies to ensure better impact in the future.
The department is focusing on continuous improvement of the governance and management of ICT, particularly its alignment to the departmental strategy. Following successful development and implementation of an electronic leave management, the department has embarked on the development of an electronic submission system, which is currently being piloted, whilst the e-PMDS project is in its final stage of development. These in-house developed systems, enable the department to reach operational excellence through automation.
Customer care forms the basis of the department’s strategy to ensure that services are delivered to our clients in accordance with Batho Pele principles. All customer complaints logged through the Presidential Hotline were resolved.
The department’s vacancy rate was 3.9% as at 31 March 2019, whilst the average days to fill posts stood at 108 days. Achieving equity targets remains one of the key priorities of the department’s employment equity strategy. The gender profile of the department stands at 60% female and 40% male. Females at SMS level are at 46%. Males at SMS level are at 54%, whilst people with disabilities constitute 2% of the total staff establishment as per DPSA requirements.
The Provincial Treasury’s overall annual performance shows positive progress towards the attainment of departmental annual performance objectives.
Table 1.4.1: Departmental Receipts
Departmental receipts
2018/2019 2017/2018
EstimateActual Amount Collected
(Over)/ Under Collection
EstimateActual Amount Collected
(Over)/ Under Collection
R’000 R’000 R’000 R’000 R’000 R’000
Sales of goods and services other than capital assets
222 204 18 210 191 19
Interest, dividends and rent on land
101 848 767 849 (666 001) 96 265 755 355 (659 090)
Transactions in financial assets and liabilities
748 57 691 707 291 416
Total 102 818 768 110 (665 292) 97 182 755 837 (658 655)
The total departmental receipts as indicated in the table above amounted to R768.110 million for 2018/19 financial year against a budget of R102.818 million. An amount of R767.849 million was from interest earned on investments made from the Provincial Revenue Fund.
ANNUAL REPORT FOR 2018/19 FINANCIAL YEAR - VOTE 12: EASTERN CAPE PROVINCIAL TREASURY14
The other source of revenue is the amount collected from commission on insurance deductions and garnishee orders from employees of the department.
Financial transactions in assets and liabilities are recoveries from previous financial years and they vary from year to year.
Bad debts written off
The amount of bad debts written off for 2018/19 financial year is R77, 269.59. The write-off pertains to long outstanding ex-employee debts that were irrecoverable.
Interest, dividends and rent on land
The department received higher interest than projected. The major driver is the interest earned through the Provincial Revenue Fund.
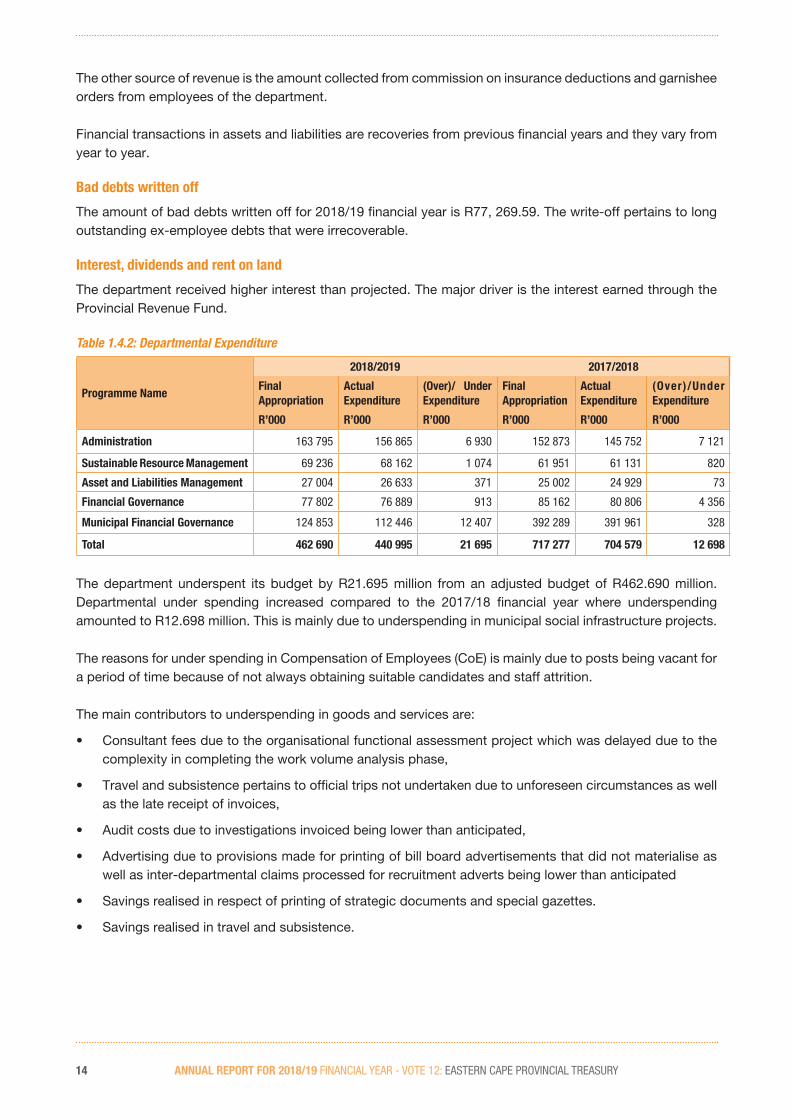
Table 1.4.2: Departmental Expenditure
Programme Name
2018/2019 2017/2018
FinalAppropriation
Actual Expenditure
(Over)/ Under Expenditure
FinalAppropriation
Actual Expenditure
(Over)/Under Expenditure
R’000 R’000 R’000 R’000 R’000 R’000
Administration 163 795 156 865 6 930 152 873 145 752 7 121
Sustainable Resource Management 69 236 68 162 1 074 61 951 61 131 820
Asset and Liabilities Management 27 004 26 633 371 25 002 24 929 73
Financial Governance 77 802 76 889 913 85 162 80 806 4 356
Municipal Financial Governance 124 853 112 446 12 407 392 289 391 961 328
Total 462 690 440 995 21 695 717 277 704 579 12 698
The department underspent its budget by R21.695 million from an adjusted budget of R462.690 million. Departmental under spending increased compared to the 2017/18 financial year where underspending amounted to R12.698 million. This is mainly due to underspending in municipal social infrastructure projects.
The reasons for under spending in Compensation of Employees (CoE) is mainly due to posts being vacant for a period of time because of not always obtaining suitable candidates and staff attrition.
The main contributors to underspending in goods and services are:
• Consultant fees due to the organisational functional assessment project which was delayed due to the complexity in completing the work volume analysis phase,
• Travel and subsistence pertains to official trips not undertaken due to unforeseen circumstances as well as the late receipt of invoices,
• Audit costs due to investigations invoiced being lower than anticipated,
• Advertising due to provisions made for printing of bill board advertisements that did not materialise as well as inter-departmental claims processed for recruitment adverts being lower than anticipated
• Savings realised in respect of printing of strategic documents and special gazettes.
• Savings realised in travel and subsistence.

ANNUAL REPORT FOR 2018/19 FINANCIAL YEAR - VOTE 12: EASTERN CAPE PROVINCIAL TREASURY 15
Under spending in transfers and subsidies pertains to the King Sabatha Dalindyebo (KSD) Electrification project due to non-performance by the contractor who experienced cash flow challenges as well as ongoing municipal strike which prevented the contractor in continuing with the work on site, Ntabankulu Access Roads project due to discrepancies on the payment certificate (retention amount and surety not deducted) as well as skills development levies being lower than anticipated.
Under spending in payment for capital assets pertains to delays in the testing of the recently installed computer server infrastructure due to electricity outages, late delivery of laptop computers by the service provider due to discontinuation by the original equipment manufacturer and challenges experienced with the computer system vulnerability software specification.
The department has written off an amount of R77, 269.59 in respect of long outstanding ex-employee debts that were irrecoverable.
Virements
The department recorded a virement of R25 000 from Programme 1 to Programme 3 to off-set over expenditure on CoE emanating from performance incentives paid being higher than anticipated.
Roll overs
The department applied for a rollover amounting to R13.298 million in 2018/19 for 2019/20 financial year. This is in respect of social municipal infrastructure transfers, computer server infrastructure as well consultancy fees for organisational development projects.
Unauthorised, fruitless and wasteful expenditure
The department has no unauthorised expenditure for the year under review.
The department incurred R5 000 due to late cancellation of accommodation and air ticket as well as non-collection of a hired vehicle. All cases of fruitless, wasteful and irregular expenditure identified are referred to the Internal Control Unit for further investigation. Once fully investigated, recommendations are made to the Accounting Officer for final consideration. An amount of R1 000 was transferred to receivables for recovery.
There was no irregular expenditure recorded in the current year.
Public Private Partnerships (PPP)
The department does not have any public private partnerships under its control, but has oversight responsibility over departments with PPP operations mainly the Department of Public Works.
Discontinued activities
There were no activities that were discontinued for the year under review.
New or proposed activities
The Provincial Treasury’s Annual Performance Plan gives the details of all projects that the department will be engaged in during 2019/20 financial year.
Supply Chain Management
The department did not receive or conclude any unsolicited bid proposals during the year under review. Procedures and controls were fully implemented and monitored to prevent irregular expenditure and ensure compliance with the Supply Chain Management (SCM) prescripts. Furthermore, in cases where it is impractical to follow normal procurement process, deviations were approved by the Accounting Officer in terms of the National Treasury guidelines and prescripts.

ANNUAL REPORT FOR 2018/19 FINANCIAL YEAR - VOTE 12: EASTERN CAPE PROVINCIAL TREASURY16
Contract management is being effectively implemented and strengthened to ensure that suppliers/service providers fulfi l their deliverables and non-performance is curbed.
Gifts and Donations received in kind from non-related parties
Gifts and donations are disclosed in the annexures of the Annual Financial Statements (AFS).
Exemptions and deviations received from the National Treasury
There were no exemptions or deviations requested or received from National Treasury during the 2018/19 fi nancial year.
Events after the reporting date
There were no events that took place after the reporting date of 31 March 2019 that would have an impact on the fi nancial statements of the department.
Conclusion
In the new fi nancial year 2019/20, the Provincial Treasury will continue to strengthen its organisational performance and ensure that employees are better equipped with appropriate skills to achieve departmental goals.
Acknowledgement and Appreciation
I wish to thank the MEC for his stewardship, and all my staff members for their hard work and dedication during the 2018/19 fi nancial year. I would also like to encourage all staff to continue doing the same in 2019/20 fi nancial year in an endeavour to serve our province with pride.
D MAJEKEACCOUNTING OFFICER30 August 2019

ANNUAL REPORT FOR 2018/19 FINANCIAL YEAR - VOTE 12: EASTERN CAPE PROVINCIAL TREASURY 17
1.5. STATEMENT OF RESPONSIBILITY AND CONFIRMATION OF ACCURACY FOR THE ANNUAL REPORT To the best of my knowledge and belief, I confi rm the following:
All information and amounts disclosed throughout the annual report are consistent.
The annual report is complete, accurate and is free from any omissions.
The annual report has been prepared in accordance with the guidelines on the annual report as issued by National Treasury.
The Annual Financial Statements (Part E) have been prepared in accordance with the Modifi ed Cash Standard and the relevant frameworks and guidelines issued by the National Treasury.
The Accounting Offi cer is responsible for the preparation of the annual fi nancial statements and for the judgements made in this information.
The Accounting Offi cer is responsible for establishing, and implementing a system of internal control that has been designed to provide reasonable assurance as to the integrity and reliability of the performance information, the human resources information and the annual fi nancial statements.
The external auditors are engaged to express an independent opinion on the annual fi nancial statements.
In my opinion, the annual report fairly refl ects the operations, the performance information, the human resources information and the fi nancial affairs of the department for the fi nancial year ended 31 March 2019.
Yours faithfully
D MAJEKEACCOUNTING OFFICER30 August 2019
ANNUAL REPORT FOR 2018/19 FINANCIAL YEAR - VOTE 12: EASTERN CAPE PROVINCIAL TREASURY18
1.6. STRATEGIC OVERVIEW1.6.1. Vision
A prosperous province supported by sound financial and resource management.
1.6.2. Mission
Our mission is to provide strategic and technical leadership in the allocation, management and utilisation of financial resources in order to improve the quality of life in the province.
1.6.3. ValuesWe strive for EXCELLENCE through:
• Dedication - We are 100% committed to our work;
• Integrity - We steadfastly adhere to high professional standards; and
• Accountability - We take full responsibility for our actions and our work.
Strategic outcome oriented goals
• Effective and efficient sustainable management of fiscal resources.
• Sound financial reporting, accountability and governance.
• Well-functioning department.
1.7. LEGISLATIVE AND OTHER MANDATEThe department derives its existence from Sections 213, 215, 216, 217, 218 and 219 of the Constitution of the Republic of South Africa (Act 108 of 1996), Sections 17 and 18 of the Public Finance Management Act (PFMA), 1999 as amended, Municipal Finance Management Act (MFMA) of 2003 and National Treasury Regulations, which provide for the establishment of Provincial Treasuries that are mandated to fulfil the following functions:
• Prepare the provincial budget;
• Exercise control over the implementation of the provincial budget;
• Promote and enforce transparency and effective management in respect of revenue, expenditure, assets and liabilities of provincial departments and provincial public entities;
• Ensure that its fiscal policies do not materially and unreasonably prejudice national economic policies.
• Issue ECPT instructions not inconsistent with the PFMA;
• Enforce the PFMA, MFMA and any prescribed national and provincial norms and standards, including any prescribed standards of generally recognised accounting practice and uniform classification systems, in provincial departments;
• Comply with the annual Division of Revenue Act and monitor and assess the implementation of that Act in provincial public entities;
• Monitor and assess the implementation in provincial public entities of national and provincial norms and standards;
• May assist provincial departments and provincial public entities in building their capacity for efficient, effective and transparent financial management;
• May investigate any system of financial management and internal control applied by a provincial department or a provincial public entity;

ANNUAL REPORT FOR 2018/19 FINANCIAL YEAR - VOTE 12: EASTERN CAPE PROVINCIAL TREASURY 19
• Intervene by taking appropriate steps, which may include the withholding of funds, to address a serious or persistent material breach of this PFMA by a provincial department or a provincial public entity;
• Promptly provide any information required by the National Treasury in terms of the PFMA; and
• May do anything further that is necessary to fulfil its responsibilities effectively.
Additional functions and activities of the department are derived from the following (the list is not exhaustive):
• Preferential Procurement Policy Framework Act;
• Appropriation Act;
• Intergovernmental Fiscal Relations Act;
• Public Service Act and Regulations;
• Medium Term Budget Policy Statement;
• Report of the Auditor General on the Accounts of the Government;
• Budget Review;
• Recommendations of the FFC; and
• Supply Chain Management Framework.
During the 2018/19 financial year, the MEC for Finance tabled the following Bills in the Eastern Cape Provincial Legislature:
• Adjustment Appropriation Bill on 22 November 2018 for the 2018/19 financial year.
• Eastern Cape Appropriation Bill on 07 March 2018 for 2018/19 MTEF.
• Second Adjustments Appropriation Bill, 12 March 2019.
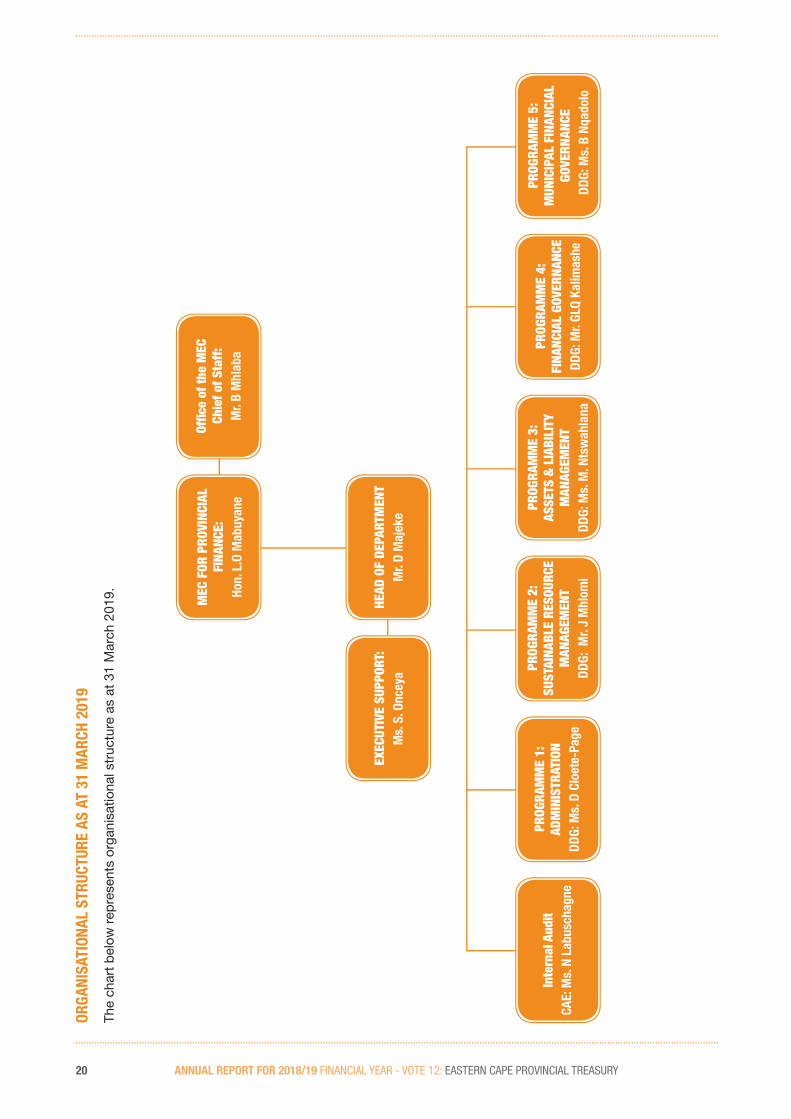
1.8. ORGANISATIONAL STRUCTUREThe following diagram provides a high-level organisational structure of the department starting with the Executive Authority to the level of the officials reporting directly to the Accounting Officer and the programmes that these officials are responsible for.
ANNUAL REPORT FOR 2018/19 FINANCIAL YEAR - VOTE 12: EASTERN CAPE PROVINCIAL TREASURY20
ORGA
NISA
TION
AL S
TRUC
TURE
AS
AT 3
1 M
ARCH
201
9
The
char
t b
elow
rep
rese
nts
orga
nisa
tiona
l str
uctu
re a
s at
31
Mar
ch 2
019.
Offi c
e of
the
MEC
Chie
f of S
taff
: M
r. B
Mhl
aba
EXEC
UTIV
E SU
PPOR
T:M
s. S
. Onc
eya
HEAD
OF
DEPA
RTM
ENT
Mr.
D M
ajek
e
Inte
rnal
Aud
itCA
E: M
s. N
Lab
usch
agne
PROG
RAM
ME
1:
ADM
INIS
TRAT
ION
DDG:
Ms.
D C
loet
e-Pa
ge
PROG
RAM
ME
2:
SUST
AINA
BLE
RESO
URCE
M
ANAG
EMEN
TDD
G: M
r. J
Mhl
omi
PROG
RAM
ME
3:
ASSE
TS &
LIA
BILI
TYM
ANAG
EMEN
TDD
G: M
s. M
. Nts
wah
lana
PROG
RAM
ME
4:
FINA
NCIA
L GO
VERN
ANCE
DDG:
Mr.
GLQ
Kalim
ashe
PROG
RAM
ME
5:
MUN
ICIP
AL F
INAN
CIAL
GO
VERN
ANCE
D
DG: M
s. B
Nqa
dolo
MEC
FOR
PRO
VINC
IAL
FINA
NCE:
Ho
n. L
.O M
abuy
ane

21
EASTERN CAPEPROVINCIAL TREASURY
2018/19
ANNUAL REPORTVOTE 12
PART B: PERFORMANCE
INFORMATION

22 ANNUAL REPORT FOR 2018/19 FINANCIAL YEAR - VOTE 12: EASTERN CAPE PROVINCIAL TREASURY

ANNUAL REPORT FOR 2018/19 FINANCIAL YEAR - VOTE 12: EASTERN CAPE PROVINCIAL TREASURY 23
2.1. AUDITOR-GENERAL’S REPORT: PREDETERMINED OBJECTIVESReport on the audit of the annual performance report
1. In accordance with the Public Audit Act of South Africa, 2004 (Act No. 25 of 2004) (PAA) and the general notice issued in terms thereof, I have a responsibility to report material findings on the reported performance information against predetermined objectives for selected programmes presented in the annual performance report. I performed procedures to identify findings but not to gather evidence to express assurance.
2. My procedures address the reported performance information, which must be based on the approved performance planning documents of the department. I have not evaluated the completeness and appropriateness of the performance indicators included in the planning documents. My procedures also did not extend to any disclosures or assertions relating to planned performance strategies and Information in respect of future periods that may be included as part of the reported performance information. Accordingly, my findings do not extend to these matters.
3. I evaluated the usefulness and reliability of the reported performance information in accordance with the criteria developed from the performance management and reporting framework, as defined In the general notice, for the following selected programmes presented In the annual performance report of the department for the year ended 31 March 2019:
ProgrammesPage In the annual performance report
Programme 2 - Sustainable Resource Management 39 - 46
Programme 3 - Asset and Liability Management 47 - 51
Programme 4 - Financial Governance 52 - 58
Programme 5 - Municipal Financial Governance 59 - 65
4. I performed procedures to determine whether the reported performance information was properly presented and whether performance was consistent with the approved performance planning documents. I performed further procedures to determine whether the Indicators and related targets were measurable and relevant, and assessed the reliability of the reported performance information to determine whether it was valid, accurate and complete.
5. I did not raise any material findings on the usefulness and reliability of the reported performance information for the selected programmes.
Other matter
6. I draw attention to the matter below.
Achievement of planned targets
7. Refer to the annual performance report on pages 40 to 69 for information on the achievement of planned targets for the year and explanations provided for the under and over achievement of a significant number of targets.
ANNUAL REPORT FOR 2018/19 FINANCIAL YEAR - VOTE 12: EASTERN CAPE PROVINCIAL TREASURY24
Report on audit of compliance with legislation Introduction and scope
8. In accordance with the PAA and the general notice issued in terms thereof, I have a responsibility to report material findings on the compliance of the department with specific matters in key legislation. I performed procedures to identify findings but not to gather evidence to express assurance.
9. I did not raise material findings on compliance with the specific matters in key legislation set out in the general notice issued in terms of the PAA.
Other information
10. The accounting officer is responsible for the other information. The other information comprises the Information included in the annual report, which includes the audit committee’s report. The other information does not include the financial statements, the auditor’s report and those selected programmes presented in the annual performance report that have been specifically reported in this auditor’s report.
11. My opinion on the financial statements and findings on the reported performance Information and compliance with legislation do not cover the other information and I do not express an audit opinion or any form of assurance conclusion thereon.
12. In connection with my audit, my responsibilities to read the other information and, in doing so, consider whether the other information is materially inconsistent with the financial statements and the selected programmes presented In the annual performance report, or my knowledge obtained in the audit, or otherwise appears to be materially misstated. If, based on the work I performed, I conclude that there is a material misstatement in this other information, I am required to report that fact. I have nothing to report in this regard.
Internal control deficiencies
13. I considered internal control relevant to my audit of the financial statements, reported performance information and compliance with applicable legislation; however, my objective was not to express any form of assurance on it. I did not identify any significant deficiencies in internal control.
East London 31 July 2019

ANNUAL REPORT FOR 2018/19 FINANCIAL YEAR - VOTE 12: EASTERN CAPE PROVINCIAL TREASURY 25
2.2. OVERVIEW OF DEPARTMENTAL PERFORMANCE2.2.1. Service delivery environment
Economic growth in the province continues to remain weak due to a combination of factors both cyclical and structural. Cyclical weak domestic and global demand has constrained output growth in key sectors, especially provincial manufacturing. Long-term growth trends have also remained historically low owing to backlogs in fixed capital formation especially economic infrastructure, inadequate skilling and investment in human capital.
Eastern Cape Provincial Treasury has, despite the economic challenges facing the country, consistently implemented its mandate of ensuring proper allocation, management and utilisation of financial resources in an efficient and sustainable manner through prioritisation of areas that will have a maximum impact on the lives of the people and growth of the economy. This mandate has been carried out in line with the National Development Plan (NDP) and the Provincial Development Plan which are the guiding plans to create a South Africa that is free of poverty, unemployment and inequality.
During the period under review, various measures have been put in place to curb the unsustainable rise in personnel costs in the province that include the centralisation of authorisation of appointments on PERSAL and participating in the Provincial Coordinating Monitoring Team (PCMT) to optimise the utilisation of human capital and promote fiscal discipline in the province. All requests for authorisation of appointments on PERSAL received from departments were processed timeously.
Eastern Cape Provincial Treasury continues to support the departments to implement the Provincial Own Revenue Strategy. Measures to explore ways of enhancing and increasing provincial revenue are being implemented. The province collected an amount R1.961 billion and thus recorded an over collection of R547.079 million.
Thirteen departments were supported during the period under review towards the implementation of measures to ensure provincial cash liquidity. The Provincial Revenue Fund remains liquid and all PMG accounts adequately funded with no idle cash in the PMG accounts besides the buffer. The department managed to conduct Creditor Management Forums that deal with the issue of non-payment to service providers by provincial departments and to share best practices with departments to ensure the payment of creditors within 30 days as required by National Treasury Regulations (NTR) 8.2.3. On average provincial departments stood at 18 days in settling their creditors.
Provincial Treasury is continuing to work with departments to rationalise and refocus on provincial public entities to strengthen and improve financial management and governance in order to maximise economic benefits to the province. Provincial Treasury supported all infrastructure departments in the submission of DoRA Bidding requirements and as such, the reports were submitted timeously to NT. The province also had provincial moderation sessions for End of Year Evaluation report in which the DoE and the DoH scored 14 and 17 percent respectively. Both informal and formal IDMS/ SIPDM training was provided to provincial departments and municipalities. The Portfolio Committee of Finance was also supported by Provincial Treasury and undertook site visits for projects selected from the Departments of Public Works, Transport, Education, Health and Human Settlements. This over and above value for money projects site visits were done by PT during the financial year.
Working together with the Department of Public Works (DPW) and the Office of the Premier (OTP), Provincial Treasury is institutionalising the Provincial Infrastructure Strategic Framework (PISF) to maximise infrastructure delivery. To improve the infrastructure co-ordination across the province, the Standard for Infrastructure Procurement and Delivery Management (SIPDM) came into effect in 2016 and Infrastructure Departments and their Implementing Agents were trained on this standard.

ANNUAL REPORT FOR 2018/19 FINANCIAL YEAR - VOTE 12: EASTERN CAPE PROVINCIAL TREASURY26
Provincial Treasury continues to support the departments to implement the Local Economic Development Procurement Framework (LEDPF) to ensure maximum retention of provincial fiscal spend in the Province thereby expanding the productive capacity of SMMEs and Cooperatives. To date the Province has achieved 56.5% spend on goods, works and services on local suppliers since the implementation of LEDPF.
The drive to improve procurement efficiencies through transversal contracts, capacitation of suppliers on opportunities available to enable Small, Medium and Micro-Enterprises (SMMEs) to do business with government, including administrative support and registration on Central Supplier Database (CSD) and Logistical Information System (LOGIS) is continuing. The Help Desk assisted walk-in suppliers to register on the CSD and obtain a LOGIS number. More suppliers were assisted telephonically and via email. The unit facilitated the creation and/or linking of LOGIS numbers to CSD supplier numbers. SMME development with a special focus on local procurement including women, persons with disabilities and youth continued to be prioritised.
The monitoring of implementation of the Price Index was undertaken in the departments and feedback was provided where necessary. Provincial Treasury also arranged and facilitated the g-Commerce training for all Provincial departments.
The monitoring of adherence to procurement plans by Departments was undertaken and report approved by the Head of Department. Provincial Treasury further reviewed and published fifty two (52) tender bulletins containing nine hundred and sixty five (965) bid notices on the Provincial Tender Bulletin on E-tender publication portal.
Provincial Treasury supported the departments on the implementation of the Financial Management Accountability Framework (FMAF). The Framework provides a platform to assess the performance of the provincial departments based on agreed standards and make decisions on the appropriate consequences for non-adherence to the standards. The implementation of audit improvement strategies is continuing, and Provincial Treasury continues to assess the risk across all departments (and Public Entities) and deploy the necessary interventions to ensure that there is no regression. Some of these interventions include reducing the irregular expenditure balances for all departments. There are other support measures that are being implemented towards sustainable financial maturity but these are expected to show results in the medium to long term. These include capacity-building programmes, changing the culture for higher levels of discipline in managing the public resources and strengthening government to oversee the implementation of internal controls. The CFO Forum is convened to discuss and offer advice on audit issues where necessary.
Provincial Treasury ensured that financial systems are optimally implemented, utilised, and monitored and that users are supported to achieve credible financial information. Sixty-five (65) formal core financial systems courses on BAS, LOGIS and PERSAL were conducted in venues across the Province in order to strengthen the use of the financial systems. The data warehouse unit performed data analysis of the financial information systems data with emphasis on escalating overtime expenditure status of capped leave as well as targeting integrity of data on the PERSAL system. Review reports on departments’ systems compliance on BAS, PERSAL and LOGIS were developed contributing towards sound user account management on the financial systems in the province.
In supporting departments on LOGIS utilisation, the unit is in the second year of implementing a three-year strategic LOGIS rollout and support plan with list of sites per department. The emphasis on this phase is on the roll out of movable asset registers using LOGIS Asset Management Module. The unit continued managing the centralisation of the PERSAL controller functions and the BAS disbursement function for departments in the province. This has resulted in improved control and reduction in expenditure on the five PERSAL codes which include overtime, backdated salaries, performance bonus, acting allowances and promotion/translation/salary upgrading.

ANNUAL REPORT FOR 2018/19 FINANCIAL YEAR - VOTE 12: EASTERN CAPE PROVINCIAL TREASURY 27
PT continued to manage the implementation of Social Infrastructure projects through Project Steering Committees (PSC).
• Eighteen (18) of the of twenty (20) sub-projects (Water, Sewer, Electrification and Fencing) on Joe Gqabi Drought Relief Project have been completed.
• Twelve (12) of the thirteen (13) sub-projects on King Sabata Dalindyebo Electrification have been completed as at the end of November 2018. The last sub-project is at 96% completion in terms of performance.
• The Rural Access Roads Programme which consists of the reconstruction of fifty-five (55) sub-projects has been completed, including 6.847km of Ntabankulu Internal Road.
During the period under review, all the municipal draft budgets were assessed and engagements were held with municipalities across the Province. Recommendations on the assessments were communicated to municipalities for rectification, especially regarding unfunded budgets. Consolidated quarterly In-Year Monitoring (IYM) reports were compiled and submitted to Legislature in accordance with Section 71 of MFMA.
ECPT and COGTA working with national transferring departments like DOE, DWS and COGTA played an oversight role in monitoring the spending of conditional grants transferred to municipalities and serious engagements were made by the MECs of both departments with the Mayors and political leadership in the affected twenty municipalities for commitment to improve spending and value creation on the ground. During the year under review, Provincial Treasury also provided support to three municipalities that were under Section 139 of the Constitution.
1.2.2. Service Delivery Improvement Plan
In accordance with the Public Service Regulations 2016, Chapter 3, Part 3 Regulation 38, all departments are required to develop a Service Delivery Improvement Plan (SDIP) and to publish an annual statement of public service commitment which will set out the department’s service standards that citizens and customers can expect and which will serve to explain how the department will meet each of the standards. The following tables reflect the components of the SDIP as well as progress made in the implementation of the plans.
Table 2.2.1 – Main services provided and standards
Main services BeneficiariesCurrent/ Actual Standard of service
Desired Standard of service
Actual achievement against standards
Reduction of debt owed by DepartmentsTo Municipalities.
Municipalities Provincial government debt ageing over 90 days (balance as at 2016/17 Audited AFS is R1.3 billion Gross Government debtors)
25% reduction of confirmed provincialgovernment debt ageing over 90 days
The total provincial government debt which was reported by the EC municipalities amounted to about R770 million as at 28 February 2019 thus showing an increase of R330 million when compared to R440 million reported in the month of December 2018.
Suppliers are paid within 30 days.
Service Providers/ SMME’s
85% of invoices are paid within30 days.
90% of invoices are paid within 30 days
As at the end of March 2019, 77 % of invoices were paid within 30 days.

ANNUAL REPORT FOR 2018/19 FINANCIAL YEAR - VOTE 12: EASTERN CAPE PROVINCIAL TREASURY28
Table 2.2.2 – Batho Pele Arrangement with Beneficiaries (Consultation, etc.)
Current/ actual arrangements Desired Customers Actual achievements
Quarterly meetings Introduce call centres, call centre numbers be available to all citizens Creation of a dedicated email address for ECPG municipal accounts where all municipal accounts for services and rates must be sent to i.e. Maintenance of the [email protected]
The dedicated email has not yet been established due to the PT focusing mainly on ensuring that department are paying municipal debt. One on one sessions were held between departments and municipalities.
Annual Reports, pronouncements during budget speech
Avail annual reports to all citizens, distribute budget speech booklets to the public.
• In compliance with section 75 of MFMA, municipalities are required to place information on their websites.
• In compliance with section 40 of the PFMA PT tabled 2017/18 annual report which is also available on the departmental website
• PT hosted business breakfast for 2019/20 budget to enhance stakeholder involvement
Table 2.2.3 – Batho Pele Arrangement Service Delivery Access Strategy
Current Arrangement Desired Arrangement Actual achievements
ECPGDSC and District Arrear Government Debt Meeting in terms of section 44 of the MFMA,
ECPGDSC and District Arrear Government Debt Meeting in terms of section 44 of the MFMA. One on one working sessions with affected departments and municipalities.
The following engagement were held successfully as shown below:• Sarah Baartman District on 05 of June
2018;
• Chris Hani District on 07 of June 2018; and
• Alfred Nzo District on 12 of June 2018.
• Provincial Department and PT on 22 of August 2018
• Chris Hani and Joe Gqabi District on 23 of August 2018 and
• OR Tambo and Alfred Nzo District on 28 of August 2018.
• Alfred Nzo District and OR Tambo District on 26 February 2019
• Amatole District on 21 February 2019 and Sarah Baartman in February 2019.
Table 2.2.4 – Service Delivery Information Tool
Current/ Actual information tool Desired information tool Actual achievements
Newspapers Use all the local newspapers Utilized 5 local newspapers.
Radio Use of all local radio stations 14 local radio stations were utilised.
Newsletters/Pamphlets Distributed as an insert to 5 newspapers. Distributed widely to stakeholders
Plasma Screens N/A N/A
Social media N/A 2 social media networks were utilised.
Website N/A Significant number of visits to the website.
Annual Report N/A• Distributed to stakeholders• Available on website
Annual Performance Plan N/A• Distributed to stakeholders• Available on website
Service Delivery Improvement Plan N/A• Distributed to stakeholders• Available on website
Strategic Plan N/A• Distributed to stakeholders• Available on website

ANNUAL REPORT FOR 2018/19 FINANCIAL YEAR - VOTE 12: EASTERN CAPE PROVINCIAL TREASURY 29
Table 2.2.5 – Complaints mechanism
Current/ Actual Complaints Mechanism Desired Complaints Mechanism Actual achievements
There is a formal complaints and grievance handling framework in place. In line with the framework, a complaints register is in place.
Approved complaints and grievance handling framework.
100% Customer Care complaints were resolved timeously.
Those complaints that were received from other clients, (e.g. service providers or the general public) were channelled through the Customer Care Centre and resolved by relevant officials.
The complaints received are channelled through the customer centre using the unified communication system platform.
The department received fewer complaints and queries as compared to the previous reporting periods. The complaints received were related to the following issues: Deregistration on CSD, Internship/ bursary related matters; and LED related issues.
2.2.3. Organisational environment
The implementation of the organisational structure adopted in 2014 was prioritised and as a result the vacancy rate was minimised. The talent management strategy was implemented to eliminate vacancies and retain the requisite skills within the department. The department delivered management development programmes to enhance leadership skills competence targeting women at middle and senior management levels. The training and development programmes offered by the department were geared towards development capacity in order to support the department’s strategic objectives. The training needs analysis process was conducted and did not only take into account the employees’ Personal Development Plans, but also priority training interventions per Programme. These priority interventions were identified through direct engagement with line management of each of the five Programmes.
The process of reviewing the organisational structure is underway taking into consideration the outcomes of the business process mapping and service delivery model.
The Performance Management and Development System (PMDS) was implemented to ensure employees understand the links between the performance measures and successful accomplishment of strategic goals as reflected in individual employee performance plans. The department has enhanced the implementation of PMDS and the norms and standards on the administration of PMDS across the department are being implemented. These norms and standards are part of the PMDS policy.
Achieving equity targets remains one of the key priorities of the department’s employment equity strategy. The gender profile of the department stands at 60% female and 40% male. Females at SMS level are at 46%. Males at SMS level are at 54%, whilst people with disabilities constitute 2% of the total staff establishment as per DPSA requirements.
Customer care forms the basis of the department’s strategy to ensure that services are delivered to our clients in accordance with Batho Pele principles. All customer complaints logged through the Presidential Hotline were resolved.
PT will continue to provide an internal enabling environment and support service with regard to physical and information security, occupational health and safety, maintenance, environmental and space management in order for the department to pursue its strategic objectives. The department implemented the Business Continuity Plan with the aim of addressing the department’s ability to detect, prevent, minimise and where necessary deal with impact of disruptive events. A Business Continuity Programme, which focuses on protecting and recovering critical activities of the department that include ICT applications, infrastructure and hardware, is in place.
The implementation of the ICT Corporate Governance Framework enabled the department to get value from its ICT investments and further ensured that ICT projects are in line with the department’s strategy.
ANNUAL REPORT FOR 2018/19 FINANCIAL YEAR - VOTE 12: EASTERN CAPE PROVINCIAL TREASURY30
Through the implementation of ICT, the department has invested in projects and resources that are geared towards the improvement of services. This has led to the successful piloting of the e-Submission (e-Memo) and development of e-PMDS. The introduction of e-Submission assisted in the reduction of turnaround times to process requests and improved document management whilst the e-PMDS will ensure the alignment of targets to the Operational Plan. The e-Leave, Website and Intranet (share point) projects are in maintenance and support phases and continuous request and enhancements are being done.
PT facilitated the implementation of good management practices through the implementation of the Management Performance Assessment Tool (MPAT), which is an annual departmental assessment initiative to improve performance and service delivery. The MPAT measures the departmental performance focusing in four Key Result Areas (KRAs) namely: Strategic Management, Governance and Accountability, Human Resources and Financial Management. Although there are still areas that need improvement, the PT on the overall achieved an average score of 3 on standards of management practises. PT has institutionalised MPAT processes and included its activities in the annual departmental Operational Plan for implementation. Starting from 2019, the Department of Performance Monitoring and Evaluation (DPME) will no longer conduct MPAT as a compliance tool. Processes are underway to reposition the tool so that it can address capabilities of national and provincial departments to deliver on the National Development Plan.
The department continues to implement the Service Delivery Model (SDM) as a change management strategy with the aim of ensuring that the department delivers its services identified in the strategic plan in a coordinated, collaborative and integrated manner. To assist employees to understand, commit to, accept and embrace change in the current operational environment, the department has embarked on a change management programme.
In order to improve policy, programme and project performance, PT has embarked on the evaluation of projects to assess their impact, relevance, performance, value for money and sustainability. For the 2018/19 financial year, PT evaluated the impact of its intervention in the provincial Department of Health. Three projects have since been evaluated (evaluation reports are available), namely, the Municipal CFO Support Programme and the Effectiveness of Cooperative Funding in the Province, and the Impact of PT intervention in the Provincial Department of Health.
In planning and prioritising the progressive implementation of policies, programmes and longer term projects, the PT continued to invite key stakeholders to its strategic planning sessions to ensure that the services it delivers are in line with clients’ needs. PT will continue to enhance its financial management processes by ensuring that all statutory requirements are complied with in terms of the Public Financial Management Act (PFMA) and related prescripts that lead to improved spending and audit outcomes. Within this context, the department is aiming to maintain its positive audit outcomes.
2.2.4. Key policy developments and legislative changes
There have been no key policy developments nor revision to the legislative mandate of the department.

ANNUAL REPORT FOR 2018/19 FINANCIAL YEAR - VOTE 12: EASTERN CAPE PROVINCIAL TREASURY 31
2.3. STRATEGIC OUTCOME ORIENTED GOALSStrategic Goal Target to be achieved by 2020 Achievement to date
1.
Effective and efficient sustainable management of fiscal resources
By 2020 under expenditure will not exceed 2 per cent of the allocated budget as per the PFMA norm. The CoE split between core and non-core will be 60:40 of the budget.
As at 31 March 2019 99.5% of the budget has been spent, with under expenditure of 0.5% The CoE split between core and non-core to date is 64.5:35.5.
2.
Sound financial reporting, accountability and governance.
• 14 Provincial Departments with unqualified opinions by 2020
• 10 Public Entities with unqualified opinions by 2020
• 30 Municipalities with unqualified opinions by 2020
Awaiting audit outcomes
3.Well-functioning Department MPAT Level 4 for each KPA achieved by 2020. The level of achievement in management
practises standards of the department on average stood at Level 3 in MPAT 2018.
2.4 PERFORMANCE INFORMATION BY PROGRAMME The powers and functions of the ECPT are mainly determined by the Public Finance Management Act, 1999 (PFMA) and the Municipal Finance Management Act, 2003 (MFMA). All powers of the ECPT are vested in the MEC for Provincial Finance in terms of chapter 3 of the PFMA, 1999. In terms of section 20 of this Act, powers are delegated to the Head Official of the ECPT and some of his/her duly appointed senior managers. Similar provisions apply in the case of the MFMA, 2003.
In order for the department to fulfil its mandate and achieve the goals and strategic objectives as outlined in the strategic and annual performance plans, the following programmes were adopted in line with the uniform budget structures recommended by the National Treasury. The purpose and objectives of these programmes are discussed in detail in section 2 of this Annual Report.
• Programme 1: Administration
• Programme 2: Sustainable Resource Management
• Programme 3: Asset and Liabilities Management
• Programme 4: Financial Governance
• Programme 5: Municipal Financial Governance
The purpose and objectives of these programmes are discussed in detail in section 2 of this Annual Report. All services rendered by PT are rendered to other departments mainly in terms of the PFMA or to municipalities as per the MFMA, as referred to above.
ANNUAL REPORT FOR 2018/19 FINANCIAL YEAR - VOTE 12: EASTERN CAPE PROVINCIAL TREASURY32
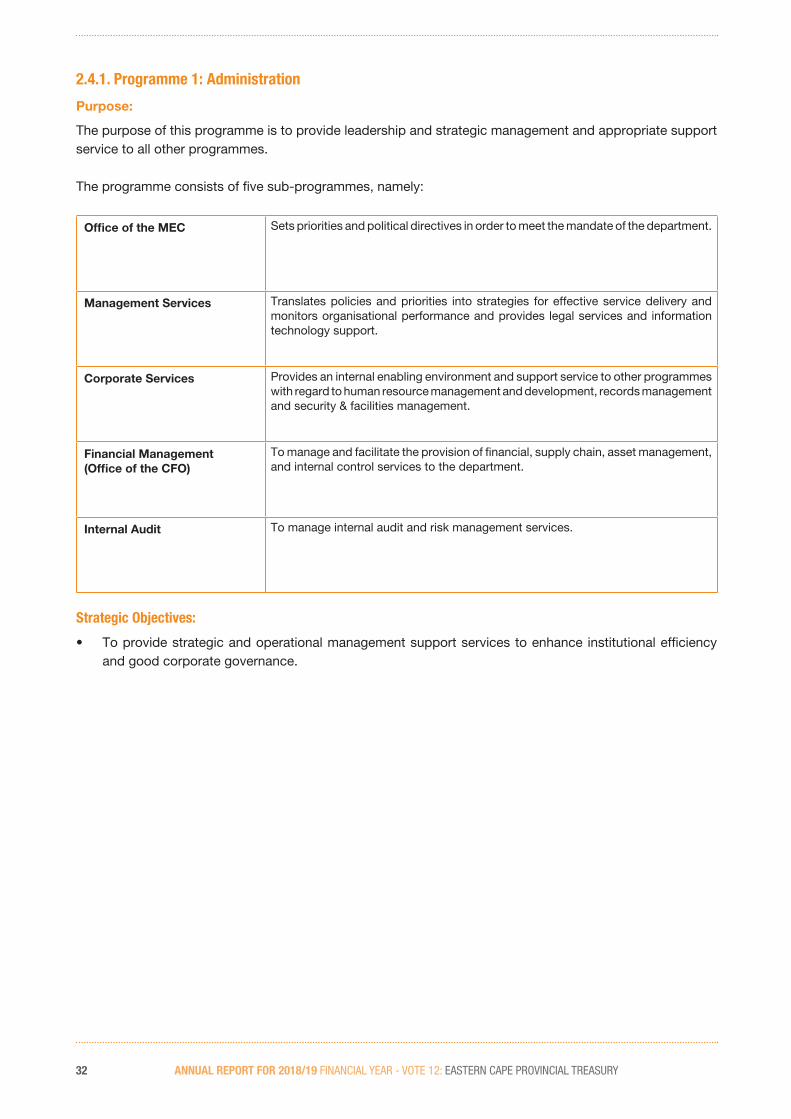
2.4.1. Programme 1: Administration
Purpose:
The purpose of this programme is to provide leadership and strategic management and appropriate support service to all other programmes.
The programme consists of five sub-programmes, namely:
Office of the MEC Sets priorities and political directives in order to meet the mandate of the department.
Management Services Translates policies and priorities into strategies for effective service delivery and monitors organisational performance and provides legal services and information technology support.
Corporate Services Provides an internal enabling environment and support service to other programmes with regard to human resource management and development, records management and security & facilities management.
Financial Management(Office of the CFO)
To manage and facilitate the provision of financial, supply chain, asset management, and internal control services to the department.
Internal Audit To manage internal audit and risk management services.
Strategic Objectives:
• To provide strategic and operational management support services to enhance institutional efficiency and good corporate governance.

ANNUAL REPORT FOR 2018/19 FINANCIAL YEAR - VOTE 12: EASTERN CAPE PROVINCIAL TREASURY 33
2.4.1.1. High level achievements
The Management Services sub programme provides strategic direction and leadership to the department and is made up of the office of the Head of Department, and the Strategy and Planning (S&P) chief directorate. The S&P chief directorate is divided into the following directorates: Strategic Management (which consists of the Integrated Planning, Monitoring and Evaluation and Policy Coordination sub-directorate, the Transformation Programmes sub-directorate, Special Programmes sub-directorate, and Communication Services sub-directorate), Information and Communications Technology (ICT), and Legal Services.
The Strategic Management directorate continued to provide strategic as well as annual performance planning, monitoring and reporting to facilitate the achievement of departmental goals and institutionalise quality service delivery. The directorate ensured the collection of performance information, information analysis and feedback to encourage performance improvement. The directorate further assisted the department to perform its statutory obligations by developing and publishing the Annual Performance Plan (APP), the Service Delivery Charter and Improvement Plan (SDIP) and programme specific operational planning. In order to assist Legislative Oversight, the unit coordinated and facilitated departmental responses and requests for information.
In order to improve policy, programme and project performance, the unit has embarked on the evaluation of projects to assess their impact, relevance, performance, value for money and sustainability. A report on the Impact Evaluation of the Provincial Treasury’s Intervention in the Eastern Cape Department of Health has been finalised and the findings and recommendations have been shared with the relevant departments.
In fulfilment of its policy co-ordination function, the departmental policies were identified on the departmental website for review and a policy co-ordination framework was developed. The framework has been approved and is currently being implemented.
The directorate facilitated the implementation of Management Performance Assessment Tool (MPAT), which is an annual departmental assessment initiative to improve performance and service delivery. The MPAT measures departmental performance focusing in four Key Result Areas (KRAs) namely: Strategic Management, Governance and Accountability, Human Resources and Financial Management. During the period under review, the unit ensured that the level of achievement in management practises standards is retained at a level slightly above three which shows that the department is fully compliant with legal/regulatory requirements. This can be attributed to enhanced support provided to Programmes and constant monitoring of the MPAT improvement plan by the unit.
As part of the departmental communication strategy, the directorate continued to promote public awareness about the functions of the department as well as enhancing its image and encouraging good stakeholder relations through vigorous internal and external communication. Ongoing brand positioning and profiling of the Department was maintained through successful management of campaigns, programmes and events that include, amongst others, the preparation and publication of the 2018/19 provincial budget.
During the current reporting period, SPU collaborated with the Transformation Unit in conducting Batho Pele (BP) and Disability Access Audits at the Sarah Baartman and Chris Hani Provincial Treasury (PT) District Offices in order to ensure physical accessibility of the buildings for persons with different types of disabilities. The audit report with recommendations was communicated to relevant stakeholders, thus prioritizing the implementation of the Policy Determination on Reasonable Accommodation for Persons with Disabilities in the Public Service was prioritised.
SPU also facilitated the conducting of Training for 11 (eleven) employees on Diversity Management, and 15 (fifteen) on Gender Mainstreaming through the National School of Governance.

ANNUAL REPORT FOR 2018/19 FINANCIAL YEAR - VOTE 12: EASTERN CAPE PROVINCIAL TREASURY34
Participation of the Supply Chain Management Office (on CSD and LED Framework) during the Provincial Roadshows on Military Veterans at Buffalo City, Sarah Baartman and OR Tambo District Municipalities was also facilitated.
The Legal Services directorate continued to provide legal advice and litigation support to the department. On-going support and advice was provided in the drafting of legal documents that include contracts and service level agreements to ensure compliance with relevant legal prescripts. The unit further assisted the department in the drafting of the 2017/18 Appropriation as well as the Adjustment Appropriation Bills.
The Information and Communications Technology (ICT) directorate provides an internal enabling environment and support service with regard to information and technology management in order for the department to pursue its strategic objectives.
The Department deployed new server infrastructure made up of two physical hosts during the fourth quarter of 2018/19 financial year. All the virtual servers have been migrated into the new Infrastructure and are in a healthy state. The storage capacity of the new infrastructure is sufficient for the department’s present and future needs. The new server infrastructure further incorporates new Disaster Recovery (DR) technology thus replacing the old technology.
The department is focusing on the continuous improvement of the governance and management of ICT, particularly its alignment to the departmental strategy. Following successful development and implementation of an electronic leave management, the department has embarked on the development of electronic submission system which is currently being piloted, whilst the e-PMDS project is in its final stage of development, thus enabling the department to reach operational excellence through the reliable and efficient application of technology.
The Corporates Services sub-programme is made up of the following directorates: Human Resource Admin Services, Organisational Development (OD) & Change Management, the Human Resource Utilization and Development; and Security Management, Office Support & Auxiliary Services.
The Human Resource Admin Services, OD & Change Management directorate is responsible for the management of recruitment, conditions of service, organisational development, change management and PERSAL Management. In order to support the core business, this directorate has implemented the Human Resource Plan that is aligned to the MTEF period. The directorate committed itself in ensuring timeous filling of posts and therefore the majority of posts were filled within six months of becoming vacant. The department’s vacancy rate at the end of the period under review was at 3.9%, which is far below the public sector 10% threshold. The Employment Equity Plan for the period 2018-23 was approved. The department met the target of People with disabilities i.e. 2% of the total establishment.
The unit has embarked on a number of change management initiatives in trying to improve organisational efficiencies and bring about culture change in the department. The unit is currently embarking on the following change management programmes:
o Organisational functionality review- The unit embarked on a project to review and align the departmental organisational structure to the service delivery model. The overall objective of the project is to ensure that PT has an appropriate structure to deliver on its mandate effectively, efficiently and economically as defined in the Service Delivery Model.
o Leadership Development – Provincial Treasury is embarking on a Culture Transformation Journey and has identified Leadership Development and Enhancement as one of the critical interventions to spear head the journey.
ANNUAL REPORT FOR 2018/19 FINANCIAL YEAR - VOTE 12: EASTERN CAPE PROVINCIAL TREASURY 35
o Treasury Way/Values- The office is engaging stakeholders on the plans to revive the departmental values and ways that promote and encourage employees to live the values.
The Human Resource Utilisation and Development directorate is responsible for human resource development, employee performance management and development, employee health and wellness and employment relations. During the year under review, the unit identified through collaboration the human resource development needs of the department, and implemented the workplace skills plan.
During the year under review, 247 employees have benefited from various training programmes, including those listed in the skills plan priorities. Participation in all training and development programmes, especially leadership development programmes, has been deliberately structured to ensure more than 50% female representation. This initiative supports the ideal of the development of female leaders that will suitably populate the senior management cadre.
The Unit facilitated the development of PMDS Implementation Plan in line with National, Provincial and Departmental PMDS Policy Framework and compliance thereto was monitored.
In the year under review, the department contracted a 24-hour wellness service supplier to provide psychosocial assessment; counselling and referral services to employees and dependents and this resulted in 78 reported cases. Physical Wellness Interventions in the form of bi-weekly fitness sessions, Interdepartmental Sports Day, Fun Walk/Run and interdepartmental soccer/ netball matches were conducted. Quarterly screening and testing for communicable and non-communicable diseases were conducted. A Teambuilding event for all Corporate Management Program employees focusing on managing stress and maintaining work life balance was also conducted. The unit held a Men’s Health Initiative reaching 97 male employees with various stakeholders such as Men’s Clinic and activists dealing with issues relating to men.
The Employee Relations unit continued the initiative of focussing attention on dispute prevention. This entailed workshops, capacitation and empowerment of line management in the handling of disputes and potential disputes covering 61 employees at head office. The unit continuously ensures that disciplinary cases and grievances are finalised within the stipulated timeframes.
The Security, Office Support and Auxiliary Services directorate provides an internal enabling environment and support service with regard to physical and information security, occupational health and safety, refurbishments, maintenance, environmental and space management in order for the department pursue its strategic objectives. The unit, in the year under review, conducted information security classification awareness and assisted in information classification. Fire emergency and access control awareness was conducted at Districts and at Head Office. An emergency evacuation exercise was conducted on 29 March 2019.
The Financial Management sub-programme facilitates the provision of financial, supply chain, asset management, and internal control services to the department. The sub-programme continued to provide financial support to the department by ensuring that all statutory requirements are complied with in terms of the Public Financial Management Act (PFMA) and related prescripts that led to improved spending and audit outcomes. Within this context, the department is aiming to maintain its positive audit outcomes. In promoting the Local Economic Development of the Eastern Cape province, PT has procured goods and services from suppliers within the province to a total amount of R33 715 545 for the 2018/19 financial year.

ANNUAL REPORT FOR 2018/19 FINANCIAL YEAR - VOTE 12: EASTERN CAPE PROVINCIAL TREASURY36
In monitoring LED Spend within the Department in terms of Gender Considerations, the following results have been achieved in the total Procurement Spend of the department:
• Females - 55%
• Female Youth - 0,3%
• Male Youth - 2%
The Internal Control Unit (ICU) managed to successfully facilitate all Irregular Expenditure emanating from the 2015/16 Financial Year to be condoned by National Treasury. Furthermore, the unit consistently implements controls in the department to prevent any non-compliance to prescripts.
The Internal Audit unit is an independent, objective assurance and consulting unit designed to add value and improve the department’s operations. It helps the department meet its objectives by using a systematic, disciplined approach to evaluate and improve the effectiveness of risk management, control, and governance processes. The unit supports the Audit Committee (AC), Risk Management Committee (RMC), and management in enhancing the system of internal control, embedding good corporate governance, continuously improving on management practices, and improving the maturity of risk management processes. The unit has provided assurance and consulting services to this effect and continues to improve on the above-mentioned areas.
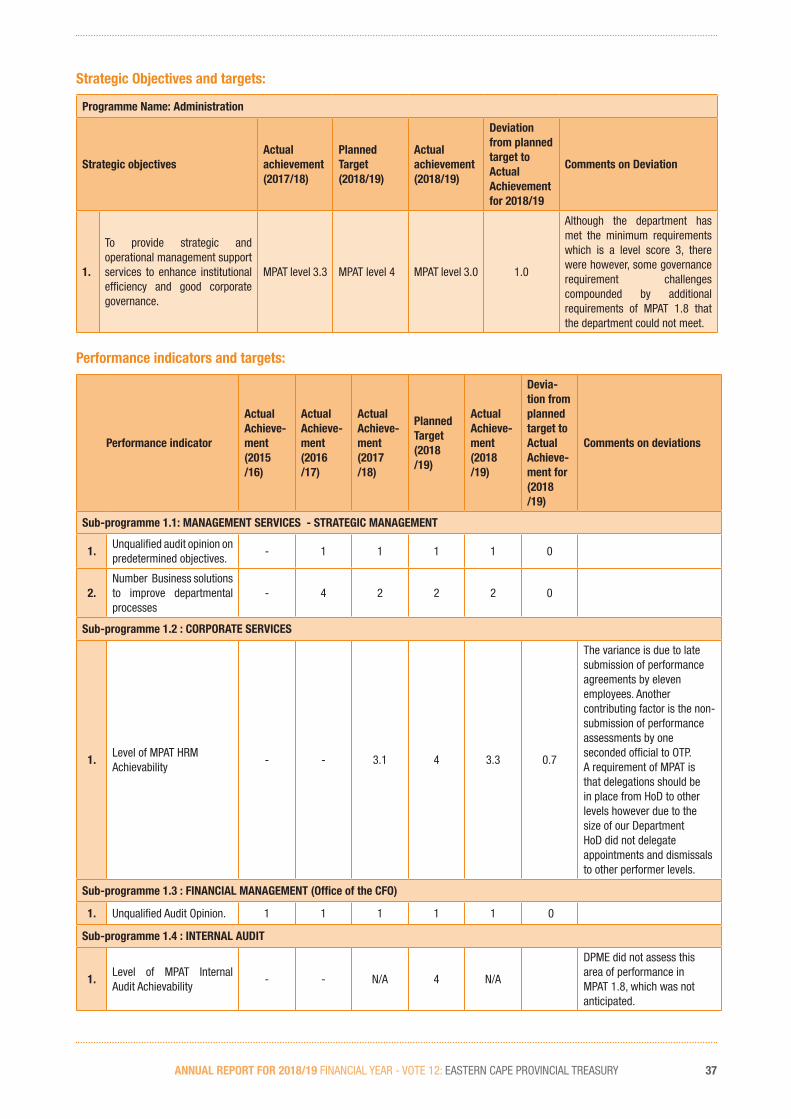
ANNUAL REPORT FOR 2018/19 FINANCIAL YEAR - VOTE 12: EASTERN CAPE PROVINCIAL TREASURY 37
Strategic Objectives and targets:
Programme Name: Administration
Strategic objectivesActual achievement (2017/18)
Planned Target (2018/19)
Actual achievement (2018/19)
Deviation from planned target to Actual Achievement for 2018/19
Comments on Deviation
1.
To provide strategic and operational management support services to enhance institutional efficiency and good corporate governance.
MPAT level 3.3 MPAT level 4 MPAT level 3.0 1.0
Although the department has met the minimum requirements which is a level score 3, there were however, some governance requirement challenges compounded by additional requirements of MPAT 1.8 that the department could not meet.
Performance indicators and targets:
Performance indicator
Actual Achieve-ment (2015 /16)
Actual Achieve-ment (2016 /17)
Actual Achieve-ment (2017 /18)
Planned Target (2018 /19)
Actual Achieve-ment (2018 /19)
Devia-tion from planned target to Actual Achieve-ment for (2018 /19)
Comments on deviations
Sub-programme 1.1: MANAGEMENT SERVICES - STRATEGIC MANAGEMENT
1.Unqualified audit opinion on predetermined objectives.
- 1 1 1 1 0
2.Number Business solutions to improve departmental processes
- 4 2 2 2 0
Sub-programme 1.2 : CORPORATE SERVICES
1.Level of MPAT HRM Achievability
- - 3.1 4 3.3 0.7
The variance is due to late submission of performance agreements by eleven employees. Another contributing factor is the non-submission of performance assessments by one seconded official to OTP. A requirement of MPAT is that delegations should be in place from HoD to other levels however due to the size of our Department HoD did not delegate appointments and dismissals to other performer levels.
Sub-programme 1.3 : FINANCIAL MANAGEMENT (Office of the CFO)
1. Unqualified Audit Opinion. 1 1 1 1 1 0
Sub-programme 1.4 : INTERNAL AUDIT
1.Level of MPAT Internal Audit Achievability
- - N/A 4 N/A
DPME did not assess this area of performance in MPAT 1.8, which was not anticipated.

ANNUAL REPORT FOR 2018/19 FINANCIAL YEAR - VOTE 12: EASTERN CAPE PROVINCIAL TREASURY38
Strategy to overcome areas of underperformance
All MPAT areas that need improvement have been incorporated into the 2019/20 operational plan. This will enable close monitoring and reporting of key performance areas that should result in improvement going forward.
Changes to planned targets
There were no changes to planned targets.
Linking performance with budgets
For the year under review, the programme achieved 4 (80%) of the planned 5 Annual Performance Plan (APP) targets and spent R156. 865 million (95.8%) of the adjusted budget of R163. 795 million with an under expenditure of R6.930 million.
Table 2.3.1 below shows programme 1 expenditure per sub-programme. Major contributors to the under spending in goods and services pertain to:
• Consultant fees due to the organisational functionality assessment project which was delayed due to the complexity in completing the work volume analysis phase and the project is anticipated to be completed in June 2019. Invoices for provincial investigations by the SIU which were lower than anticipated.
• Travel and subsistence pertains to official trips not undertaken due to unforeseen circumstances as well as the late receipt of invoices,
• Audit costs due to investigations invoiced being lower than anticipated,
• Administrative fees due to delays in procuring the electronic library due to internet connectivity challenges,
• Advertising due to provisions made for printing of bill board advertisements that did not materialise as well as inter-departmental claims processed for recruitment adverts being lower than anticipated
• Savings realised in respect of printing of strategic documents, special gazettes and travel and subsistence.
Other items that contributed to underspending include:
• Compensation of employees due to staff attrition as well as the unavailability of suitable candidates in respect of Webmaster, 2 Software Developer posts and Director – ICT.
• Transfers and subsidies pertaining to skills development levies being lower than anticipated;
• Payment for capital assets pertains to delays in the testing of the recently installed computer server infrastructure due to electricity outages, late delivery of laptop computers by the service provider due to discontinuation by the original equipment manufacturer and challenges experienced with the computer system vulnerability software specification.
Table 2.3.1: Sub-programme expenditure
PROGRAMME 1
2018/2019 2017/2018
Final Appropriation
Actual Expenditure
(Over)/Under Expenditure
Final Appropriation
Actual Expenditure
(Over)/Under Expenditure
(R’000) (R’000) (R’000) (R’000) (R’000) (R’000)
Office of the MEC 7 317 6 993 324 6 974 6 503 471
Management Services 50 306 46 450 3 856 41 329 38 973 2 356
Corporate Services 46 132 44 410 1 722 45 163 41 975 3 188
Financial Management 52 221 51 451 770 51 503 50 783 720
Internal Audit and Risk Management 7 819 7 561 258 7 904 7 518 386
Programme Total 163 795 156 865 6 930 152 873 145 752 7 121

ANNUAL REPORT FOR 2018/19 FINANCIAL YEAR - VOTE 12: EASTERN CAPE PROVINCIAL TREASURY 39
2.4.2. Programme 2: Sustainable Resource Management
Purpose:
To ensure the Effective and Efficient Planning, Utilization, Implementation and Monitoring of Provincial Fiscal Resources.
The programme consists of four sub-programmes, namely:
Programme Support Provides strategic leadership in implementing strategies to ensure the programme’s contribution in realising departmental objectives;
Economic Analysis Determines and evaluates economic parameters and socio-economic imperatives within a provincial and macro-economic context;
Fiscal Policy Promotes optimal financial resource allocation and enables government to finance its service delivery obligations, and also promotes sound planning, budgeting, financial management and reporting in Public Entities;
Budget Management Promotes effective optimal resource allocation; manages fiscal assets, optimises liquidity requirements and returns on financial investments and maximises the latter within acceptable levels of risk.
Strategic Objectives:
• To ensure allocative efficiency of the provincial budget.
• To improve the public spending to ensure value for money.
• To contribute to sound management of government’s financial assets and liabilities.

ANNUAL REPORT FOR 2018/19 FINANCIAL YEAR - VOTE 12: EASTERN CAPE PROVINCIAL TREASURY40
2.4.2.1. High Level Achievements
The Economic Analysis directorate determines and evaluates economic parameters and socio-economic imperatives within a provincial and macro-economic context. For the 2018/19 financial year. The directorate tabled the 2018/19 Provincial Medium Term Budget Policy Statement (MTBPS) that outlined the 2018/19 medium-term resource allocations framework for key socio-economic programmes that underpin economic growth and development in the province. The unit also compiled the Overview of Provincial Revenue and Expenditure section of the 2019/20 Estimates of Provincial Revenue and Expenditure.
Quarterly Policy Briefs were developed on Sustainable industrial polices, farmer development programmes focusing on the importance of value chain configurations, impact of inadequate infrastructure planning and implementation on provincial Early Childhood Development (ECD) facilities and inclusive smallholder value chains
Furthermore, a desktop analysis and a report was produced which summarises the findings of Statistics South Africa’s Quarter Labour Force Survey (QLFS), for the Eastern Cape for all the 2018 quarters. The outcome for 2018 was a net job loss of approximately of 16 000.
The Fiscal Policy directorate promotes optimal financial resource allocation and enables government to finance its service delivery obligations. During the 2018/19 financial year, the unit continued to focus on increasing the provincial revenue base and the Provincial Revenue Generation Strategy continues to be implemented by key revenue generating departments. As at March 2019, the province collected an amount R1.961 billion against adjusted budget of R1.414 billion and thus led to over collection of R547.079 million, of which nine departments over collected their adjusted revenue estimates.
As part of the provincial revenue generation strategy, a research study was completed that had identified new sources of own revenue
The unit provided inputs and comments on the Financial and Fiscal Commission recommendations to ensure that all areas are covered especially in respect of implementation and funding of priorities that affect the province. Inputs and comments were also provided on the first and second drafts of the 2019 Division of Revenue Bill which were taken into consideration with the finalisation of the final 2019 Division of Revenue Bill. Comments were provided in respect of the Provincial Transport Operations Grant as well as the Provincial Road Maintenance Grant.
The Public Entities directorate promotes sound planning, budgeting, financial management and reporting in Public Entities. The rationalisation of provincial public entities report has been completed and widely consulted. Implementation of the rationalisation plan is awaiting endorsement by EXCO. A separate 2019/20 Budget Book for Public Entities was published and tabled together with the main budget in March 2019.
The Budget Management unit promotes effective optimal resource allocation; manages fiscal assets, optimises liquidity requirements and returns on financial investments and maximises the latter within acceptable levels of risk. During the 2018/19 financial year, the unit performed the following:
• The 2019 MTEF budget was tabled within the legislated timeframe together with the Appropriation Bill and Gazette on transfers to hospitals and schools. Furthermore, as a means to stimulate economic growth of the province, an economic stimulus package fund was provided to target catalytic projects.
• The First Adjustments Estimates Budget was tabled in the Provincial Legislature in November 2018 while the Second Adjustments Estimates Budget was tabled in the Provincial Legislature in March 2019.
• In order to determine performance of departments for previous year and current year, budget achievability hearings were held together with National Treasury and specific departments in July 2018. This was

ANNUAL REPORT FOR 2018/19 FINANCIAL YEAR - VOTE 12: EASTERN CAPE PROVINCIAL TREASURY 41
preceded by budget guidelines and review workshops whereby departments, amongst others, were encouraged towards the integrated budget planning.
• In order to enforce Budget Consultative processes and emphasise the implementation of the National and Provincial Priorities, Medium Term Expenditure Committee (MTEC) Hearings were held with departments including public entities. Separate MTEC hearings were conducted for infrastructure.
• The unit undertook continuous monitoring of expenditure and monthly reporting on the provincial finances and submitted to the relevant stakeholders such as Provincial Top Management, Cabinet Budget Committee (CBC), Executive Council (EXCO), National Treasury and Portfolio Committee on Finance on time to promote financial prudence.
• The resultant monitoring of all departmental expenditure and revenue led to an improved expenditure outcome with an under-expenditure of 0.5% as at 31 March 2019.
• In order to validate value for money and ensure improvement on service delivery, site visits were conducted on Non-infrastructure investment projects (such as Scholar Transport, health facilities as a follow up of 2017/18 site visits, livestock and horticulture production and old age homes) and feedback reports were issued to departments to implement recommendations. As a continuation from 2017/18, follow-up site visits were undertaken to monitor the implementation of recommendations contained in the feedback reports.
• Benchmark Hearings were held with National Treasury to ensure the budget allocative efficacy and alignment to sector priorities.
• The province hosted Technical Committee on Finance (TCF) Lekgotla in July 2018, whereby all treasuries both national and provincial attended including some specific sector departments and public entities. The focus of these gatherings amongst others is to attend to financial related matters in order to mitigate any risk affecting the stability of finances.
• The Budget Office provides technical financial support to the Provincial Coordinating Monitoring Team (PCMT) towards the containment of the Provincial Wage Bill. This is to ensure that the core posts are prioritised and filled by the departments.
• Cash flow hearings were conducted to align departments spending with the cash drawn on a monthly basis from National treasury. The credibility of spending is maintained by ensuring that adequate funds are available for departments expenditure throughout the year.
The Financial Asset Management unit manages fiscal assets, optimises liquidity requirements and returns on financial investments and maximises the latter within acceptable levels of risk. The following was achieved during the period under review:
• Maintained the liquidity and financial health of the Provincial Revenue Fund (PRF) resulting in funding of government priorities, during the MTEF for 2018/19;
• PRF obtained unqualified audit opinion (with no findings) for the 2017/18 financial year audit.
• In supporting the achievement of the strategic goal of the COE split between core and non-core of 60:40 by 2020, as part of the various provincial initiatives, PT centralised the PERSAL authorisation of all departments for appointments and other salary related functions (excluding all posts for Department of Health). The Unit was central in the implementation of this strategic effort and continues to support this initiative for the Province.
• The Provincial Banking relationship continues to be maintained with various banks, including the Provincial Banker, which led to an improved investment income, for provincial revenue generation.

ANNUAL REPORT FOR 2018/19 FINANCIAL YEAR - VOTE 12: EASTERN CAPE PROVINCIAL TREASURY42
• The unit held quarterly Creditors and Debtors Forums to share best practices with departments to ensure the payment of creditors within 30 days as required by National Treasury Regulations (NTR) 8.2.3. The Provincial Departments took an average of 18 days to settle invoice during 2018/19 financial year.
In the year under review, the Infrastructure Management Unit which promotes effective optimal resource allocation; achieved the following:
• To strengthen integrated planning and implementation, the Unit initiated robust engagements with both Metros and Local Government and further mapped the projects to determine the alignment to the corridors and Strategic Catalytic Projects.
• The Unit provided hands-on support and also conducted three workshops on institutionalisation of IDMS and SIPDM in metros, municipalities, public entities and provincial departments as both IDMS and SIPDM have been adopted as the provincial protocol to drive infrastructure delivery across all spheres of government.
• Infrastructure Unit in collaboration with NT attended the annual Built Environment Permanence Plan Evaluations for the two metros in the province.
• PT facilitated the attendance of provincial and municipal delegates to the University of Pretoria- IDMS workshop.
• Three trainings sessions were held namely the Planning and Budgeting Course, the IDMS SCM 8 and the Executive IDMS course.
• The Province managed to meet the requirements of the Infrastructure bidding process and as a result Departments of Health and Education received incentive allocations of R188 million and R209.4 million respectively as they attained 77% (DoH) and 70% (DoE) scoring in the National Treasury Performance Based System.
• The site visits conducted during the year of review proved that the departments are now actively giving more attention to the quality of the actual delivery of the infrastructure as evidenced by the sample of projects visited. The site visits findings and recommendations were escalated to various stakeholders for consideration.
• The unit continued the oversight of construction of schools, clinics, built roads where there were none before.
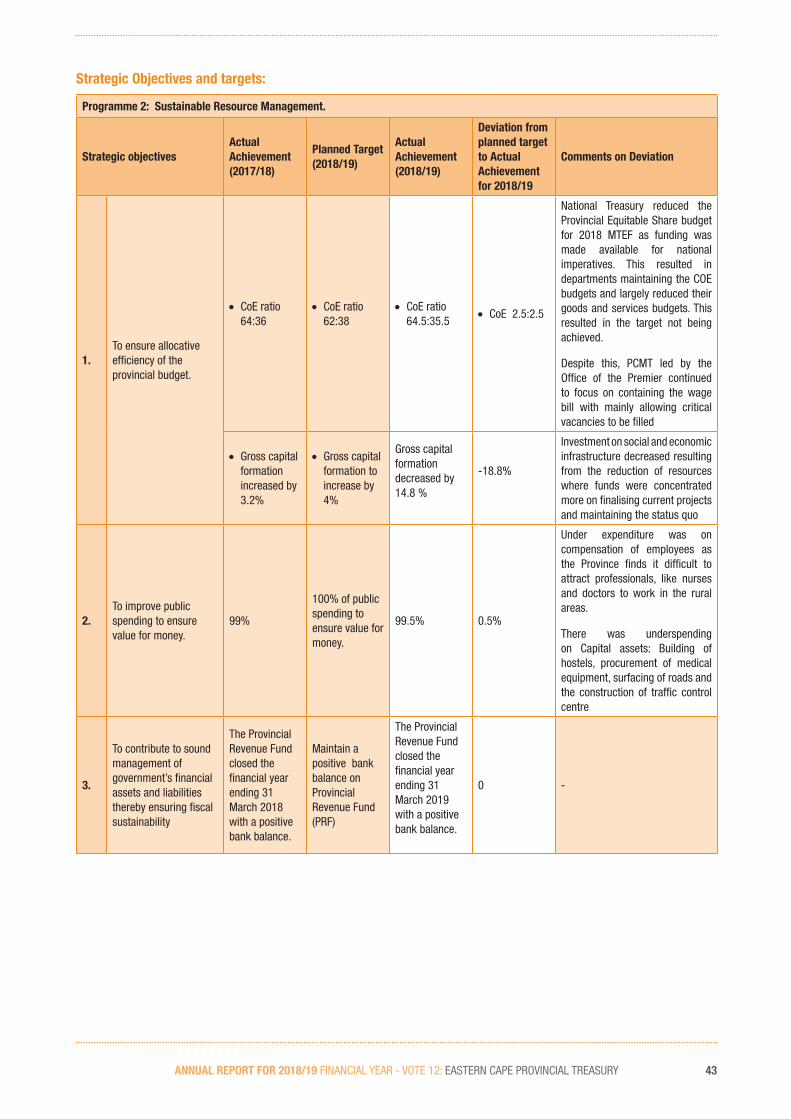
ANNUAL REPORT FOR 2018/19 FINANCIAL YEAR - VOTE 12: EASTERN CAPE PROVINCIAL TREASURY 43
Strategic Objectives and targets:
Programme 2: Sustainable Resource Management.
Strategic objectivesActual Achievement (2017/18)
Planned Target (2018/19)
Actual Achievement (2018/19)
Deviation from planned target to Actual Achievement for 2018/19
Comments on Deviation
1.To ensure allocative efficiency of the provincial budget.
• CoE ratio 64:36
• CoE ratio 62:38
• CoE ratio 64.5:35.5
• CoE 2.5:2.5
National Treasury reduced the Provincial Equitable Share budget for 2018 MTEF as funding was made available for national imperatives. This resulted in departments maintaining the COE budgets and largely reduced their goods and services budgets. This resulted in the target not being achieved.
Despite this, PCMT led by the Office of the Premier continued to focus on containing the wage bill with mainly allowing critical vacancies to be filled
• Gross capital formation increased by 3.2%
• Gross capital formation to increase by 4%
Gross capital formation decreased by 14.8 %
-18.8%
Investment on social and economic infrastructure decreased resulting from the reduction of resources where funds were concentrated more on finalising current projects and maintaining the status quo
2.To improve public spending to ensure value for money.
99%
100% of public spending to ensure value for money.
99.5% 0.5%
Under expenditure was on compensation of employees as the Province finds it difficult to attract professionals, like nurses and doctors to work in the rural areas.
There was underspending on Capital assets: Building of hostels, procurement of medical equipment, surfacing of roads and the construction of traffic control centre
3.
To contribute to sound management of government’s financial assets and liabilities thereby ensuring fiscal sustainability
The Provincial Revenue Fund closed the financial year ending 31 March 2018 with a positive bank balance.
Maintain a positive bank balance on Provincial Revenue Fund (PRF)
The Provincial Revenue Fund closed the financial year ending 31 March 2019 with a positive bank balance.
0 -
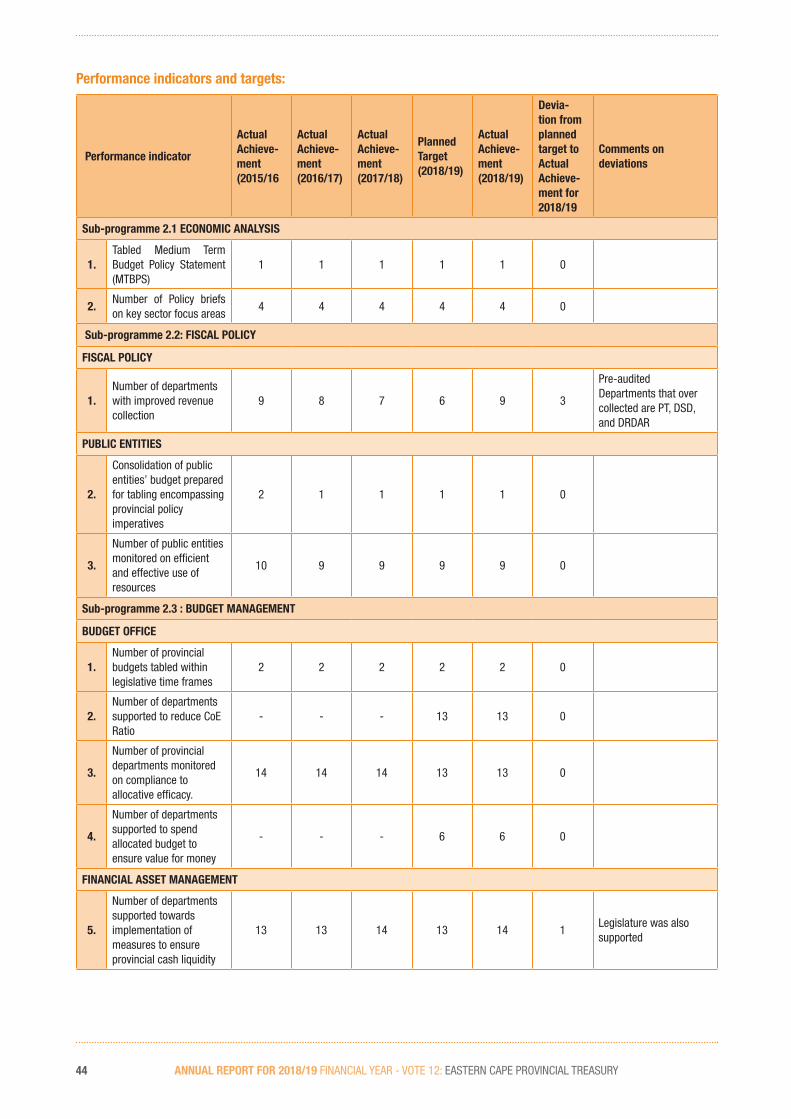
ANNUAL REPORT FOR 2018/19 FINANCIAL YEAR - VOTE 12: EASTERN CAPE PROVINCIAL TREASURY44
Performance indicators and targets:
Performance indicator
Actual Achieve-ment (2015/16
Actual Achieve-ment (2016/17)
Actual Achieve-ment (2017/18)
Planned Target (2018/19)
Actual Achieve-ment (2018/19)
Devia-tion from planned target to Actual Achieve-ment for 2018/19
Comments on deviations
Sub-programme 2.1 ECONOMIC ANALYSIS
1.Tabled Medium Term Budget Policy Statement (MTBPS)
1 1 1 1 1 0
2.Number of Policy briefs on key sector focus areas
4 4 4 4 4 0
Sub-programme 2.2: FISCAL POLICY
FISCAL POLICY
1.Number of departments with improved revenue collection
9 8 7 6 9 3
Pre-auditedDepartments that over collected are PT, DSD, and DRDAR
PUBLIC ENTITIES
2.
Consolidation of public entities’ budget prepared for tabling encompassing provincial policy imperatives
2 1 1 1 1 0
3.
Number of public entities monitored on efficient and effective use of resources
10 9 9 9 9 0
Sub-programme 2.3 : BUDGET MANAGEMENT
BUDGET OFFICE
1.Number of provincial budgets tabled within legislative time frames
2 2 2 2 2 0
2.Number of departments supported to reduce CoE Ratio
- - - 13 13 0
3.
Number of provincial departments monitored on compliance to allocative efficacy.
14 14 14 13 13 0
4.
Number of departments supported to spend allocated budget to ensure value for money
- - - 6 6 0
FINANCIAL ASSET MANAGEMENT
5.
Number of departments supported towards implementation of measures to ensure provincial cash liquidity
13 13 14 13 14 1Legislature was also supported
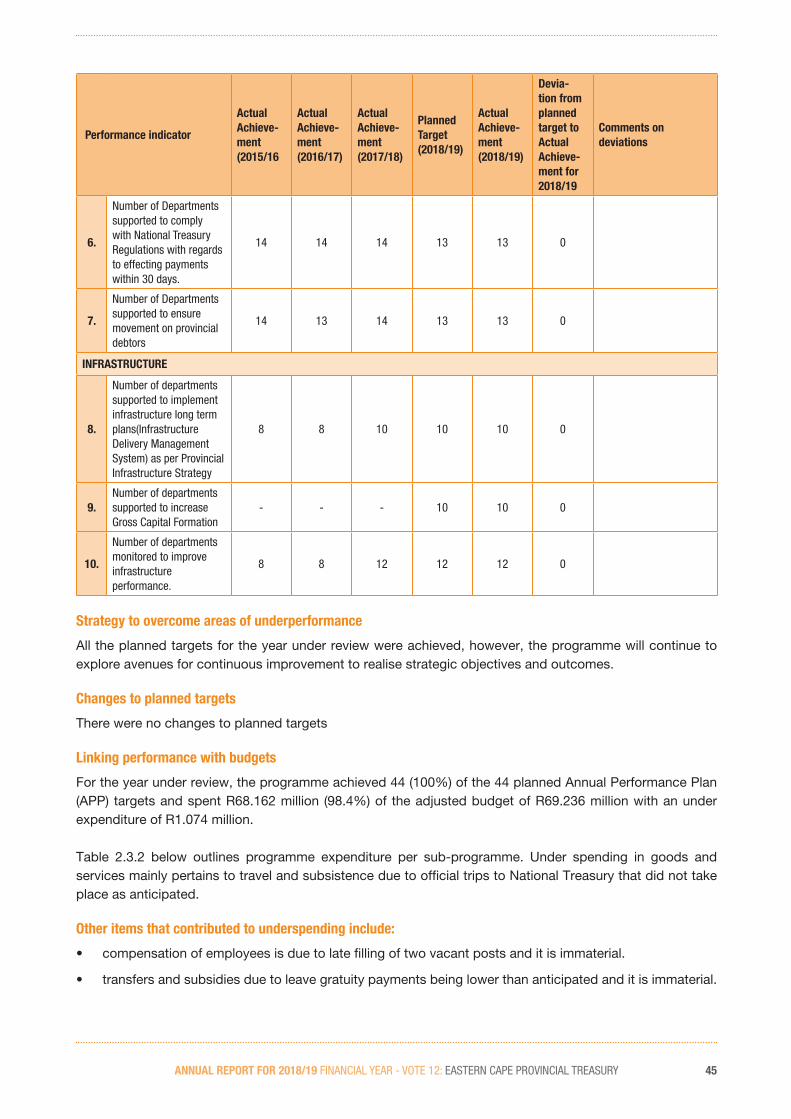
ANNUAL REPORT FOR 2018/19 FINANCIAL YEAR - VOTE 12: EASTERN CAPE PROVINCIAL TREASURY 45
Performance indicator
Actual Achieve-ment (2015/16
Actual Achieve-ment (2016/17)
Actual Achieve-ment (2017/18)
Planned Target (2018/19)
Actual Achieve-ment (2018/19)
Devia-tion from planned target to Actual Achieve-ment for 2018/19
Comments on deviations
6.
Number of Departments supported to comply with National Treasury Regulations with regards to effecting payments within 30 days.
14 14 14 13 13 0
7.
Number of Departments supported to ensure movement on provincial debtors
14 13 14 13 13 0
INFRASTRUCTURE
8.
Number of departments supported to implement infrastructure long term plans(Infrastructure Delivery Management System) as per Provincial Infrastructure Strategy
8 8 10 10 10 0
9.Number of departments supported to increase Gross Capital Formation
- - - 10 10 0
10.
Number of departments monitored to improve infrastructure performance.
8 8 12 12 12 0
Strategy to overcome areas of underperformance
All the planned targets for the year under review were achieved, however, the programme will continue to explore avenues for continuous improvement to realise strategic objectives and outcomes.
Changes to planned targets
There were no changes to planned targets
Linking performance with budgets
For the year under review, the programme achieved 44 (100%) of the 44 planned Annual Performance Plan (APP) targets and spent R68.162 million (98.4%) of the adjusted budget of R69.236 million with an under expenditure of R1.074 million.
Table 2.3.2 below outlines programme expenditure per sub-programme. Under spending in goods and services mainly pertains to travel and subsistence due to official trips to National Treasury that did not take place as anticipated.
Other items that contributed to underspending include:
• compensation of employees is due to late filling of two vacant posts and it is immaterial.
• transfers and subsidies due to leave gratuity payments being lower than anticipated and it is immaterial.

ANNUAL REPORT FOR 2018/19 FINANCIAL YEAR - VOTE 12: EASTERN CAPE PROVINCIAL TREASURY46
Table 2.3.2 Sub-programme expenditure
PROGRAMME 2
2018/2019 2017/2018
Final Appropriation
Actual Expenditure
(Over)/Under Expenditure
Final Appropriation
Actual Expenditure
(Over)/Under Expenditure
(R’000) (R’000) (R’000) (R’000) (R’000) (R’000)
Programme Support 2 935 2 746 189 2 705 2 681 24
Economic Analysis 2 386 2 245 141 1 762 1 656 106
Fiscal Policy 9 575 9 512 63 8 305 8 243 62
Budget Management 54 340 53 659 681 49 179 48 551 628
Programme Total 69 236 68 162 1 074 61 951 61 131 820

ANNUAL REPORT FOR 2018/19 FINANCIAL YEAR - VOTE 12: EASTERN CAPE PROVINCIAL TREASURY 47
2.4.3. Programme 3: Asset and Liability ManagementPurpose:
To provide policy direction, promote and enforce transparency and effectiveness of Supply Chain management and Asset Management in the province.
The programme consists of two sub-programmes, namely:
Programme Support Provides strategic leadership in implementing strategies to ensure the programme’s contribution in realising departmental objectives;
Asset Management To provide policy direction, facilitates the effective and efficient management of physical assets and promotes economic development targeted government procurement.
Strategic Objectives:
• To improve the public spending to ensure value for money.
• To ensure sound management of provincial movable and immovable assets
ANNUAL REPORT FOR 2018/19 FINANCIAL YEAR - VOTE 12: EASTERN CAPE PROVINCIAL TREASURY48
2.4.3.1. High Level Achievements
The Asset Management directorate exists to ensure that the province has sound policies, processes and systems to effectively manage state assets. This involves ensuring that only assets which support service delivery are purchased, optimally used and safeguarded against losses and abuse.
All departments had updated their asset registers in preparation for the audit by Auditor General in terms of the section 40(2) of the Public Finance Management Act (PFMA).
Subsequent to supporting the finalisation of 2017/18 Annual Financial Statements asset management inputs and related audit, the unit conducted asset management controls in the 2018/19 financial year. The results were used in the development of Audit Improvement Plans in consultation departments. The implementation of these plans was monitored and tracked in the Interim Financial Statements reporting processes. This has led to an additional department improving from Level 2 to Level 3 performance in terms of the Financial Management Capability Maturity Model making a total of 11 departments.
The unit also participated in the National Treasury’s review of Immovable Assets Accounting Guide which is due for release mid-May 2019. This will assist the roll-out of the Provincial Circular on Acquisition and Disposal of Immovable Assets which will come into effect in July 2019 to regulate the disposals and acquisition of state property even by public entities.
The Supply Chain Management Office continued with its endeavours to improve compliance with relevant legislation, to achieve value for money and to promote Local Economic Development (LED).
Departments were supported on the implementation of the LED Procurement Framework in order to achieve 50% local spend. A Provincial Procurement spend analysis was undertaken and it revealed that a total of R10 363 733 959. 48 (56,5%) was spent on Eastern Cape based suppliers.
Conflict of interest reports were generated and issued to the affected departments with details of officials whose names are reflected as directors and/or owners of companies on the CSD for their further action
The drive to improve procurement efficiencies through transversal contracts, capacitation of suppliers on opportunities available to enable Small, Medium and Micro-Enterprises (SMMEs) to do business with government, including administrative support and registration on Central Supplier Database (CSD) and Logistical Information System (LOGIS) is continuing. The Help Desk assisted 5212 walk-in suppliers to register on the CSD. Suppliers were also assisted telephonically and via email. The unit facilitated the creation and/or linking of LOGIS numbers to CSD supplier numbers for suppliers.
The monitoring of adherence to procurement plans by Departments was undertaken in thirteen (13) departments as planned. The unit undertook compliance assessments in the Departments of Public Works; Safety and Liaison; Sports, Recreation, Arts and Culture; Social Development; Transport; Rural Development and Agrarian Reform, Provincial Treasury; and Education. Departments and Public Entities were supported on the interpretation and implementation of various SCM prescripts and legislation. In addition, the Unit issued eight (8) circulars on SCM related matters to Departments and Public Entities to further enhance compliance. Fifty-two (52) tender bulletins containing nine hundred and sixty-five (965) bid notices were published in the Provincial Tender Bulletin on E-tender publication portal. The unit hosted four (4) SCM Forum meetings.
A total of three hundred and twelve (312) officials were trained on various areas of SCM, namely, Bid Committees, Demand Management, Acquisition Management, Contract Management and Strategic Sourcing.
Two (2) updates of the Price Index for low-value high-volume commodities were undertaken and issued to departments. Monitoring of implementation of the Price Index was undertaken in the departments and

ANNUAL REPORT FOR 2018/19 FINANCIAL YEAR - VOTE 12: EASTERN CAPE PROVINCIAL TREASURY 49
feedback was provided where necessary.
Furthermore, the Unit together with the Department of Public Works developed a roads contract costing guide which can be utilised to ensure cost effectiveness of roads pricing in the Province.
Working together with the Department of Roads and Public Works (DRPW) and the Office of the Premier (OTP), Provincial Treasury is institutionalising the Provincial Infrastructure Strategic Framework (PISF) to maximise infrastructure delivery. To improve the infrastructure co-ordination across the province, the Standard for Infrastructure Procurement and Delivery Management (SIPDM) came into effect in 2016 and Infrastructure Departments and their Implementing Agents were trained on this standard. Chief Financial Officers and Heads of Supply Chain will spear-head the SIPDM delivery process.
This Standard forms an integral component of the Government’s Infrastructure Delivery Management System (IDMS), which has been adopted in order to deliver value for money on government’s infrastructure assets. Progress is being made on the implementation of municipal social infrastructure projects, amid various project implementation challenges.
The Terms of Reference for the Treasury Infrastructure Procurement Review Committee (Gateway Review Committee) has been approved. The Terms of Reference and tender document for establishing the panel of Built Environment Professionals is in progress. The Gateway Review Committee has reviewed three (03) roads projects for the period under review. Those projects were the Willowvale/ Dwesa Phase 2, Siphethu Phase 4 Project and The MR00522 from Hamburg to R72. The Committee comprised of the Built Environment Specialists and the relevant Infrastructure (Construction) Head for the Department of Transport. The Gateway Review report has been submitted.
Strategic Objectives and targets:
Programme Name: Asset Management and Liability Management
Strategic objectivesActual achievement (2017/18)
Planned Target(2018/19)
Actual achievement (2018/19)
Deviation from planned target to Actual Achievement for 2018/19
Comments on Deviation
1.To improve public spending to ensure value for money.
One (1) provincialDepartment without SCM compliancefindings
Seven (7)departments attain level 3 with regards to FMCMM on SCM
Eight (8)departments attained level 3 with regards to FMCMM on SCM
1
This is due to the improvement of internal controls by the department
2.
To ensure sound management of provincial movable and immovable assets.
Ten (10) provincialdepartments without assets compliancefindings
Eleven (11)departments attain level 3 with regards to FMCMM on Asset Management
Eleven (11)departments attained level 3 with regards to FMCMM on Asset Management
0

ANNUAL REPORT FOR 2018/19 FINANCIAL YEAR - VOTE 12: EASTERN CAPE PROVINCIAL TREASURY50
Performance indicators and targets:
Performance indicator
Actual Achieve-ment (2015/16
Actual Achieve-ment (2016/17)
Actual Achieve-ment (2017/18)
Planned Target (2018/19)
Actual Achieve-ment (2018/19)
Devia-tion from planned target to Actual Achieve-ment for 2018/19
Comments on deviations
ASSET MANAGEMENT OFFICE
1.
Number of departments supported on the implementation of controls relating to movable and immovable assets (including fleet management).
13 13 13 13 13 0
SUPPLY CHAIN MANAGEMENT
2.
Number of departments supported to improve compliance with SCM legislation.
13 13 14 13 13 0
3.
Number of departments supported in the implementation of the Standard for Infrastructure Procurement and Delivery Management (SIPDM)
- - 8 8 11 3
Support was provided to OTP, PT and DEDEAT who also had infrastructure projects
4.
Number of departments supported in the implementation of the LED Procurement Framework in order to achieve 50% local spend.
- - 14 13 13 0
Strategy to overcome areas of underperformance
Although all the planned targets for the year under review were achieved, the programme will explore avenues for continuous improvement to realise strategic objectives and outcomes.
Changes to planned targets
There were no changes to planned targets.
Linking performance with budgets:
For the year under review, the programme achieved 14 (100%) of the 14 planned Annual Performance Plan (APP) targets and spent R26.633 million (98.6%) of the adjusted budget of R27.004 million with an under expenditure of R371 000.
Table 2.3.3 below outlines programme expenditure per sub-programme. Underspending in goods and services is due to the following:
• Consultancy fees due to infrastructure review reports that were finalised late in March 2019,
• Travel and subsistence due to late receipt of the RT3 contract workshop invitation from National Treasury.

ANNUAL REPORT FOR 2018/19 FINANCIAL YEAR - VOTE 12: EASTERN CAPE PROVINCIAL TREASURY 51
Table 2.3.3: Sub-programme expenditure
PROGRAMME 3
2018/2019 2017/2018
Final Appropriation
Actual Expenditure
(Over)/Under Expenditure
Final Appropriation
Actual Expenditure
(Over)/Under Expenditure
(R’000) (R’000) (R’000) (R’000) (R’000) (R’000)
Programme Support - - - - - -
Asset Management 27 004 26 633 371 25 002 24 929 73
Programme Total 27 004 26 633 371 25 002 24 929 73

ANNUAL REPORT FOR 2018/19 FINANCIAL YEAR - VOTE 12: EASTERN CAPE PROVINCIAL TREASURY52
2.4.4. Programme 4: Financial GovernancePurpose:
To promote accountability through comprehensive accounting practices, financial information systems, governance as well as compliance with financial norms and standards in PFMA compliant institutions and financial systems management.
The programme consists of five sub-programmes, namely:
Programme Support Provides strategic leadership in implementing strategies to ensure the programme’s contribution in realising departmental objectives;
Accounting Services To ensure the effective implementation of accounting practices in line with Generally Accepted Accounting Practice (GAAP), Generally Recognized Accounting Practice (GRAP) and prepare consolidated financial statements that reflect the financial position of the province;
Norms and Standards Develops and implements financial norms and standards and ensures effective communication;
Risk Management Provides risk profile of the province , develops and monitors the implementation of the Provincial Risk Management Framework;
Provincial Internal Audit Services
Coordinates the activities and provide technical support for all provincial internal audit units and audit committees.
Supporting and Interlinked
Financial Systems
To provide for oversight and management of existing financial systems and the transition to the Integrated Financial Management Systems, enhancement of systems to support the business processes of government and provides capacity building in the usage of financial systems aimed at better provincial financial Management.
Strategic Objectives:
• To promote good financial governance and credible financial reporting towards achieving unqualified audit outcomes.
• To promote improved levels of accountability on the use of public funds, thereby encouraging a service orientated financial management and governance
• To promote effective governance practices in the Province.
• To promote the production of credible financial information from the Financial Information Systems utilised in the Eastern Cape.
ANNUAL REPORT FOR 2018/19 FINANCIAL YEAR - VOTE 12: EASTERN CAPE PROVINCIAL TREASURY 53
2.4.4.1. High Level Achievements
The Accounting Services unit ensures the effective implementation of accounting practices in line with Generally Recognised Accounting Practice (GRAP), Modified Cash Standards and applicable laws, prepares consolidated financial statements that reflect the financial position of the province and provides training and communication on accounting reforms. For the year under review a total of 1093 officials were trained in various departments.
The unit has been supporting departments to reduce irregular expenditure balances through advising on the processing of the applications and supporting the same for condonations. Furthermore, the unit continued to engage departments (and Public Entities) on audit risks as part of co-ordinating the annual reporting process, culminating in the Consolidated Annual Financial Statements.
The Norms and Standards unit continued to promote the implementation of the revised Financial Management Accountability Framework as a way of fostering a culture of improved discipline in the management of public resources. Advice was also given to departments for proper implementation of the PFMA and its regulations alongside the continuing programmes towards sustainable financial management capacity, in particular the Financial Management Capacity Study, CFO Capacitating Framework and the Oversight Framework.
The Transversal Risk Management provided guidance and support to enable Provincial Departments to implement and maintain effective systems of risk management. During the year under review, all departments received support towards achieving the desired risk maturity level. All 13 departments risk management maturity status were assessed utilising a diagnostic assessment tool and mitigating action plans were developed for all gaps identified. The Risk Management Committee Chairperson Forum (RMCCF) held its inaugural meeting this financial year. The forum provides an opportunity for Risk Chairpersons to share best practice and contribute towards uniformity and effective Risk Management.
The Provincial Internal Audit Services (PIAS) provided technical support and oversight of provincial internal audit and audit committee activities, enabling the achievement of an integrated approach to the promotion of sound corporate governance in the province. Additional to their normal activities, PIAS in 2018/19 conducted the Quality Assurance Reviews of four Municipalities namely, Matatiele District Municipality. Umzimvubu Local Municipality, Chris Hani District Municipality and Joe Gqabi District Municipality to determine the effectiveness of the Internal Audit Activity.
The unit continued facilitating training programmes to professionalise the internal audit function in the province. This includes Continuous Professional Development training as well as a Learnership programme. There were three (3) Continuous Professional Development trainings conducted as follows:
• Ethics and the Internal Auditor where forty – eight (48) candidates attended the training;
• Time Management where twenty-four (24) candidates attended the training and
• Auditing IT Governance using CGIPF for Public Sector where thirty-nine (39) candidates attending the training.
Moreover, in terms of the Learnership Programme, which is the Professional Internal Auditor (PIA) programme, five (5) modules which cover various Internal Audit topics were conducted. This PIA group consists of eleven (11) learners.
Forums to standardise, improve and strengthen governance were facilitated. These include the Auditors Managers Forum, Chief Audit Executive Forum, and the Audit Committee Chairpersons Forum.

ANNUAL REPORT FOR 2018/19 FINANCIAL YEAR - VOTE 12: EASTERN CAPE PROVINCIAL TREASURY54
The Forensic Audit unit has initiated and continued investigations relating to alleged irregularities at the following institutions:
• Department of Sports, Recreation, Arts and Culture
• Department of Transport
• Department of Education
• Department of Human Settlements
• Eastern Cape Development Corporation
The unit also conducted substantive reviews on the following Departments:
• Agricultural funding projects at the Department of Rural Development and Agrarian Reform
• Transfer payments at the Department of Social Development
• S&T review in all departments.
In terms of the S&T review an extensive set of recommendations have been issued to the departments and this is expected to result is substantial savings, thereby helping the province redirect such savings to core expenditure programmes. Improvements were also recommended for transfer payments review and this will ensure a more sustainable model for supporting Non-Profit Organisations in the Province.
Where investigations have been concluded, proposals were made regarding the improvement of system weaknesses and implementing consequence management in these institutions, which ECPT continues to monitor.
The unit is also responsible for managing the provision of support and capacity building for forensic services in provincial departments and public entities. The unit has facilitated four (4) training sessions with the assistance of National Treasury. The training covered four basic investigation topics. The first and second training sessions were targeted at Departments and Public Entities with 72 candidates attending the training. Approximately 25 Municipalities and Municipal Entities attended the third and fourth training sessions with 126 candidates attending the training.
The Supporting and Interlinked Financial Systems unit provides oversight and management of existing financial systems and the transition to the Integrated Financial Management Systems, enhancement of systems to support the business processes of government and capacity building in the usage of financial systems aimed at better provincial financial management.
The unit hosts PERSAL centralisation, which includes centralisation of PERSAL system control function in 12 provincial departments. This is critical in maintaining our fiscal stance (moving money away from consumption towards investments). The project continued to successfully control the use of PERSAL codes such as overtime, acting allowances, backdated salaries, and performance bonus and identify opportunities where CoE expenditure control can be enhanced.
The unit centralised disbursement of payments through the BAS system for 13 Provincial departments. The main benefits of centralised disbursements are identification and escalation of irregular or unauthorised expenditure, enforcing compliance with National and Provincial prescripts and ensuring that departments do not exceed their section 40 projections.
The unit is responsible for the roll out of LOGIS in the Province. To date 191 stores have been implemented
ANNUAL REPORT FOR 2018/19 FINANCIAL YEAR - VOTE 12: EASTERN CAPE PROVINCIAL TREASURY 55
in the Province to enable electronic procurement, and maintenance of inventory and assets on LOGIS. Use of LOGIS helps to eliminate use of manual transactions and monitoring of procurement to influence budgeting and policy on Local Economic Development (LED). During the year under review, ten (10) new LOGIS sites were supported for LOGIS asset rollout. These were (1) Alfred Nzo (DPW), (2) Joe Gqabi Districts (DPW), (3) Sarah Baartman district (DRDAR), (4) In-house construction site – Graaff Reinet (DPW), (5) Alfred Nzo (DPW), (6) Chris Hani (DPW), (7) DSRAC - Nelson Mandela Metro, (8) Amathole – DoH.
Provincial Treasury ensured that financial systems are optimally implemented, utilised, and monitored and that users are supported to achieve credible financial information. Sixty-five (65) formal core financial systems courses on BAS, LOGIS and PERSAL were conducted in venues across the Province in order to strengthen the use of the financial systems.
Through the Data Ware House component of FIS, the unit analysed a number of expenditure items and system balances including a multi-year overtime analysis for several departments. The functions of data analysis and intelligent reporting are assisting in highlighting areas where stricter controls need to be implemented in order to reduce fruitless and wasteful expenditure, unauthorised payments, system abuses, and access violations. To date the unit has done analysis on subsistence and travel, overtime, catering expenditure and salary progression of senior management service members in the Province. From the S & T analysis, forensic investigations on abuse of S & T have been initiated and the development of a Provincial policy on S &T to address the deficiencies inn policies in a number of departments. Awareness on high spending on overtime in departments that are consistently spending highly was raised through letters written to the departments.

ANNUAL REPORT FOR 2018/19 FINANCIAL YEAR - VOTE 12: EASTERN CAPE PROVINCIAL TREASURY56
Strategic Objectives and targets:
Programme Name: Financial Governance
Strategic objectivesActual achievement (2017/18)
Planned Target (2018/19)
Actual achievement (2018/19)
Deviation from planned target to Actual Achievement for 2018/19
Comments on Deviation
1.
To promote good financial governance and credible financial reporting towards achieving unqualified audit outcomes.
3 departments achieved clean audit opinion, 9 achieved unqualified audit opinion and 1 received a qualified audit opinion.
Extract key commitments from the PAIP, targeting all departments and public entities to be unqualified
3 departments and 5 public entities achieved clean audit opinion, 7 departments and 5 public entities achieved unqualified audit opinion.
3 departments and 1 public entity received a qualified audit opinion and 1 department (DoE) is not complete with audit yet.
While the regression is concerning, since the trend is repeating, there is a commitment to meet the target in the next financial year.
2.
To improve levels of accountability on the use of public funds, thereby encouraging a service orientated financial management and governance.
0Exceptions on the FM standards reduced by 70%
0 -70%
Database of FMstandards notdeveloped as planned. Focus was more on the implementation ofthe limited standardsoutlined in the FMAF.
3.
To promote effective governance practices in the Province
100%
Implement impact indicators (Conduct impact assessment) for IA, RM, AC & RMC
0 -100%
Impact assessment not conducted as planned. Focus was more on the functionality of governance structures.
4.
To promote the production of credible financial information from the Financial Information Systems utilised in the Eastern Cape to inform planning and decision making
11 departments complied with user account management procedure
12 departments comply with user account management procedure
12 departments complied with user account management procedure
0
Minimum set of security controls specified in instruction notes which were issued out for implementation to departments
Implement the plan for minimum set of controls to improve systems security to full maturity in line with ICT Governance Framework
Minimum set of security controls specified in instruction notes were issued out to departments and monitored quarterly
0

ANNUAL REPORT FOR 2018/19 FINANCIAL YEAR - VOTE 12: EASTERN CAPE PROVINCIAL TREASURY 57
Performance indicators and targets:
Performance indicator
Actual Achieve-ment (2015/16
Actual Achieve-ment (2016/17)
Actual Achieve-ment (2017/18)
Planned Target (2018/19)
Actual Achieve-ment (2018/19)
Devia-tion from planned target to Actual Achieve-ment for 2018/19
Comments on deviations
SUB-PROGRAMME 4.1 : ACCOUNTING SERVICES
1Consolidated Provincial AFS are tabled to the Legislature
1 1 1 1 1 0
2Number of quarterly reports on Interim Financial Statements
- - 2 2 2 0
3
Provincial Audit Improvement Plan developed and quarterly reports on its implementation prepared
3 3 3 3 3 0
SUB-PROGRAMME 4.2 : NORMS AND STANDARDS
1.
Number of quarterly reports on implementation of Financial Management Accountability Model in all departments
- - 4 4 4 0
2.Number of Reports on implementation of capacity study.
- - 4 4 4 0
SUB-PROGRAMME 4.3 : RISK MANAGEMENT
1.Number of reports on Risk Management Activities
- - 4 4 4 0
SUB-PROGRAMME 4.4 : PROVINCIAL INTERNAL AUDIT SERVICES
1.Number of reports on Internal Audit Activities.
- - 4 4 4 0
2.Number of reports on Forensic Audit Activities.
- - 4 4 4 0
SUB-PROGRAMME 4.5 : SUPPORTING AND INTERLINKED SYSTEMS
1.Report on Data Warehouse and Business Intelligence findings
4 4 4 4 4 0
2.
Number of departments monitored on effective user account management
- 14 14 13 14 1
The unit was able to support and monitor an additional department (Provincial Legislature).
3.Number of LOGIS sites supported on the LOGIS roll-out project.
12 15 17 10 10 0

ANNUAL REPORT FOR 2018/19 FINANCIAL YEAR - VOTE 12: EASTERN CAPE PROVINCIAL TREASURY58
Strategy to overcome areas of underperformance
All the planned targets for the year under review were achieved, however, the programme will continue to explore avenues for continuous improvement towards the outcomes, as espoused in the strategic objectives.
Changes to planned targets
There were no changes to planned targets.
Linking performance with budgets
For the year under review, the programme achieved 37 (100%) of the 37 planned Annual Performance Plan (APP) targets and spent R76.889 million (98.8%) of the adjusted budget of R77.802 million with an under expenditure of R913 000.
Table 2.3.2 below outlines programme expenditure per sub-programme. Underspending in goods and services is due to the following:
• Computer services due to invoice processed for annual BAS licenses being lower than anticipated,
• Travel and subsistence due to cancellation of BAS training resulting from electricity challenges as well as official trips which could not be undertaken due to unforeseen circumstances
• Operating payments due to provision made for resettlement cost which was not utilised as anticipated.
Other items that contributed to underspending include:
• Compensation of employees is due to staff attrition as well as the unavailability of suitable candidates
• Transfers and subsidies due to an official retiring later than anticipated affecting leave gratuity payments.
Table 2.3.4: Sub-programme expenditure
PROGRAMME 4
2018/2019 2017/2018
Final Appropriation
Actual Expenditure
(Over)/Under Expenditure
Final Appropriation
Actual Expenditure
(Over)/Under Expenditure
(R’000) (R’000) (R’000) (R’000) (R’000) (R’000)
Programme Support 17 930 17 774 156 20 422 18 944 1 478
Accounting Services 13 016 12 800 216 14 313 13 771 542
Norms and Standards 6 925 6 899 26 8 366 8 237 129
Risk Management 4 202 4 191 11 4 047 3 778 269
Provincial Internal Audit Services 12 581 12 539 42 15 629 14 748 881
Supporting and Interlinked Financial Systems
23 148 22 686 462 22 385 21 328 1 057
Programme Total 77 802 76 889 913 85 162 80 806 4 356

ANNUAL REPORT FOR 2018/19 FINANCIAL YEAR - VOTE 12: EASTERN CAPE PROVINCIAL TREASURY 59
2.4.5. Programme 5: Municipal Financial GovernancePurpose:
Provides support to the achievement of sound and sustainable financial management at municipal level through the provision of technical support, and capacity building in the following areas: budgeting, accounting practices, supply chain management, asset management, as well as MFMA compliance.
The programme consists of 3 sub-programmes, namely:
Programme Support Provides strategic leadership in implementing strategies to ensure the
programme’s contribution in realising departmental objectives.
Municipal Budget and
Institutional Governance
To monitor the implementation of the budgeting frameworks, coordinate, monitor and report on MFMA.
Municipal Accounting and
Reporting
Ensures that accounting and financial reporting of municipalities is according to the prescribed Generally Recognised Accounting Practices (GRAP) and assists municipalities in complying with Supply Chain Management and Asset Management regulations.
Strategic Objectives:
• To improve accessibility to social infrastructure in municipalities.
• To improve municipal financial performance and governance towards effective and efficient use of public resources.
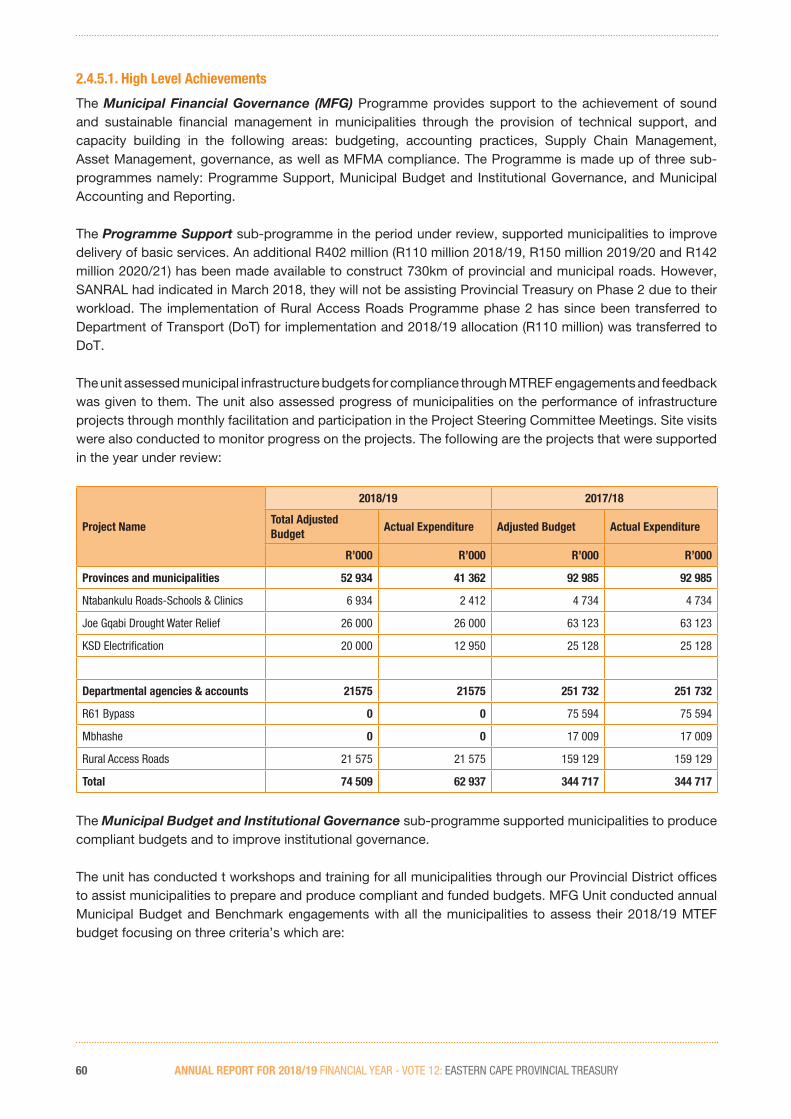
ANNUAL REPORT FOR 2018/19 FINANCIAL YEAR - VOTE 12: EASTERN CAPE PROVINCIAL TREASURY60
2.4.5.1. High Level Achievements
The Municipal Financial Governance (MFG) Programme provides support to the achievement of sound and sustainable financial management in municipalities through the provision of technical support, and capacity building in the following areas: budgeting, accounting practices, Supply Chain Management, Asset Management, governance, as well as MFMA compliance. The Programme is made up of three sub-programmes namely: Programme Support, Municipal Budget and Institutional Governance, and Municipal Accounting and Reporting.
The Programme Support sub-programme in the period under review, supported municipalities to improve delivery of basic services. An additional R402 million (R110 million 2018/19, R150 million 2019/20 and R142 million 2020/21) has been made available to construct 730km of provincial and municipal roads. However, SANRAL had indicated in March 2018, they will not be assisting Provincial Treasury on Phase 2 due to their workload. The implementation of Rural Access Roads Programme phase 2 has since been transferred to Department of Transport (DoT) for implementation and 2018/19 allocation (R110 million) was transferred to DoT.
The unit assessed municipal infrastructure budgets for compliance through MTREF engagements and feedback was given to them. The unit also assessed progress of municipalities on the performance of infrastructure projects through monthly facilitation and participation in the Project Steering Committee Meetings. Site visits were also conducted to monitor progress on the projects. The following are the projects that were supported in the year under review:
Project Name
2018/19 2017/18
Total Adjusted Budget
Actual Expenditure Adjusted Budget Actual Expenditure
R’000 R’000 R’000 R’000
Provinces and municipalities 52 934 41 362 92 985 92 985
Ntabankulu Roads-Schools & Clinics 6 934 2 412 4 734 4 734
Joe Gqabi Drought Water Relief 26 000 26 000 63 123 63 123
KSD Electrification 20 000 12 950 25 128 25 128
Departmental agencies & accounts 21575 21575 251 732 251 732
R61 Bypass 0 0 75 594 75 594
Mbhashe 0 0 17 009 17 009
Rural Access Roads 21 575 21 575 159 129 159 129
Total 74 509 62 937 344 717 344 717
The Municipal Budget and Institutional Governance sub-programme supported municipalities to produce compliant budgets and to improve institutional governance.
The unit has conducted t workshops and training for all municipalities through our Provincial District offices to assist municipalities to prepare and produce compliant and funded budgets. MFG Unit conducted annual Municipal Budget and Benchmark engagements with all the municipalities to assess their 2018/19 MTEF budget focusing on three criteria’s which are:

ANNUAL REPORT FOR 2018/19 FINANCIAL YEAR - VOTE 12: EASTERN CAPE PROVINCIAL TREASURY 61
• Credibility, to test if the municipal budget is funded in terms of section 18 of the MFMA, the budget process on political guidance, leadership and oversight to ensure Council’s adopted Schedule of Key Deadlines are met;
• Relevance, to test if the MTREF Budget is aligned to Council’s Strategic Objectives included in the Integrated Development Plan against the National Development Plan and Provincial and Growth Development Strategies; and
• Sustainability, to determine whether the 2018/19 MTREF Budget gives effect to the long-term financial and operational sustainability of the municipality and if the budget is a multi-year. The budget is analysed over the MTREF period.
With regards to the three assessment criteria’s:
• On credibility, out of 36 delegated municipalities, 16 municipality’s budgets were assessed and found to be unfunded, and one municipality (Inxuba Yethemba Local Municipality) started their IDP/Budget consultation process in March 2019 instead of September 2018. Generally, most municipalities do not meet their own key schedule of deadlines adopted by council. District offices conducted several specific support areas to the 16 unfunded budget and in addition the MEC had engagements with the sixteen (16) municipalities which resulted in improvement during the 2018/19 Adjustment Budget where three (3) from the sixteen (16) municipalities adopted funded Adjustment Budget.
• With regards to relevance, very few municipalities are generally doing satisfactorily to align council’s strategic objective with the NDP and Provincial Growth and Developments Strategies. With the joint support from CoGTA and the Office of the Premier (OTP), municipalities were engaged to provide support on the alignment of strategic objective across the three sphere of government during the budget and benchmark engagements. Municipality’s spatial targeted budget allocation remains not clear on their allocation criteria given their strategic intent. CoGTA, OTP and Provincial Treasury are finalising the local government and provincial government budget and planning process to achieve clear integrated planning; and
• With regards to sustainability, municipalities 2018/19 MTREF budget are mostly funded for a single year instead of the full three years. In some of the municipalities that were assessed, it was observed that their funded status was not sustainable and required stringent and prudent financial management to avoid cash flow worsening. MFG has supported municipalities with their financial recovery plans, cost reflective tariffs, implementation of cost containment measures and guided on the reprioritisation of expenditure allocation in order to remain financially stable. For the 2019/20 financial year, MFG will support municipalities with long term financial planning framework and assist with the budget allocation efficacy.
The MFG Unit concluded the 2018/19 midyear budget and performance assessment and engagements in all municipalities on the 2017/18 audited performance and mainly the half year performance. Municipalities were assisted to improve their performance to ensure they meet their Service Delivery and Budget Implementation Plans (SDBIP). Municipality’s performance for the first six months of the 2018/19 year was not satisfactory in the area of revenue collection (turning revenue into cash), achieving service delivery targets and capital infrastructure spending especially on conditional grants such as Municipal Infrastructure Grants where about 20 municipalities were at risk of losing the MIG grant funding. The MFG unit in conjunction with CoGTA will be rolling out the DoRA framework to councillors in 2019/20 as awareness and capacity building to improve the spending and project planning.
Two municipalities were supported with internal audit quality assurance while all 36 municipalities were assessed on the level at which municipalities addressed the internal audit unit findings and the Auditor General Findings.
ANNUAL REPORT FOR 2018/19 FINANCIAL YEAR - VOTE 12: EASTERN CAPE PROVINCIAL TREASURY62
In most areas, it was noted that management in municipalities are not fully addressing these findings which is a cause for unfavourable outcomes in municipalities. Municipalities were supported in the reviews of the risk registers for the year under review.
The unit continuously engage with municipalities that reflects underperformance in all grants and there is collaboration with the following departments; CoGTA, DWS, ECPT, DoE, OTP, SALGA.
MFG facilitated engagements with municipalities and departments on a quarterly basis through the District Debt Forums to discuss the arrears and resolve issues that results in non-payments by the departments. Furthermore, the unit has CFO support that facilitates one on one sessions in a form of Task Teams between the municipalities and the departments to facilitate working session on departmental debts. To improve revenue management in municipalities, support has also been provided to municipalities to develop Revenue Enhancement Strategies and Financial Recovery Plans.
In 2018 the unit conducted re-assessments on the FMCMM in municipalities. The FMCMM serves as an effective tool to measure areas requiring municipal attention. The outcomes of the re-assessment reflected improvements on the level of maturity on certain modules whilst regression on other modules were noted when compared to 2015 when the initial FMCMM assessment was conducted. With the support of MFG districts offices each municipality was required to develop action plans to implement recommendations based on challenges since original assessment for improvements.
The Municipal Accounting and Reporting sub-programme supported municipalities to develop GRAP compliant Annual Financial Statements. The unit assisted municipalities to develop GRAP compliant AFS by rolling out workshops and conducting AFS readiness engagements and also monitored the successful implementation of mSCOA. The mSCOA Project Team meetings are held monthly to discuss the progress on the mSCOA implementation by municipalities in the province and each District Champion present monthly progress reports.
Finally, the unit supported municipalities to upload mSCOA data strings that are required by National Treasury as part of monthly reporting (Section 71 – IYM Reporting) as well as providing guidance on the development of the mSCOA Project File in preparation for the audit. There were also mSCOA engagements with both Municipalities and the Financial Systems Vendors to discuss the overall progress of Municipalities to implement mSCOA their challenges and mitigating strategies.

ANNUAL REPORT FOR 2018/19 FINANCIAL YEAR - VOTE 12: EASTERN CAPE PROVINCIAL TREASURY 63
Strategic Objectives and targets:
Programme Name: Municipal Financial Governance
Strategic objectivesActual achievement (2017/18)
Planned Target (2018/19)
Actual achievement (2018/19)
Deviation from planned target to Actual Achievement for 2018/19
Comments on Deviation
1.To improve accessibility to social infrastructure in municipalities
17 municipalities with improvedSocial infrastructure spending and delivery of basic services
18 municipalities with improvedSocial infrastructure spending and delivery of basic services
13 5
The reason for deviation is due to the fact SANRAL indicated in March 2018 they could not assist ECPT to implement the programme anymore.The five (5) municipalities are being implemented by Department of Transport (DoT) as the function has been shifted to DoT.
2.
To improve municipal financial performance and governance towards effective and efficient use of public resources.
21 municipalities with improved financial performance and governance
23 municipalities with improved financial performance and governance
23 0
Performance indicators and targets:
Performance indicator
Actual Achieve-ment (2015/16
Actual Achieve-ment (2016/17)
Actual Achieve-ment (2017/18)
Planned Target (2018/19)
Actual Achieve-ment (2018/19)
Devia-tion from planned target to Actual Achieve-ment for 2018/19
Comments on deviations
SUB-PROGRAMME 5.1 : PROGRAMME SUPPORT
1.
Number of municipalities with improved access to service
9 16 17 18 13 5
SANRAL had indicated in March 2018 that, they won’t be an Implementing Agent for Rural Access Roads programme phase 2 during 2018/19. The function has been shifted to Department of Transport (DoT), therefore ECPT will not be able to achieve the 18 target (hence the variance)Funds allocated for 2018/19 have been transferred to DoT, to cover the outstanding targets. Departmental transfers are managed by Programme 2.
SUB-PROGRAMME 5.2 : MUNICIPAL BUDGET AND INSTITUTIONAL GOVERNANCE
1.
Number of municipalities supported to produce compliant budgets.
41 36 36 36 36 0
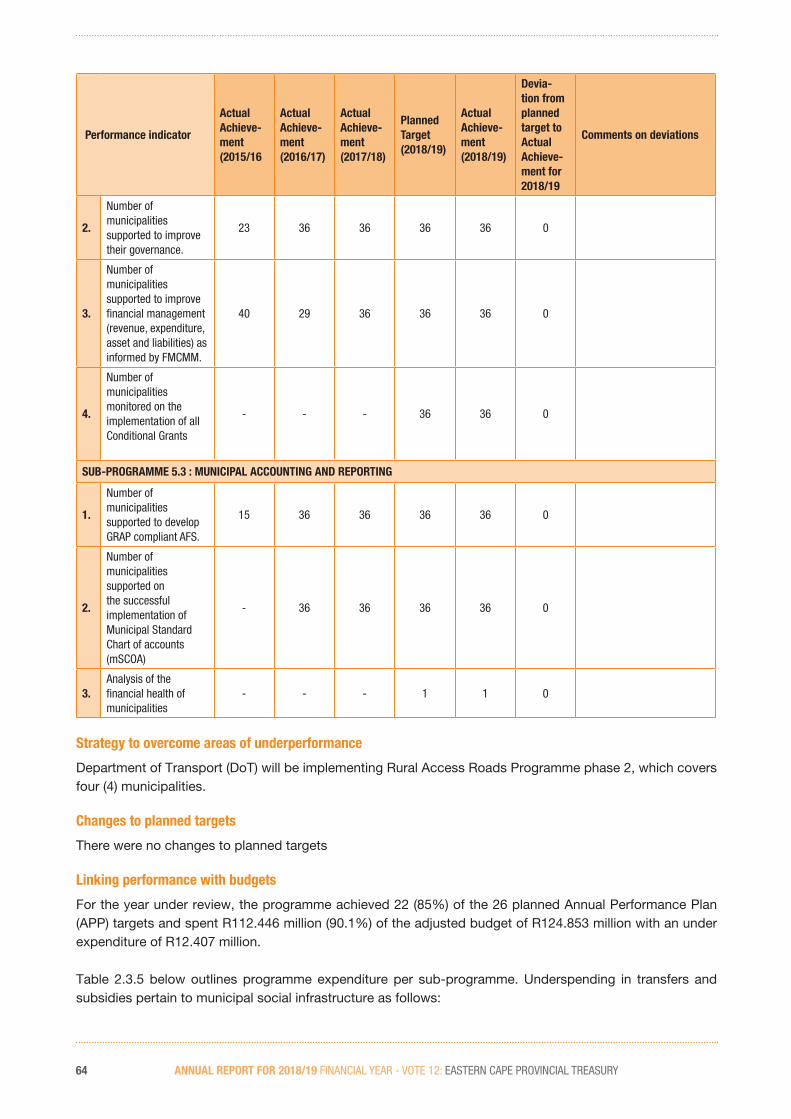
ANNUAL REPORT FOR 2018/19 FINANCIAL YEAR - VOTE 12: EASTERN CAPE PROVINCIAL TREASURY64
Performance indicator
Actual Achieve-ment (2015/16
Actual Achieve-ment (2016/17)
Actual Achieve-ment (2017/18)
Planned Target (2018/19)
Actual Achieve-ment (2018/19)
Devia-tion from planned target to Actual Achieve-ment for 2018/19
Comments on deviations
2.
Number of municipalities supported to improve their governance.
23 36 36 36 36 0
3.
Number of municipalities supported to improve financial management (revenue, expenditure, asset and liabilities) as informed by FMCMM.
40 29 36 36 36 0
4.
Number of municipalities monitored on the implementation of all Conditional Grants
- - - 36 36 0
SUB-PROGRAMME 5.3 : MUNICIPAL ACCOUNTING AND REPORTING
1.
Number of municipalities supported to develop GRAP compliant AFS.
15 36 36 36 36 0
2.
Number of municipalities supported on the successful implementation of Municipal Standard Chart of accounts (mSCOA)
- 36 36 36 36 0
3.Analysis of the financial health of municipalities
- - - 1 1 0
Strategy to overcome areas of underperformance
Department of Transport (DoT) will be implementing Rural Access Roads Programme phase 2, which covers four (4) municipalities.
Changes to planned targets
There were no changes to planned targets
Linking performance with budgets
For the year under review, the programme achieved 22 (85%) of the 26 planned Annual Performance Plan (APP) targets and spent R112.446 million (90.1%) of the adjusted budget of R124.853 million with an under expenditure of R12.407 million.
Table 2.3.5 below outlines programme expenditure per sub-programme. Underspending in transfers and subsidies pertain to municipal social infrastructure as follows:

ANNUAL REPORT FOR 2018/19 FINANCIAL YEAR - VOTE 12: EASTERN CAPE PROVINCIAL TREASURY 65
King Sabata Dalindyebo (KSD) Electrification project under-performance was due to the contractor who experienced cash-flow challenges as well as ongoing municipal strike which prevented the contractor in continuing with the work on site. Municipality has since dealt with all of these challenges and the contractor is back on site to complete the outstanding works as per the contract.
Ntabankulu Internal Roads project underperformance was due to technical discrepancies on the payment certificate such as retention and surety amount which were not deducted. This was since addressed, the payment certificate was revised and submitted for payment. Other items that contributed to underspending include:
Compensation of employees is due to staff attrition
Goods and services due to officials trips which were not undertaken due to the unavailability of stakeholders affecting travel and subsistence costs.
Table 2.3.5: Sub-programme expenditure
PROGRAMME 5
2018/2019 2017/2018
Final Appropriation
Actual Expenditure
(Over)/Under Expenditure
Final Appropriation
Actual Expenditure
(Over)/Under Expenditure
(R’000) (R’000) (R’000) (R’000) (R’000) (R’000)
Programme Support 85 556 73 601 11 955 355 189 354 996 193
Municipal Budget and Institutional Governance
20 518 20 283 235 19 698 19 608 90
Municipal Accounting and Reporting
18 779 18 562 217 17 402 17 357 45
Programme Total 124 853 112 446 12 407 392 289 391 961 328

ANNUAL REPORT FOR 2018/19 FINANCIAL YEAR - VOTE 12: EASTERN CAPE PROVINCIAL TREASURY66
2.4.6. Transfer payments2.4.6.1. Transfer payments to Public Entities
There were no transfer payments to public entities in the year under review.
2.4.6.2. Transfer payments to all organisations other than public entities
Transfer payments consist of television license payments to South African Broadcasting Corporation (SABC), skills development levies to Finance and Accounting Services Sector Education and Training Authority (FASSET), leave gratuities to employees exiting the government service, bursary payments to tertiary institutions in respect of external bursary recipients and social infrastructure transfers to South African National Road Agency Limited (SANRAL) and municipalities.
Table 2.3.6: The table below reflects the transfer payments made for the period 1 April 2018 to 31 March 2019
Name of transferee
Type of organisation
Purpose for which the funds were used
Did the dept. comply with s 38 (1) (j) of the PFMA
Amount transferred Amount spent
by the entity
Reasons for the funds unspent by the entity(R’000)
SABCDepartmental Agency
Television Licencing
n/a 2 n/a n/a
FASSETDepartmental Agency
Skills Development Levy
n/a 828 n/a n/a
Ex-employees Households Leave Gratuity n/a 2 795 n/a n/a
Tertiary Institution
HouseholdsBursaries - Non-employees
n/a 779 n/a n/a
SANRALDepartmental Agency
Municipal Social Infrastructure- Roads
n/a 21 575 21 575 n/a
Joe Gqabi Municipality
MunicipalityMunicipal Social Infrastructure- Drought Relief
n/a 26 000 26 000 n/a
King Sabata Dalindyebo Municipality
MunicipalityMunicipal Social Infrastructure- Electrification
n/a 12 950 12 950 n/a
Ntabankulu Municipality
Municipality
Municipal Social Infrastructure- Access Roads and Storm Water Drainage
n/a 2 412 2 412 n/a
2.4.7. Conditional Grants
There were no conditional grants for the department in the 2017/18 financial year.
2.4.8. Donor Funds
Provincial Treasury embarked on an evaluation project to assess the effectiveness of Co-operatives Funding in the Eastern Cape in 2018/19. National Treasury expressed interest in the project and offered to fund the evaluation study through donor funds from the Belgian/South African Study and Consultancy Fund.

ANNUAL REPORT FOR 2018/19 FINANCIAL YEAR - VOTE 12: EASTERN CAPE PROVINCIAL TREASURY 67
2.4.9. Capital Investment2.4.9.1. Capital investment, maintenance and asset management plan
For the year under review the department procured movable assets to the value of R9.554 million. The R9.554 million includes an amount of R1.515 million in respect of finance lease payments for motor vehicles and cellular phones.
Infrastructure transfers were made to municipalities and departmental agencies as indicated in table 2.3.6 above.
Table 2.3.7: The table below reflects the infrastructure transfer payments made for the period 1 April 2018 to 31 March 2019.
Infrastructure projects
2018/2019 2017/2018
Final Appropriation
Actual Expenditure
(Over)/Under Expenditure
Final Appropriation
Actual Expenditure
(Over)/Under Expenditure
R’000 R’000 R’000 R’000 R’000 R’000
Infrastructure transfer
- Capital 74 509 62 937 11 572 344 717 344 717 0
Total 74 509 62 937 11 572 344 717 344 717 0

69
EASTERN CAPEPROVINCIAL TREASURY
2018/19
ANNUAL REPORTVOTE 12
PART C: GOVERNANCE

70 ANNUAL REPORT FOR 2018/19 FINANCIAL YEAR - VOTE 12: EASTERN CAPE PROVINCIAL TREASURY

ANNUAL REPORT FOR 2018/19 FINANCIAL YEAR - VOTE 12: EASTERN CAPE PROVINCIAL TREASURY 71
3.1. INTRODUCTIONProvincial Treasury is committed to maintain the highest standards of governance and has subsequently complied with the Public Finance Management Act, Act 1 of 1999 and the National Treasury regulations.
During the 2018/19 financial year the department’s management, Audit Committee and the Risk Management Committee worked on addressing internal control deficiencies identified in the previous audit. Efforts undertaken enabled transparency and improved accountability thereby strengthening the internal control systems in order to ensure that public finances and resources are effectively, efficiently, and economically used.
3.2. RISK MANAGEMENTRisk management is the systematic process of understanding, evaluating and addressing risks in order to maximise the likelihood of objectives being achieved and ensuring organisations, individuals and communities are sustainable.
During the year, the department continued to implement its risk management policies and strategy by conducting the strategic and the operational risk assessments. Risk Management reporting is undertaken on a quarterly basis to enable effective risk management and the identification of emerging risks.
The established Risk Management Committee (RMC) comprised an independent chairperson and the programme heads. The RMC chairperson updates the audit committee on a quarterly basis discussing inter alia risk identification reviews and mitigating plans, and the maturity of risk management in the department.
The inclusion of the programme managers in the RMC has resulted in a more participative risk management process. As part of effective enterprise-wide risk management, the department has established fraud and corruption risk management measures.
3.3. FRAUD AND CORRUPTION Incidents of fraud and corruption in the public sector negatively impact on the economy, lower investment levels, and reduce public finances.
The department is pro-actively managing, monitoring, and reporting on its fraud and corruption mitigating actions by:
• Ensuring that the department has implemented a fraud prevention policy and plan.
• Implementing reporting mechanisms for fraud and corruption through the national anti-corruption hotline, Office of the Head of Department, Office of the Public Protector and the Office of the Auditor-General.
• In addition to reporting suspected fraud and corruption to the national hotline, staff are encouraged to make disclosures through internal mechanisms such as internal audit, legal services, and security management.
• Investigating alleged fraud and corruption cases and reporting relevant cases to the relevant institution depending on the outcome of the preliminary investigation.

ANNUAL REPORT FOR 2018/19 FINANCIAL YEAR - VOTE 12: EASTERN CAPE PROVINCIAL TREASURY72
3.4. MINIMISING CONFLICT OF INTERESTA conflict of interest arises when financial or other private interest or undertaking that could directly or indirectly compromise the performance of the public servant’s duties or the reputation of a public servant’s department in its relationship with its stakeholders, takes place.
Conflict of interest is minimised through the utilisation of annual financial declarations, maintenance of a gift register and a declaration of interest form (ECBD4) for all procurement undertaken.
In the previous financial year, the annual financial declarations have been extended to include all financial personnel, supply chain management personnel and all officials above a salary level 7.
3.5. CODE OF CONDUCTThe department adopted the Code of Conduct for the Public Service, issued by the public service Commission, as its Code of Conduct. A copy of the Code of Conduct is made available to newly appointed employees on their reporting for duty. Further, workshops on the Code of Conduct are conducted at least twice in each financial year, in order to create awareness on the contents and the expectations arising from the Code of Conduct
3.6. HEALTH SAFETY AND ENVIRONMENTAL ISSUESThe department has a functioning Health and Safety committee that advises management on issues relating to health safety and environment. This committee sits quarterly and produces a report, which is sent to management on health safety and environmental matters raised in that report.
The Directorate conducted a successful emergency evacuation drill was conducted in March 2019. A report was submitted to management and the SHERQ committee indicating the areas that needs improvement. This is in compliance with the Occupational Health and Safety Act. This exercise was testing the readiness of the department to handle emergency situations and identified areas for improvement. It was conducted with the assistance of the provincial disaster and emergency stakeholders. Fire evacuation drills are conducted at least once annually. This is order to prepare employees for fire emergency procedures. The emergency exercise should, ideally, be done in every one or two years. A total of 16 officials from different programs were trained on first aid levels 1,2,3. This is to ensure that injuries on duty are effectively managed in the department. A total of 16 officials from different programs were trained on first aid levels 1, 2, 3. This is to ensure that injuries on duty are effectively managed in the department.
The Security, Office Support and Auxiliary Services directorate provides an internal enabling environment and support service with regard to physical and information security, occupational health and safety, refurbishments, maintenance, environmental and space management in order for the department pursue its strategic objectives. The unit, in the year under review, conducted information security classification awareness and assisted in information classification. Safety locks were provided to safeguard sensitive information.

ANNUAL REPORT FOR 2018/19 FINANCIAL YEAR - VOTE 12: EASTERN CAPE PROVINCIAL TREASURY 73
3.7. PORTFOLIO COMMITTEESDate Matters raised How the Department addressed the matters raised
October 2018 The Department must monitor and take drastic actions to ensure that the under-expenditure is prevented and that vacant posts are filled.
Although the department plans ahead for the filling of vacancies, staff attrition is always a challenge. The department ensures that vacancies are submitted to Provincial Coordinating Monitoring Team (PCMT) as soon as officials submit their termination documents. There are few posts where the department experienced delays in filling them due to the scarcity of skills. In those instances, the Recruitment Agencies were engaged and consequently those posts were re-advertised to attract a pool of potential candidates. The department monitors the filling of posts closely to ensure that posts are filled timeously to ensure continuous service delivery.
Provincial Treasury, together with the Office of the Premier and the Department of Public Works, should ensure that spending is according to plan with respect to infrastructure projects.
Currently the Infrastructure Reporting Model (IRM) is being used to monitor that the infrastructure spending is in line with the projections.
The Department should investigate and submit a report with respect to the Department of Health service delivery model of decentralizing prior to securing sufficient capacity to implement.
The service delivery model as depicted in the Infrastructure Plan was moderated by Provincial Treasury supported by National Department of Health, approved by National Treasury and was regarded as best practice. However, the detailed implementation plan was not costed and resourced. PT will thus engage DoH on this matter and the report will be made available. Currently the Infrastructure Reporting Model (IRM) is being used to monitor that the infrastructure spending is in line with the projections.
Provincial Treasury must liaise with the relevant provincial and national departments and municipalities with a view to quantifying the infrastructural costs of service delivery protests, within 90 days of the adoption of the report in order to budget accurately for future infrastructural replacements.
PT is in the process of compiling a report quantifying the infrastructural costs of service delivery protests, and it will be submitted within the specified timeframes.
The Provincial Treasury must quantify the 28 non-approved requests and must also submit a list of those that proceeded, if any, with deviations albeit with non-approval by the Provincial Treasury.
The Provincial Treasury has quantified the 28 non-approved requests and submitted a list of those that proceeded, if any, with deviations albeit with non-approval by the Provincial Treasury.
The Department, together with the Office of the Premier (OTP), should expedite the review of these structures to ensure SCM alignment.
The Department, together with the Office of the Premier (OTP), is expediting the review of these structures to ensure SCM alignment.
The Provincial Treasury should engage the Department of Education and ensure that the impasse around the filling of this post is resolved by 31 January 2019.
The Provincial Treasury engaged the Department of Education as a result the post has been filled.
The Department must ensure that it spends according to projections and that training is conducted.
The programme will ensure that spending is according to the projections and that training is conducted.
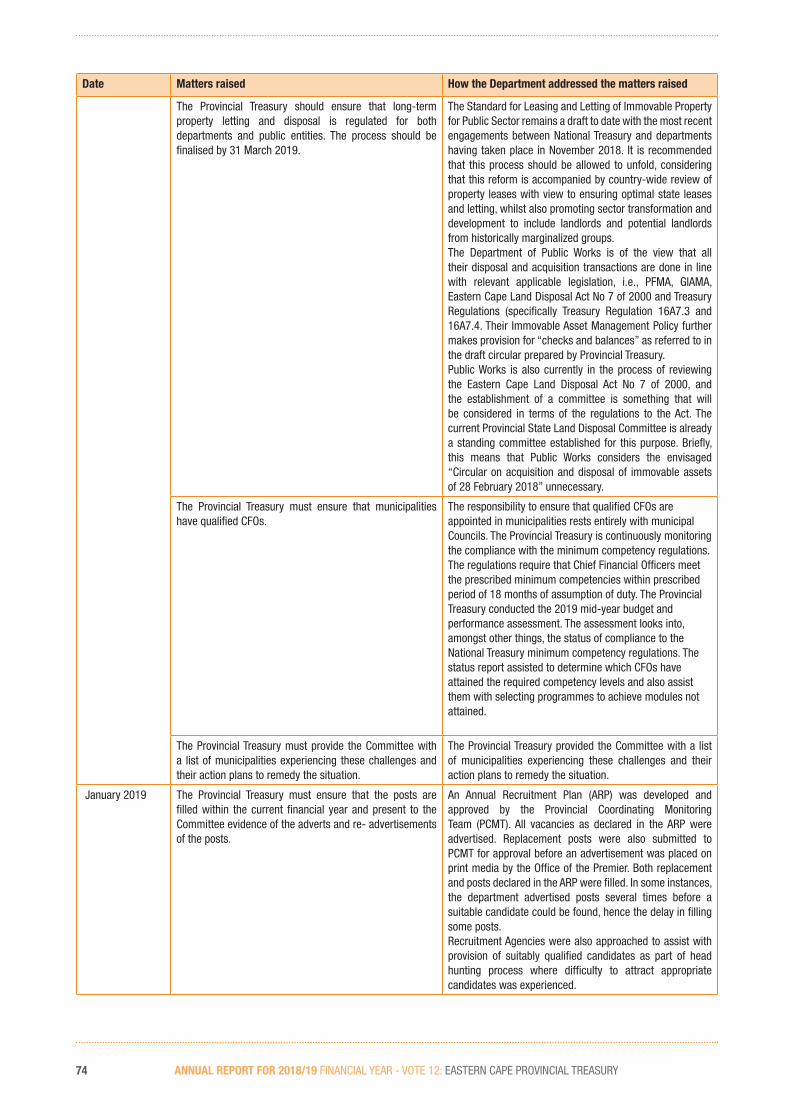
ANNUAL REPORT FOR 2018/19 FINANCIAL YEAR - VOTE 12: EASTERN CAPE PROVINCIAL TREASURY74
Date Matters raised How the Department addressed the matters raised
The Provincial Treasury should ensure that long-term property letting and disposal is regulated for both departments and public entities. The process should be finalised by 31 March 2019.
The Standard for Leasing and Letting of Immovable Property for Public Sector remains a draft to date with the most recent engagements between National Treasury and departments having taken place in November 2018. It is recommended that this process should be allowed to unfold, considering that this reform is accompanied by country-wide review of property leases with view to ensuring optimal state leases and letting, whilst also promoting sector transformation and development to include landlords and potential landlords from historically marginalized groups.The Department of Public Works is of the view that all their disposal and acquisition transactions are done in line with relevant applicable legislation, i.e., PFMA, GIAMA, Eastern Cape Land Disposal Act No 7 of 2000 and Treasury Regulations (specifically Treasury Regulation 16A7.3 and 16A7.4. Their Immovable Asset Management Policy further makes provision for “checks and balances” as referred to in the draft circular prepared by Provincial Treasury.Public Works is also currently in the process of reviewing the Eastern Cape Land Disposal Act No 7 of 2000, and the establishment of a committee is something that will be considered in terms of the regulations to the Act. The current Provincial State Land Disposal Committee is already a standing committee established for this purpose. Briefly, this means that Public Works considers the envisaged “Circular on acquisition and disposal of immovable assets of 28 February 2018” unnecessary.
The Provincial Treasury must ensure that municipalities have qualified CFOs.
The responsibility to ensure that qualified CFOs are appointed in municipalities rests entirely with municipal Councils. The Provincial Treasury is continuously monitoring the compliance with the minimum competency regulations. The regulations require that Chief Financial Officers meet the prescribed minimum competencies within prescribed period of 18 months of assumption of duty. The Provincial Treasury conducted the 2019 mid-year budget and performance assessment. The assessment looks into, amongst other things, the status of compliance to the National Treasury minimum competency regulations. The status report assisted to determine which CFOs have attained the required competency levels and also assist them with selecting programmes to achieve modules not attained.
The Provincial Treasury must provide the Committee with a list of municipalities experiencing these challenges and their action plans to remedy the situation.
The Provincial Treasury provided the Committee with a list of municipalities experiencing these challenges and their action plans to remedy the situation.
January 2019 The Provincial Treasury must ensure that the posts are filled within the current financial year and present to the Committee evidence of the adverts and re- advertisements of the posts.
An Annual Recruitment Plan (ARP) was developed and approved by the Provincial Coordinating Monitoring Team (PCMT). All vacancies as declared in the ARP were advertised. Replacement posts were also submitted to PCMT for approval before an advertisement was placed on print media by the Office of the Premier. Both replacement and posts declared in the ARP were filled. In some instances, the department advertised posts several times before a suitable candidate could be found, hence the delay in filling some posts. Recruitment Agencies were also approached to assist with provision of suitably qualified candidates as part of head hunting process where difficulty to attract appropriate candidates was experienced.

ANNUAL REPORT FOR 2018/19 FINANCIAL YEAR - VOTE 12: EASTERN CAPE PROVINCIAL TREASURY 75
Date Matters raised How the Department addressed the matters raised
The programme must ensure that it spends according to projections to prevent under-expenditure at the end of the financial year.
There have been savings realised due to cost containment measures implemented by reducing the scope of the site visits to be limited to local sites.
Treasury should expedite the completion of the rationalisation of public entities and report on progress made.
Provincial treasury submitted the progress report to the Committee upon finalisation.
Provincial Treasury, together with the Department of Health, must ensure that Treasury Regulation 8.2.3 is fully complied with. The Provincial Treasury should also enhance its interaction with suppliers through supplier workshops as well as social media platforms for communication.
Provincial Treasury participates in supplier days arranged by departments and municipalities wherein the issue of supplier registration and data integrity as well as payments to suppliers are discussed. More emphasis was placed on these matters in future sessions. As part of Financial Management Accountability Framework, it will ensure consequence management. Provincial Treasury has started a process of improving governance in order to enhance efficiency in terms of the payments. Provincial Treasury expects that in the 2020/21 financial year this will be implemented.
The Provincial Treasury should ensure that the process of developing a circular to compel all departments to register their investigations with the Provincial Treasury is completed by 31 March 2019.
The task was completed and circulated by 31 March 2019.
The Provincial Treasury should finalise the standardisation of provincial travel policies and be ready to regulate on this matter by 1 April 2019.
As part of the Subsistence & Travel (S&T) substantive review, all the departments S&T policies were reviewed. The departments were advised to align their policies with the National Treasury instruction note of 2017/18 on the national travel policy framework.
The Provincial Treasury should expedite mSCoA compliance by municipalities to improve financial management in municipalities.
There were several engagements between municipalities and their Financial System Vendors facilitated by Provincial Treasury. The purpose of these engagements were to discuss the submission of reports to National Treasury Local Government database and also to assess the functionality of modules on the different Financial Systems utilised by municipalities in the Province.The non-functionality of some modules were raised during the engagements and discussed extensively in order to determine the root-cause of these challenges. It was resolved that Financial System Vendors should develop and implement support plans to address Financial System challenges at municipalities. Provincial Treasury is monitoring this project. Further engagements with Financial System Vendors were held at the National Treasury.Currently, a survey is being conducted by both Provincial and National Treasury to determine mSCOA related costs incurred by municipalities since inception of mSCOA. This process will be able to also determine costs incurred by municipalities that run-parallel systems (using both new financial system and legacy financial system) as this may be regarded as fruitless and wasteful expenditure.

ANNUAL REPORT FOR 2018/19 FINANCIAL YEAR - VOTE 12: EASTERN CAPE PROVINCIAL TREASURY76
3.8. SCOPA RESOLUTIONSThere were no SCOPA resolutions related to the Department for the period under review or outstanding from the previous years.
3.9. PRIOR MODIFICATIONS TO AUDIT REPORTSThere were no prior audit modifications to audit reports.
3.10. INTERNAL CONTROL UNITDuring the period under review the Internal Control Unit continued to ensure that the Department complies with laws and regulations by implementing preventative, investigative and corrective internal controls measures to address and report cases of non-compliance and deviation from normal processes and procedures. This unit has managed the Irregular, Unauthorised, Fruitless and Wasteful Expenditure case files and registers and performed investigations of such on a monthly basis.
It has also conducted investigation of loss control cases until they are finalised and written off where necessary. The unit prepared the Audit Improvement Plan for both the Internal Audit and Auditor General findings. This plan was monitored on a monthly basis to track progress made in resolving the audit findings. The Audit Committee was updated on the status of these findings.
3.11 INTERNAL AUDIT AND AUDIT COMMITTEE3.11.1. INTERNAL AUDIT
The departmental internal audit activity provides independent and objective assurance and consulting services to management on the effectiveness of governance, risk management, and internal control systems to enable the department to meet its objectives. The audit projects were undertaken as per the approved operational audit plan, and the results reported to management and the audit committee. Where areas of improvement have been identified, management continues to implement corrective action.
The overall strategy is to ensure an internal audit activity that can meet stakeholder requirements. The following are critical for the effectiveness of the Internal Audit function:
• An internal audit activity operating on the principles of an independent and objective assurance and consulting activity;
• Adequate resources (staff, hardware, software, funding);
• Relevant methodologies and practices to support the achievement of stakeholder objectives. Aspects which include the:
o Human resources (skills, competencies, professionalism, certifications, empowerment and team cohesion);
o Internal audit tools (hardware, software);
o Administrative practices and methodologies;
o Marketing of the internal audit activity;
o Conformance with the International Professional Practices Framework (IPPF) of the Institute of Internal Auditors and other relevant professional bodies; and
o Adherence to statutory and other profession-related requirements such as the PFMA, MFMA, National Treasury Regulations and King IV Code on Corporate Governance in SA.
ANNUAL REPORT FOR 2018/19 FINANCIAL YEAR - VOTE 12: EASTERN CAPE PROVINCIAL TREASURY 77
The scope of work of the internal audit activity is to determine whether the departmental system of internal control, risk management, and governance processes are designed, implemented, and maintained by management and whether these controls are adequate and functioning in a manner that ensures that:
o Risks are appropriately identified and adequately mitigated;
o Significant financial, managerial, and operating information is accurate, reliable, and timely;
o Compliance to applicable laws and regulations, and policies and procedures is enforced;
o Resources are acquired economically, utilised efficiently, and adequately safeguarded;
o Quality and continuous improvement is fostered in departmental control processes; and
o Pro-active measures are taken to recognise and properly address regulatory and legislative issues, which may affect the department.
The type of audit work performed is based on assurance and consulting reviews and the nature is presented below:
o Assurance services recognise the IAA staff member’s objective evaluation of evidence to provide an independent, objective opinion/conclusion about the department, its operations, functions, processes, systems or other relevant disciplines. The nature and scope of these types of engagement are identified by the IAA and approved by the AC in the annual operational plan.
o Consulting services are advisory in nature and are mostly in response to specific requests by the Executive Authority, HoD, Audit Committee, and management. The nature and scope of these reviews are subject to agreement, and focusses on problem-solving activities to add value.
3.11.2. AUDIT COMMITTEE
The audit committee monitors compliance with applicable laws and regulations, governance processes, and assesses the performance of the risk management unit, and of the internal audit unit. The latter is to determine the levels of effectiveness of these units within the department. The audit committee operates in accordance with an approved charter document and in compliance with the requirements of the PFMA and National Treasury Regulations.
The audit committee is an independent governance structure that provides an oversight role on the financial reporting process, audit process, the process for monitoring compliance with laws and regulations and the code of conduct, the system of internal control, risk management, and governance processes. Governance entails how the department is managed, and includes policies and procedures, the culture, and strategies.
The audit committee also assesses the progress of the internal audit activity on the execution of the risk-based internal audit plan, and assesses the effectiveness of the internal audit unit.
Furthermore, the audit committee provides counsel to the Executive Authority, HoD, and management.
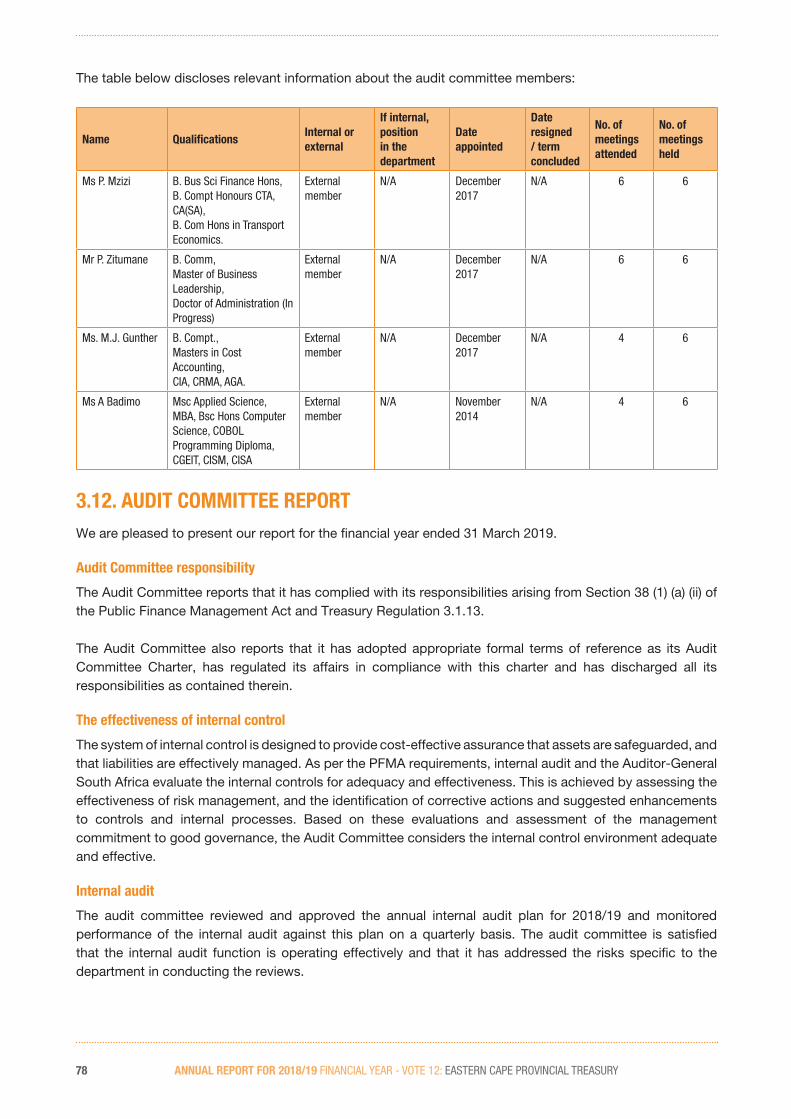
ANNUAL REPORT FOR 2018/19 FINANCIAL YEAR - VOTE 12: EASTERN CAPE PROVINCIAL TREASURY78
The table below discloses relevant information about the audit committee members:
Name QualificationsInternal or external
If internal, position in the department
Date appointed
Date resigned / term concluded
No. of meetings attended
No. of meetings held
Ms P. Mzizi B. Bus Sci Finance Hons, B. Compt Honours CTA, CA(SA),B. Com Hons in Transport Economics.
External member
N/A December 2017
N/A 6 6
Mr P. Zitumane B. Comm,Master of Business Leadership, Doctor of Administration (In Progress)
External member
N/A December 2017
N/A 6 6
Ms. M.J. Gunther B. Compt.,Masters in Cost Accounting, CIA, CRMA, AGA.
External member
N/A December 2017
N/A 4 6
Ms A Badimo Msc Applied Science, MBA, Bsc Hons Computer Science, COBOL Programming Diploma, CGEIT, CISM, CISA
External member
N/A November 2014
N/A 4 6
3.12. AUDIT COMMITTEE REPORTWe are pleased to present our report for the financial year ended 31 March 2019.
Audit Committee responsibility
The Audit Committee reports that it has complied with its responsibilities arising from Section 38 (1) (a) (ii) of the Public Finance Management Act and Treasury Regulation 3.1.13.
The Audit Committee also reports that it has adopted appropriate formal terms of reference as its Audit Committee Charter, has regulated its affairs in compliance with this charter and has discharged all its responsibilities as contained therein.
The effectiveness of internal control
The system of internal control is designed to provide cost-effective assurance that assets are safeguarded, and that liabilities are effectively managed. As per the PFMA requirements, internal audit and the Auditor-General South Africa evaluate the internal controls for adequacy and effectiveness. This is achieved by assessing the effectiveness of risk management, and the identification of corrective actions and suggested enhancements to controls and internal processes. Based on these evaluations and assessment of the management commitment to good governance, the Audit Committee considers the internal control environment adequate and effective.
Internal audit
The audit committee reviewed and approved the annual internal audit plan for 2018/19 and monitored performance of the internal audit against this plan on a quarterly basis. The audit committee is satisfied that the internal audit function is operating effectively and that it has addressed the risks specific to the department in conducting the reviews.

ANNUAL REPORT FOR 2018/19 FINANCIAL YEAR - VOTE 12: EASTERN CAPE PROVINCIAL TREASURY 79
The following internal audit assignments were completed during the year under review and the committee will continue to monitor the progress made against the corrective action plans implemented by management:
• Internal Control Dashboard;
• Asset Register;
• Draft Annual Financial Statements;
• Draft Annual Performance Report;
• Performance Management Contracting;
• Financial Management Capability Maturity Model;
• Risk Management and Fraud Prevention;
• Management Performance Assessment Tool;
• Audit Improvement Plan;
• Interim Financial Statements;
• Audit of Predetermined Objectives;
• Procurement;
• Ethics;
• Asset Control Environment;
• Duplicate Payments;
• Draft Annual Performance Plan; and
• Performance Bonuses and Pay Progression (Levels 1-12).
While the internal control environment is considered effective, improvements are required in the area of ICT governance, user access management, IT services continuity and risk management.
Risk management
Risk management continues to mature in the department. The Audit Committee monitors the achievement of risk management deliverables on a quarterly basis through the review of quarterly risk management progress reports and review of the adequacy of the risk management strategy, policy and plan. Risk management is a permanent agenda item at Audit Committee meetings to ensure continuous risk management oversight.
The department has an established Risk Management Committee chaired by an independent member who is also a member of the Audit Committee.
In-Year Management and Monthly/Quarterly Report
The department reports to the Executive Authority and National Treasury as required by the PFMA. The Audit Committee is satisfied with the content and quality of reports presented. Continuous oversight by the Committee has resulted in improvements in the quality of performance reporting.
ANNUAL REPORT FOR 2018/19 FINANCIAL YEAR - VOTE 12: EASTERN CAPE PROVINCIAL TREASURY80
Evaluation of Financial Statements
The Committee submits that it has:
• Reviewed the 2018/19 unaudited and audited Annual Financial Statements prepared by the department.
• Reviewed the 2018/19 draft and fi nal Annual Performance Report.
The review conclusion was that the draft Annual Performance Report submitted to the AGSA and the draft Annual Financial Statements were of the required standards and met the regulatory requirements.
Auditor-General’s Report
The Audit Committee has met and discussed with the Auditor-General South Africa their audit report, to ensure that there are no unresolved issues. We have also reviewed the management responses to the audit issues raised in the AGSA management report and continuous oversight will be exercised to ensure that unresolved fi ndings are adequately addressed.
We have reviewed the department’s implementation plan for audit issues raised in the previous year and we are satisfi ed that the matters raised were substantially resolved.
The Audit Committee concurs and accepts the conclusions of the Auditor-General on the Annual Financial Statements and is of the opinion that the Audited Annual Financial Statements should be accepted and read together with the report of the Auditor-General.
Appreciation
The Audit Committee expresses its sincere appreciation to the Executive Authority, Accounting Offi cer, AGSA, Management, and internal audit for their support and co-operation.
Pumla Mzizi CA(SA)Chairperson of the Audit Committee Eastern Cape Provincial Treasury31 July 2019
Pumla Mzizi CA(SA)
81
EASTERN CAPEPROVINCIAL TREASURY
2018/19
ANNUAL REPORTVOTE 12
PART D: HUMAN RESOURCE
MANAGEMENT

82 ANNUAL REPORT FOR 2018/19 FINANCIAL YEAR - VOTE 12: EASTERN CAPE PROVINCIAL TREASURY
ANNUAL REPORT FOR 2018/19 FINANCIAL YEAR - VOTE 12: EASTERN CAPE PROVINCIAL TREASURY 83
4.1. INTRODUCTIONThe information contained in this part of the annual report has been prescribed by the Minister for the Public Service and Administration for all departments within the public sector service.
4.2. LEGISLATION THAT GOVERN HR MANAGEMENT The information provided in this part is prescribed by the Public Service Regulations (Chapter 1, Part III J.3 and J.4). In addition to the Public Service Regulations, 2001 (as amended on 30 July 2012), the following legislation governs Human Resource Management within the Public Service:
• Occupational Health and Safety Act 85 of 1993 To provide for the health and safety of persons at work and for the health and safety of persons in
connection with the use of plant and machinery; the protection of persons other than persons at work against hazards to health and safety arising out of or in connection with the activities of persons at work; to establish an advisory council for occupational health and safety; and to provide for matters connected therewith.
• Public Service Act 1994, as amended by Act 30 of 2007 To provide for the organisation and administration of the public service of the Republic, the regulation
of the conditions of employment, terms of office, discipline, retirement and discharge of members of the public service, and matters connected therewith.
• Public Service Regulations, 2016 To regulate the conditions of employment, matters relating to service benefits, resignations, retirement
and discharge of members of the public service.
• Labour Relations Act 66 of 1995 To regulate the relationship between the employer and employees and to guide the employer in
recognising and fulfilling its role in effecting labour peace and the democratisation of the workplace.
• Basic Conditions of Employment Act 75 of 1997 To give effect to the right to fair labour practices referred to in section 23(1) of the Constitution by
establishing and making provision for the regulation of basic conditions of employment; and thereby to comply with the obligations of the Republic as a member state of the International Labour Organisation; and to provide for matters connected therewith.
• Skills Development Act 97 of 1998 To provide an institutional framework to devise and implement national, sector and workplace strategies
to develop and improve the skills of the South African workforce; to integrate those strategies within the National Qualifications Framework contemplated in the South African Qualifications Authority Act, 1995; to provide for Iearnerships that lead to recognised occupational qualifications; to provide for the financing of skills development by means of a levy-grant scheme and a National Skills Fund; to provide for and regulate employment services; and to provide for matters connected therewith.
• Employment Equity Act 55 of 1998 To promote equality, eliminate unfair discrimination in employment and to ensure the implementation of
employment equity measures to redress the effects of discrimination; to achieve a diverse and efficient workforce broadly representative of the demographics of the province.

ANNUAL REPORT FOR 2018/19 FINANCIAL YEAR - VOTE 12: EASTERN CAPE PROVINCIAL TREASURY84
• Public Finance Management Act 1 of 1999 To regulate financial management in the national government and provincial governments; to ensure
that all revenue, expenditure, assets and liabilities of those governments are managed efficiently and effectively; to provide for the responsibilities of persons entrusted with financial management in those governments; and to provide for matters connected therewith.
• Skills Development Levy Act 9 of 1999 To provide any public service employer in the national or provincial sphere of Government with exemption
from paying a skills development levy; and for exemption from matters connected therewith.
• Promotion of Access to Information Act 2 of 2000 To give effect to the constitutional right of access to any information held by the State and any information
that is held by another person and that is required for the exercise or protection of any rights; and to provide for matters connected therewith.
• Promotion of Administrative Justice Act (PAJA) of 2000 To give effect to the right to administrative action that is lawful, reasonable and procedurally fair and to
the right to written reasons for administrative action as contemplated in section 33 of the Constitution of the Republic of South Africa, 1996; and to provide for matters incidental thereto.
Human Resource Strategic Objectives
1.To implement an integrated Human Resource Development strategy that encompasses capacity building programmes, organisational support of training initiatives, governance and economic growth & development
2 To recruit and retain talented human capital
3. Implement Exit Management strategy
4. Development and implementation of Employee Wellness, Health and Safety programs
5. Implement an effective and efficient Performance Management and Development System
6. Review and implement OD and Change Management strategies
7. Implement Employment Equity and Change Management strategies
8. Ensure effective employment relations management
9. Ensure that HR information on PERSAL is credible and correct
10. Implement Talent Management strategy
1. To implement an integrated Human Resource Development strategy that encompasses capacity building programmes, organisational support of training initiatives, governance and economic growth & development
The HRD strategy and plan were developed and implemented during the year under review. The training interventions were incorporated in the Workplace Skills Plan and were consulted with management.
2. To recruit and retain talented human capital The department has an approved Human Capital Resourcing policy which mainly focuses on retention
of talented employees. The policy also highlights the development of females in middle management positions in order for them to be ready for advancement to SMS posts.

ANNUAL REPORT FOR 2018/19 FINANCIAL YEAR - VOTE 12: EASTERN CAPE PROVINCIAL TREASURY 85
3. To implement an integrated Human Resource Development strategy that encompasses capacity building programmes, organisational support of training initiatives, governance and economic growth & development
The strategy was implemented by embarking on capacity building programmes and offering training to departmental employees in terms of the Workplace Skills Plan.
4. Development and implementation of Employee Wellness, Health and Safety programs The Employee Wellness Unit engaged the departmental employees in various programmes to promote
good nutrition, healthy diet and weight control. The unit also promoted the importance of exercise, recreation, healthy habits, relaxation and also promoted diversity through various programmes.
5. Implement an effective and efficient Performance Management and Development System The department has a Performance Management and Development System policy which is being
implemented by the department. The PMDS guidelines were also developed during the year under review aimed at clarifying matters relating to the reward for excellent performance.
6. Review and implement OD and Change Management strategies During the year under review, the department analysed the results of the survey conducted and
thereafter devised a plan to address the areas of improvement identified by staff members. The Change Management Specialist was employed and she conducted consultation sessions with all departmental employees discussing the proposed interventions.
7. Implement Employment Equity strategies The department has an Employment Equity Plan in place. This plan aims to correct the imbalances of the
past in terms of race, gender and disability. The department has to implement and support programmes towards 50/50 gender representation at SMS level. The disability representation has improved and currently standing at 2.0%. The department embarked on a programme of enrolling females at Middle Management to Management Development Programs in order to ensure their readiness for advancement to SMS positions.
8. Ensure that HR information on PERSAL is credible and updated In order to ensure that information captured on PERSAL is correct the PERSAL Management unit
monitored the inputs made to the system. Reports were drawn and analysed regularly. The department has observed that there were improvements in terms of data integrity. This improvement was as a result of the monthly verification of all appointments made by the HR officials. All errors that were detected were therefore rectified as soon as they were identified. Reports were analysed and submitted to the Office of the Premier on a quarterly basis.
9. Ensure effective employment relations management In order to ensure stability of employees, regular meetings with organized labour were held to discuss
matters affecting employees. All issues affecting the employees were discussed in this forum, which was chaired by the HOD with Executive Management and HR as members.
10. Develop and Implement Talent Management strategy The department developed and is implementing a Talent Management Strategy, which mainly focuses on
capacity building and retention of talent for employees that have showed potential to excel in their jobs.
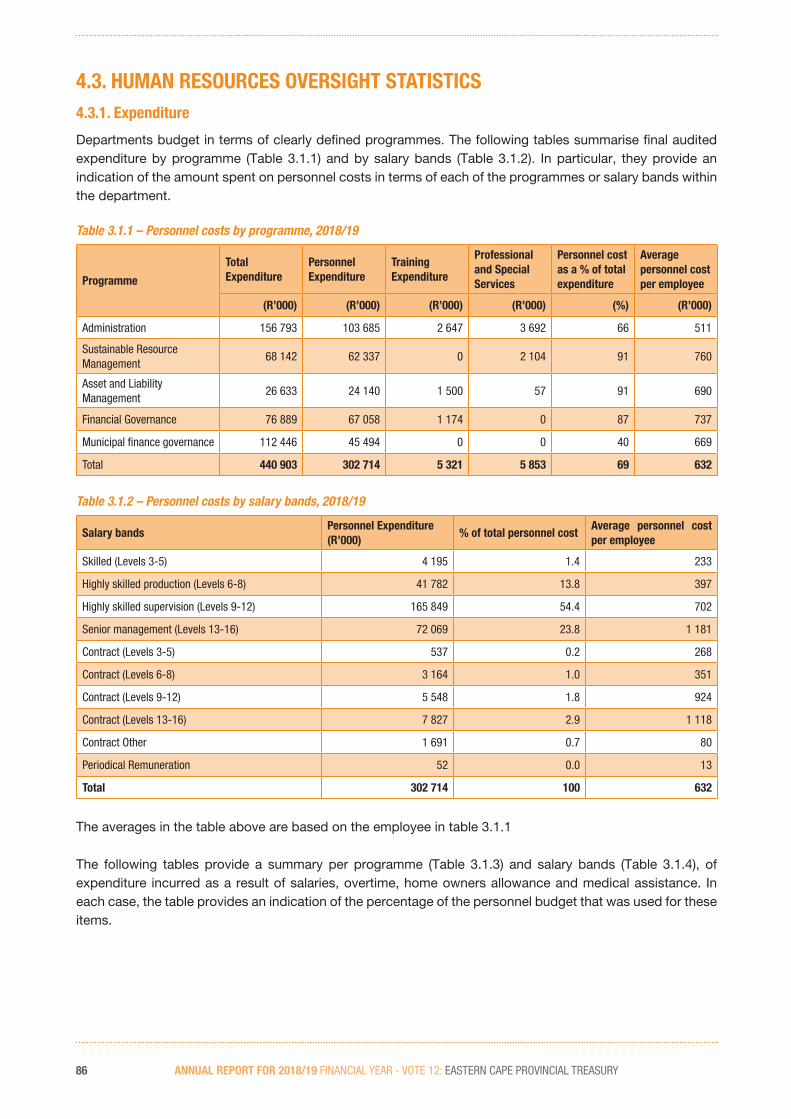
ANNUAL REPORT FOR 2018/19 FINANCIAL YEAR - VOTE 12: EASTERN CAPE PROVINCIAL TREASURY86
4.3. HUMAN RESOURCES OVERSIGHT STATISTICS 4.3.1. Expenditure
Departments budget in terms of clearly defined programmes. The following tables summarise final audited expenditure by programme (Table 3.1.1) and by salary bands (Table 3.1.2). In particular, they provide an indication of the amount spent on personnel costs in terms of each of the programmes or salary bands within the department.
Table 3.1.1 – Personnel costs by programme, 2018/19
Programme
Total Expenditure
Personnel Expenditure
Training Expenditure
Professional and Special Services
Personnel cost as a % of total expenditure
Average personnel cost per employee
(R’000) (R’000) (R’000) (R’000) (%) (R’000)
Administration 156 793 103 685 2 647 3 692 66 511
Sustainable Resource Management
68 142 62 337 0 2 104 91 760
Asset and Liability Management
26 633 24 140 1 500 57 91 690
Financial Governance 76 889 67 058 1 174 0 87 737
Municipal finance governance 112 446 45 494 0 0 40 669
Total 440 903 302 714 5 321 5 853 69 632
Table 3.1.2 – Personnel costs by salary bands, 2018/19
Salary bandsPersonnel Expenditure (R’000)
% of total personnel costAverage personnel cost per employee
Skilled (Levels 3-5) 4 195 1.4 233
Highly skilled production (Levels 6-8) 41 782 13.8 397
Highly skilled supervision (Levels 9-12) 165 849 54.4 702
Senior management (Levels 13-16) 72 069 23.8 1 181
Contract (Levels 3-5) 537 0.2 268
Contract (Levels 6-8) 3 164 1.0 351
Contract (Levels 9-12) 5 548 1.8 924
Contract (Levels 13-16) 7 827 2.9 1 118
Contract Other 1 691 0.7 80
Periodical Remuneration 52 0.0 13
Total 302 714 100 632
The averages in the table above are based on the employee in table 3.1.1
The following tables provide a summary per programme (Table 3.1.3) and salary bands (Table 3.1.4), of expenditure incurred as a result of salaries, overtime, home owners allowance and medical assistance. In each case, the table provides an indication of the percentage of the personnel budget that was used for these items.

ANNUAL REPORT FOR 2018/19 FINANCIAL YEAR - VOTE 12: EASTERN CAPE PROVINCIAL TREASURY 87
Table 3.1.3 – Salaries, Overtime, Home Owners Allowance and Medical Assistance by programme, 2018/19
Programme
Salaries OvertimeHome Owners
AllowanceMedical Assistance
Amount
Salaries as a % of personnel
cost
Amount
Overtime as a % of personnel
cost
AmountHOA as a % of
personnel cost
Amount
Medical Assistance as a % of personnel
cost
(R’000) % (R’000) % (R’000) % (R’000) %
P1: Administration 88 775
85.6 76 0.1 2 160 2.1 3 472 3.3
P2: Sustainable Resource Management
53 876 86.5 0 0 1 170 1.9 1 618 2.6
P3: Asset and Liability Management 20 020 82.9 0 0 600 2.5 694 2.9
P4: Financial Governance 58 993 88.0 0 0 698 1.0 1 353 2.0
P5: Municipal Financial Governance 39 775
87.4 0 0 776 1.7 881 1.9
TOTAL 261 439 86.4 76 0 5 404 1.8 8 018 2.6
Table 3.1.4 – Salaries, Overtime, Home Owners Allowance and Medical Assistance by salary bands, 2018/19
Salary Bands
Salaries OvertimeHome Owners Allowance
Medical Assistance
Amount
Salaries as a % of personnel
cost
Amount
Overtime as a % of personnel
cost
AmountHOA as a % of
personnel cost
Amount
Medical Assistance as a % of personnel
cost
(R’000) % (R’000) % (R’000) % (R’000) %
Skilled (Levels 3-5) 3 176 75.7 41 1.0 218 5.2 351 8.4
Highly skilled production (Levels 6-8)
33 288 79.7 21 0.1 1 541 3.7 2 450 5.9
Highly skilled supervision (Levels 9-12)
141 190 85.8 10 0.0 2 595 1.6 4 392 2.7
Senior management (Levels 13-16)
64 015 88.8 0 0 895 1.2 774 1.1
Contract (Levels 3-5) 536 99.8 0 0 0 0 0 0
Contract (Levels 6-8) 3 137 99.1 4 0.1 0 0 0 0
Contract (Levels 9-12) 5 278 95.1 0 0 90 1.6 49 0.9
Contract (Levels 13-16) 8 713 100.0 0 0 65 0.7 2 0.0
Contract Other 2 054 100.0 0 0 0 0 0 0
Periodical Remuneration 52 100.0 0 0 0 0 0 0
TOTAL 261 439 86.4 76 0.0 5 404 1.8 8 018 2.6

ANNUAL REPORT FOR 2018/19 FINANCIAL YEAR - VOTE 12: EASTERN CAPE PROVINCIAL TREASURY88
4.3.2. Employment and vacancies
The following tables summarise the number of posts on the establishment, the number of employees, the vacancy rate, and whether there are any staff that are additional to the establishment. This information is presented in terms of three key variables: - programme (Table 3.2.1), salary band (Table 3.2.2) and critical occupations (Table 3.2.3). The departments have identified critical occupations that need to be monitored. Table 3.3.3 provides establishment and vacancy information for the key critical occupations of the department. The vacancy rate reflects the percentage of posts that are not filled.
Table 3.2.1 – Employment and vacancies by programme, 31 March 2019
Programme Number of postsNumber of posts filled
Vacancy Rate (%)Number of posts filled additional to the establishment
P1: Administration 175 166 5 37
P2: Sustainable Resource Management 83 81 2.4 0
P3: Asset and Liability Management 35 35 0 1
P4: Financial Governance 79 74 6.3 17
P5: Municipal Finance Governance 68 67 1.5 1
Total 440 423 3.9 56
Table 3.2.2 – Employment and vacancies by salary bands, 31 March 2019
Salary band Number of postsNumber of posts filled
Vacancy Rate (%)Number of posts filled additional to the establishment
Skilled (Levels 3-5) 18 16 0 0
Highly skilled production (Levels 6-8) 113 108 5 0
Highly skilled supervision (Levels 9-12) 247 240 2.8 0
Senior management (Levels 13-16) 62 59 4.8 3
Skilled (Levels 3-5) Contract 0 0 0 36
Highly skilled production (Levels 6-8) Contract
0 0 0 7
Highly skilled supervision (Levels 9-12) Contract
0 0 0 4
Senior management (Levels 13-16) Contract
0 0 0 6
Total 440 423 3.9 56
The department had 538 posts in the approved organisational structure. The above table reflects the number of posts that were filled including the vacant and funded posts in the approved organogram of the department. The table above does not include unfunded posts i.e. 98. Employees that are additional to the establishment are posts that are made out of fifty-three (53) contract positions plus three (3) permanent employees who could not be absorbed into the organogram during restructuring.
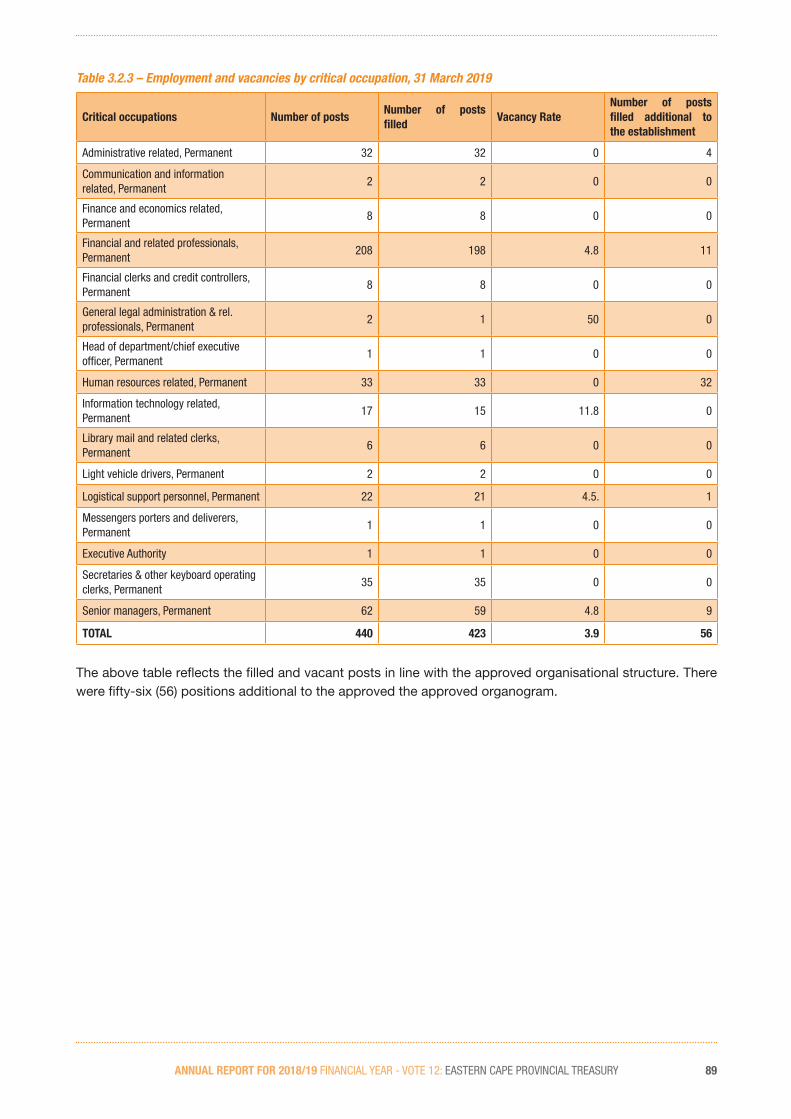
ANNUAL REPORT FOR 2018/19 FINANCIAL YEAR - VOTE 12: EASTERN CAPE PROVINCIAL TREASURY 89
Table 3.2.3 – Employment and vacancies by critical occupation, 31 March 2019
Critical occupations Number of postsNumber of posts filled
Vacancy RateNumber of posts filled additional to the establishment
Administrative related, Permanent 32 32 0 4
Communication and information related, Permanent
2 2 0 0
Finance and economics related, Permanent
8 8 0 0
Financial and related professionals, Permanent
208 198 4.8 11
Financial clerks and credit controllers, Permanent
8 8 0 0
General legal administration & rel. professionals, Permanent
2 1 50 0
Head of department/chief executive officer, Permanent
1 1 0 0
Human resources related, Permanent 33 33 0 32
Information technology related, Permanent
17 15 11.8 0
Library mail and related clerks, Permanent
6 6 0 0
Light vehicle drivers, Permanent 2 2 0 0
Logistical support personnel, Permanent 22 21 4.5. 1
Messengers porters and deliverers, Permanent
1 1 0 0
Executive Authority 1 1 0 0
Secretaries & other keyboard operating clerks, Permanent
35 35 0 0
Senior managers, Permanent 62 59 4.8 9
TOTAL 440 423 3.9 56
The above table reflects the filled and vacant posts in line with the approved organisational structure. There were fifty-six (56) positions additional to the approved the approved organogram.

ANNUAL REPORT FOR 2018/19 FINANCIAL YEAR - VOTE 12: EASTERN CAPE PROVINCIAL TREASURY90
4.3.3. Filling of SMS PostsTable 3.3.1 - SMS posts information as on 31 March 2019
SMS LevelTotal Number
of Funded SMS Posts Per Level
Total Number of SMS Filled Members Per
Level
% of SMS Posts Filled Per Level
Total Number of SMS posts
Vacant per Level
% of SMS Posts Vacant Per Level
Director-General/ Head of Department
1 1 100 0 0
Salary Level 15 4 4 100 0 0
Salary Level 14 13 13 100 0 0
Salary Level 13 43 41 95 2 4.8
Total 61 59 97 2 3
Table 3.3.2 – Advertising and Filling of SMS posts information as on 31 March 2019
SMS Level
Advertising Filling of Posts
Number of Vacancies Per Level Advertised in 6 Months of Becoming Vacant
Number of Vacancies Per Level Filled in 6 Months of Becoming Vacant
Number of Vacancies Per Level not Filled in 6 Months of Becoming Vacant
Director-General/ Head of Department 0 0 0
Salary Level 15 0 0 0
Salary Level 14 0 0 0
Salary Level 13 4 2 2
Total 4 2 2
Table 3.3.3 – Reasons for not having complied with the filling of funded vacant SMS – Advertised within 6 months and filled within 12 months after becoming vacant
Reasons for vacancies not advertised within six (6) months:
1. None
Reasons for vacancies not filled within twelve (12) months
1. The post of a Director: Financial Accounting, Reporting and Training was filled after 12 months of becoming vacant as the department struggled to get a suitable female candidate. It was advertised three times with the aim to get the best female candidate. The process took longer than anticipated as department had to headhunt and eventually filled the post. Also the post of Director: Macro Economic Analysis could not be filled within 12 months due to the scarcity of the skills required. The post was advertised four times and eventually filled through headhunting.
Table 3.3.4 – Disciplinary steps taken for not complying with the prescribed time frames for filling SMS posts within 12 months
1. None

ANNUAL REPORT FOR 2018/19 FINANCIAL YEAR - VOTE 12: EASTERN CAPE PROVINCIAL TREASURY 91
4.3.4. Job evaluation
The Public Service Regulations, 2016 introduced job evaluation as a way of ensuring that work of equal value is remunerated equally. Within a nationally determined framework, executing authorities may evaluate or re-evaluate any job in his or her organisation. In terms of the Regulations all vacancies on salary levels 9 and higher must be evaluated before they are filled. This was complemented by a decision by the Minister for the Public Service and Administration that all SMS jobs must be evaluated before 31 December 2002.
The following table (Table 3.4.1) summarises the number of jobs that were evaluated during the year under review. The table also provides statistics on the number of posts that were upgraded or downgraded.
Table 3.4.1 – Job Evaluation, 1 April 2018 to 31 March 2019
Salary bandNumber of posts
Number of Jobs
Evaluated
% of posts
evaluated by salary
bands
Posts Upgraded Posts downgraded
Number% of posts
evaluatedNumber
% of posts
evaluated
Skilled (Levels 3-5) 15 0 0 0 0 0 0
Highly Skilled Production (Levels 6-8) 108 0 0 0 0 0 0
Highly Skilled Supervision (Levels 9-12) 238 0 0 0 0 0 0
Senior Management Service Band A 41 0 0 0 0 0 0
Senior Management Service Band B 13 0 0 0 0 0 0
Senior Management Service Band C 5 0 0 0 0 0 0
Senior Management Service Band D 1 0 0 0 0 0 0
Contract (Levels 3-5) 4 0 0 0 0 0 0
Contract (Levels 6-8) 34 0 0 0 0 0 0
Contract (Levels 9-12) 6 0 0 0 0 0 0
Contract Band A 2 0 0 0 0 0 0
Contract Band B 3 0 0 0 0 0 0
Contract Band C 0 0 0 0 0 0 0
Contract Band D 0 0 0 0 0 0 0
TOTAL 470 0 0 0 0 0 0
Table 3.4.2 – Profile of employees whose salary positions were upgraded due to their posts being upgraded, 1 April 2018 to 31 March 2019
Beneficiaries African Asian Coloured White Total
Female 0 0 0 0 0
Male 0 0 0 0 0
Total 0 0 0 0 0
Employees with a disability 0

ANNUAL REPORT FOR 2018/19 FINANCIAL YEAR - VOTE 12: EASTERN CAPE PROVINCIAL TREASURY92
Table 3.4.3 – Employees whose salary level exceed the grade determined by job evaluation, 1 April 2018 to 31 March 2019 (in terms of PSR 1.V.C.3)
OccupationNumber of employees
Job evaluation level
Remuneration level
Reason for deviation
Female 0 0 0 0
Male 0 0 0 0
Male 0 0 0 0
Total 0 0 0 0
Employees with a Disability 0 0 0 0
Total Number of Employees whose salaries exceeded the level determined by job evaluation in 2018/19 0
Percentage of total employment 0
The following table (3.4.4) summarises the beneficiaries of the above in terms of race, gender, and disability.
Table 3.4.4 – Profile of employees whose salary level exceed the grade determined by job evaluation, 1 April 2018 to 31 March 2019 (in terms of PSR 1.V.C.3)
Beneficiaries African Asian Coloured White Total
Female 0 0 0 0 0
Male 0 0 0 0 0
Total 0 0 0 0 0
Employees with a disability 0
4.3.5. Employment changes
This section provides information on changes in employment over the financial year. Turnover rates provide an indication of trends in the employment profile of the department. The following tables provide a summary of turnover rates by salary band (Table 3.5.1) and by critical occupations (Table 3.5.2) and by reason why staff leave the department. Table 3.5.3, Table 3.5.4 and 3.5.5 show promotion of staff by critical occupations and by critical occupations and by salary bands respectively.
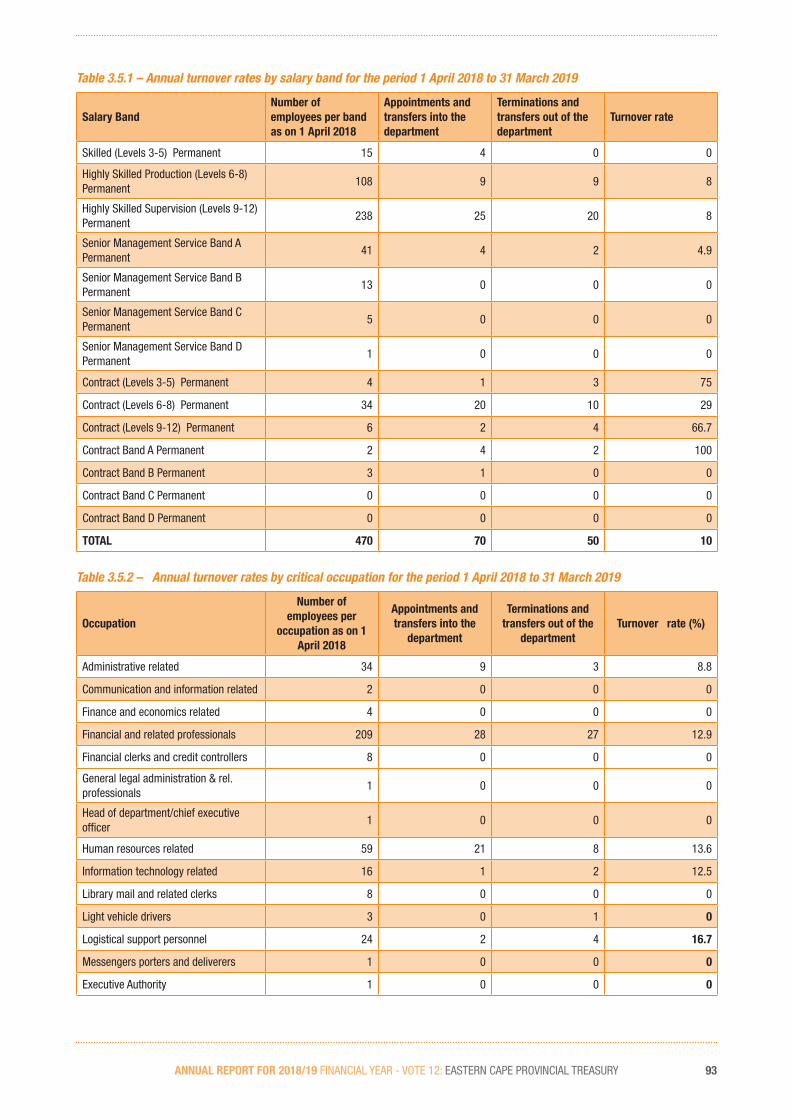
ANNUAL REPORT FOR 2018/19 FINANCIAL YEAR - VOTE 12: EASTERN CAPE PROVINCIAL TREASURY 93
Table 3.5.1 – Annual turnover rates by salary band for the period 1 April 2018 to 31 March 2019
Salary BandNumber of employees per band as on 1 April 2018
Appointments and transfers into the department
Terminations and transfers out of the department
Turnover rate
Skilled (Levels 3-5) Permanent 15 4 0 0
Highly Skilled Production (Levels 6-8) Permanent
108 9 9 8
Highly Skilled Supervision (Levels 9-12) Permanent
238 25 20 8
Senior Management Service Band A Permanent
41 4 2 4.9
Senior Management Service Band B Permanent
13 0 0 0
Senior Management Service Band C Permanent
5 0 0 0
Senior Management Service Band D Permanent
1 0 0 0
Contract (Levels 3-5) Permanent 4 1 3 75
Contract (Levels 6-8) Permanent 34 20 10 29
Contract (Levels 9-12) Permanent 6 2 4 66.7
Contract Band A Permanent 2 4 2 100
Contract Band B Permanent 3 1 0 0
Contract Band C Permanent 0 0 0 0
Contract Band D Permanent 0 0 0 0
TOTAL 470 70 50 10
Table 3.5.2 – Annual turnover rates by critical occupation for the period 1 April 2018 to 31 March 2019
Occupation
Number of employees per
occupation as on 1 April 2018
Appointments and transfers into the
department
Terminations and transfers out of the
departmentTurnover rate (%)
Administrative related 34 9 3 8.8
Communication and information related 2 0 0 0
Finance and economics related 4 0 0 0
Financial and related professionals 209 28 27 12.9
Financial clerks and credit controllers 8 0 0 0
General legal administration & rel. professionals
1 0 0 0
Head of department/chief executive officer
1 0 0 0
Human resources related 59 21 8 13.6
Information technology related 16 1 2 12.5
Library mail and related clerks 8 0 0 0
Light vehicle drivers 3 0 1 0
Logistical support personnel 24 2 4 16.7
Messengers porters and deliverers 1 0 0 0
Executive Authority 1 0 0 0
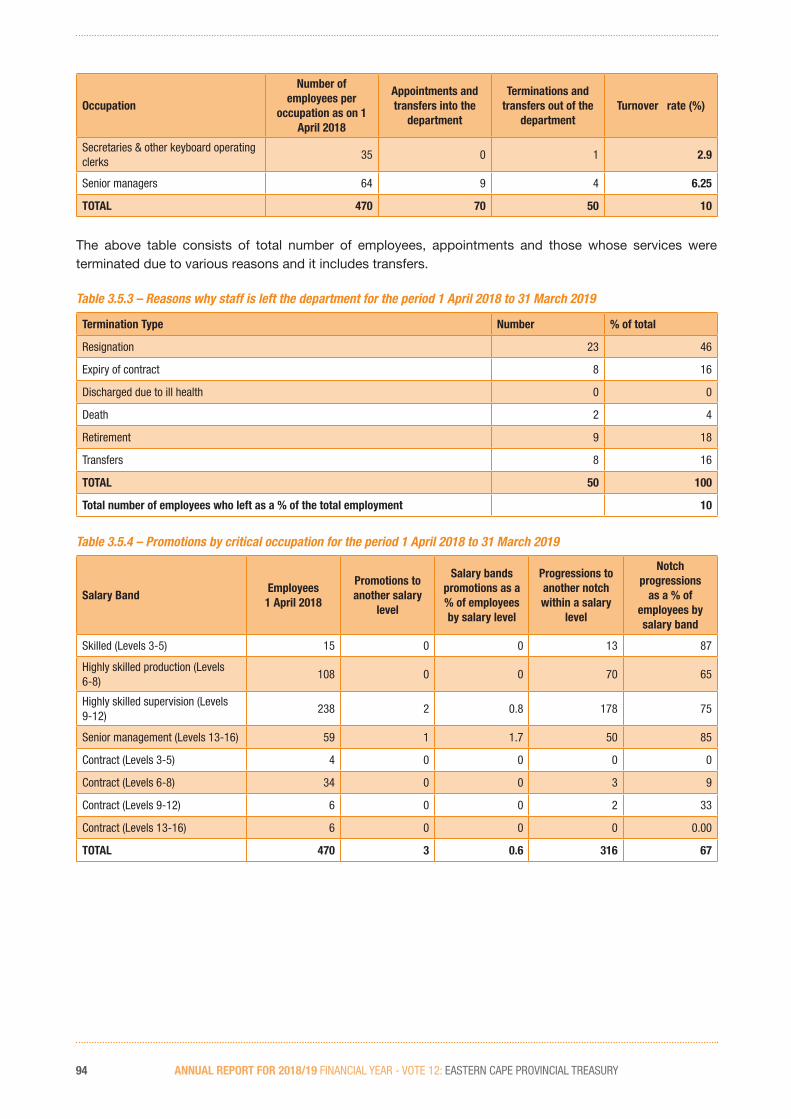
ANNUAL REPORT FOR 2018/19 FINANCIAL YEAR - VOTE 12: EASTERN CAPE PROVINCIAL TREASURY94
Occupation
Number of employees per
occupation as on 1 April 2018
Appointments and transfers into the
department
Terminations and transfers out of the
departmentTurnover rate (%)
Secretaries & other keyboard operating clerks
35 0 1 2.9
Senior managers 64 9 4 6.25
TOTAL 470 70 50 10
The above table consists of total number of employees, appointments and those whose services were terminated due to various reasons and it includes transfers.
Table 3.5.3 – Reasons why staff is left the department for the period 1 April 2018 to 31 March 2019
Termination Type Number % of total
Resignation 23 46
Expiry of contract 8 16
Discharged due to ill health 0 0
Death 2 4
Retirement 9 18
Transfers 8 16
TOTAL 50 100
Total number of employees who left as a % of the total employment 10
Table 3.5.4 – Promotions by critical occupation for the period 1 April 2018 to 31 March 2019
Salary BandEmployees1 April 2018
Promotions to another salary
level
Salary bands promotions as a % of employees by salary level
Progressions to another notch within a salary
level
Notch progressions
as a % of employees by salary band
Skilled (Levels 3-5) 15 0 0 13 87
Highly skilled production (Levels 6-8)
108 0 0 70 65
Highly skilled supervision (Levels 9-12)
238 2 0.8 178 75
Senior management (Levels 13-16) 59 1 1.7 50 85
Contract (Levels 3-5) 4 0 0 0 0
Contract (Levels 6-8) 34 0 0 3 9
Contract (Levels 9-12) 6 0 0 2 33
Contract (Levels 13-16) 6 0 0 0 0.00
TOTAL 470 3 0.6 316 67
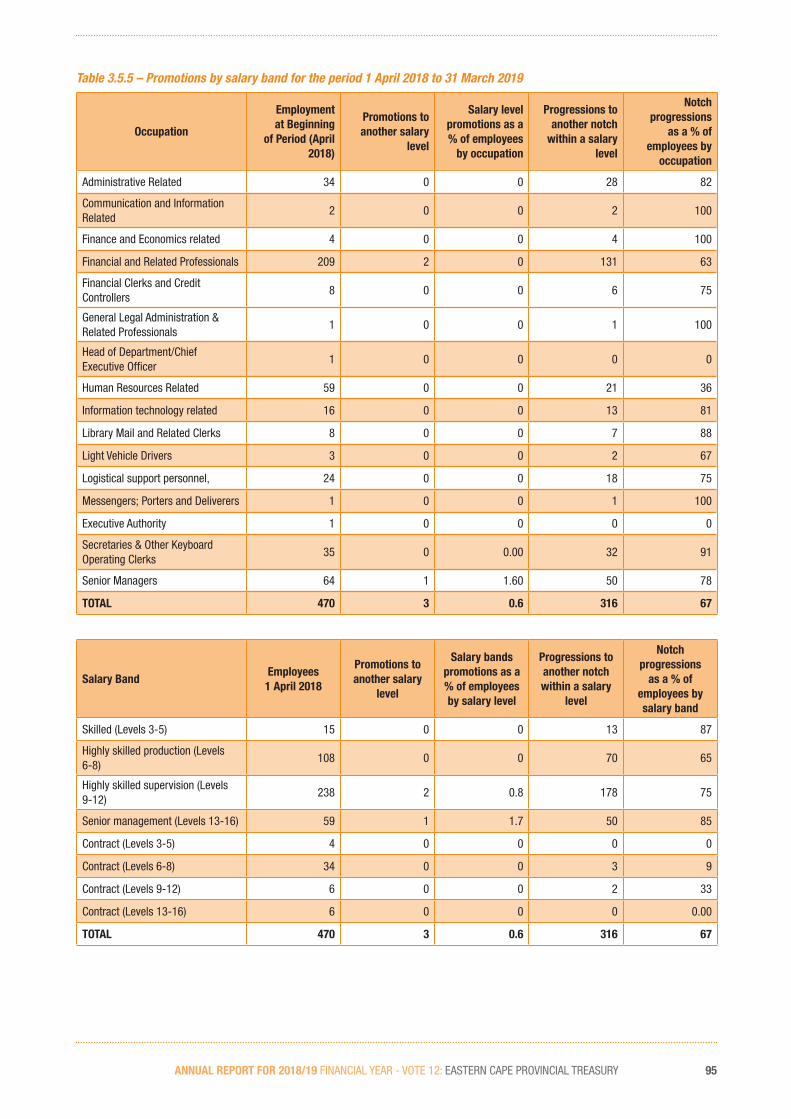
ANNUAL REPORT FOR 2018/19 FINANCIAL YEAR - VOTE 12: EASTERN CAPE PROVINCIAL TREASURY 95
Table 3.5.5 – Promotions by salary band for the period 1 April 2018 to 31 March 2019
Occupation
Employment at Beginning
of Period (April 2018)
Promotions to another salary
level
Salary level promotions as a % of employees
by occupation
Progressions to another notch
within a salary level
Notch progressions
as a % of employees by
occupation
Administrative Related 34 0 0 28 82
Communication and Information Related
2 0 0 2 100
Finance and Economics related 4 0 0 4 100
Financial and Related Professionals 209 2 0 131 63
Financial Clerks and Credit Controllers
8 0 0 6 75
General Legal Administration & Related Professionals
1 0 0 1 100
Head of Department/Chief Executive Officer
1 0 0 0 0
Human Resources Related 59 0 0 21 36
Information technology related 16 0 0 13 81
Library Mail and Related Clerks 8 0 0 7 88
Light Vehicle Drivers 3 0 0 2 67
Logistical support personnel, 24 0 0 18 75
Messengers; Porters and Deliverers 1 0 0 1 100
Executive Authority 1 0 0 0 0
Secretaries & Other Keyboard Operating Clerks
35 0 0.00 32 91
Senior Managers 64 1 1.60 50 78
TOTAL 470 3 0.6 316 67
Salary BandEmployees1 April 2018
Promotions to another salary
level
Salary bands promotions as a % of employees by salary level
Progressions to another notch within a salary
level
Notch progressions
as a % of employees by salary band
Skilled (Levels 3-5) 15 0 0 13 87
Highly skilled production (Levels 6-8)
108 0 0 70 65
Highly skilled supervision (Levels 9-12)
238 2 0.8 178 75
Senior management (Levels 13-16) 59 1 1.7 50 85
Contract (Levels 3-5) 4 0 0 0 0
Contract (Levels 6-8) 34 0 0 3 9
Contract (Levels 9-12) 6 0 0 2 33
Contract (Levels 13-16) 6 0 0 0 0.00
TOTAL 470 3 0.6 316 67
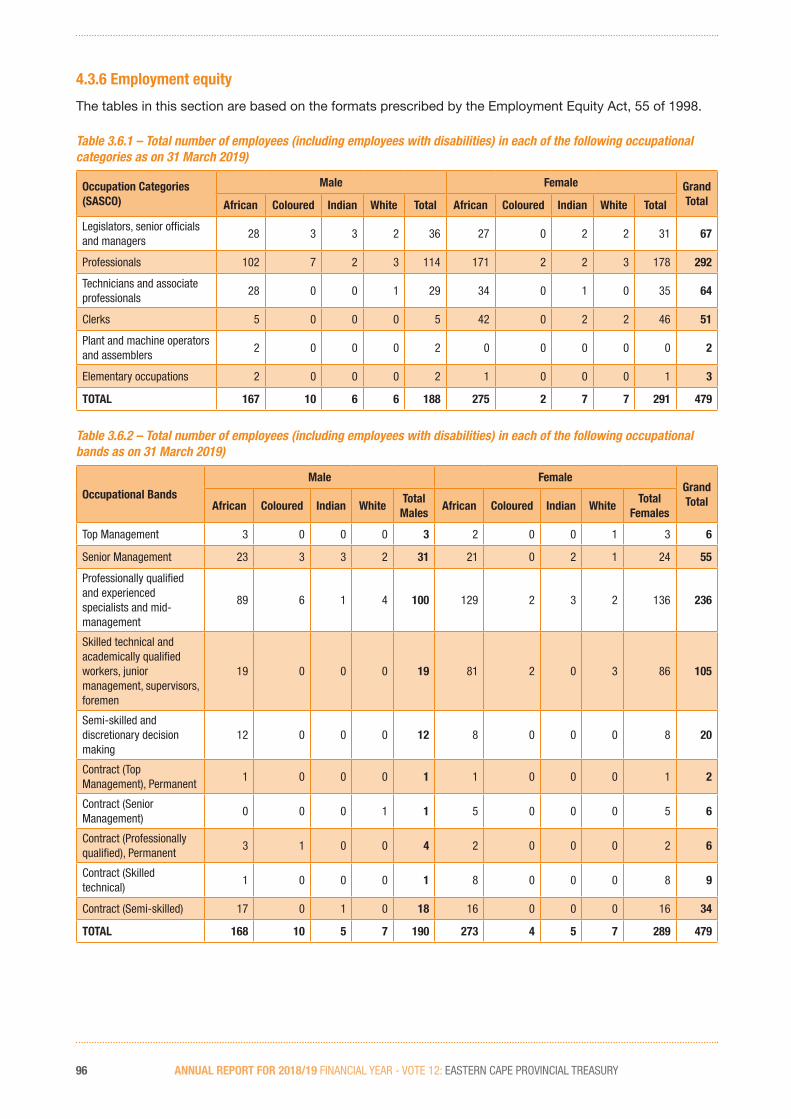
ANNUAL REPORT FOR 2018/19 FINANCIAL YEAR - VOTE 12: EASTERN CAPE PROVINCIAL TREASURY96
4.3.6 Employment equity
The tables in this section are based on the formats prescribed by the Employment Equity Act, 55 of 1998.
Table 3.6.1 – Total number of employees (including employees with disabilities) in each of the following occupational categories as on 31 March 2019)
Occupation Categories (SASCO)
Male Female Grand TotalAfrican Coloured Indian White Total African Coloured Indian White Total
Legislators, senior officials and managers
28 3 3 2 36 27 0 2 2 31 67
Professionals 102 7 2 3 114 171 2 2 3 178 292
Technicians and associate professionals
28 0 0 1 29 34 0 1 0 35 64
Clerks 5 0 0 0 5 42 0 2 2 46 51
Plant and machine operators and assemblers
2 0 0 0 2 0 0 0 0 0 2
Elementary occupations 2 0 0 0 2 1 0 0 0 1 3
TOTAL 167 10 6 6 188 275 2 7 7 291 479
Table 3.6.2 – Total number of employees (including employees with disabilities) in each of the following occupational bands as on 31 March 2019)
Occupational BandsMale Female
Grand TotalAfrican Coloured Indian White
Total Males
African Coloured Indian WhiteTotal
Females
Top Management 3 0 0 0 3 2 0 0 1 3 6
Senior Management 23 3 3 2 31 21 0 2 1 24 55
Professionally qualified and experienced specialists and mid-management
89 6 1 4 100 129 2 3 2 136 236
Skilled technical and academically qualified workers, junior management, supervisors, foremen
19 0 0 0 19 81 2 0 3 86 105
Semi-skilled and discretionary decision making
12 0 0 0 12 8 0 0 0 8 20
Contract (Top Management), Permanent
1 0 0 0 1 1 0 0 0 1 2
Contract (Senior Management)
0 0 0 1 1 5 0 0 0 5 6
Contract (Professionally qualified), Permanent
3 1 0 0 4 2 0 0 0 2 6
Contract (Skilled technical)
1 0 0 0 1 8 0 0 0 8 9
Contract (Semi-skilled) 17 0 1 0 18 16 0 0 0 16 34
TOTAL 168 10 5 7 190 273 4 5 7 289 479

ANNUAL REPORT FOR 2018/19 FINANCIAL YEAR - VOTE 12: EASTERN CAPE PROVINCIAL TREASURY 97
Table 3.6.3 – Recruitment for the period 1 April 2018 to 31 March 2019
Occupational BandsMale Female
TotalAfrican Coloured Indian White African Coloured Indian White
Senior Management 0 0 0 0 4 0 0 0 4
Professionally qualified and experienced specialists and mid-management
7 0 0 1 8 0 0 0 16
Skilled technical and academically qualified workers, junior management, supervisors, foremen
4 0 0 0 7 0 0 0 11
Contract (Top Management) 0 0 0 0 0 0 0 0 0
Contract (Senior Management) 0 0 0 0 4 0 0 0 4
Contract (Professionally qualified) 2 1 0 0 1 0 0 0 4
Contract (Skilled technical) 6 0 0 0 11 0 0 0 17
Contract (Semi skilled ) 7 0 1 0 6 0 0 0 14
TOTAL 26 1 1 1 41 0 0 0 70
The table above includes employees who were transferred on promotion to the department after the normal recruitment process. The employment of interns is excluded from above.
Table 3.6.4 – Promotions for the period 1 April 2018 to 31 March 2019
Occupational BandsMale Female
TotalAfrican Coloured Indian White African Coloured Indian White
Top Management 0 0 0 0 0 0 0 0 0
Senior Management 0 0 0 0 1 0 0 0 1
Professionally qualified and experienced specialists and mid-management
1 0 0 0 0 0 1 0 2
Skilled technical and academically qualified workers, junior management, supervisors, foreman and superintendents
0 0 0 0 0 0 0 0 0
Semi-skilled and discretionary decision making 0 0 0 0 0 0 0 0 0
Contract (Top management) 0 0 0 0 0 0 0 0 0
Contract (Senior management) 0 0 0 0 0 0 0 0 0
Contract (Professionally qualified) permanent 0 0 0 0 0 0 0 0 0
Contract (Skilled technical) 0 0 0 0 0 0 0 0 0
Total 1 0 0 0 1 0 1 0 3
Employees with disabilities 0 0 0 0 0 0 0 0 0

ANNUAL REPORT FOR 2018/19 FINANCIAL YEAR - VOTE 12: EASTERN CAPE PROVINCIAL TREASURY98
Table 3.6.5 – Terminations for the period 1 April 2018 to 31 March 2019
Occupational BandsMale Female
TotalAfrican Coloured Indian White African Coloured Indian White
Senior Management 1 0 0 0 1 0 0 0 2
Professionally qualified and experienced specialists and mid-management
7 0 0 0 7 0 0 0 14
Skilled technical and academically qualified workers, junior management, supervisors, foreman and superintendents
2 0 0 0 5 0 0 0 7
Semi-skilled and discretionary decision making 2 0 0 0 3 0 0 0 5
Contract (Top management) 0 0 0 0 0 0 0 0 0
Contract (Senior Management) 0 0 0 0 2 0 0 0 2
Contract (Professionally qualified), 1 1 0 0 4 0 0 0 6
Contract (skilled, technical). Permanent 6 0 0 0 8 0 0 0 14
Total 19 1 0 0 30 0 0 0 50
Employees with disabilities 1 0 0 0 0 0 0 0 1
Table 3.6.6 – Disciplinary action for the period 1 April 2018 to 31 March 2019
Disciplinary actionMale Female
African Coloured Indian White African Coloured Indian White Total
Written warning 3 0 0 0 2 0 0 0 5
Table 3.6.7 – Skills development for the period 1 April 2018 to 31 March 2019
Occupation Categories(SASCO)
Male Female Grand TotalAfrican Coloured Indian White Total African Coloured Indian White Total
Legislators, senior officials and managers
17 3 4 3 27 17 0 3 4 24 51
Professionals 57 3 0 5 65 78 2 0 1 81 146
Technicians and associate professionals,
0 0 0 0 0 7 0 0 0 7 7
Clerks 6 0 0 0 6 27 1 0 1 29 35
Craft and related trades workers
0 0 0 0 0 0 0 0 0 0 0
Other 0 0 0 0 0 8 0 0 0 8 8
Elementary occupations 0 0 0 0 0 0 0 0 0 0 0
TOTAL 80 6 4 8 98 137 3 3 6 149 247
Employees with disabilities 0 0 0 1 1 0 0 0 0 0 1

ANNUAL REPORT FOR 2018/19 FINANCIAL YEAR - VOTE 12: EASTERN CAPE PROVINCIAL TREASURY 99
4.3.7. Signing of Performance Agreements by SMS MembersTable 3.7.1– Signing of Performance Agreements by SMS Members as on 31 March 2019
SMS LevelTotal Number of Funded SMS Posts Per Level
Total Number of SMS Members Per Level
Total Number of Signed Performance Agreements Per Level
Signed Performance Agreements as % of Total Number of SMS Members Per Level
Director-General/ Head of Department 1 1 1 100
Salary Level 15 5 5 4 80
Salary Level 14 20 18 17 94
Salary Level 13 45 44 43 97
Total 71 68 65 95
The total number of posts and the total number of SMS members, per level, in the table above, include those that are additional to the establishment.
Table 3.7.2 – Reasons for not having concluded Performance Agreements for all SMS Members as on 31 March 2019
SMS Level
Reasons for not having concluded Performance Agreements and number of SMS members
TotalNewly appointed for less than 3 months
Immediate supervisor not yet been appointed
Seconded and signed agreement in another provincial department
On extended leave of absence including suspensions
Salary Level 15 1 0 0 0 1
Salary Level 14 0 0 1 0 1
Salary Level 13 0 0 1 0 1
Total 1 0 2 0 3
One member was re-assigned, following a reinstatement into the employ of the department, and had not yet completed 3 months after the re-assignment. Two members were seconded to provincial departments and had entered into performance agreements in their host departments.
Table 3.7.3 –Disciplinary steps taken against SMS members for not having concluded Performance Agreements as on 31 March 2019
None. No disciplinary action was necessary.

ANNUAL REPORT FOR 2018/19 FINANCIAL YEAR - VOTE 12: EASTERN CAPE PROVINCIAL TREASURY100
4.3.8. Performance Rewards
To encourage good performance, the department has granted the following performance rewards during the year under review. The information is presented in terms of race, gender, and disability (Table 3.8.1), salary bands (Table 3.8.2) and critical occupations (Table 3.8.3).
Table 3.8.1 – Performance Rewards by race, gender, and disability, 1 April 2018 to 31 March 2019
Race / genderBeneficiary Profile Cost
Number of beneficiaries
Total number of employees in group
% of total within group
Cost (R’000)Average cost per employee
African, Female 72 275 26.20 1941.22 26 961.00
African, Male 39 166 23.50 1 341.06 34 386.00
Asian, Female 3 5 60.00 107.76 35 920.00
Asian, Male 2 5 40.00 82.17 41 084.00
Coloured, Female 3 4 75.00 77.89 25 964.00
Coloured, Male 2 10 20.00 76.55 38 275.00
Total Blacks, Female 78 284 27.50 2 126.87 27 268.00
Total Blacks, Male 43 181 23.80 1 499.78 34 879.00
White, Female 1 7 14.30 17.53 17 530.00
White, Male 1 7 14.30 41.27 41 266.00
TOTAL 123 479 25.70 3 685.44 29 963.00
Employees with a disability 1 10 10.00 23.11 23 105.00
The totals above are inclusive of employees with disabilities.
Table 3.8.2– Performance Rewards by salary bands for personnel below Senior Management Service, 1 April 2018 to 31 March 2019
Salary BandsBeneficiary Profile Cost
Number of beneficiaries
Number of employees
% of total within salary bands
Total Cost (R’000)
Average cost per employee
Skilled (Levels 3-5) 2 18 11.10 22.62 11 308.00
Highly skilled production (Levels 6-8)
39 105 37.10 703.02 18 026.00
Highly skilled supervision (Levels 9-12)
67 236 28.40 2 386.68 35 622.00
Contract (Levels 3-5) 0 2 0.00 0.00 0.00
Contract (Levels 6-8) 2 9 22.20 34.64 17 319.00
Contract (Levels 9-12) 1 6 16.70 43.35 43 346.00
Other 0 35 0.00 0.00 0.00
TOTAL 111 411 27.00 3 190.30 28 741.00
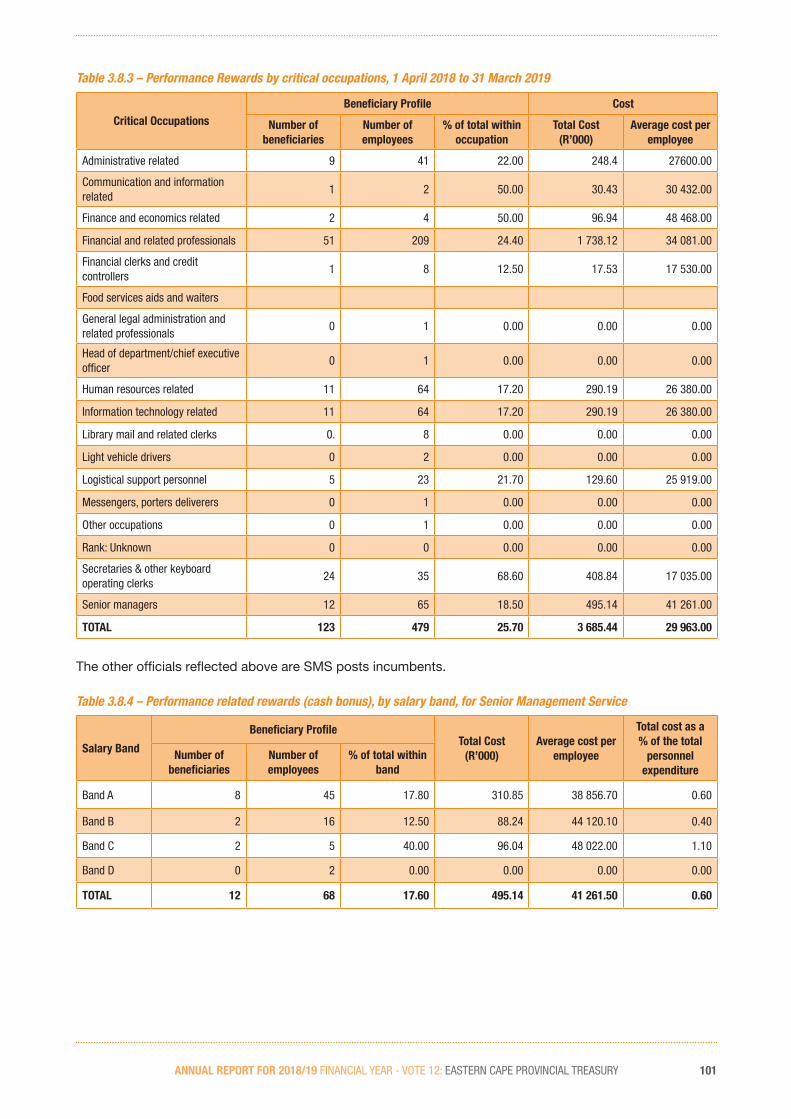
ANNUAL REPORT FOR 2018/19 FINANCIAL YEAR - VOTE 12: EASTERN CAPE PROVINCIAL TREASURY 101
Table 3.8.3 – Performance Rewards by critical occupations, 1 April 2018 to 31 March 2019
Critical OccupationsBeneficiary Profile Cost
Number of beneficiaries
Number of employees
% of total within occupation
Total Cost (R’000)
Average cost per employee
Administrative related 9 41 22.00 248.4 27600.00
Communication and information related
1 2 50.00 30.43 30 432.00
Finance and economics related 2 4 50.00 96.94 48 468.00
Financial and related professionals 51 209 24.40 1 738.12 34 081.00
Financial clerks and credit controllers
1 8 12.50 17.53 17 530.00
Food services aids and waiters
General legal administration and related professionals
0 1 0.00 0.00 0.00
Head of department/chief executive officer
0 1 0.00 0.00 0.00
Human resources related 11 64 17.20 290.19 26 380.00
Information technology related 11 64 17.20 290.19 26 380.00
Library mail and related clerks 0. 8 0.00 0.00 0.00
Light vehicle drivers 0 2 0.00 0.00 0.00
Logistical support personnel 5 23 21.70 129.60 25 919.00
Messengers, porters deliverers 0 1 0.00 0.00 0.00
Other occupations 0 1 0.00 0.00 0.00
Rank: Unknown 0 0 0.00 0.00 0.00
Secretaries & other keyboard operating clerks
24 35 68.60 408.84 17 035.00
Senior managers 12 65 18.50 495.14 41 261.00
TOTAL 123 479 25.70 3 685.44 29 963.00
The other officials reflected above are SMS posts incumbents.
Table 3.8.4 – Performance related rewards (cash bonus), by salary band, for Senior Management Service
Salary Band
Beneficiary ProfileTotal Cost
(R’000)Average cost per
employee
Total cost as a % of the total
personnel expenditure
Number of beneficiaries
Number of employees
% of total within band
Band A 8 45 17.80 310.85 38 856.70 0.60
Band B 2 16 12.50 88.24 44 120.10 0.40
Band C 2 5 40.00 96.04 48 022.00 1.10
Band D 0 2 0.00 0.00 0.00 0.00
TOTAL 12 68 17.60 495.14 41 261.50 0.60

ANNUAL REPORT FOR 2018/19 FINANCIAL YEAR - VOTE 12: EASTERN CAPE PROVINCIAL TREASURY102
4.3.9. Foreign workers
The tables below summarise the employment of foreign nationals in the department in terms of salary bands and by major occupation. The tables also summarise changes in the total number of foreign workers in each salary band and by each major occupation.
Table 3.9.1 – Foreign Workers, 1 April 2018 to 31 March 2019 by salary band
Salary Band1 April 2018 31 March 2019 Change
Number % of total Number % of total Number % change
Highly skilled supervision, contract (Levels 9-12)
0 0 0 0 0 0
Contract (Levels 9-12) 0 0 0 0 0 0
Total 0 0 0 0 0 0
Table 3.9.2– Foreign Worker, 1 April 2018 to 31 March 2019, by major occupation
Major Occupation1 April 2018 31 March 2019 Change
Number % of total Number % of total Number % change
Professionals and managers 0 0 0 0 0 0
Total 0 0 0 0 0 0
4.3.10. Leave utilisation for the period 1 January 2018 to 31 December 2018
The Public Service Commission identified the need for careful monitoring of sick leave within the public service. The following tables provide an indication of the use of sick leave (Table 3.10.1) and disability leave (Table 3.10.2). In both cases, the estimated cost of the leave is also provided.
Table 3.10.1– Sick leave, 1 January 2018 to 31 December 2018
Salary BandTotal days % days with
medical certification
Number of Employees using sick leave
% of total employees using sick leave
Average days per employee
Estimated Cost (R’000)
Skilled (Levels 3-5) 95 73 14 3 6 83
Highly skilled production (Levels 6-8) 677 69 96 26 7 1062
Highly skilled supervision (Levels 9-12) 1 577 65 220 55 7 3975
Senior management (Levels 13-16) 234 68 39 10 3 541
Contract (Levels 3-5) 9 78 2 3 4 29
Contract (Levels 6-8) 35 51 9 2 5 55
Contract (Levels 9-12) 13 62 4 0 0 0
Contract (Levels 13-16) 28 89 4 1 4 87
Contract Other 40 15 18 4.40 2 14
TOTAL 2 708 65.70 406.00 100.00 7.00 6 290.00
Table (3.10.3) summarises the utilisation of annual leave. The wage agreement concluded with trade unions in the PSCBC in 2000 requires management of annual leave to prevent high levels of accrued leave being paid at the time of termination of service.

ANNUAL REPORT FOR 2018/19 FINANCIAL YEAR - VOTE 12: EASTERN CAPE PROVINCIAL TREASURY 103
Table 3.10.2 – Disability leave (temporary and permanent), 1 January 2018 to 31 December 2018
Salary BandTotal days taken
% days with medical certification
Number of Employees using disability leave
% of total employees using disability leave
Average days per employee
Estimated Cost (R’000)
Contract (13-16) 4 100 1 4 4 18
Highly skilled production (Levels 6-8) 144 100 6 24 24 229
Highly skilled supervision (Levels 9-12) 212 100 17 68 12 605
Senior management (Levels 13-16) 50 100 1 4 50 205
TOTAL 410 100 25 100 16 1 057
Table 3.10.3 – Annual Leave, 1 January 2018 to 31 December 2018
Salary Bands Total days taken Average per employee
Skilled (Levels 3-5) 416 24
Highly skilled production (Levels 6-8) 2 810 26
Highly skilled supervision (Levels 9-12) 6 002 23
Senior management (Levels 13-16) 1 507 26
Contract (Levels 3-5) 47 12
Contract (Levels 6-8) 144 12
Contract (Levels 9-12) 80 9
Contract (Levels 13-16) 101 17
Contract Other 265 8
TOTAL 11 372 22
Table (3.10.4) summarises the utilisation of capped leave. The management of capped leave is intended to prevent high levels of accrued leave being paid at the time of termination of service.
Table 3.10.4 – Capped leave, 1 January 2018 to 31 December 2018
Salary BandsTotal days of capped leave taken
Average number of days taken per employee
Average capped leave per employee as at 31 December 2018
Skilled (Levels 3-5) 1 1 90
Highly skilled production (Levels 6-8) 40 8 137
Highly skilled supervision (Levels 9-12) 18 3 90
Senior management (Levels 13-16) 0 0 75
TOTAL 59 5 105
The following table summarises payments made to employees as a result of leave that was not taken.
Table 3.10.5 – Leave payouts for the period 1 April 2018 to 31 March 2019
ReasonTotal Amount (R’000)
Number of Employees
Average payment per employee
Leave pay-out for 2018/19 due to non-utilization of leave for the previous cycle 0.00 0 0.00
Capped leave pay-outs on termination of service for 2018/19 1 161 097 6 193 516
Current & previous leave pay-out on termination of service for 2018/19 990 238 23 45 011
Total 2 151 335 29 238 527

ANNUAL REPORT FOR 2018/19 FINANCIAL YEAR - VOTE 12: EASTERN CAPE PROVINCIAL TREASURY104
4.3.11. AIDS & health promotion programmesTable 3.11.1 – Steps taken to reduce the risk of occupational exposure
Units/categories of employees identified to be at high risk of contracting HIV & related diseases (if any)
Key steps taken to reduce the risk
Males between the ages of 30 to 39 years.
Ongoing testing and screening services are availed to employees on a quarterly basis.
A Men’s health promotion programme was conducted where various issues were addressed by different stakeholders with the aim of promoting positive behaviour and lifestyle changes.
Table 3.11.2 – Details of Health Promotion and HIV and AIDS Programmes
Question Yes No Details, if yes
1. Has the department designated a member of the SMS to implement the provisions contained in the Public Service Regulations, 2016? If so, provide her/his name and position.
X The SMS member responsible is Mr Sizwe Ngqangweni: Director HRUD
2. Does the department have a dedicated unit or has it designated specific staff members to promote the health and wellbeing of your employees? If so, indicate the number of employees who are involved in this task and the annual budget that is available for this purpose.
X The EWP Unit consist of 3 fulltime employees who are responsible for health promotion in the department. The allocated budget for EAP services is R326 000
3. Has the department introduced an Employee Assistance or Health Promotion Programme for your employees? If so, indicate the key elements/services of this Programme.
XThe EWP is based on the four pillars of the EWP Strategic Framework namely HIV & TB Management, Health and Productivity, Wellness Management and Occupational Health and Safety. In addition to the above programme interventions a 24-hour counselling service is available to all employees and immediate dependants.
4. Has the department established (a) committee(s) as contemplated in the Public Service Regulations, 2016. If so, please provide the names of the members of the committee and the stakeholder(s) that they represent.
XThe department have an established Health and Safety Committee that meets on a quarterly basis. Stakeholders include EWP, labour representatives, SHE Reps and committee is chaired by the Director HRUD.
5. Has the department reviewed its employment policies and practices to ensure that these do not unfairly discriminate against employees on the basis of their HIV status? If so, list the employment policies/practices so reviewed.
XThe Social Policy has been adopted.In addition, the Employment Relations Policy was revised during the course of the year.
6. Has the department introduced measures to protect HIV-positive employees or those perceived to be HIV-positive from discrimination? If so, list the key elements of these measures.
XAn internal policy on HIV/AIDS Management is is in place. Workshops are conducted by Labour Relations unit to educate employees about the provisions of the policy and legislative frameworks that prohibit unfair discrimination.
7. Does the department encourage its employees to undergo Voluntary Counselling and Testing? If so, list the results that you have you achieved.
XOn a quarterly basis employees are given an opportunity to test for HIV and screen for TB. In 2018/2019, 129 employees participated in HCT.
8. Has the department developed measures/indicators to monitor & evaluate the impact of its health promotion programme? If so, list these measures/indicators.
XThe EWP have implemented an employee survey to give employees an opportunity to provide feedback on the impact of the programmes. Secondly, the EWP conducted sick leave analysis bi-annually to assess the utilisation of sick leave within the department. Utilisation have reduced from 88% in the previous financial year to 83% in the current year. Though other factors may exist that influence the findings of the report, it serves as an indicator of the health profile of the department.
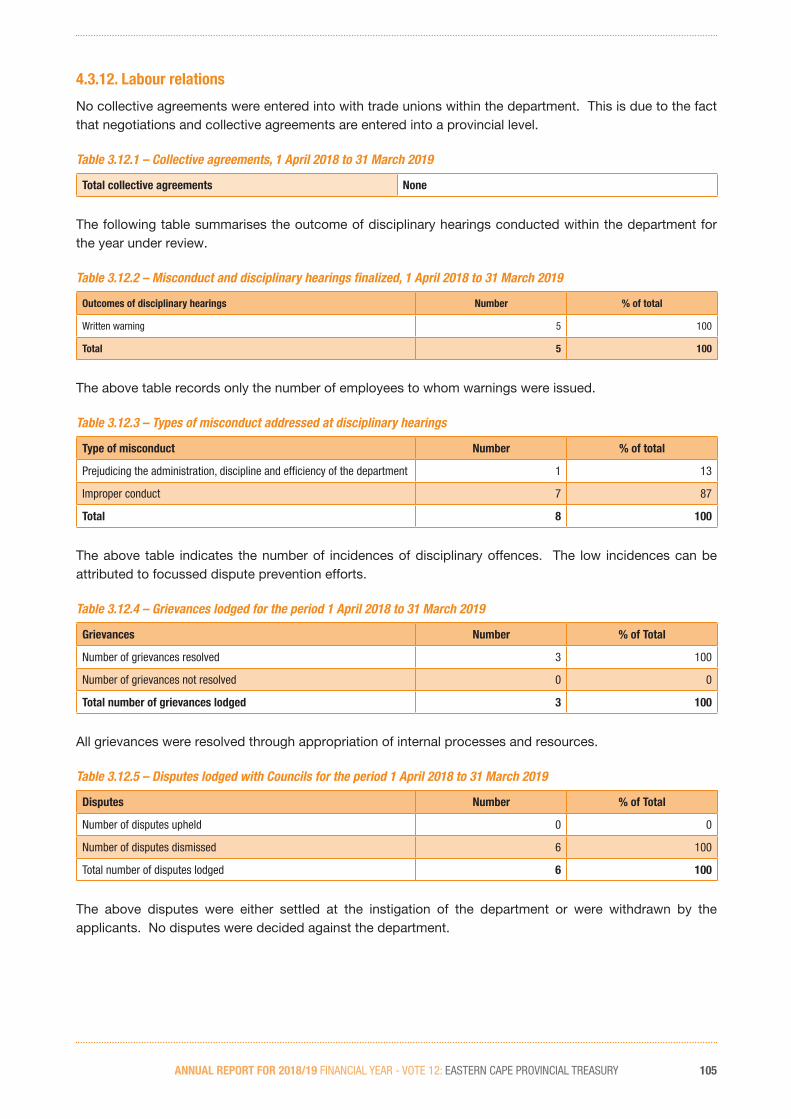
ANNUAL REPORT FOR 2018/19 FINANCIAL YEAR - VOTE 12: EASTERN CAPE PROVINCIAL TREASURY 105
4.3.12. Labour relations
No collective agreements were entered into with trade unions within the department. This is due to the fact that negotiations and collective agreements are entered into a provincial level.
Table 3.12.1 – Collective agreements, 1 April 2018 to 31 March 2019
Total collective agreements None
The following table summarises the outcome of disciplinary hearings conducted within the department for the year under review.
Table 3.12.2 – Misconduct and disciplinary hearings finalized, 1 April 2018 to 31 March 2019
Outcomes of disciplinary hearings Number % of total
Written warning 5 100
Total 5 100
The above table records only the number of employees to whom warnings were issued.
Table 3.12.3 – Types of misconduct addressed at disciplinary hearings
Type of misconduct Number % of total
Prejudicing the administration, discipline and efficiency of the department 1 13
Improper conduct 7 87
Total 8 100
The above table indicates the number of incidences of disciplinary offences. The low incidences can be attributed to focussed dispute prevention efforts.
Table 3.12.4 – Grievances lodged for the period 1 April 2018 to 31 March 2019
Grievances Number % of Total
Number of grievances resolved 3 100
Number of grievances not resolved 0 0
Total number of grievances lodged 3 100
All grievances were resolved through appropriation of internal processes and resources.
Table 3.12.5 – Disputes lodged with Councils for the period 1 April 2018 to 31 March 2019
Disputes Number % of Total
Number of disputes upheld 0 0
Number of disputes dismissed 6 100
Total number of disputes lodged 6 100
The above disputes were either settled at the instigation of the department or were withdrawn by the applicants. No disputes were decided against the department.

ANNUAL REPORT FOR 2018/19 FINANCIAL YEAR - VOTE 12: EASTERN CAPE PROVINCIAL TREASURY106
Table 3.12.6 – Strike actions for the period 1 April 2018 to 31 March 2019
Total number of person working days lost 0
Total cost (R’000) of working days lost 0
Amount (R’000) recovered as a result of no work no pay 0
There was no strike action and no recoveries were necessary.
Table 3.12.7 – Precautionary suspensions for the period 1 April 2018 to 31 March 2019
Number of people suspended 0
Number of people whose suspension exceeded 30 days 0
Average number of days suspended 0
Cost (R’000) of suspensions 0
No persons were placed on suspension during the year under review.
4.3.13 Skills development
This section highlights the efforts of the department with regard to skills development.
Table 3.13.1 – Training needs identified 1 April 2018 to 31 March 2019
Occupational Categories GenderNumber of employees as at 1 April 2018
Training needs identified at start of reporting period
Learner ships
Skills Programmes & other short courses
Other forms of training
Total
Legislators, senior officials and managers
Female 31 0 2 4 6
Male 36 0 4 2 6
ProfessionalsFemale 178 0 23 4 27
Male 114 0 19 2 21
Technicians and associate professionals
Female 35 0 0 0 0
Male 29 0 0 0 0
Clerks Female 47 0 14 0 14
Male 9 0 6 0 6
Service and sales workersFemale 0 0 0 0 0
Male 0 0 0 0 0
Skilled agriculture and fishery workers
Female 0 0 0 0 0
Male 0 0 0 0 0
Craft and related trades workers
Female 0 0 0 0 0
Male 0 0 0 0 0
Plant and machine operators and assemblers
Female 0 0 0 0 0
Male 0 0 0 0 0
Elementary occupationsFemale 0 0 0 0 0
Male 0 0 0 0 0
Sub TotalFemale 291 0 39 8 47
Male 188 0 29 4 33
Total 479 0 68 12 80

ANNUAL REPORT FOR 2018/19 FINANCIAL YEAR - VOTE 12: EASTERN CAPE PROVINCIAL TREASURY 107
The above table indicates the number of training opportunities identified in line with the training priorities that were highlighted in respect of the year under review. These were also included in the annual skills development plan of the department.
This table below indicates all training provided by the department during this period including bursaries awarded to full time employees.
Table 3.13.2 – Training provided 1 April 2018 to 31 March 2019
Occupational Categories Gender
Number of employees as at 1 April 2018 (including 18.2 learners)
Training provided within the reporting period
Training provided for Unemployed Graduates
Skills Programmes and other short courses
Other forms of training
TotalWorkshops Bursaries
Legislators, senior officials and managers
Female 31 0 10 9 5 24
Male 36 0 12 9 6 27
ProfessionalsFemale 178 0 55 25 1 81
Male 114 0 39 20 6 65
Technicians and associate professionals
Female 35 0 3 4 0 7
Male 29 0 0 0 0 0
Clerks Female 47 0 16 9 4 29
Male 9 0 5 1 0 6
Service and sales workersFemale 0 0 0 0 0 0
Male 0 0 0 0 0 0
Skilled agriculture and fishery workers
Female 0 0 0 0 0 0
Male 0 0 0 0 0 0
OtherFemale 0 8 0 0 0 8
Male 0 0 0 0 0 0
Craft and related trades workers
Female 0 0 0 0 0 0
Male 0 0 0 0 0 0
Plant and machine operators and assemblers
Female 0 0 0 0 0 0
Male 0 0 0 0 0 0
Elementary occupationsFemale 0 0 0 0 0 0
Male 0 0 0 0 0 0
Sub TotalFemale 291 8 84 47 10 149
Male 188 0 56 30 12 98
Total 479 8 140 77 22 247
The above table indicates training opportunities that were made available and utilised by employees of the department. The emphasis has been on job-specific programmes and leadership and management development programmes.

ANNUAL REPORT FOR 2018/19 FINANCIAL YEAR - VOTE 12: EASTERN CAPE PROVINCIAL TREASURY108
4.3.14. Injury on duty
The following tables provide basic information on injury on duty.
Table 3.14.1 – Injury on duty, 1 April 2018 to 31 March 2019
Nature of injury on duty Number % of total
Required basic medical attention only 0 0
Temporary Total Disablement 0 0
Permanent Disablement 0 0
Fatal 0 0
Total 0 0
4.3.15. Utilisation of consultantsTable.3.15.1 – Report on consultant appointments using appropriated funds
Project TitleTotal number of consultants that worked on the project
Duration:Work days
Contract value inRand
None 0 0 0
Total number of projects Total individual consultantsTotal duration:Work days
Total contract value in Rand
None 0 0 0
Table 3.15.2 – Analysis of consultant appointments using appropriated funds, in terms of Historically Disadvantaged Individuals (HDIs)
Project TitlePercentage ownership by HDI groups
Percentage management by HDI groups
Number of Consultants from HDI groups that work on the
project
None 0 0 0
Table 3.15.3– Report on consultant appointments using Donor funds
Project TitleTotal Number of consultants that worked on the project
Duration:Work days
Donor and Contract value in Rand
None
Total number of projects Total individual consultantsTotal duration:Work days
Total contract value in Rand
None
Table 3.15.4– Analysis of consultant appointments using Donor funds, in terms of Historically Disadvantaged Individuals (HDIs)
Project TitlePercentage ownership by HDI groups
Percentage management by HDI groups
Number of Consultants from HDI groups that work on the project
None

109
EASTERN CAPEPROVINCIAL TREASURY
2018/19
ANNUAL REPORTVOTE 12
PART E: FINANCIAL INFORMATION

110 ANNUAL REPORT FOR 2018/19 FINANCIAL YEAR - VOTE 12: EASTERN CAPE PROVINCIAL TREASURY

ANNUAL REPORT FOR 2018/19 FINANCIAL YEAR - VOTE 12: EASTERN CAPE PROVINCIAL TREASURY 111
5.1. REPORT OF THE AUDITOR-GENERAL TO THE EASTERN CAPE PROVINCIAL LEGISLATURE ON VOTE NO. 12: EASTERN CAPE PROVINCIAL TREASURY
REPORT ON THE AUDIT OF FINANCIAL STATEMENTSOpinion
1. I have audited the financial statements of the Eastern Cape Provincial Treasury set out on pages 116 to 163, which comprise the appropriation statement, the statement of financial position as at 31 March 2019, the statement of financial performance, the statement of changes in net assets and the cash flow statement for the year then ended, as well as the notes to the financial statements, including a summary of significant accounting policies.
2. In my opinion, the financial statements present fairly, in all material respects, the financial position of Eastern Cape Provincial Treasury as at 31 March 2019 and its financial performance and cash flows for the year then ended, in accordance with the Modified Cash Standards (MCS) prescribed by the National Treasury, and the requirements of the Public Finance Management Act of South Africa, 1999 (Act no.1 of 1999) (PFMA) and the Division of Revenue Act of South Africa, 2018 (Act no.1of 2018) (Dora).
Basis for opinion
3. I conducted my audit in accordance with the International Standards on Auditing (ISAs). My responsibilities under those standards are further described in the auditor-general’s responsibilities for the audit of the financial statements section of this auditor’s report.
4. I am independent of the department in accordance with sections 290 and 291 of the International Ethics Standards Board for Accountants’ Code of ethics for professions/ accountants (IESBA code), parts 1 and 3 of the International Ethics Standards Board for Accountants’ International Code of Ethics for professional accountants (including International Independence Standards) (IESBA code) and the ethical requirements that are relevant to my audit in South Africa. I have fulfilled my other ethical responsibilities in accordance with these requirements and the IESBA code.
5. I believe that the audit evidence I have obtained is sufficient and appropriate to provide a basis for my opinion.
Emphasis of matters
6. I draw attention to the matters below. My opinion is not modified in respect of these matters.
Restatement of corresponding figures
7. As disclosed in note 30 to the financial statements, the corresponding figures for 31 March 2018 were restated as a result of an error in the financial statements of the department at, and for the year ended, 31 March 2019.
Underspending of the budget
8. As disclosed in the appropriation statement, the department materially underspent the budget by R6, 9 million on programme 1: Administration and R12, 4 million on programme 5: Municipal Financial Governance.
ANNUAL REPORT FOR 2018/19 FINANCIAL YEAR - VOTE 12: EASTERN CAPE PROVINCIAL TREASURY112
Responsibilities of the accounting officer for the financial statements
9. The accounting officer is responsible for the preparation and fair presentation of the financial statements in accordance with the MCS and the requirements of the PFMA, and for such internal control as the accounting officer determines is necessary to enable the preparation of financial statements that are free from material misstatement, whether due to fraud or error.
10. In preparing the financial statements, the accounting officer is responsible for assessing the Eastern Cape Provincial Treasury’s ability to continue as a going concern, disclosing, as applicable, matters relating to going concern and using the going concern basis of accounting unless the appropriate governance structure either intends to liquidate the department or to cease operations, or has no realistic alternative but to do so.
Auditor-general’s responsibilities for the audit of the financial statements
11. My objectives are to obtain reasonable assurance about whether the financial statements as a whole are free from material misstatement, whether due to fraud or error, and to Issue an auditor’s report that includes my opinion. Reasonable assurance is a high level of assurance, but is not a guarantee that an audit conducted in accordance with the ISAs will always detect a material misstatement when it exists. Misstatements can arise from fraud or error and are considered material if, individually or in aggregate, they could reasonably be expected to Influence the economic decisions of users taken on the basis of these financial statements.
12. A further description of my responsibilities for the audit of the financial statements is Included in the annexure to this auditor’s report.

ANNUAL REPORT FOR 2018/19 FINANCIAL YEAR - VOTE 12: EASTERN CAPE PROVINCIAL TREASURY 113
REPORT ON THE AUDIT OF THE ANNUAL PERFORMANCE REPORTIntroduction and scope
13. In accordance with the Public Audit Act of South Africa, 2004 (Act No. 25 of 2004) (PAA) and the general notice issued in terms thereof, I have a responsibility to report material findings on the reported performance information against predetermined objectives for selected programmes presented in the annual performance report. I performed procedures to identify findings but not to gather evidence to express assurance.
14. My procedures address the reported performance information, which must be based on the approved performance planning documents of the department. I have not evaluated the completeness and appropriateness of the performance indicators included in the planning documents. My procedures also did not extend to any disclosures or assertions relating to planned performance strategies and Information in respect of future periods that may be included as part of the reported performance information. Accordingly, my findings do not extend to these matters.
15. I evaluated the usefulness and reliability of the reported performance information in accordance with the criteria developed from the performance management and reporting framework, as defined In the general notice, for the following selected programmes presented In the annual performance report of the department for the year ended 31 March 2019:
ProgrammesPage In the annual performance report
Programme 2 - Sustainable Resource Management 39 - 46
Programme 3 - Asset and Liability Management 47 - 51
Programme 4 - Financial Governance 52 - 58
Programme 5 - Municipal Financial Governance 59 - 65
16. I performed procedures to determine whether the reported performance information was properly presented and whether performance was consistent with the approved performance planning documents. I performed further procedures to determine whether the Indicators and related targets were measurable and relevant, and assessed the reliability of the reported performance information to determine whether it was valid, accurate and complete.
17. I did not raise any material findings on the usefulness and reliability of the reported performance information for the selected programmes.
Other matter
18. I draw attention to the matter below.
Achievement of planned targets
19. Refer to the annual performance report on pages 40 to 69 for information on the achievement of planned targets for the year and explanations provided for the under and over achievement of a significant number of targets.

ANNUAL REPORT FOR 2018/19 FINANCIAL YEAR - VOTE 12: EASTERN CAPE PROVINCIAL TREASURY114
REPORT ON AUDIT OF COMPLIANCE WITH LEGISLATION Introduction and scope
20. In accordance with the PAA and the general notice issued in terms thereof, I have a responsibility to report material findings on the compliance of the department with specific matters in key legislation. I performed procedures to identify findings but not to gather evidence to express assurance.
21. I did not raise material findings on compliance with the specific matters in key legislation set out in the general notice issued in terms of the PAA.
Other information
22. The accounting officer is responsible for the other information. The other information comprises the Information included in the annual report, which includes the audit committee’s report. The other information does not include the financial statements, the auditor’s report and those selected programmes presented in the annual performance report that have been specifically reported in this auditor’s report.
23. My opinion on the financial statements and findings on the reported performance Information and compliance with legislation do not cover the other information and I do not express an audit opinion or any form of assurance conclusion thereon.
24. In connection with my audit, my responsibilities to read the other information and, in doing so, consider whether the other information is materially inconsistent with the financial statements and the selected programmes presented in the annual performance report, or my knowledge obtained in the audit, or otherwise appears to be materially misstated. If, based on the work I performed, I conclude that there is a material misstatement in this other information, I am required to report that fact. I have nothing to report in this regard.
Internal control deficiencies
25. I considered internal control relevant to my audit of the financial statements, reported performance information and compliance with applicable legislation; however, my objective was not to express any form of assurance on it. I did not identify any significant deficiencies in internal control.
East London 31 July 2019

ANNUAL REPORT FOR 2018/19 FINANCIAL YEAR - VOTE 12: EASTERN CAPE PROVINCIAL TREASURY 115
Annexure - Auditor-general’s responsibility for the audit
1. As part of an audit in accordance with the ISAs, I exercise professional judgement and maintain professional scepticism throughout my audit of the financial statements, and the procedures performed on reported performance information for selected programmes and on the department’s compliance with respect to the selected subject matters.
Financial statements
2. In addition to my responsibility for the audit of the financial statements as described in this auditor’s report, I also:
• Identify and assess the risks of material misstatement of the financial statements whether due to fraud or error, design and perform audit procedures responsive to those risks, and obtain audit evidence that is sufficient and appropriate to provide a basis for my opinion. The risk of not detecting a material misstatement resulting from fraud is higher than for one resulting from error, as fraud may involve collusion, forgery, intentional omissions, misrepresentations, or the override of internal control.
• Obtain an understanding of internal control relevant to the audit in order to design audit procedures that are appropriate in the circumstances, but not for the purpose of expressing an opinion on the effectiveness of the department’s internal control
• Evaluate the appropriateness of accounting policies used and the reasonableness of accounting estimates and related disclosures made by the accounting officer
• Conclude on the appropriateness of the accounting officer’s use of the going concern basis of accounting in the preparation of the financial statements. I also conclude, based on the audit evidence obtained, whether a material uncertainty exists related to events or conditions that may cast significant doubt on the Eastern Cape Provincial Treasury’s ability to continue as a going concern. If I conclude that a material uncertainty exists, I am required to draw attention in my auditor’s report to the related disclosures in the financial statements about the material uncertainty or, if such disclosures are inadequate, to modify the opinion on the financial statements. My conclusions are based on the information available to me at the date of this auditor’s report. However, future events or conditions may cause a department to cease continuing as a going concern
• Evaluate the overall presentation, structure and content of the financial statements, including the disclosures, and whether the financial statements represent the underlying transactions and events in a manner that achieves fair presentation.
Communication with those charged with governance
3. I communicate with the accounting officer regarding, among other matters, the planned scope and timing of the audit and significant audit findings, including any significant deficiencies in internal control that I identify during my audit.
4. I also confirm to the accounting officer that I have complied with relevant ethical requirements regarding independence, and communicate all relationships and other matters that may reasonably be thought to have a bearing on my independence and, where applicable, related safeguards.
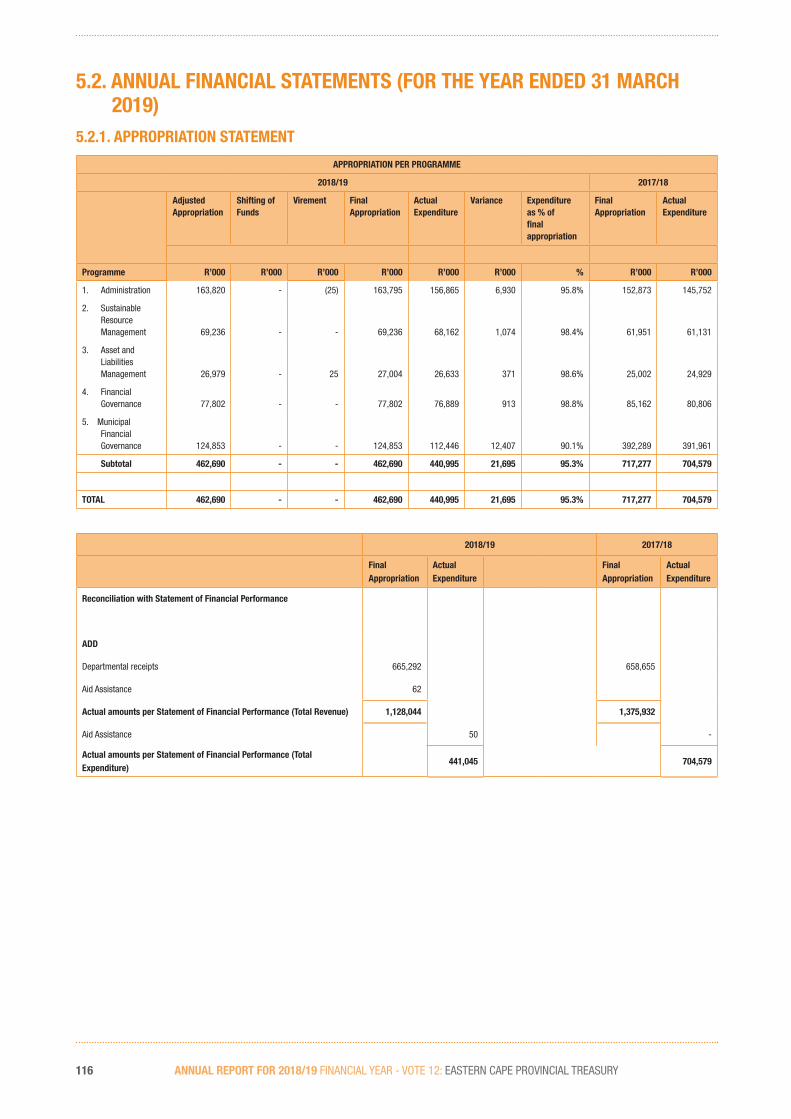
ANNUAL REPORT FOR 2018/19 FINANCIAL YEAR - VOTE 12: EASTERN CAPE PROVINCIAL TREASURY116
5.2. ANNUAL FINANCIAL STATEMENTS (FOR THE YEAR ENDED 31 MARCH 2019)5.2.1. APPROPRIATION STATEMENT
APPROPRIATION PER PROGRAMME
2018/19 2017/18
Adjusted Appropriation
Shifting of Funds
Virement Final Appropriation
Actual Expenditure
Variance Expenditure as % of final appropriation
Final Appropriation
Actual Expenditure
Programme R’000 R’000 R’000 R’000 R’000 R’000 % R’000 R’000
1. Administration 163,820 - (25) 163,795 156,865 6,930 95.8% 152,873 145,752
2. Sustainable Resource Management 69,236 - - 69,236 68,162 1,074 98.4% 61,951 61,131
3. Asset and Liabilities Management 26,979 - 25 27,004 26,633 371 98.6% 25,002 24,929
4. Financial Governance 77,802 - - 77,802 76,889 913 98.8% 85,162 80,806
5. Municipal Financial Governance 124,853 - - 124,853 112,446 12,407 90.1% 392,289 391,961
Subtotal 462,690 - - 462,690 440,995 21,695 95.3% 717,277 704,579
TOTAL 462,690 - - 462,690 440,995 21,695 95.3% 717,277 704,579
2018/19 2017/18
Final Appropriation
Actual Expenditure
Final Appropriation
Actual Expenditure
Reconciliation with Statement of Financial Performance
ADD
Departmental receipts 665,292 658,655
Aid Assistance 62
Actual amounts per Statement of Financial Performance (Total Revenue) 1,128,044 1,375,932
Aid Assistance 50 -
Actual amounts per Statement of Financial Performance (Total Expenditure)
441,045 704,579

ANNUAL REPORT FOR 2018/19 FINANCIAL YEAR - VOTE 12: EASTERN CAPE PROVINCIAL TREASURY 117
Appropriation per economic classification
2018/19 2017/18
Adjusted Appropriation
Shifting of Funds
VirementFinal Appropriation
Actual Expenditure
VarianceExpenditure as % of final appropriation
Final Appropriation
Actual Expenditure
Economic classification R'000 R'000 R'000 R'000 R'000 R'000 % R'000 R'000
Current payments 373,287 (456) - 372,831 364,023 8,808 97.6% 358,520 347,016
Compensation of employees 304,825 (289) - 304,536 302,714 1,822 99.4% 292,421 284,819
Salaries and wages 267,782 519 - 268,301 266,990 1,311 99.5% 257,237 251,108
Social contributions 37,043 (808) - 36,235 35,724 511 98.6% 35,184 33,711
Goods and services 68,462 (167) - 68,295 61,309 6,986 89.8% 66,099 62,197
Administrative fees 589 5 - 594 345 249 58.1% 108 66
Advertising 1,321 32 - 1,353 970 383 71.7% 1,133 1,119
Minor assets 365 55 - 420 308 112 73.3% 253 231
Audit costs: External 11,260 24 - 11,284 10,507 777 93.1% 12,399 11,822
Bursaries: Employees 515 - - 515 514 1 99.8% 277 267
Catering: Departmental activities
1,411 (51) - 1,360 1,226 134 90.1% 1,244 1,120
Communication 2,149 (21) - 2,128 2,008 120 94.4% 3,459 3,352
Computer services 7,809 (582) - 7,227 6,900 327 95.5% 6,837 6,750
Consultants: Business and advisory services
7,351 (894) - 6,457 4,580 1,877 70.9% 5,601 4,704
Legal services 418 (15) - 403 386 17 95.8% 1 1
Contractors 912 76 - 988 888 100 89.9% 1,288 1,198
Agency and support / outsourced services
15 - - 15 15 - 100.0% 15 15
Entertainment 195 (24) - 171 139 32 81.3% 137 101
Fleet services 732 103 - 835 830 5 99.4% 725 673
Consumable supplies 731 (158) - 573 451 122 78.7% 504 326
Consumable: Stationery, printing and office supplies
2,039 250 - 2,289 2,198 91 96.0% 1,715 1,587
Operating leases 2,323 71 - 2,394 2,372 22 99.1% 2,006 2,004
Property payments 4,925 - - 4,925 4,911 14 99.7% 4,953 4,895
Travel and subsistence 13,924 300 - 14,224 12,430 1,794 87.3% 11,911 10,801
Training and development
5,362 (7) - 5,355 5,321 34 99.4% 7,139 6,971
Operating payments 3,488 530 - 4,018 3,441 577 85.6% 4,079 3,910
Venues and facilities 628 139 - 767 569 198 74.2% 315 284
Transfers and subsidies 79,234 289 - 79,523 67,341 12,182 84.7% 354,377 354,181
Provinces and municipalities
52,934 - - 52,934 41,362 11,572 78.1% 92,985 92,985
Municipalities 52,934 - - 52,934 41,362 11,572 78.1% 92,985 92,985
Municipal bank accounts 52,934 - - 52,934 41,362 11,572 78.1% 92,985 92,985
Departmental agencies and accounts
22,742 - - 22,742 22,405 337 98.5% 252,834 252,667
Departmental agencies and accounts (non-business entities)
22,742 - - 22,742 22,405 337 98.5% 252,834 252,667
Households 3,558 289 - 3,847 3,574 273 92.9% 8,558 8,529
Social benefits 2,688 289 - 2,977 2,795 182 93.9% 7,727 7,710
Other transfers to households
870 - - 870 779 91 89.5% 831 819
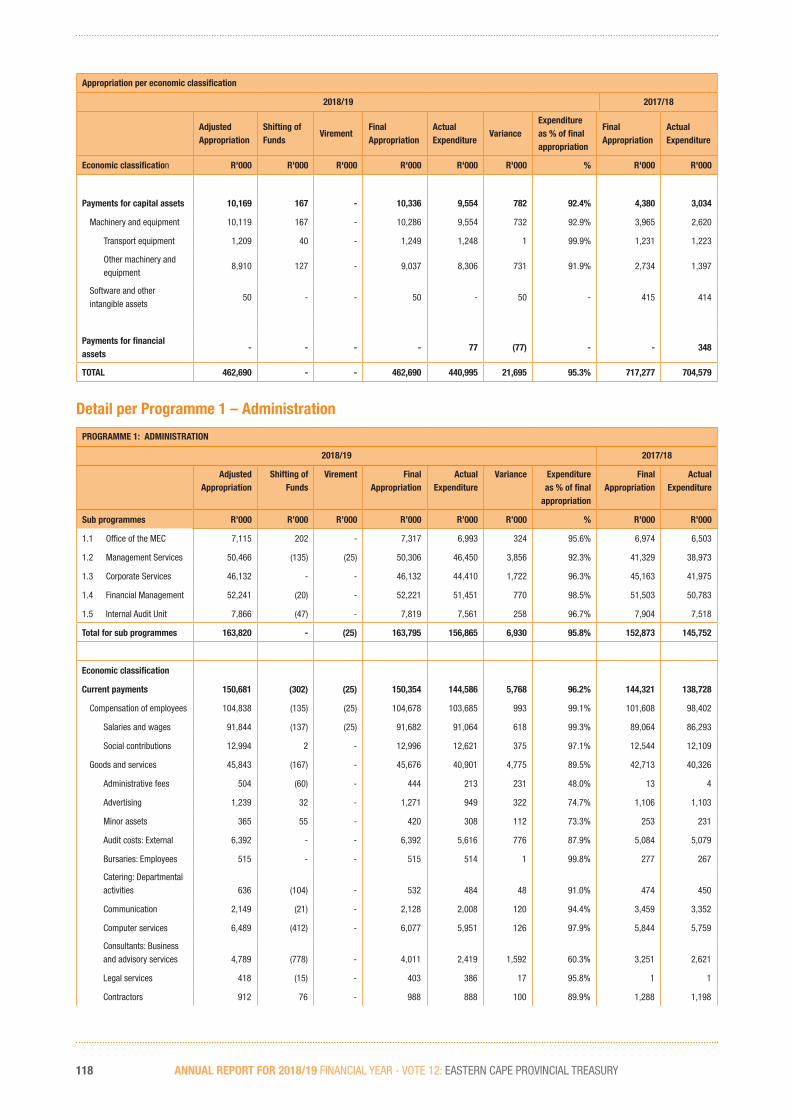
ANNUAL REPORT FOR 2018/19 FINANCIAL YEAR - VOTE 12: EASTERN CAPE PROVINCIAL TREASURY118
Appropriation per economic classification
2018/19 2017/18
Adjusted Appropriation
Shifting of Funds
VirementFinal Appropriation
Actual Expenditure
VarianceExpenditure as % of final appropriation
Final Appropriation
Actual Expenditure
Economic classification R'000 R'000 R'000 R'000 R'000 R'000 % R'000 R'000
Payments for capital assets 10,169 167 - 10,336 9,554 782 92.4% 4,380 3,034
Machinery and equipment 10,119 167 - 10,286 9,554 732 92.9% 3,965 2,620
Transport equipment 1,209 40 - 1,249 1,248 1 99.9% 1,231 1,223
Other machinery and equipment
8,910 127 - 9,037 8,306 731 91.9% 2,734 1,397
Software and other intangible assets
50 - - 50 - 50 - 415 414
Payments for financial assets
- - - - 77 (77) - - 348
TOTAL 462,690 - - 462,690 440,995 21,695 95.3% 717,277 704,579
Detail per Programme 1 – Administration
PROGRAMME 1: ADMINISTRATION
2018/19 2017/18
Adjusted Appropriation
Shifting of Funds
Virement Final Appropriation
Actual Expenditure
Variance Expenditure as % of final
appropriation
Final Appropriation
Actual Expenditure
Sub programmes R’000 R’000 R’000 R’000 R’000 R’000 % R’000 R’000
1.1 Office of the MEC 7,115 202 - 7,317 6,993 324 95.6% 6,974 6,503
1.2 Management Services 50,466 (135) (25) 50,306 46,450 3,856 92.3% 41,329 38,973
1.3 Corporate Services 46,132 - - 46,132 44,410 1,722 96.3% 45,163 41,975
1.4 Financial Management 52,241 (20) - 52,221 51,451 770 98.5% 51,503 50,783
1.5 Internal Audit Unit 7,866 (47) - 7,819 7,561 258 96.7% 7,904 7,518
Total for sub programmes 163,820 - (25) 163,795 156,865 6,930 95.8% 152,873 145,752
Economic classification
Current payments 150,681 (302) (25) 150,354 144,586 5,768 96.2% 144,321 138,728
Compensation of employees 104,838 (135) (25) 104,678 103,685 993 99.1% 101,608 98,402
Salaries and wages 91,844 (137) (25) 91,682 91,064 618 99.3% 89,064 86,293
Social contributions 12,994 2 - 12,996 12,621 375 97.1% 12,544 12,109
Goods and services 45,843 (167) - 45,676 40,901 4,775 89.5% 42,713 40,326
Administrative fees 504 (60) - 444 213 231 48.0% 13 4
Advertising 1,239 32 - 1,271 949 322 74.7% 1,106 1,103
Minor assets 365 55 - 420 308 112 73.3% 253 231
Audit costs: External 6,392 - - 6,392 5,616 776 87.9% 5,084 5,079
Bursaries: Employees 515 - - 515 514 1 99.8% 277 267
Catering: Departmental activities 636 (104) - 532 484 48 91.0% 474 450
Communication 2,149 (21) - 2,128 2,008 120 94.4% 3,459 3,352
Computer services 6,489 (412) - 6,077 5,951 126 97.9% 5,844 5,759
Consultants: Business and advisory services 4,789 (778) - 4,011 2,419 1,592 60.3% 3,251 2,621
Legal services 418 (15) - 403 386 17 95.8% 1 1
Contractors 912 76 - 988 888 100 89.9% 1,288 1,198
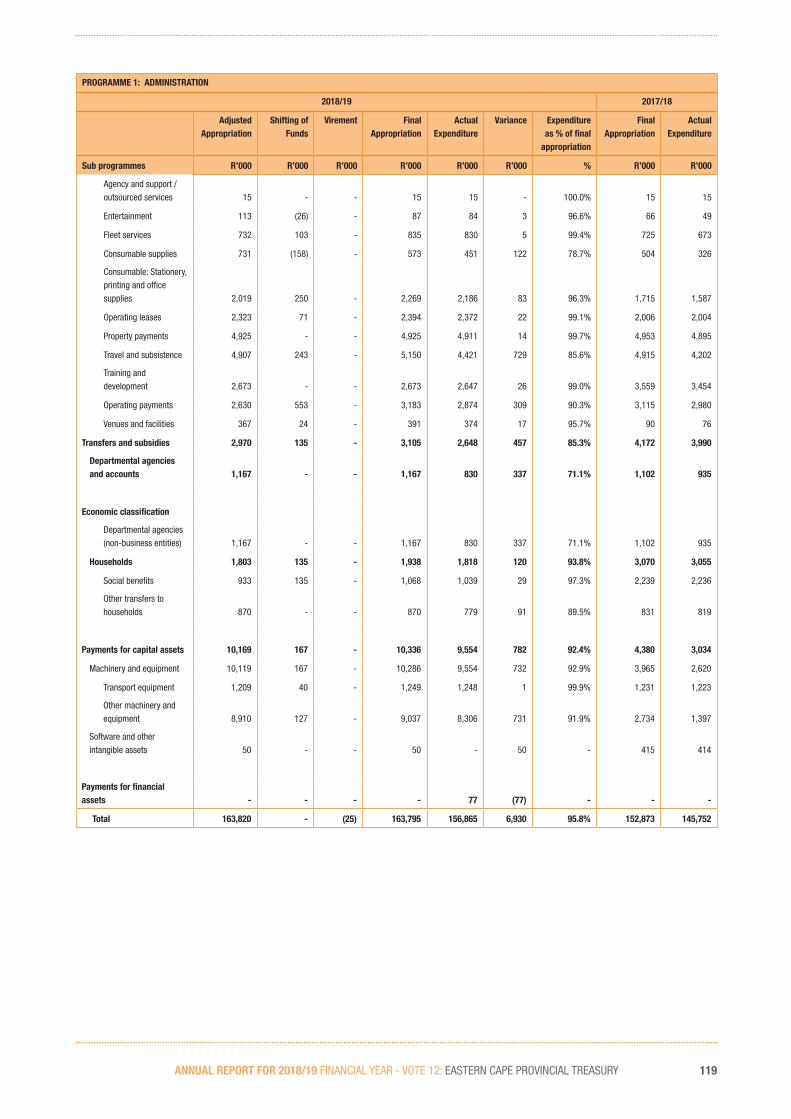
ANNUAL REPORT FOR 2018/19 FINANCIAL YEAR - VOTE 12: EASTERN CAPE PROVINCIAL TREASURY 119
PROGRAMME 1: ADMINISTRATION
2018/19 2017/18
Adjusted Appropriation
Shifting of Funds
Virement Final Appropriation
Actual Expenditure
Variance Expenditure as % of final
appropriation
Final Appropriation
Actual Expenditure
Sub programmes R’000 R’000 R’000 R’000 R’000 R’000 % R’000 R’000
Agency and support / outsourced services 15 - - 15 15 - 100.0% 15 15
Entertainment 113 (26) - 87 84 3 96.6% 66 49
Fleet services 732 103 - 835 830 5 99.4% 725 673
Consumable supplies 731 (158) - 573 451 122 78.7% 504 326
Consumable: Stationery, printing and office supplies 2,019 250 - 2,269 2,186 83 96.3% 1,715 1,587
Operating leases 2,323 71 - 2,394 2,372 22 99.1% 2,006 2,004
Property payments 4,925 - - 4,925 4,911 14 99.7% 4,953 4,895
Travel and subsistence 4,907 243 - 5,150 4,421 729 85.6% 4,915 4,202
Training and development 2,673 - - 2,673 2,647 26 99.0% 3,559 3,454
Operating payments 2,630 553 - 3,183 2,874 309 90.3% 3,115 2,980
Venues and facilities 367 24 - 391 374 17 95.7% 90 76
Transfers and subsidies 2,970 135 - 3,105 2,648 457 85.3% 4,172 3,990
Departmental agencies and accounts 1,167 - - 1,167 830 337 71.1% 1,102 935
Economic classification
Departmental agencies (non-business entities) 1,167 - - 1,167 830 337 71.1% 1,102 935
Households 1,803 135 - 1,938 1,818 120 93.8% 3,070 3,055
Social benefits 933 135 - 1,068 1,039 29 97.3% 2,239 2,236
Other transfers to households 870 - - 870 779 91 89.5% 831 819
Payments for capital assets 10,169 167 - 10,336 9,554 782 92.4% 4,380 3,034
Machinery and equipment 10,119 167 - 10,286 9,554 732 92.9% 3,965 2,620
Transport equipment 1,209 40 - 1,249 1,248 1 99.9% 1,231 1,223
Other machinery and equipment 8,910 127 - 9,037 8,306 731 91.9% 2,734 1,397
Software and other intangible assets 50 - - 50 - 50 - 415 414
Payments for financial assets - - - - 77 (77) - - -
Total 163,820 - (25) 163,795 156,865 6,930 95.8% 152,873 145,752
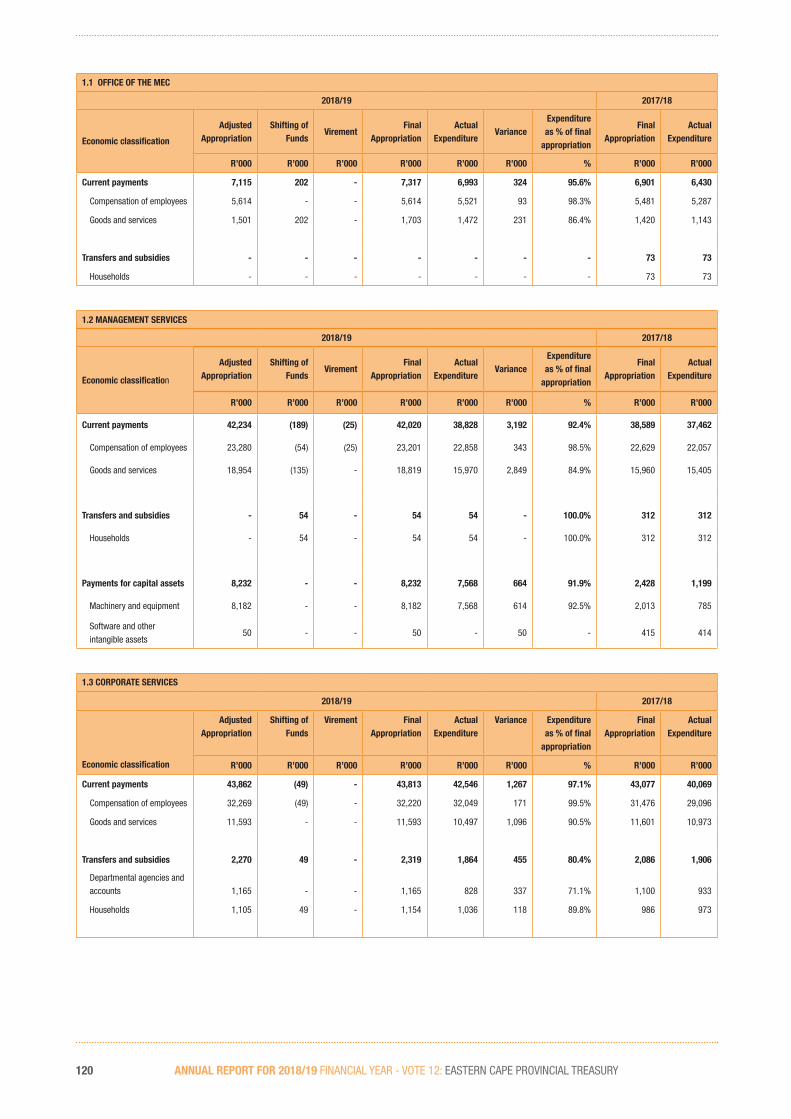
ANNUAL REPORT FOR 2018/19 FINANCIAL YEAR - VOTE 12: EASTERN CAPE PROVINCIAL TREASURY120
1.1 OFFICE OF THE MEC
2018/19 2017/18
Economic classification
Adjusted Appropriation
Shifting of Funds
VirementFinal
AppropriationActual
ExpenditureVariance
Expenditure as % of final
appropriation
Final Appropriation
Actual Expenditure
R’000 R’000 R’000 R’000 R’000 R’000 % R’000 R’000
Current payments 7,115 202 - 7,317 6,993 324 95.6% 6,901 6,430
Compensation of employees 5,614 - - 5,614 5,521 93 98.3% 5,481 5,287
Goods and services 1,501 202 - 1,703 1,472 231 86.4% 1,420 1,143
Transfers and subsidies - - - - - - - 73 73
Households - - - - - - - 73 73
1.2 MANAGEMENT SERVICES
2018/19 2017/18
Economic classification
Adjusted Appropriation
Shifting of Funds
VirementFinal
AppropriationActual
ExpenditureVariance
Expenditure as % of final
appropriation
Final Appropriation
Actual Expenditure
R’000 R’000 R’000 R’000 R’000 R’000 % R’000 R’000
Current payments 42,234 (189) (25) 42,020 38,828 3,192 92.4% 38,589 37,462
Compensation of employees 23,280 (54) (25) 23,201 22,858 343 98.5% 22,629 22,057
Goods and services 18,954 (135) - 18,819 15,970 2,849 84.9% 15,960 15,405
Transfers and subsidies - 54 - 54 54 - 100.0% 312 312
Households - 54 - 54 54 - 100.0% 312 312
Payments for capital assets 8,232 - - 8,232 7,568 664 91.9% 2,428 1,199
Machinery and equipment 8,182 - - 8,182 7,568 614 92.5% 2,013 785
Software and other intangible assets
50 - - 50 - 50 - 415 414
1.3 CORPORATE SERVICES
2018/19 2017/18
Adjusted Appropriation
Shifting of Funds
Virement Final Appropriation
Actual Expenditure
Variance Expenditure as % of final
appropriation
Final Appropriation
Actual Expenditure
Economic classification R’000 R’000 R’000 R’000 R’000 R’000 % R’000 R’000
Current payments 43,862 (49) - 43,813 42,546 1,267 97.1% 43,077 40,069
Compensation of employees 32,269 (49) - 32,220 32,049 171 99.5% 31,476 29,096
Goods and services 11,593 - - 11,593 10,497 1,096 90.5% 11,601 10,973
Transfers and subsidies 2,270 49 - 2,319 1,864 455 80.4% 2,086 1,906
Departmental agencies and accounts 1,165 - - 1,165 828 337 71.1% 1,100 933
Households 1,105 49 - 1,154 1,036 118 89.8% 986 973

ANNUAL REPORT FOR 2018/19 FINANCIAL YEAR - VOTE 12: EASTERN CAPE PROVINCIAL TREASURY 121
1.4 FINANCIAL MANAGEMENT
2018/19 2017/18
Adjusted Appropriation
Shifting of Funds
VirementFinal
AppropriationActual
ExpenditureVariance
Expenditure as % of final
appropriation
Final Appropriation
Actual Expenditure
Economic classification R’000 R’000 R’000 R’000 R’000 R’000 % R’000 R’000
Current payments 49,609 (214) - 49,395 48,667 728 98.5% 47,888 47,287
Compensation of employees 36,725 (27) - 36,698 36,459 239 99.3% 35,528 35,491
Goods and services 12,884 (187) - 12,697 12,208 489 96.1% 12,360 11,796
Transfers and subsidies 695 27 - 722 721 1 99.9% 1,663 1,661
Departmental agencies and accounts
2 - - 2 2 - 100.0% 2 2
Households 693 27 - 720 719 1 99.9% 1,661 1,659
Payments for capital assets 1,937 167 - 2,104 1,986 118 94.4% 1,952 1,835
Machinery and equipment 1,937 167 - 2,104 1,986 118 94.4% 1,952 1,835
Payments for financial assets
- - - - 77 (77) - - -
1.5 INTERNAL AUDIT UNIT
2018/19 2017/18
Adjusted Appropriation
Shifting of Funds
VirementFinal
AppropriationActual
ExpenditureVariance
Expenditure as % of final
appropriation
Final Appropriation
Actual Expenditure
Economic classification R’000 R’000 R’000 R’000 R’000 R’000 % R’000 R’000
Current payments 7,861 (52) - 7,809 7,552 257 96.7% 7,866 7,480
Compensation of employees 6,950 (5) - 6,945 6,798 147 97.9% 6,494 6,471
Goods and services 911 (47) - 864 754 110 87.3% 1,372 1,009
Transfers and subsidies 5 5 - 10 9 1 90.0% 38 38
Households 5 5 - 10 9 1 90.0% 38 38

ANNUAL REPORT FOR 2018/19 FINANCIAL YEAR - VOTE 12: EASTERN CAPE PROVINCIAL TREASURY122
Detail per Programme 2 – Sustainable Resource Management
PROGRAMME 2: SUSTAINABLE RESOURCE MANAGEMENT
2018/19 2017/18
Adjusted Appropriation
Shifting of Funds
VirementFinal
AppropriationActual
ExpenditureVariance
Expenditure as % of final
appropriation
Final Appropriation
Actual Expenditure
Sub programmes R’000 R’000 R’000 R’000 R’000 R’000 % R’000 R’000
2.1 Programme Support 2,892 43 - 2,935 2,746 189 93.6% 2,705 2,681
2.2 Economic Analysis 2,260 126 - 2,386 2,245 141 94.1% 1,762 1,656
2.3 Fiscal Policy 9,622 (47) - 9,575 9,512 63 99.3% 8,305 8,243
2.4 Budget Management 54,462 (122) - 54,340 53,659 681 98.7% 49,179 48,551
Total for sub programmes 69,236 - - 69,236 68,162 1,074 98.4% 61,951 61,131
Economic classification
Current payments 68,731 - - 68,731 67,658 1,073 98.4% 61,810 60,993
Compensation of employees 62,549 - - 62,549 62,337 212 99.7% 57,898 57,634
Salaries and wages 55,132 86 - 55,218 55,064 154 99.7% 51,120 50,902
Social contributions 7,417 (86) - 7,331 7,273 58 99.2% 6,778 6,732
Goods and services 6,182 - - 6,182 5,321 861 86.1% 3,912 3,359
Administrative fees 85 65 - 150 132 18 88.0% 95 62
Audit costs: External 722 - - 722 722 - 100.0% 503 446
Catering: Departmental activities
143 - - 143 121 22 84.6% 173 165
Consultants: Business and advisory services
2,346 (70) - 2,276 2,104 172 92.4% 848 658
Entertainment 33 - - 33 24 9 72.7% 28 18
Travel and subsistence 2,436 (25) - 2,411 1,958 453 81.2% 1,944 1,704
Operating payments 347 (57) - 290 202 88 69.7% 245 231
Venues and facilities 70 87 - 157 58 99 36.9% 76 75
Transfers and subsidies 505 - - 505 504 1 99.8% 141 138
Households 505 - - 505 504 1 99.8% 141 138
Social benefits 505 - - 505 504 1 99.8% 141 138
Total 69,236 - - 69,236 68,162 1,074 98.4% 61,951 61,131
2.1 PROGRAMME SUPPORT
2018/19 2017/18
Adjusted Appropriation
Shifting of Funds
VirementFinal
AppropriationActual
ExpenditureVariance
Expenditure as % of final
appropriation
Final Appropriation
Actual Expenditure
Economic classification R’000 R’000 R’000 R’000 R’000 R’000 % R’000 R’000
Current payments 2,892 43 - 2,935 2,746 189 93.6% 2,705 2,681
Compensation of employees 2,687 43 - 2,730 2,586 144 94.7% 2,486 2,480
Goods and services 205 - - 205 160 45 78.0% 219 201

ANNUAL REPORT FOR 2018/19 FINANCIAL YEAR - VOTE 12: EASTERN CAPE PROVINCIAL TREASURY 123
2.2 ECONOMIC ANALYSIS
2018/19 2017/18
Adjusted Appropriation
Shifting of Funds
Virement Final Appropriation
Actual Expenditure
Variance Expenditure as % of final
appropriation
Final Appropriation
Actual Expenditure
Economic classification R’000 R’000 R’000 R’000 R’000 R’000 % R’000 R’000
Current payments 2,260 126 - 2,386 2,245 141 94.1% 1,744 1,639
Compensation of employees 2,060 - - 2,060 2,049 11 99.5% 1,543 1,491
Goods and services 200 126 - 326 196 130 60.1% 201 148
Transfers and subsidies - - - - - - - 18 17
Households - - - - - - - 18 17
2.3 FISCAL POLICY
2018/19 2017/18
Adjusted Appropriation
Shifting of Funds
VirementFinal
AppropriationActual
ExpenditureVariance
Expenditure as % of final
appropriation
Final Appropriation
Actual Expenditure
Economic classification R’000 R’000 R’000 R’000 R’000 R’000 % R’000 R’000
Current payments 9,622 (47) - 9,575 9,512 63 99.3% 8,305 8,243
Compensation of employees 7,776 9 - 7,785 7,775 10 99.9% 7,327 7,284
Goods and services 1,846 (56) - 1,790 1,737 53 97.0% 978 959
2.4 BUDGET MANAGEMENT
2018/19 2017/18
Adjusted Appropriation
Shifting of Funds
VirementFinal
AppropriationActual
ExpenditureVariance
Expenditure as % of final
appropriation
Final Appropriation
Actual Expenditure
Economic classification R’000 R’000 R’000 R’000 R’000 R’000 % R’000 R’000
Current payments 53,957 (122) - 53,835 53,155 680 98.7% 49,056 48,430
Compensation of employees 50,026 (52) - 49,974 49,927 47 99.9% 46,542 46,379
Goods and services 3,931 (70) - 3,861 3,228 633 83.6% 2,514 2,051
Transfers and subsidies 505 - - 505 504 1 99.8% 123 121
Households 505 - - 505 504 1 99.8% 123 121

ANNUAL REPORT FOR 2018/19 FINANCIAL YEAR - VOTE 12: EASTERN CAPE PROVINCIAL TREASURY124
Detail per Programme 3 – Asset and Liabilities Management
PROGRAMME 3: ASSET AND LIABILITIES MANAGEMENT
2018/19 2017/18
Adjusted
Appropriation
Shifting of
FundsVirement
Final
Appropriation
Actual
ExpenditureVariance
Expenditure
as % of final
appropriation
Final
Appropriation
Actual
Expenditure
Sub programme R’000 R’000 R’000 R’000 R’000 R’000 % R’000 R’000
3.1 Asset Management 26,979 - 25 27,004 26,633 371 98.6% 25,002 24,929
Total for sub programmes 26,979 - 25 27,004 26,633 371 98.6% 25,002 24,929
Economic classification
Current payments 26,938 - 25 26,963 26,592 371 98.6% 25,002 24,929
Compensation of employees 24,125 - 25 24,150 24,140 10 100.0% 21,848 21,821
Salaries and wages 20,563 37 25 20,625 20,620 5 100.0% 19,187 19,164
Social contributions 3,562 (37) - 3,525 3,520 5 99.9% 2,661 2,657
Goods and services 2,813 - - 2,813 2,452 361 87.2% 3,154 3,108
Advertising 82 - - 82 21 61 25.6% 27 16
Catering: Departmental activities
190 40 - 230 224 6 97.4% 240 227
Consultants: Business and advisory services
216 (46) - 170 57 113 33.5% - -
Entertainment 10 - - 10 5 5 50.0% 8 6
Consumable: Stationery, printing and office supplies
20 - - 20 12 8 60.0% - -
Travel and subsistence 790 5 - 795 627 168 78.9% 707 689
Training and development
1,500 - 1,500 1,500 - 100.0% 2,123 2,122
Operating payments - - - - - - - 42 42
Venues and facilities 5 1 - 6 6 - 100.0% 7 6
Transfers and subsidies 41 - 41 41 - 100.0% - -
Households 41 - 41 41 - 100.0% - -
Social benefits 41 - 41 41 - 100.0% - -
Total 26,979 - 25 27,004 26,633 371 98.6% 25,002 24,929
3.1 ASSET MANAGEMENT
2018/19 2017/18
Adjusted Appropriation
Shifting of Funds
VirementFinal
AppropriationActual
ExpenditureVariance
Expenditure as % of final
appropriation
Final Appropriation
Actual Expenditure
Economic classification R’000 R’000 R’000 R’000 R’000 R’000 % R’000 R’000
Current payments 26,938 - 25 26,963 26,592 371 98.6% 25,002 24,929
Compensation of employees 24,125 - 25 24,150 24,140 10 100.0% 21,848 21,821
Goods and services 2,813 - - 2,813 2,452 361 87.2% 3,154 3,108
Transfers and subsidies 41 - - 41 41 - 100.0% - -
Households 41 - - 41 41 - 100.0% - -

ANNUAL REPORT FOR 2018/19 FINANCIAL YEAR - VOTE 12: EASTERN CAPE PROVINCIAL TREASURY 125
Detail per Programme 4 – Financial Governance
PROGRAMME 4: FINANCIAL GOVERNANCE
2018/19 2017/18
Adjusted Appropriation
Shifting of Funds
VirementFinal
AppropriationActual
ExpenditureVariance
Expenditure as % of final
appropriation
Final Appropriation
Actual Expenditure
Sub programmes R’000 R’000 R’000 R’000 R’000 R’000 % R’000 R’000
4.1 Programme Support 17,376 554 - 17,930 17,774 156 99.1% 20,422 18,944
4.2 Accounting Services 13,309 (293) - 13,016 12,800 216 98.3% 14,313 13,771
4.3 Norms and Standards 6,944 (19) - 6,925 6,899 26 99.6% 8,366 8,237
4.4 Risk Management 4,218 (16) - 4,202 4,191 11 99.7% 4,047 3,778
4.5 Provincial Internal Audit 12,615 (34) - 12,581 12,539 42 99.7% 15,629 14,748
4.6 Supporting &Interlinked Financial Systems
23,340 (192) - 23,148 22,686 462 98.0% 22,385 21,328
Total for sub programmes 77,802 - - 77,802 76,889 913 98.8% 85,162 80,806
Economic classification
Current payments 76,682 - - 76,682 75,920 762 99.0% 82,064 77,370
Compensation of employees 67,227 - - 67,227 67,058 169 99.7% 68,955 65,143
Salaries and wages 59,154 692 - 59,846 59,691 155 99.7% 60,314 57,458
Social contributions 8,073 (692) - 7,381 7,367 14 99.8% 8,641 7,685
Goods and services 9,455 - - 9,455 8,862 593 93.7% 13,109 12,227
Audit costs: External 4,146 24 - 4,170 4,169 1 100.0% 6,812 6,297
Catering: Departmental activities
259 (20) - 239 221 18 92.5% 264 185
Computer services 1,320 (170) - 1,150 949 201 82.5% 857 856
Consultants: Business and advisory services
- - - - - - - 1,502 1,425
Entertainment 21 2 - 23 15 8 65.2% 23 19
Travel and subsistence 2,128 89 - 2,217 2,051 166 92.5% 1,948 1,835
Training and development
1,189 (7) - 1,182 1,174 8 99.3% 1,457 1,395
Operating payments 257 84 - 341 208 133 61.0% 177 160
Venues and facilities 135 (2) - 133 75 58 56.4% 69 55
Transfers and subsidies 1,120 - - 1,120 969 151 86.5% 3,098 3,088
Households 1,120 - - 1,120 969 151 86.5% 3,098 3,088
Social benefits 1,120 - - 1,120 969 151 86.5% 3,098 3,088
Payment for financial assets - - - - - - - - 348
Total 77,802 - - 77,802 76,889 913 98.8% 85,162 80,806

ANNUAL REPORT FOR 2018/19 FINANCIAL YEAR - VOTE 12: EASTERN CAPE PROVINCIAL TREASURY126
4.1 PROGRAMME SUPPORT
2018/19 2017/18
Economic classification
Adjusted Appropriation
Shifting of Funds
VirementFinal
AppropriationActual
ExpenditureVariance
Expenditure as % of final
appropriation
Final Appropriation
Actual Expenditure
R’000 R’000 R’000 R’000 R’000 R’000 % R’000 R’000
Current payments 17,172 554 - 17,726 17,570 156 99.1% 20,115 18,290
Compensation of employees 16,935 500 - 17,435 17,306 129 99.3% 19,095 17,283
Goods and services 237 54 - 291 264 27 90.7% 1,020 1,007
Transfers and subsidies 204 - - 204 204 - 100.0% 307 306
Households 204 - - 204 204 - 100.0% 307 306
Payment for financial assets - - - - - - - - 348
4.2 ACCOUNTING SERVICES
2018/19 2017/18
Adjusted Appropriation
Shifting of Funds
VirementFinal
AppropriationActual
ExpenditureVariance
Expenditure as % of final
appropriation
Final Appropriation
Actual Expenditure
Economic classification R’000 R’000 R’000 R’000 R’000 R’000 % R’000 R’000
Current payments 12,815 (293) - 12,522 12,456 66 99.5% 13,411 12,870
Compensation of employees 11,934 (293) - 11,641 11,623 18 99.8% 12,557 12,088
Goods and services 881 - - 881 833 48 94.6% 854 782
Transfers and subsidies 494 - - 494 344 150 69.6% 902 901
Households 494 - - 494 344 150 69.6% 902 901
4.3 NORMS AND STANDARDS
2018/19 2017/18
Adjusted Appropriation
Shifting of Funds
VirementFinal
AppropriationActual
ExpenditureVariance
Expenditure as % of final
appropriation
Final Appropriation
Actual Expenditure
Economic classification R’000 R’000 R’000 R’000 R’000 R’000 % R’000 R’000
Current payments 6,545 (19) - 6,526 6,500 26 99.6% 7,150 7,021
Compensation of employees 6,483 (19) - 6,464 6,458 6 99.9% 7,035 6,944
Goods and services 62 - - 62 42 20 67.7% 115 77
Transfers and subsidies 399 - - 399 399 - 100.0% 1,216 1,216
Households 399 - - 399 399 - 100.0% 1,216 1,216
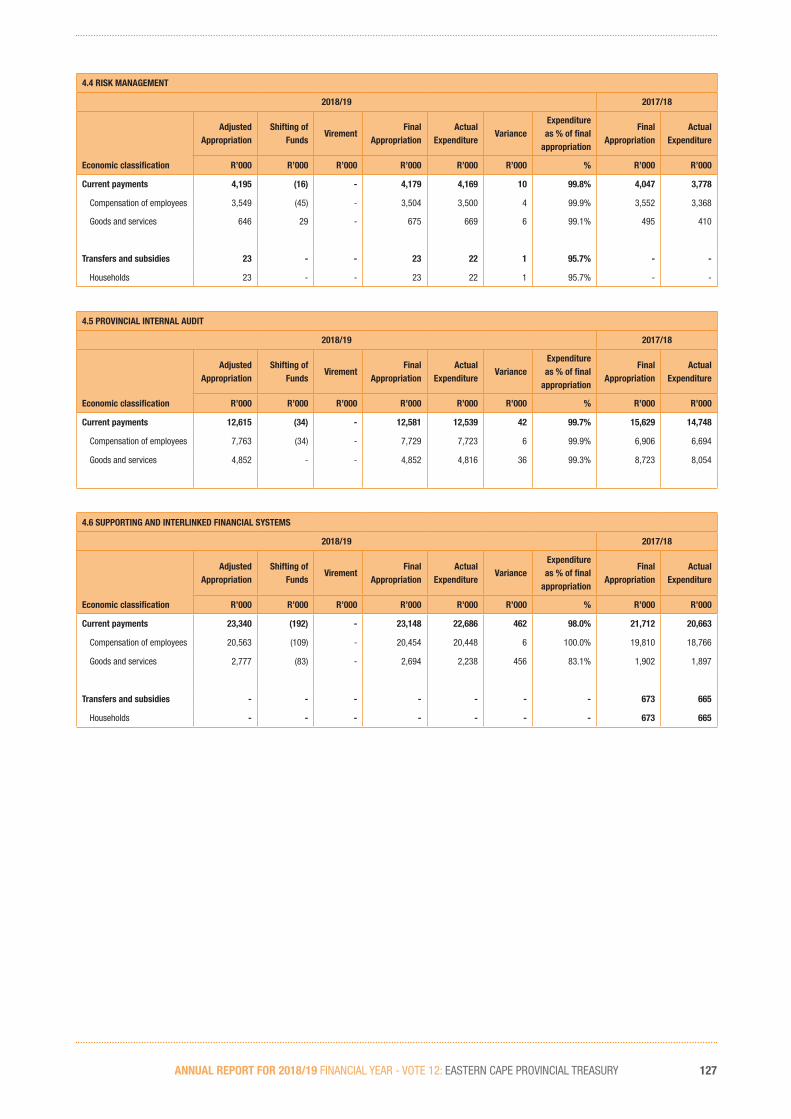
ANNUAL REPORT FOR 2018/19 FINANCIAL YEAR - VOTE 12: EASTERN CAPE PROVINCIAL TREASURY 127
4.4 RISK MANAGEMENT
2018/19 2017/18
Adjusted Appropriation
Shifting of Funds
VirementFinal
AppropriationActual
ExpenditureVariance
Expenditure as % of final
appropriation
Final Appropriation
Actual Expenditure
Economic classification R’000 R’000 R’000 R’000 R’000 R’000 % R’000 R’000
Current payments 4,195 (16) - 4,179 4,169 10 99.8% 4,047 3,778
Compensation of employees 3,549 (45) - 3,504 3,500 4 99.9% 3,552 3,368
Goods and services 646 29 - 675 669 6 99.1% 495 410
Transfers and subsidies 23 - - 23 22 1 95.7% - -
Households 23 - - 23 22 1 95.7% - -
4.5 PROVINCIAL INTERNAL AUDIT
2018/19 2017/18
Adjusted Appropriation
Shifting of Funds
VirementFinal
AppropriationActual
ExpenditureVariance
Expenditure as % of final
appropriation
Final Appropriation
Actual Expenditure
Economic classification R’000 R’000 R’000 R’000 R’000 R’000 % R’000 R’000
Current payments 12,615 (34) - 12,581 12,539 42 99.7% 15,629 14,748
Compensation of employees 7,763 (34) - 7,729 7,723 6 99.9% 6,906 6,694
Goods and services 4,852 - - 4,852 4,816 36 99.3% 8,723 8,054
4.6 SUPPORTING AND INTERLINKED FINANCIAL SYSTEMS
2018/19 2017/18
Adjusted Appropriation
Shifting of Funds
VirementFinal
AppropriationActual
ExpenditureVariance
Expenditure as % of final
appropriation
Final Appropriation
Actual Expenditure
Economic classification R’000 R’000 R’000 R’000 R’000 R’000 % R’000 R’000
Current payments 23,340 (192) - 23,148 22,686 462 98.0% 21,712 20,663
Compensation of employees 20,563 (109) - 20,454 20,448 6 100.0% 19,810 18,766
Goods and services 2,777 (83) - 2,694 2,238 456 83.1% 1,902 1,897
Transfers and subsidies - - - - - - - 673 665
Households - - - - - - - 673 665
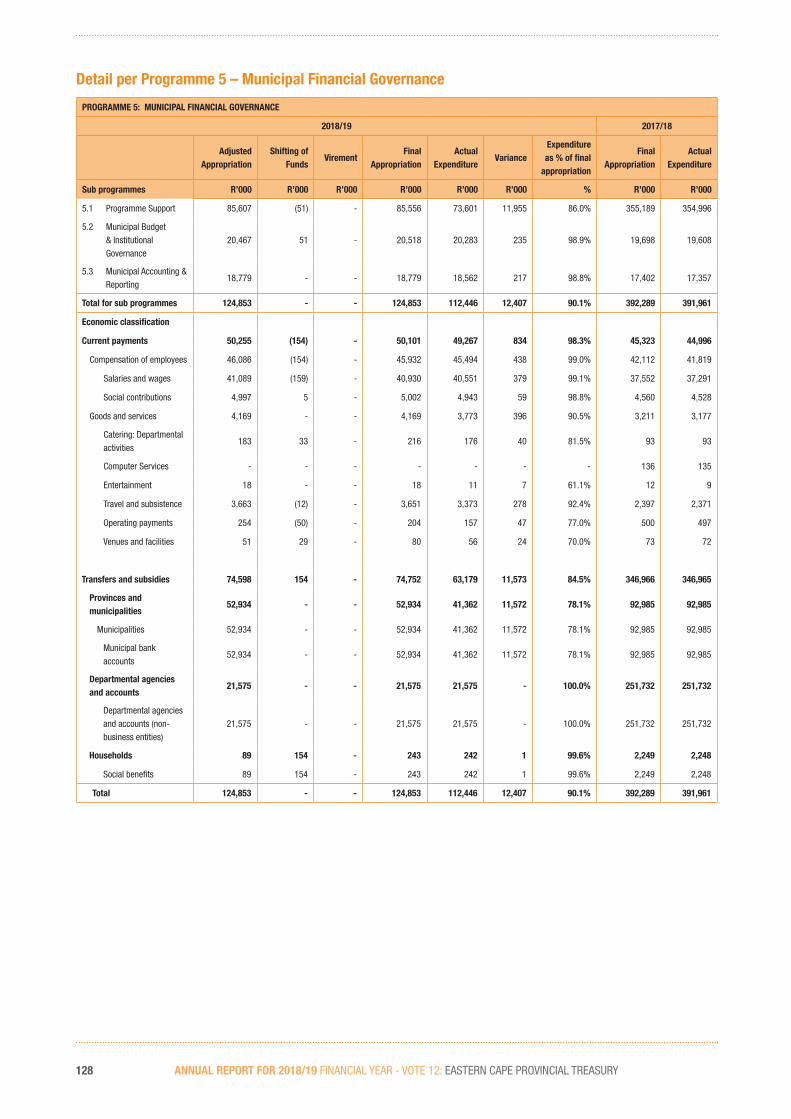
ANNUAL REPORT FOR 2018/19 FINANCIAL YEAR - VOTE 12: EASTERN CAPE PROVINCIAL TREASURY128
Detail per Programme 5 – Municipal Financial Governance
PROGRAMME 5: MUNICIPAL FINANCIAL GOVERNANCE
2018/19 2017/18
Adjusted Appropriation
Shifting of Funds
VirementFinal
AppropriationActual
ExpenditureVariance
Expenditure as % of final
appropriation
Final Appropriation
Actual Expenditure
Sub programmes R’000 R’000 R’000 R’000 R’000 R’000 % R’000 R’000
5.1 Programme Support 85,607 (51) - 85,556 73,601 11,955 86.0% 355,189 354,996
5.2 Municipal Budget & Institutional Governance
20,467 51 - 20,518 20,283 235 98.9% 19,698 19,608
5.3 Municipal Accounting & Reporting
18,779 - - 18,779 18,562 217 98.8% 17,402 17,357
Total for sub programmes 124,853 - - 124,853 112,446 12,407 90.1% 392,289 391,961
Economic classification
Current payments 50,255 (154) - 50,101 49,267 834 98.3% 45,323 44,996
Compensation of employees 46,086 (154) - 45,932 45,494 438 99.0% 42,112 41,819
Salaries and wages 41,089 (159) - 40,930 40,551 379 99.1% 37,552 37,291
Social contributions 4,997 5 - 5,002 4,943 59 98.8% 4,560 4,528
Goods and services 4,169 - - 4,169 3,773 396 90.5% 3,211 3,177
Catering: Departmental activities
183 33 - 216 176 40 81.5% 93 93
Computer Services - - - - - - - 136 135
Entertainment 18 - - 18 11 7 61.1% 12 9
Travel and subsistence 3,663 (12) - 3,651 3,373 278 92.4% 2,397 2,371
Operating payments 254 (50) - 204 157 47 77.0% 500 497
Venues and facilities 51 29 - 80 56 24 70.0% 73 72
Transfers and subsidies 74,598 154 - 74,752 63,179 11,573 84.5% 346,966 346,965
Provinces and municipalities
52,934 - - 52,934 41,362 11,572 78.1% 92,985 92,985
Municipalities 52,934 - - 52,934 41,362 11,572 78.1% 92,985 92,985
Municipal bank accounts
52,934 - - 52,934 41,362 11,572 78.1% 92,985 92,985
Departmental agencies and accounts
21,575 - - 21,575 21,575 - 100.0% 251,732 251,732
Departmental agencies and accounts (non-business entities)
21,575 - - 21,575 21,575 - 100.0% 251,732 251,732
Households 89 154 - 243 242 1 99.6% 2,249 2,248
Social benefits 89 154 - 243 242 1 99.6% 2,249 2,248
Total 124,853 - - 124,853 112,446 12,407 90.1% 392,289 391,961

ANNUAL REPORT FOR 2018/19 FINANCIAL YEAR - VOTE 12: EASTERN CAPE PROVINCIAL TREASURY 129
5.1 PROGRAMME SUPPORT
2018/19 2017/18
Adjusted Appropriation
Shifting of Funds
VirementFinal
AppropriationActual
ExpenditureVariance
Expenditure as % of final
appropriation
Final Appropriation
Actual Expenditure
Economic classification R’000 R’000 R’000 R’000 R’000 R’000 % R’000 R’000
Current payments 11,098 (116) - 10,982 10,600 382 96.5% 9,077 8,885
Compensation of employees 9,480 (116) - 9,364 9,123 241 97.4% 7,740 7,555
Goods and services 1,618 - - 1,618 1,477 141 91.3% 1,337 1,330
Transfers and subsidies 74,509 65 - 74,574 63,001 11,573 84.5% 346,112 346,111
Provinces & Municipalities 52,934 - - 52,934 41,362 11,572 78.1% 92,985 92,985
Departmental Agencies & Accounts
21,575 - - 21,575 21,575 - 100.0% 251,732 251,732
Households - 65 - 65 64 1 98.5% 1,395 1,394
5.2 MUNICIPAL BUDGET & INSTITUTIONAL GOVERNANCE
2018/19 2017/18
Adjusted Appropriation
Shifting of Funds
VirementFinal
AppropriationActual
ExpenditureVariance
Expenditure as % of final
appropriation
Final Appropriation
Actual Expenditure
Economic classification R’000 R’000 R’000 R’000 R’000 R’000 % R’000 R’000
Current payments 20,443 (38) - 20,405 20,170 235 98.8% 18,864 18,774
Compensation of employees 19,119 (38) - 19,081 19,038 43 99.8% 18,022 17,946
Goods and services 1,324 - - 1,324 1,132 192 85.5% 842 828
Transfers and subsidies 24 89 - 113 113 - 100.0% 834 834
Households 24 89 - 113 113 - 100.0% 834 834
5.3 MUNICIPAL ACCOUNTING & REPORTING
2018/19 2017/18
Adjusted Appropriation
Shifting of Funds
VirementFinal
AppropriationActual
ExpenditureVariance
Expenditure as % of final
appropriation
Final Appropriation
Actual Expenditure
Economic classification R’000 R’000 R’000 R’000 R’000 R’000 % R’000 R’000
Current payments 18,714 - - 18,714 18,497 217 98.8% 17,382 17,337
Compensation of employees 17,487 - - 17,487 17,333 154 99.1% 16,350 16,318
Goods and services 1,227 - - 1,227 1,164 63 94.9% 1,032 1,019
Transfers and subsidies 65 - - 65 65 - 100.0% 20 20
Households 65 - - 65 65 - 100.0% 20 20

ANNUAL REPORT FOR 2018/19 FINANCIAL YEAR - VOTE 12: EASTERN CAPE PROVINCIAL TREASURY130
5.2.2. NOTES TO THE APPROPRIATION STATEMENT
1. Detail of transfers and subsidies as per Appropriation Act (after Virement): Detail of these transactions can be viewed in the note 7 (Transfers and Subsidies), disclosure notes and
Annexure 1 A-C of the Annual Financial Statements.
2. Detail of specifically and exclusively appropriated amounts voted (after Virement): Detail of these transactions can be viewed in note 1 (Annual Appropriation) of the Annual Financial
Statements.
3. Detail on payments for financial assets Detail of these transactions per programme can be viewed in note 6 (Payments for Financial Assets) of
the Annual Financial Statements.
4. Explanations of material variances from Amounts Voted (after Virement):
4.1 Per programmeFinal Appropriation Actual Expenditure Variance
Variance as a % of Final Appropriation
R’000 R’000 R’000 %
(I) Administration 163,795 156,865 6,930 4.2%
(II) Sustainable Resource Management 69,236 68,162 1,074 1.6%
(III) Asset and Liabilities Management 27,004 26,633 371 1.4%
(IV) Financial Governance 77,802 76,889 913 1.2%
(V) Municipal Financial Governance 124,853 112,446 12,407 9.9%
Total 462,690 440,995 21,695 4.7%
4.2 Per economic classificationFinal Appropriation Actual Expenditure Variance
Variance as a % of Final Appropriation
R’000 R’000 R’000 %
Current Payments 372,831 364,023 8,808 2.4%
Compensation of employees 304,536 302,714 1,822 0.6%
Goods and services 68,295 61,309 6,986 10.2%
Transfers & Subsidies 79,523 67,341 12,182 15.3%
Provinces and Municipalities 52,934 41,362 11,572 21.9%
Departmental agencies & accounts 22,742 22,405 337 1.5%
Households 3,847 3,574 273 7.1%
Payment for Capital Assets 10,336 9,554 782 7.6%
Machinery & equipment 10,286 9,554 732 7.1%
Software and other intangible assets 50 - 50 100.0%
Payment for Financial Assets - 77 (77) 0.0%
Thefts and Losses - 77 (77) 0.0%
Total 462,690 440,995 21,695 4.7%
ANNUAL REPORT FOR 2018/19 FINANCIAL YEAR - VOTE 12: EASTERN CAPE PROVINCIAL TREASURY 131
(I) Programme 1: Administration – R6.930 millionCompensation of Employees
Variance: R0.993 million
The variance is mainly due to staff attrition, unavailability of suitable candidates and posts that were in the job evaluation process.
Goods and Services
Variance: R4.775 million.
The variance in goods and services mainly pertain to consultant fees due to late development of the terms of references for the Leadership Development Programme as well as the review of Programme 4; review of the departmental organisational structure which was delayed due to the complexity in completing the work volume analysis phase and invoices for provincial investigations being lower than anticipated, travel and subsistence mainly due to changes in the municipal finance audit scope; savings arising from accommodation provisions and teleconferencing in respect of audit committee meetings; provisions made for candidates attending the interviews; travel for DPSA engagement on the review of the departmental organisational structure did not take place as anticipated and late receipt of invoices in respect of trips undertaken, audit costs due to investigations invoiced being lower than anticipated, delays in procuring the electronic library due to internet connectivity challenges, provisions made for printing of bill board advertisements that did not materialise as well as inter-departmental claims processed for recruitment adverts being lower than anticipated, and savings realised in respect of printing of strategic documents, special gazettes and air travel.
Transfers and Subsidies
Variance: R0.457 million.
The variance pertains to skills development levy processed being lower than projected.
Payment of Capital Assets
Variance: R0.782 million.
The variance pertains to delays in the testing of the recently installed computer sever infrastructure due to electricity outages, late delivery of laptop computers by the service provider due to discontinuation by the original equipment manufacturer and challenges experienced with the computer system vulnerability software specification.
Payment of Financial Assets
Variance: (R0.077) million.
The variance pertains to write-off of long outstanding ex-employee debts that were irrecoverable.
A request has been made to Provincial Treasury for the roll-over of unspent funds amounting to R1.726 million in respect of organisational development projects and the computer server infrastructure project.
ANNUAL REPORT FOR 2018/19 FINANCIAL YEAR - VOTE 12: EASTERN CAPE PROVINCIAL TREASURY132
(II) Programme 2: Sustainable Resource Management – R1.074 million.Compensation of Employees
Variance: R0.212 million.
The minor variance is mainly due to late filling of two vacant posts.
Goods and Services
Variance: R0.861 million.
The minor variance mainly pertains to travel and subsistence due to official trips with National Treasury that did not take place as anticipated and consultancy fees due to invoice processed in respect of infrastructure services being lower than anticipated. Savings were also realised on air travel.
Transfers and Subsidies
Variance: R0.001 million.
The minor variance pertains to leave gratuity payments.
(III) Programme 3: Asset and Liability Management – R0.371 million. Compensation of Employees
Variance: R0.010 million.
The minor variance is due to performance incentives paid being lower than projected.
Goods and Services
Variance: R0.361 million.
The minor variance mainly pertains to consultancy fees due to infrastructure review reports that were finalised late in March 2019 and travel and subsistence due to late receipt of the RT3 contract workshop invitation from National Treasury as well as cancellation of SCM Acquisition Management training due to unavailability of departments.
(IV) Programme 4: Financial Governance – R0.913 million.Compensation of Employees
Variance: R0.169 million.
The minor variance is mainly due to staff attrition.
Goods and Services
Variance: R0.593 million.
The minor variance mainly pertains to computer services due to invoice for annual BAS licenses being lower than anticipated, travel and subsistence due to cancellation of BAS training resulting from electricity challenges as well as official trips which could not be undertaken due to austerity measures taken, operating payments due to provision made for resettlement cost which was not utilised as anticipated.
ANNUAL REPORT FOR 2018/19 FINANCIAL YEAR - VOTE 12: EASTERN CAPE PROVINCIAL TREASURY 133
Transfers and Subsidies
Variance: R0.151 million.
The minor variance pertains to leave gratuity due to official retiring later than anticipated.
(V) Programme 5: Municipal Financial Governance – R12.407 million.Compensation of Employees
Variance: R0.438 million.
The minor variance is mainly due to staff attrition.
Goods and Services
Variance: R0.396 million.
The minor variance pertains to travel and subsistence for official trips not undertaken due to the unavailability of stakeholders.
Transfers and Subsidies
Variance: R11.573 million.
The variance pertains to municipal social infrastructure projects as follows:
• King Sabatha Dalindyebo (KSD) Electrification project due to non-performance by the contractor who experienced cash flow challenges as well as ongoing municipal strike which prevented the contractor in continuing with the work on site.
• Ntabankulu Access Roads project due to discrepancies on the payment certificate (retention amount and surety not deducted).
A request has been made to Provincial Treasury for the roll-over of these unspent funds.

ANNUAL REPORT FOR 2018/19 FINANCIAL YEAR - VOTE 12: EASTERN CAPE PROVINCIAL TREASURY134
5.2.3. STATEMENT OF FINANCIAL PERFORMANCE
Note 2018/19 2017/18
R'000 R'000
REVENUE
Annual appropriation 1 462,690 717,277
Departmental revenue 2 665,292 658,655
Aid assistance 3 62 -
TOTAL REVENUE 1,128,044 1,375,932
EXPENDITURE
Current expenditure
Compensation of employees 4 302,714 284,819
Goods and services 5 61,309 62,197
Aid assistance 3 50 -
Total current expenditure 364,073 347,016
Transfers and subsidies
Transfers and subsidies 7 67,341 354,181
Total transfers and subsidies 67,341 354,181
Expenditure for capital assets
Tangible assets 8 9,554 2,620
Intangible assets 8 - 414
Total expenditure for capital assets 9,554 3,034
Payments for financial assets 6 77 348
TOTAL EXPENDITURE 441,045 704,579
SURPLUS FOR THE YEAR 686,999 671,353
Reconciliation of Net Surplus for the year
Voted funds 21,695 12,698
Annual appropriation 21,695 12,698
Departmental revenue 12 665,292 658,655
Aid assistance 3 12 -
SURPLUS FOR THE YEAR 686,999 671,353

ANNUAL REPORT FOR 2018/19 FINANCIAL YEAR - VOTE 12: EASTERN CAPE PROVINCIAL TREASURY 135
5.2.4. STATEMENT OF FINANCIAL POSITION
Note 2018/19 2017/18
R'000 R'000
ASSETS
Current assets 21,841 13,017
Cash and cash equivalents 9 21,468 11,717
Receivables 10 373 1,300
Non-Current assets 722 -
Receivables 10 722 -
TOTAL ASSETS 22,563 13,017
LIABILITIES
Current liabilities 22,303 12,873
Voted funds to be surrendered to the Revenue Fund 11 21,695 12,698
Departmental revenue to be surrendered to the Revenue Fund 12 29 24
Payables 13 567 151
Aid assistance repayable 3 12 -
TOTAL LIABILITIES 22,303 12,873
NET ASSETS 260 144
Represented by:
Recoverable revenue 260 144
TOTAL 260 144

ANNUAL REPORT FOR 2018/19 FINANCIAL YEAR - VOTE 12: EASTERN CAPE PROVINCIAL TREASURY136
5.2.5. STATEMENT OF CHANGES IN NET ASSETS
NET ASSETS Note 2018/19 2017/18
R'000 R'000
Recoverable revenue
Opening balance 144 167
Transfers: 116 (23)
Debts recovered (included in departmental receipts) (55) (23)
Debts raised 171 -
Closing balance 260 144
TOTAL 260 144

ANNUAL REPORT FOR 2018/19 FINANCIAL YEAR - VOTE 12: EASTERN CAPE PROVINCIAL TREASURY 137
5.2.6. CASH FLOW STATEMENT
Note 2018/19 2017/18
R'000 R’000
CASH FLOWS FROM OPERATING ACTIVITIES
Receipts 1,230,862 1,473,114
Annual appropriated funds received 1.1 462,690 717,277
Departmental revenue received 2 261 482
Interest received 2.2 767,849 755,355
Aid assistance received 3 62 -
Net decrease in working capital 621 (292)
Surrendered to Revenue Fund (780,803) (757,894)
Current payments (364,073) (347,016)
Payments for financial assets (77) (348)
Transfers and subsidies paid (67,341) (354,181)
Net cash flow available from operating activities 14 19,189 13,383
CASH FLOWS FROM INVESTING ACTIVITIES
Payments for capital assets 8 (9,554) (3,034)
Net cash flows from investing activities (9,554) (3,034)
CASH FLOWS FROM FINANCING ACTIVITIES
Increase in net assets 116 (23)
Net cash flows from financing activities 116 (23)
Net increase in cash and cash equivalents 9,751 10,326
Cash and cash equivalents at beginning of period 11,717 1,391
Cash and cash equivalents at end of period 15 21,468 11,717
ANNUAL REPORT FOR 2018/19 FINANCIAL YEAR - VOTE 12: EASTERN CAPE PROVINCIAL TREASURY138
5.2.7. ACCOUNTING POLICIES
PART A: ACCOUNTING POLICIES
Summary of significant accounting policies
The financial statements have been prepared in accordance with the following policies, which have been applied consistently in all material aspects, unless otherwise indicated. Management has concluded that the financial statements present fairly the department’s primary and secondary information.
The historical cost convention has been used, except where otherwise indicated. Management has used assessments and estimates in preparing the annual financial statements. These are based on the best information available at the time of preparation.
Where appropriate and meaningful, additional information has been disclosed to enhance the usefulness of the financial statements and to comply with the statutory requirements of the Public Finance Management Act (PFMA), Act 1 of 1999 (as amended by Act 29 of 1999), and the Treasury Regulations issued in terms of the PFMA and the annual Division of Revenue Act.
1 Basis of preparation
The financial statements have been prepared in accordance with the Modified Cash Standard.
2 Going concern
The financial statements have been prepared on a going concern basis.
3 Presentation currency
Amounts have been presented in the currency of the South African Rand (R) which is also the functional currency of the department.
4 Rounding
Unless otherwise stated financial figures have been rounded to the nearest one thousand Rand (R’000).
5 Foreign currency translation
Cash flows arising from foreign currency transactions are translated into South African Rands using the spot exchange rates prevailing at the date of payment / receipt.
6 Comparative information
6.1 Prior period comparative information
Prior period comparative information has been presented in the current year’s financial statements. Where necessary figures included in the prior period financial statements have been reclassified to ensure that the format in which the information is presented is consistent with the format of the current year’s financial statements.
6.2 Current year comparison with budget
A comparison between the approved, final budget and actual amounts for each programme and economic classification is included in the appropriation statement.
7 Revenue
7.1 Appropriated funds
Appropriated funds comprise of departmental allocations as well as direct charges against the revenue fund (i.e. statutory appropriation).
Appropriated funds are recognised in the statement of financial performance on the date the appropriation becomes effective. Adjustments made in terms of the adjustments budget process are recognised in the statement of financial performance on the date the adjustments become effective.
The net amount of any appropriated funds due to / from the relevant revenue fund at the reporting date is recognised as a payable / receivable in the statement of financial position.
7.2 Departmental revenue
Departmental revenue is recognised in the statement of financial performance when received and is subsequently paid into the relevant revenue fund, unless stated otherwise.
Any amount owing to the relevant revenue fund at the reporting date is recognised as a payable in the statement of financial position.
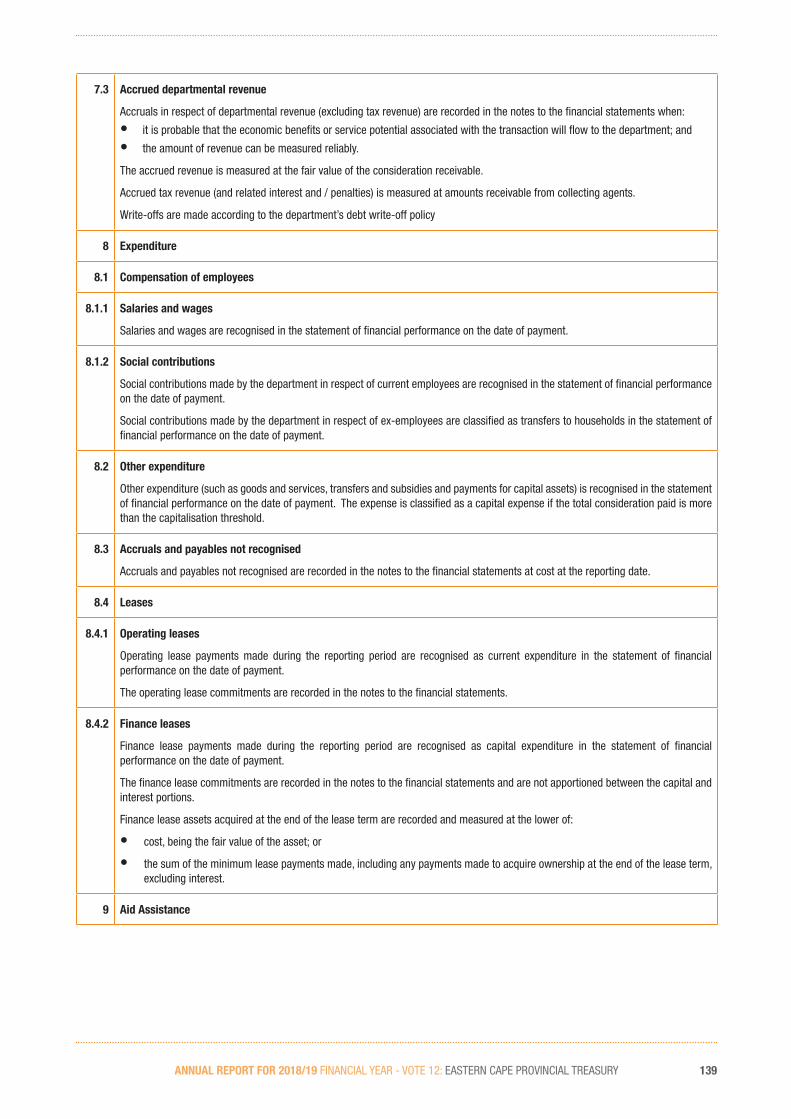
ANNUAL REPORT FOR 2018/19 FINANCIAL YEAR - VOTE 12: EASTERN CAPE PROVINCIAL TREASURY 139
7.3 Accrued departmental revenue
Accruals in respect of departmental revenue (excluding tax revenue) are recorded in the notes to the financial statements when:
• it is probable that the economic benefits or service potential associated with the transaction will flow to the department; and
• the amount of revenue can be measured reliably.
The accrued revenue is measured at the fair value of the consideration receivable.
Accrued tax revenue (and related interest and / penalties) is measured at amounts receivable from collecting agents.
Write-offs are made according to the department’s debt write-off policy
8 Expenditure
8.1 Compensation of employees
8.1.1 Salaries and wages
Salaries and wages are recognised in the statement of financial performance on the date of payment.
8.1.2 Social contributions
Social contributions made by the department in respect of current employees are recognised in the statement of financial performance on the date of payment.
Social contributions made by the department in respect of ex-employees are classified as transfers to households in the statement of financial performance on the date of payment.
8.2 Other expenditure
Other expenditure (such as goods and services, transfers and subsidies and payments for capital assets) is recognised in the statement of financial performance on the date of payment. The expense is classified as a capital expense if the total consideration paid is more than the capitalisation threshold.
8.3 Accruals and payables not recognised
Accruals and payables not recognised are recorded in the notes to the financial statements at cost at the reporting date.
8.4 Leases
8.4.1 Operating leases
Operating lease payments made during the reporting period are recognised as current expenditure in the statement of financial performance on the date of payment.
The operating lease commitments are recorded in the notes to the financial statements.
8.4.2 Finance leases
Finance lease payments made during the reporting period are recognised as capital expenditure in the statement of financial performance on the date of payment.
The finance lease commitments are recorded in the notes to the financial statements and are not apportioned between the capital and interest portions.
Finance lease assets acquired at the end of the lease term are recorded and measured at the lower of:
• cost, being the fair value of the asset; or
• the sum of the minimum lease payments made, including any payments made to acquire ownership at the end of the lease term, excluding interest.
9 Aid Assistance
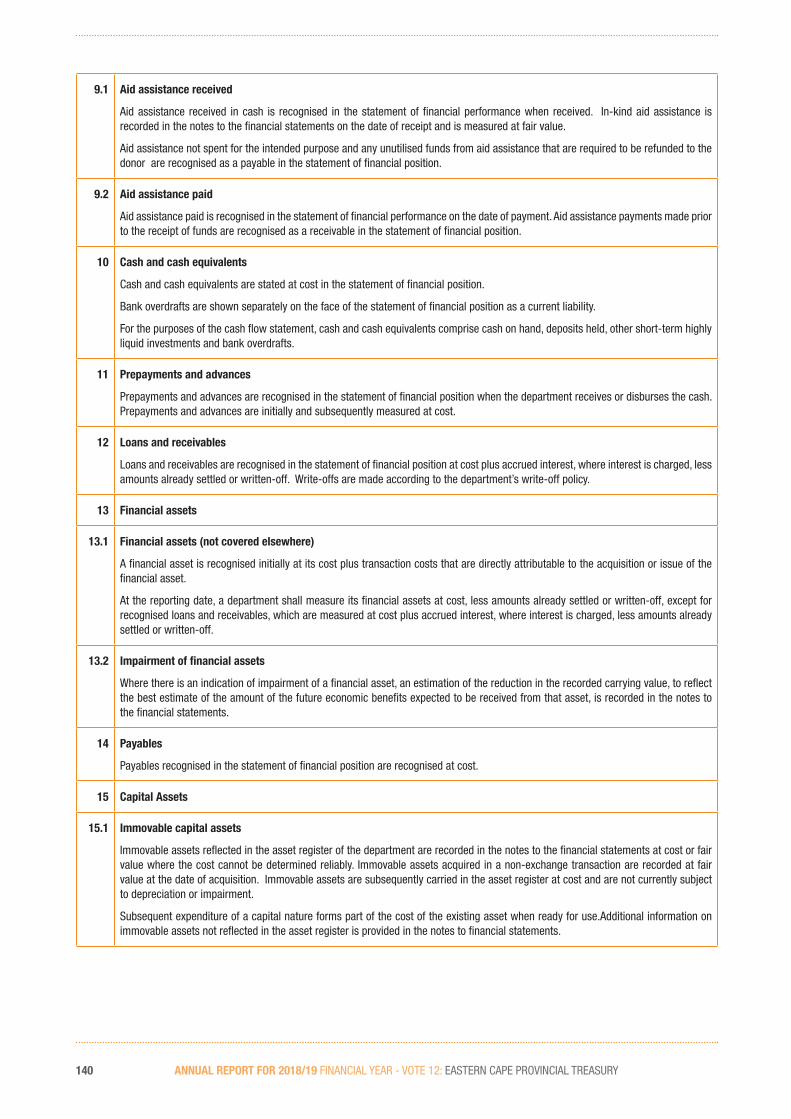
ANNUAL REPORT FOR 2018/19 FINANCIAL YEAR - VOTE 12: EASTERN CAPE PROVINCIAL TREASURY140
9.1 Aid assistance received
Aid assistance received in cash is recognised in the statement of financial performance when received. In-kind aid assistance is recorded in the notes to the financial statements on the date of receipt and is measured at fair value.
Aid assistance not spent for the intended purpose and any unutilised funds from aid assistance that are required to be refunded to the donor are recognised as a payable in the statement of financial position.
9.2 Aid assistance paid
Aid assistance paid is recognised in the statement of financial performance on the date of payment. Aid assistance payments made prior to the receipt of funds are recognised as a receivable in the statement of financial position.
10 Cash and cash equivalents
Cash and cash equivalents are stated at cost in the statement of financial position.
Bank overdrafts are shown separately on the face of the statement of financial position as a current liability.
For the purposes of the cash flow statement, cash and cash equivalents comprise cash on hand, deposits held, other short-term highly liquid investments and bank overdrafts.
11 Prepayments and advances
Prepayments and advances are recognised in the statement of financial position when the department receives or disburses the cash. Prepayments and advances are initially and subsequently measured at cost.
12 Loans and receivables
Loans and receivables are recognised in the statement of financial position at cost plus accrued interest, where interest is charged, less amounts already settled or written-off. Write-offs are made according to the department’s write-off policy.
13 Financial assets
13.1 Financial assets (not covered elsewhere)
A financial asset is recognised initially at its cost plus transaction costs that are directly attributable to the acquisition or issue of the financial asset.
At the reporting date, a department shall measure its financial assets at cost, less amounts already settled or written-off, except for recognised loans and receivables, which are measured at cost plus accrued interest, where interest is charged, less amounts already settled or written-off.
13.2 Impairment of financial assets
Where there is an indication of impairment of a financial asset, an estimation of the reduction in the recorded carrying value, to reflect the best estimate of the amount of the future economic benefits expected to be received from that asset, is recorded in the notes to the financial statements.
14 Payables
Payables recognised in the statement of financial position are recognised at cost.
15 Capital Assets
15.1 Immovable capital assets
Immovable assets reflected in the asset register of the department are recorded in the notes to the financial statements at cost or fair value where the cost cannot be determined reliably. Immovable assets acquired in a non-exchange transaction are recorded at fair value at the date of acquisition. Immovable assets are subsequently carried in the asset register at cost and are not currently subject to depreciation or impairment.
Subsequent expenditure of a capital nature forms part of the cost of the existing asset when ready for use.Additional information on immovable assets not reflected in the asset register is provided in the notes to financial statements.
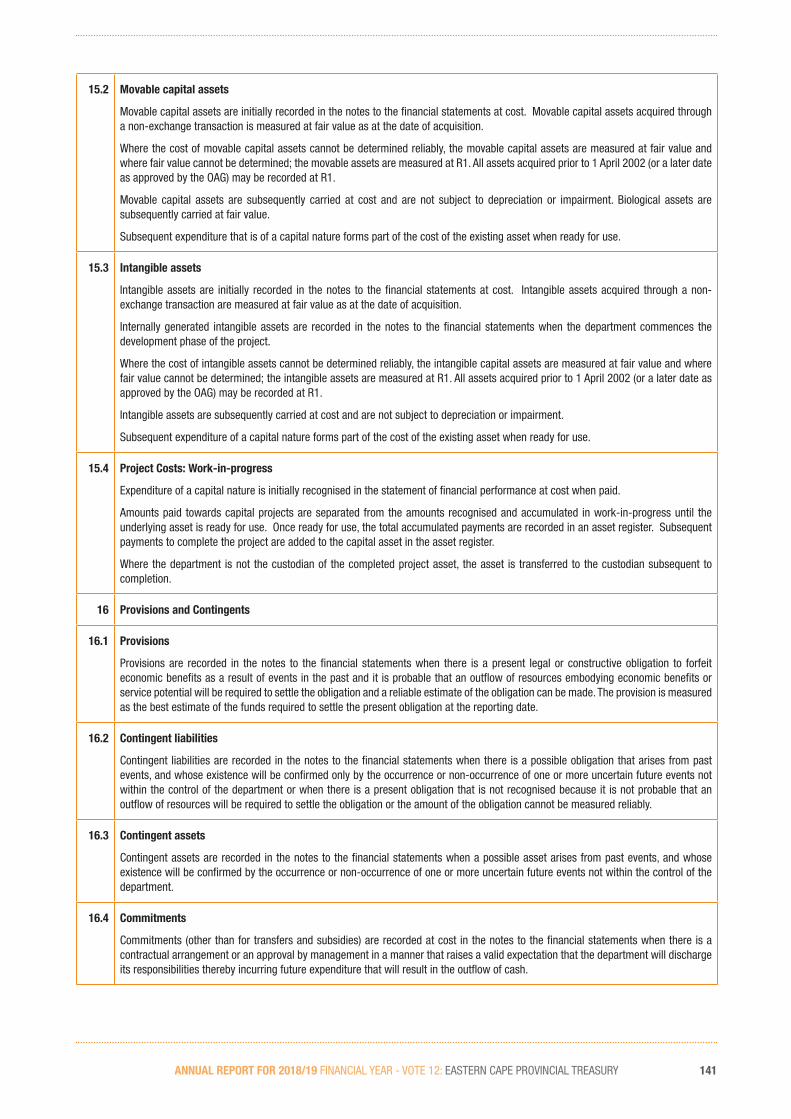
ANNUAL REPORT FOR 2018/19 FINANCIAL YEAR - VOTE 12: EASTERN CAPE PROVINCIAL TREASURY 141
15.2 Movable capital assets
Movable capital assets are initially recorded in the notes to the financial statements at cost. Movable capital assets acquired through a non-exchange transaction is measured at fair value as at the date of acquisition.
Where the cost of movable capital assets cannot be determined reliably, the movable capital assets are measured at fair value and where fair value cannot be determined; the movable assets are measured at R1. All assets acquired prior to 1 April 2002 (or a later date as approved by the OAG) may be recorded at R1.
Movable capital assets are subsequently carried at cost and are not subject to depreciation or impairment. Biological assets are subsequently carried at fair value.
Subsequent expenditure that is of a capital nature forms part of the cost of the existing asset when ready for use.
15.3 Intangible assets
Intangible assets are initially recorded in the notes to the financial statements at cost. Intangible assets acquired through a non-exchange transaction are measured at fair value as at the date of acquisition.
Internally generated intangible assets are recorded in the notes to the financial statements when the department commences the development phase of the project.
Where the cost of intangible assets cannot be determined reliably, the intangible capital assets are measured at fair value and where fair value cannot be determined; the intangible assets are measured at R1. All assets acquired prior to 1 April 2002 (or a later date as approved by the OAG) may be recorded at R1.
Intangible assets are subsequently carried at cost and are not subject to depreciation or impairment.
Subsequent expenditure of a capital nature forms part of the cost of the existing asset when ready for use.
15.4 Project Costs: Work-in-progress
Expenditure of a capital nature is initially recognised in the statement of financial performance at cost when paid.
Amounts paid towards capital projects are separated from the amounts recognised and accumulated in work-in-progress until the underlying asset is ready for use. Once ready for use, the total accumulated payments are recorded in an asset register. Subsequent payments to complete the project are added to the capital asset in the asset register.
Where the department is not the custodian of the completed project asset, the asset is transferred to the custodian subsequent to completion.
16 Provisions and Contingents
16.1 Provisions
Provisions are recorded in the notes to the financial statements when there is a present legal or constructive obligation to forfeit economic benefits as a result of events in the past and it is probable that an outflow of resources embodying economic benefits or service potential will be required to settle the obligation and a reliable estimate of the obligation can be made. The provision is measured as the best estimate of the funds required to settle the present obligation at the reporting date.
16.2 Contingent liabilities
Contingent liabilities are recorded in the notes to the financial statements when there is a possible obligation that arises from past events, and whose existence will be confirmed only by the occurrence or non-occurrence of one or more uncertain future events not within the control of the department or when there is a present obligation that is not recognised because it is not probable that an outflow of resources will be required to settle the obligation or the amount of the obligation cannot be measured reliably.
16.3 Contingent assets
Contingent assets are recorded in the notes to the financial statements when a possible asset arises from past events, and whose existence will be confirmed by the occurrence or non-occurrence of one or more uncertain future events not within the control of the department.
16.4 Commitments
Commitments (other than for transfers and subsidies) are recorded at cost in the notes to the financial statements when there is a contractual arrangement or an approval by management in a manner that raises a valid expectation that the department will discharge its responsibilities thereby incurring future expenditure that will result in the outflow of cash.
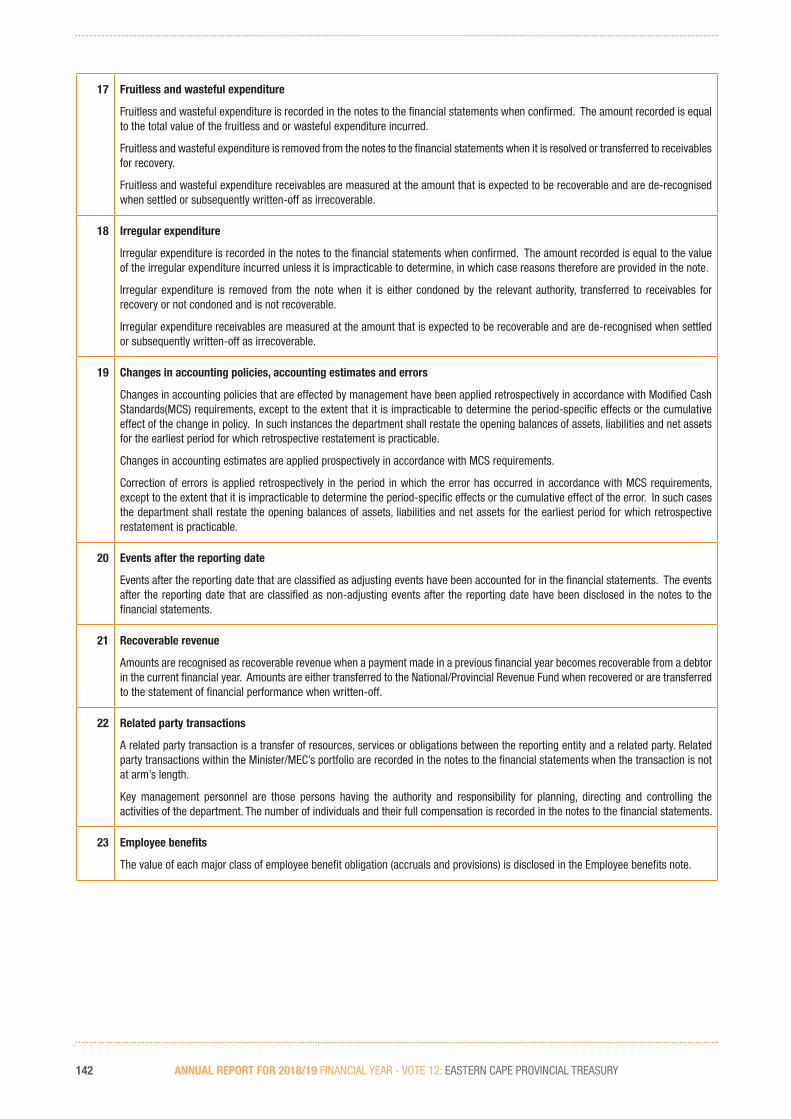
ANNUAL REPORT FOR 2018/19 FINANCIAL YEAR - VOTE 12: EASTERN CAPE PROVINCIAL TREASURY142
17 Fruitless and wasteful expenditure
Fruitless and wasteful expenditure is recorded in the notes to the financial statements when confirmed. The amount recorded is equal to the total value of the fruitless and or wasteful expenditure incurred.
Fruitless and wasteful expenditure is removed from the notes to the financial statements when it is resolved or transferred to receivables for recovery.
Fruitless and wasteful expenditure receivables are measured at the amount that is expected to be recoverable and are de-recognised when settled or subsequently written-off as irrecoverable.
18 Irregular expenditure
Irregular expenditure is recorded in the notes to the financial statements when confirmed. The amount recorded is equal to the value of the irregular expenditure incurred unless it is impracticable to determine, in which case reasons therefore are provided in the note.
Irregular expenditure is removed from the note when it is either condoned by the relevant authority, transferred to receivables for recovery or not condoned and is not recoverable.
Irregular expenditure receivables are measured at the amount that is expected to be recoverable and are de-recognised when settled or subsequently written-off as irrecoverable.
19 Changes in accounting policies, accounting estimates and errors
Changes in accounting policies that are effected by management have been applied retrospectively in accordance with Modified Cash Standards(MCS) requirements, except to the extent that it is impracticable to determine the period-specific effects or the cumulative effect of the change in policy. In such instances the department shall restate the opening balances of assets, liabilities and net assets for the earliest period for which retrospective restatement is practicable.
Changes in accounting estimates are applied prospectively in accordance with MCS requirements.
Correction of errors is applied retrospectively in the period in which the error has occurred in accordance with MCS requirements, except to the extent that it is impracticable to determine the period-specific effects or the cumulative effect of the error. In such cases the department shall restate the opening balances of assets, liabilities and net assets for the earliest period for which retrospective restatement is practicable.
20 Events after the reporting date
Events after the reporting date that are classified as adjusting events have been accounted for in the financial statements. The events after the reporting date that are classified as non-adjusting events after the reporting date have been disclosed in the notes to the financial statements.
21 Recoverable revenue
Amounts are recognised as recoverable revenue when a payment made in a previous financial year becomes recoverable from a debtor in the current financial year. Amounts are either transferred to the National/Provincial Revenue Fund when recovered or are transferred to the statement of financial performance when written-off.
22 Related party transactions
A related party transaction is a transfer of resources, services or obligations between the reporting entity and a related party. Related party transactions within the Minister/MEC’s portfolio are recorded in the notes to the financial statements when the transaction is not at arm’s length.
Key management personnel are those persons having the authority and responsibility for planning, directing and controlling the activities of the department. The number of individuals and their full compensation is recorded in the notes to the financial statements.
23 Employee benefits
The value of each major class of employee benefit obligation (accruals and provisions) is disclosed in the Employee benefits note.

ANNUAL REPORT FOR 2018/19 FINANCIAL YEAR - VOTE 12: EASTERN CAPE PROVINCIAL TREASURY 143
5.2.8. NOTES TO THE ANNUAL FINANCIAL STATEMENTS1. Annual Appropriation 1.1 Annual Appropriation
Included are funds appropriated in terms of the Appropriation Act (and the Adjustments Appropriation Act) for Provincial Departments:
2018/19 2017/18
ProgrammesFinal Appropriation
Actual Funds Received
Funds not requested/not received
Final Appropriation
Appropriation Received
R’000 R’000 R’000 R’000 R’000
Administration 163,795 163,795 - 152,873 152,873
Sustainable Resource Management 69,236 69,236 - 61,951 61,951
Asset and Liabilities Management 27,004 27,004 - 25,002 25,002
Financial Governance 77,802 77,802 - 85,162 85,162
Municipal Financial Governance 124,853 124,853 - 392,289 392,289
Total 462,690 462,690 - 717,277 717,277
2. Departmental revenue
Note 2018/19 2017/18
R’000 R’000
Sales of goods and services other than capital assets 2.1 204 191
Interest, dividends and rent on land 2.2 767,849 755,355
Transactions in financial assets and liabilities 2.3 57 291
Total revenue collected 768,110 755,837
Less: Own revenue included in appropriation 12 102,818 97,182
Departmental revenue collected 665,292 658,655
2.1. Sales of goods and services other than capital assets
2
Sales of goods and services produced by the department 204 191
Other sales 204 191
Total 204 191
2.2. Interest, dividends and rent on land
2
Interest 767,849 755,355
Total 767,849 755,355
2.3. Transactions in financial assets and liabilities
2
Other Receipts including Recoverable Revenue 57 291
Total 57 291

ANNUAL REPORT FOR 2018/19 FINANCIAL YEAR - VOTE 12: EASTERN CAPE PROVINCIAL TREASURY144
3. Aid assistance
Note 2018/19 2017/18
R’000 R’000
Annex 3
Transferred from statement of financial performance 12 -
Closing Balance 12 -
The Provincial Treasury embarked on an evaluation project to assess the effectiveness of Co-operatives Funding in the Eastern Cape. National Treasury funded the evaluation study through donor funds from the Belgian/South African Study and Consultancy Fund. The amount of R11,969.30 will be surrendered to the Provincial Revenue Fund.
3.1. Analysis of balance by source
Aid assistance from other sources 3 12 -
Closing balance 12 -
3.2. Analysis of balance
Aid assistance repayable 3 12 -
Closing balance 12 -
Aid assistance not requested/not received 28 -
3.3. Aid assistance expenditure per economic classification
Current 50 -
Total aid assistance expenditure 50 -
4. Compensation of employees4.1. Salaries and Wages
Basic salary 213,756 200,650
Performance award 3,718 3,639
Service Based 216 125
Compensative/circumstantial 512 488
Periodic payments 52 -
Other non-pensionable allowances 48,736 46,206
Total 266,990 251,108
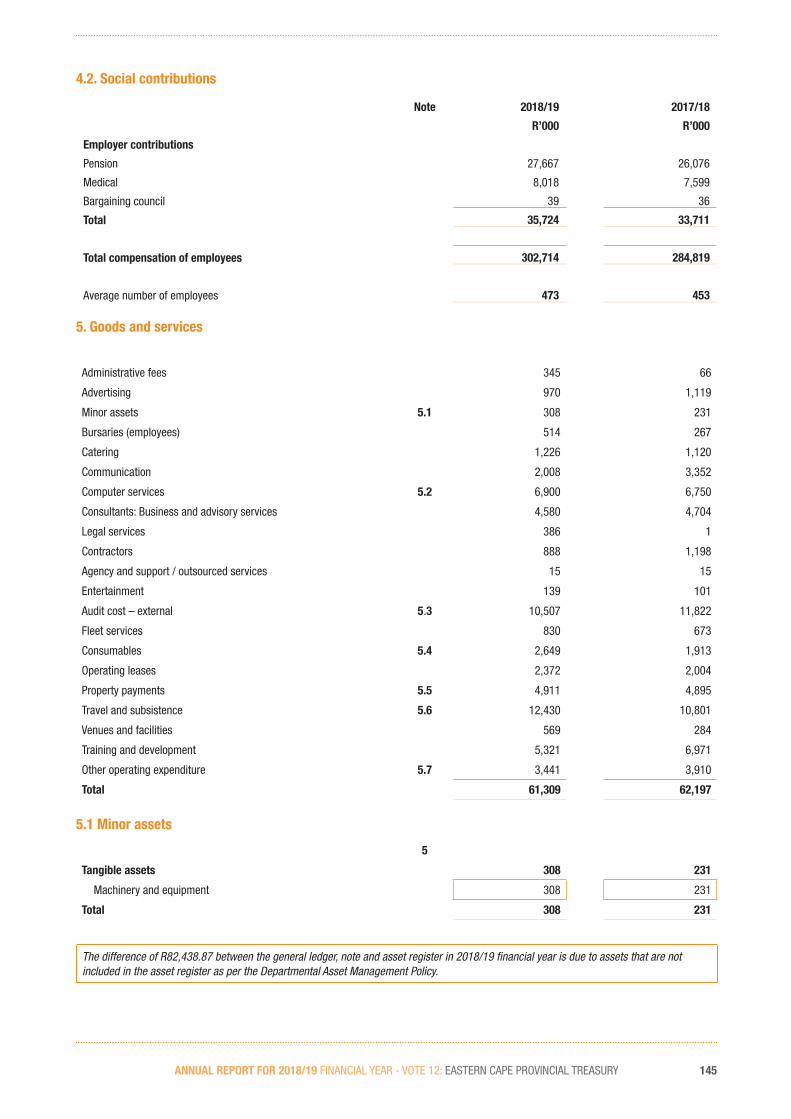
ANNUAL REPORT FOR 2018/19 FINANCIAL YEAR - VOTE 12: EASTERN CAPE PROVINCIAL TREASURY 145
4.2. Social contributions
Note 2018/19 2017/18
R’000 R’000
Employer contributions
Pension 27,667 26,076
Medical 8,018 7,599
Bargaining council 39 36
Total 35,724 33,711
Total compensation of employees 302,714 284,819
Average number of employees 473 453
5. Goods and services
Administrative fees 345 66
Advertising 970 1,119
Minor assets 5.1 308 231
Bursaries (employees) 514 267
Catering 1,226 1,120
Communication 2,008 3,352
Computer services 5.2 6,900 6,750
Consultants: Business and advisory services 4,580 4,704
Legal services 386 1
Contractors 888 1,198
Agency and support / outsourced services 15 15
Entertainment 139 101
Audit cost – external 5.3 10,507 11,822
Fleet services 830 673
Consumables 5.4 2,649 1,913
Operating leases 2,372 2,004
Property payments 5.5 4,911 4,895
Travel and subsistence 5.6 12,430 10,801
Venues and facilities 569 284
Training and development 5,321 6,971
Other operating expenditure 5.7 3,441 3,910
Total 61,309 62,197
5.1 Minor assets
5
Tangible assets 308 231
Machinery and equipment 308 231
Total 308 231
The difference of R82,438.87 between the general ledger, note and asset register in 2018/19 financial year is due to assets that are not included in the asset register as per the Departmental Asset Management Policy.

ANNUAL REPORT FOR 2018/19 FINANCIAL YEAR - VOTE 12: EASTERN CAPE PROVINCIAL TREASURY146
5.2. Computer services
Note 2018/19 2017/18
R’000 R’000
5
SITA computer services 1,882 5,161
External computer service providers 5,018 1,589
Total 6,900 6,750
In the prior year Microsoft licence payments were made via SITA whilst in the current year payments were made directly to Microsoft Ireland as per National Treasury SCM Circular No. 11 of 2016/17.
5.3. Audit cost – External
5
Regularity audits 6,729 5,906
Investigations 3,778 4,083
Computer audits - 1,833
Total 10,507 11,822
5.4. Consumables
5
Consumable supplies 451 326
Uniform and clothing 36 45
Household supplies 376 254
Building material and supplies 19 -
Communication accessories 2 -
IT consumables 17 22
Other consumables 1 5
Stationery, printing and office supplies 2,198 1,587
Total 2,649 1,913
5.5. Property payments
5
Property maintenance and repairs 3,092 2,881
Other 1,819 2,014
Total 4,911 4,895
5.6 Travel and subsistence
5
Local 11,584 10,763
Foreign 846 38
Total 12,430 10,801
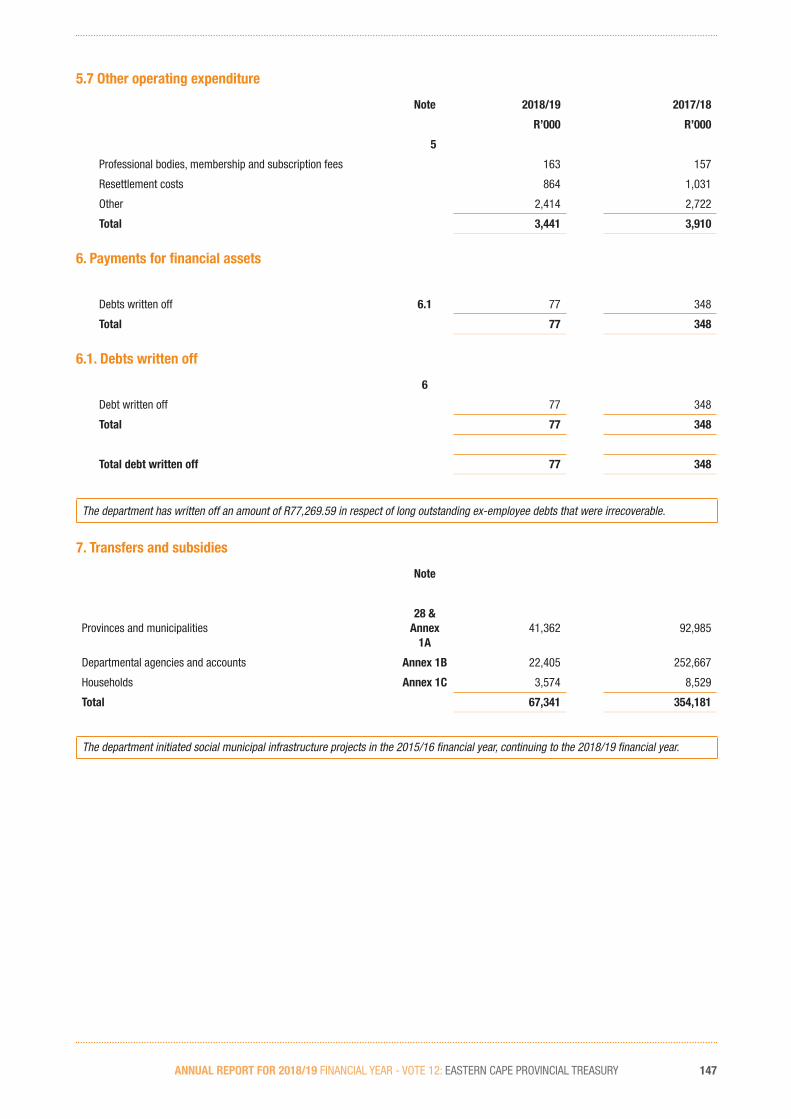
ANNUAL REPORT FOR 2018/19 FINANCIAL YEAR - VOTE 12: EASTERN CAPE PROVINCIAL TREASURY 147
5.7 Other operating expenditure
Note 2018/19 2017/18
R’000 R’000
5
Professional bodies, membership and subscription fees 163 157
Resettlement costs 864 1,031
Other 2,414 2,722
Total 3,441 3,910
6. Payments for financial assets
Debts written off 6.1 77 348
Total 77 348
6.1. Debts written off
6
Debt written off 77 348
Total 77 348
Total debt written off 77 348
The department has written off an amount of R77,269.59 in respect of long outstanding ex-employee debts that were irrecoverable.
7. Transfers and subsidies
Note
Provinces and municipalities28 &
Annex 1A
41,362 92,985
Departmental agencies and accounts Annex 1B 22,405 252,667
Households Annex 1C 3,574 8,529
Total 67,341 354,181
The department initiated social municipal infrastructure projects in the 2015/16 financial year, continuing to the 2018/19 financial year.

ANNUAL REPORT FOR 2018/19 FINANCIAL YEAR - VOTE 12: EASTERN CAPE PROVINCIAL TREASURY148
8. Expenditure for capital assets
Note 2018/19 2017/18
R’000 R’000
Tangible assets 9,554 2,620
Machinery and equipment 26 9,554 2,620
Intangible assets - 414
Software 27 - 414
Total 9,554 3,034
8.1. Analysis of funds utilised to acquire capital assets – 2018/19
Voted Funds Total
R’000 R’000
Tangible assets 9,554 9,554
Machinery and equipment 9,554 9,554
Total 9,554 9,554
8.2. Analysis of funds utilised to acquire capital assets – 2017/18
Voted Funds Total
R’000 R’000
Tangible assets 2,620 2,620
Machinery and equipment 2,620 2,620
Intangible assets 414 414
Software 414 414
Total 3,034 3,034
8.3. Finance lease expenditure included in Expenditure for Capital Assets
2018/19 2017/18
R’000 R’000
Tangible assets
Machinery and equipment 1,515 1,433
Total 1,515 1,433
9. Cash and cash equivalents
Consolidated Paymaster General Account 21,454 11,712
Disbursements 9 -
Cash on hand 5 5
Total 21,468 11,717

ANNUAL REPORT FOR 2018/19 FINANCIAL YEAR - VOTE 12: EASTERN CAPE PROVINCIAL TREASURY 149
10. Receivables
2018/19 2017/18
Current Non-current Total Current Non-current Total
Note R’000 R’000 R’000 R’000 R’000 R’000
Claims recoverable 10.1 323 - 323 397 - 397
Staff debt 10.2 50 435 485 433 - 433
Fruitless and wasteful expenditure 10.4 - - - 11 - 11Other receivables 10.3 - 287 287 459 - 459
Total 373 722 1,095 1,300 - 1,300
10.1. Claims recoverable
Note 2018/19 2017/18
R’000 R’000
National departments10 &
Annex 5- 291
Provincial departments 323 106
Total 323 397
10.2. Staff debt
10
Debt Account 485 433
Total 485 433
10.3. Other receivables
10
Sal: Income Tax 287 459
Total 287 459
10.4. Fruitless and wasteful expenditure
10
Opening balance 11 -
Transfers from note 22 fruitless and wasteful expenditure 1 14
Less: amount recovered (12) (3)
Total - 11
10.5. Impairment of receivables
Estimate of impairment of receivables 290 396
Total 290 396
The estimate is the balance of the Pay-As-You-Earn (PAYE) tax reconciliation amount that is under investigation.
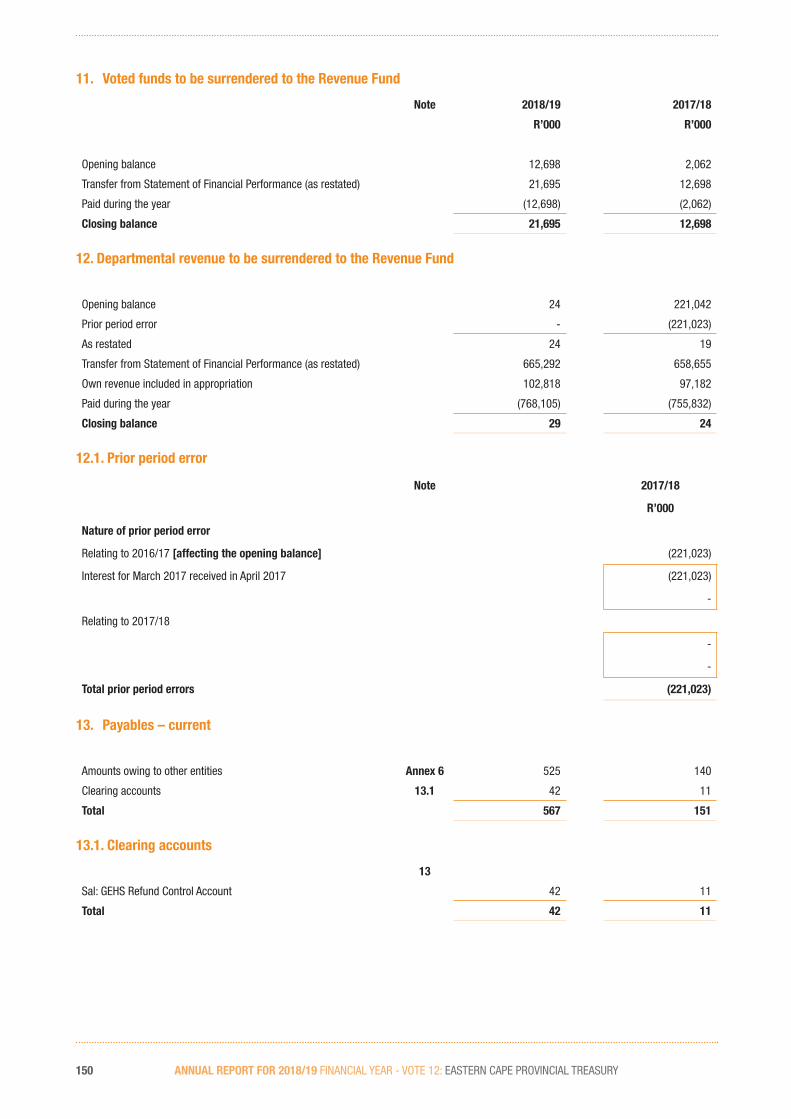
ANNUAL REPORT FOR 2018/19 FINANCIAL YEAR - VOTE 12: EASTERN CAPE PROVINCIAL TREASURY150
11. Voted funds to be surrendered to the Revenue Fund
Note 2018/19 2017/18
R’000 R’000
Opening balance 12,698 2,062
Transfer from Statement of Financial Performance (as restated) 21,695 12,698
Paid during the year (12,698) (2,062)
Closing balance 21,695 12,698
12. Departmental revenue to be surrendered to the Revenue Fund
Opening balance 24 221,042
Prior period error - (221,023)
As restated 24 19
Transfer from Statement of Financial Performance (as restated) 665,292 658,655
Own revenue included in appropriation 102,818 97,182
Paid during the year (768,105) (755,832)
Closing balance 29 24
12.1. Prior period error
Note 2017/18
R’000
Nature of prior period error
Relating to 2016/17 [affecting the opening balance] (221,023)
Interest for March 2017 received in April 2017 (221,023)
-
Relating to 2017/18
-
-
Total prior period errors (221,023)
13. Payables – current
Amounts owing to other entities Annex 6 525 140
Clearing accounts 13.1 42 11
Total 567 151
13.1. Clearing accounts
13
Sal: GEHS Refund Control Account 42 11
Total 42 11

ANNUAL REPORT FOR 2018/19 FINANCIAL YEAR - VOTE 12: EASTERN CAPE PROVINCIAL TREASURY 151
14. Net cash flow available from operating activities
2018/19 2017/18
R’000 R’000
Net surplus as per Statement of Financial Performance 686,999 671,353
Add back non cash/cash movements not deemed operating activities (667,810) (657,970)
Decrease in receivables – current 205 (398)
Decrease in prepayments and advances - 21
Increase in payables – current 416 85
Expenditure on capital assets 9,554 3,034
Surrenders to Revenue Fund (780,803) (757,894)
Voted funds not requested / not received - -
Own revenue included in appropriation 102,818 97,182
Net cash flow generated by operating activities 19,189 13,383
15. Reconciliation of cash and cash equivalents for cash flow purposes
Note 2018/19 2017/18
R’000 R’000
Consolidated Paymaster General account 21,454 11,712
Disbursements 9 -
Cash on hand 5 5
Total 21,468 11,717
16. Contingent liabilities and contingent assets
16.1. Contingent liabilities
Liable to Nature
Housing loan guarantees Employees Annex 4A - 54
Claims against the department Annex 4B 1,130 1,130
Total 1,130 1,184
1. The housing loan guarantee was released during the 2018/19 financial year.
2. The contingent liability disclosed relates to litigation against the department and four other departments for failure to collect the pensionable emoluments and transfer the same to the former Ciskei Pension Fund and Government Employees Pension Fund (GEPF). The department was unable to disclose the timing of any outflow since it was not practicable to do so and the matter is in court.
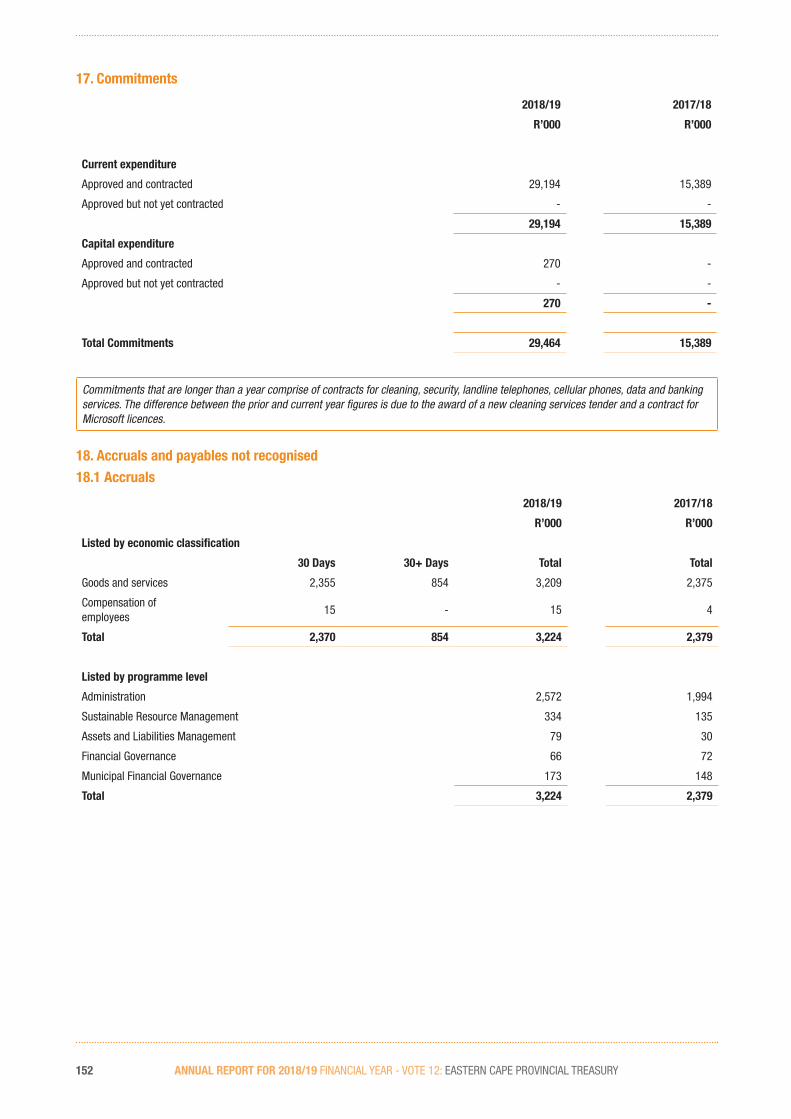
ANNUAL REPORT FOR 2018/19 FINANCIAL YEAR - VOTE 12: EASTERN CAPE PROVINCIAL TREASURY152
17. Commitments
2018/19 2017/18
R’000 R’000
Current expenditure
Approved and contracted 29,194 15,389
Approved but not yet contracted - -
29,194 15,389
Capital expenditure
Approved and contracted 270 -
Approved but not yet contracted - -
270 -
Total Commitments 29,464 15,389
Commitments that are longer than a year comprise of contracts for cleaning, security, landline telephones, cellular phones, data and banking services. The difference between the prior and current year figures is due to the award of a new cleaning services tender and a contract for Microsoft licences.
18. Accruals and payables not recognised18.1 Accruals
2018/19 2017/18
R’000 R’000
Listed by economic classification
30 Days 30+ Days Total Total
Goods and services 2,355 854 3,209 2,375
Compensation of employees
15 - 15 4
Total 2,370 854 3,224 2,379
Listed by programme level
Administration 2,572 1,994
Sustainable Resource Management 334 135
Assets and Liabilities Management 79 30
Financial Governance 66 72
Municipal Financial Governance 173 148
Total 3,224 2,379
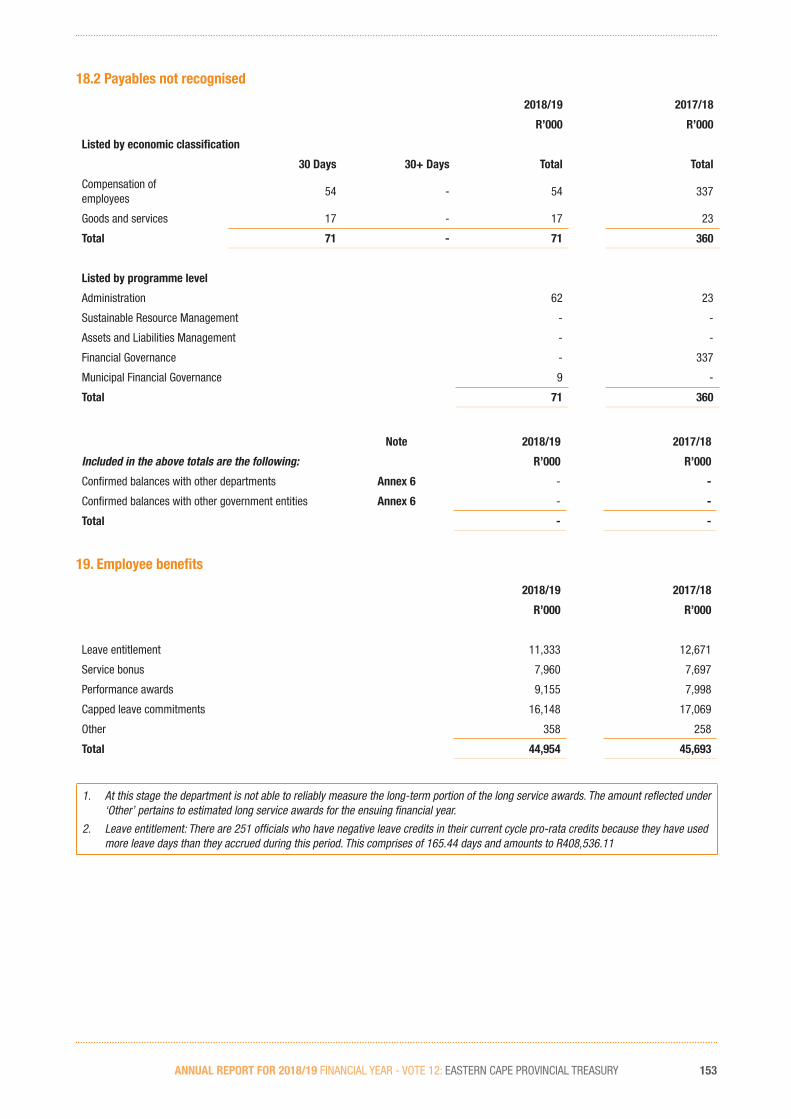
ANNUAL REPORT FOR 2018/19 FINANCIAL YEAR - VOTE 12: EASTERN CAPE PROVINCIAL TREASURY 153
18.2 Payables not recognised
2018/19 2017/18
R’000 R’000
Listed by economic classification
30 Days 30+ Days Total Total
Compensation of employees
54 - 54 337
Goods and services 17 - 17 23
Total 71 - 71 360
Listed by programme level
Administration 62 23
Sustainable Resource Management - -
Assets and Liabilities Management - -
Financial Governance - 337
Municipal Financial Governance 9 -
Total 71 360
Note 2018/19 2017/18
Included in the above totals are the following: R’000 R’000
Confirmed balances with other departments Annex 6 - -
Confirmed balances with other government entities Annex 6 - -
Total - -
19. Employee benefits
2018/19 2017/18
R’000 R’000
Leave entitlement 11,333 12,671
Service bonus 7,960 7,697
Performance awards 9,155 7,998
Capped leave commitments 16,148 17,069
Other 358 258
Total 44,954 45,693
1. At this stage the department is not able to reliably measure the long-term portion of the long service awards. The amount reflected under ‘Other’ pertains to estimated long service awards for the ensuing financial year.
2. Leave entitlement: There are 251 officials who have negative leave credits in their current cycle pro-rata credits because they have used more leave days than they accrued during this period. This comprises of 165.44 days and amounts to R408,536.11

ANNUAL REPORT FOR 2018/19 FINANCIAL YEAR - VOTE 12: EASTERN CAPE PROVINCIAL TREASURY154
20. Lease commitments20.1. Operating leases expenditure
2018/19Machinery and
EquipmentTotal
R’000 R’000
Not later than 1 year 2,210 2,210
Later than 1 year and not later than 5 years 3,139 3,139
Total lease commitments 5,349 5,349
2017/18Machinery and
EquipmentTotal
R’000 R’000
Not later than 1 year 223 223
Later than 1 year and not later than 5 years - -
Total lease commitments 223 223
The department occupies buildings that are owned by / under the custodianship of / leased by the Department of Roads and Public Works. These buildings are occupied for no consideration and no amounts are paid to the Department of Roads and Public Works for the occupation of these premises. The difference between the prior and current year figures is due to the department entering into a new lease agreement for office equipment.
20.2. Finance leases expenditure
2018/19Machinery and
EquipmentTotal
R’000 R’000
Not later than 1 year 1,213 1,213
Later than 1 year and not later than 5 years 1,342 1,342
Total lease commitments 2,555 2,555
2017/18Machinery and
EquipmentTotal
R’000 R’000
Not later than 1 year 1,089 1,089
Later than 1 year and not later than 5 years 1,259 1,259
Total lease commitments 2,348 2,348
The Department entered into a lease agreement with the Department of Transport for the provision of fourteen vehicles. The lease is being treated as a finance lease. The lease was entered into on the 24th of February 2012 and it has been renewed. The figures above also include cellular phone and data lease commitments. The department is currently participating in the RT 15 of 2016 transversal contract for cellular phones and data.

ANNUAL REPORT FOR 2018/19 FINANCIAL YEAR - VOTE 12: EASTERN CAPE PROVINCIAL TREASURY 155
21. Accrued departmental revenue
Note 2018/19 2017/18
R’000 R’000
Interest, dividends and rent on land 222,449 217,001
Total 222,449 217,001
21.1 Analysis of accrued departmental revenue
Note
Opening balance 217,001 221,023
Less: amounts received (217,001) (221,023)
Add: amounts recorded 222,449 217,001
Closing balance 222,449 217,001
22. Irregular expenditure22.1. Reconciliation of irregular expenditure
Note 2018/19 2017/18
R’000 R’000
Opening balance - 525
Add: Irregular expenditure – relating to current year - 136
Less: Prior year amounts condoned - (606)
Less: Current year amounts condoned - (55)
Closing balance - -
Analysis of awaiting condonation per age classification
Current year - -
Prior year - -
Total - -
22.2. Prior period error
Note 2017/18
R’000
Nature of prior period error
Relating to 2017/18 (190)
Amount condoned in 2017/18 (190)
Total prior period errors (190)
Request to condone irregular expenditure was approved in the prior year but received during the current year.

ANNUAL REPORT FOR 2018/19 FINANCIAL YEAR - VOTE 12: EASTERN CAPE PROVINCIAL TREASURY156
23. Fruitless and wasteful expenditure23.1 Reconciliation of fruitless and wasteful expenditure
Note 2018/19 2017/18
R’000 R’000
Opening balance 5 11
Fruitless and wasteful expenditure – relating to current year 22.3 4 356
Less: Amounts resolved - (348)
Less: Amounts transferred to receivables for recovery 10.4 (1) (14)
Closing balance 8 5
23.2. Analysis of awaiting resolution per economic classification
Current 8 5
Total 8 5
23.3. Analysis of Current year’s (relating to current and prior years) fruitless and wasteful expenditure
Incident Disciplinary steps taken / criminal proceedings2018/19
R’000
Late cancellation of booked accommodation. The matter is under investigation. 1
Late cancellation of booked flight. The matter is under investigation. 3
Total 4
24. Related party transactions
1. The Department occupies buildings that are owned by / under the custodianship of / leased by the Department of Roads and Public Works. These buildings are occupied for no considerations and no amounts are paid to the Department of Roads and Public Works for the occupation of these premises.
2. The Member of the Executive Council for Finance is also the political head of Department of Economic Development, Environmental Affairs and Tourism.
25. Key management personnel
No. of Individuals
2018/19 2017/18
R’000 R’000
Political office bearers 2 1,963 1,978
Officials:
Level 15 and 16 6 10,419 13,284
Level 14 13 17,032 16,224
Total 29,414 31,486
SMS personnel on contract were excluded in the 2018/19 financial year due to changes in the MCS. Prior year figures were adjusted by R 3,944,422.81.
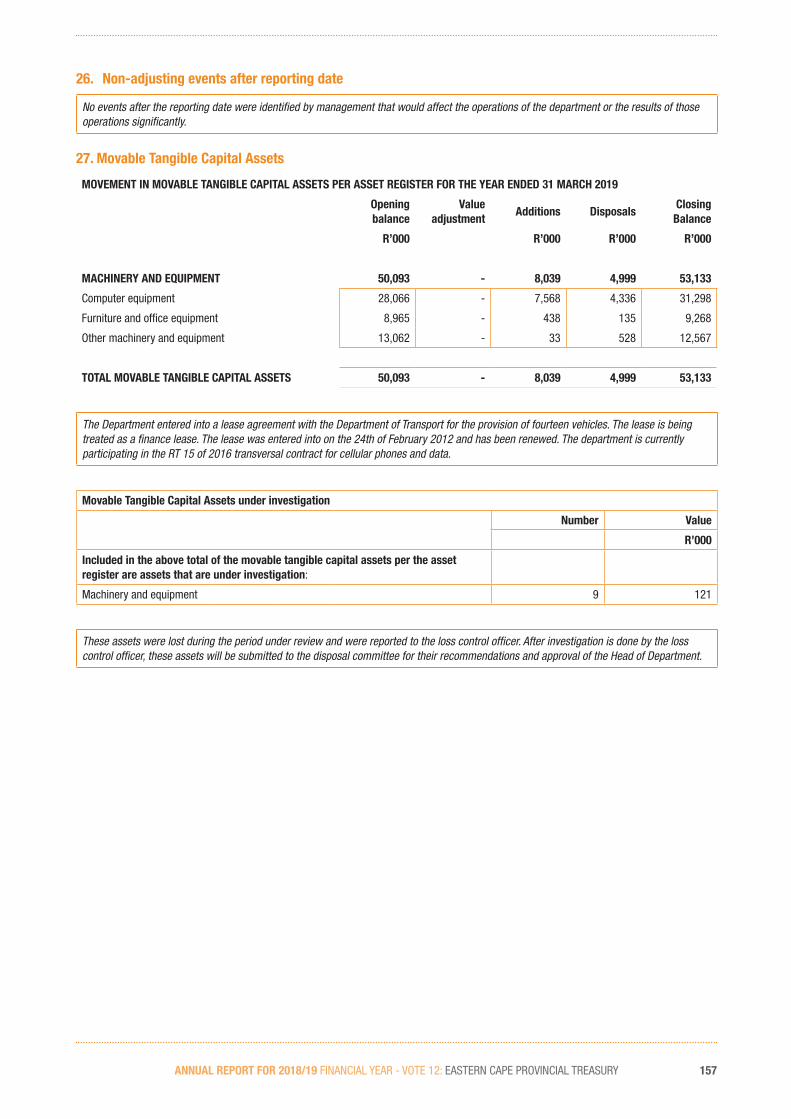
ANNUAL REPORT FOR 2018/19 FINANCIAL YEAR - VOTE 12: EASTERN CAPE PROVINCIAL TREASURY 157
26. Non-adjusting events after reporting date
No events after the reporting date were identified by management that would affect the operations of the department or the results of those operations significantly.
27. Movable Tangible Capital Assets
MOVEMENT IN MOVABLE TANGIBLE CAPITAL ASSETS PER ASSET REGISTER FOR THE YEAR ENDED 31 MARCH 2019
Opening balance
Value adjustment
Additions DisposalsClosing
Balance
R’000 R’000 R’000 R’000
MACHINERY AND EQUIPMENT 50,093 - 8,039 4,999 53,133
Computer equipment 28,066 - 7,568 4,336 31,298
Furniture and office equipment 8,965 - 438 135 9,268
Other machinery and equipment 13,062 - 33 528 12,567
TOTAL MOVABLE TANGIBLE CAPITAL ASSETS 50,093 - 8,039 4,999 53,133
The Department entered into a lease agreement with the Department of Transport for the provision of fourteen vehicles. The lease is being treated as a finance lease. The lease was entered into on the 24th of February 2012 and has been renewed. The department is currently participating in the RT 15 of 2016 transversal contract for cellular phones and data.
Movable Tangible Capital Assets under investigation
Number Value
R’000
Included in the above total of the movable tangible capital assets per the asset register are assets that are under investigation:
Machinery and equipment 9 121
These assets were lost during the period under review and were reported to the loss control officer. After investigation is done by the loss control officer, these assets will be submitted to the disposal committee for their recommendations and approval of the Head of Department.

ANNUAL REPORT FOR 2018/19 FINANCIAL YEAR - VOTE 12: EASTERN CAPE PROVINCIAL TREASURY158
27.1. Additions
ADDITIONS TO MOVABLE TANGIBLE CAPITAL ASSETS PER ASSET REGISTER FOR THE YEAR ENDED 31 MARCH 2019
Cash Non-cash
(Capital Work in Progress current
costs and finance lease
payments)
Received current, not paid
(Paid current year, received
prior year)
Total
R’000 R’000 R’000 R’000 R’000
MACHINERY AND EQUIPMENT 9,554 - (1,515) - 8,039
Transport assets 1,248 - (1,248) - -
Computer equipment 7,568 - - - 7,568
Furniture and office equipment 438 - - - 438
Other machinery and equipment 300 - (267) - 33
TOTAL ADDITIONS TO MOVABLE TANGIBLE CAPITAL ASSETS
9,554 - (1,515) - 8,039
27.2. Disposals
DISPOSALS OF MOVABLE TANGIBLE CAPITAL ASSETS PER ASSET REGISTER FOR THE YEAR ENDED 31 MARCH 2019
Sold for cashNon-cash
disposalTotal disposals
Cash Received Actual
R’000 R’000 R’000 R’000
MACHINERY AND EQUIPMENT - 4,999 4,999
Computer equipment - 4,336 4,336 -
Furniture and office equipment - 135 135 -
Other machinery and equipment - 528 528 -
TOTAL DISPOSAL OF MOVABLE TANGIBLE CAPITAL ASSETS
- 4,999 4,999 -
27.3. Movement for 2017/18
MOVEMENT IN MOVABLE TANGIBLE CAPITAL ASSETS PER ASSET REGISTER FOR THE YEAR ENDED 31 MARCH 2018
Opening balance Prior Period Error Additions Disposals Closing Balance
R’000 R’000 R’000 R’000
MACHINERY AND EQUIPMENT 49,421 - 1,187 (515) 50,093
Computer equipment 27,467 - 675 (76) 28,066
Furniture and office equipment 8,738 - 274 (47) 8,965
Other machinery and equipment 13,216 - 238 (392) 13,062
TOTAL MOVABLE TANGIBLE CAPITAL ASSETS
49,421 - 1,187 (515) 50,093
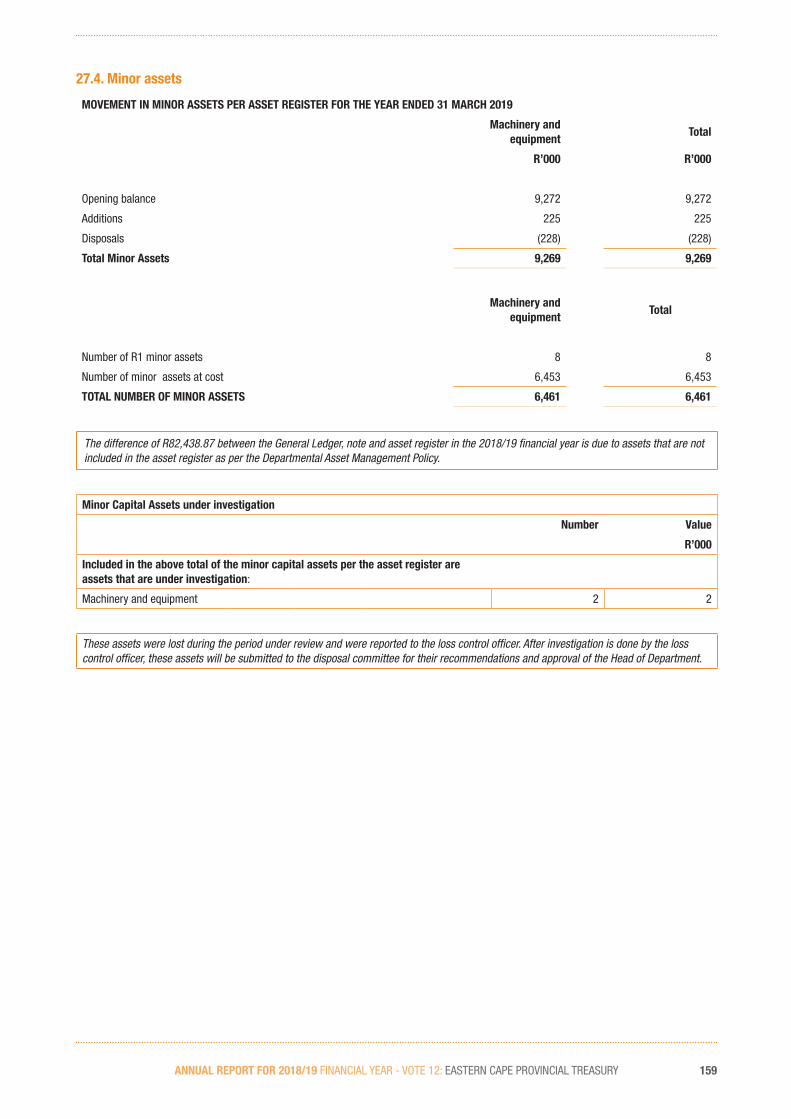
ANNUAL REPORT FOR 2018/19 FINANCIAL YEAR - VOTE 12: EASTERN CAPE PROVINCIAL TREASURY 159
27.4. Minor assets
MOVEMENT IN MINOR ASSETS PER ASSET REGISTER FOR THE YEAR ENDED 31 MARCH 2019
Machinery and equipment
Total
R’000 R’000
Opening balance 9,272 9,272
Additions 225 225
Disposals (228) (228)
Total Minor Assets 9,269 9,269
Machinery and equipment
Total
Number of R1 minor assets 8 8
Number of minor assets at cost 6,453 6,453
TOTAL NUMBER OF MINOR ASSETS 6,461 6,461
The difference of R82,438.87 between the General Ledger, note and asset register in the 2018/19 financial year is due to assets that are not included in the asset register as per the Departmental Asset Management Policy.
Minor Capital Assets under investigation
Number Value
R’000
Included in the above total of the minor capital assets per the asset register are assets that are under investigation:
Machinery and equipment 2 2
These assets were lost during the period under review and were reported to the loss control officer. After investigation is done by the loss control officer, these assets will be submitted to the disposal committee for their recommendations and approval of the Head of Department.
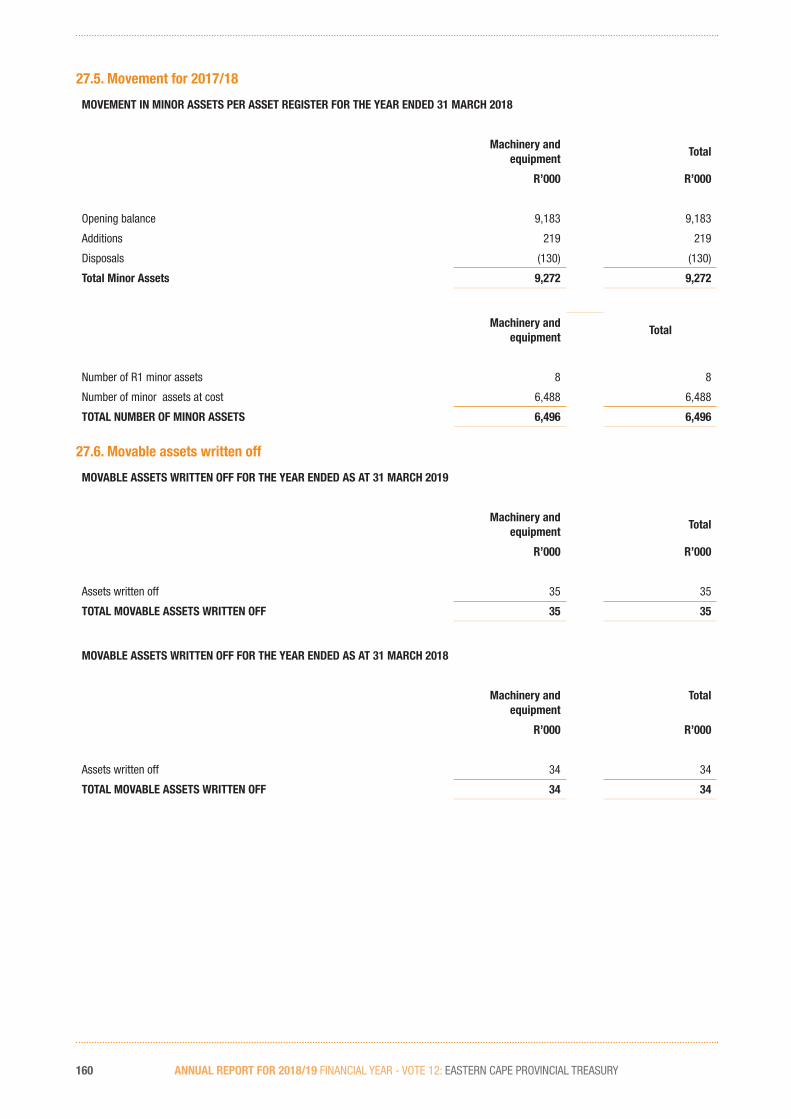
ANNUAL REPORT FOR 2018/19 FINANCIAL YEAR - VOTE 12: EASTERN CAPE PROVINCIAL TREASURY160
27.5. Movement for 2017/18
MOVEMENT IN MINOR ASSETS PER ASSET REGISTER FOR THE YEAR ENDED 31 MARCH 2018
Machinery and equipment
Total
R’000 R’000
Opening balance 9,183 9,183
Additions 219 219
Disposals (130) (130)
Total Minor Assets 9,272 9,272
Machinery and equipment
Total
Number of R1 minor assets 8 8
Number of minor assets at cost 6,488 6,488
TOTAL NUMBER OF MINOR ASSETS 6,496 6,496
27.6. Movable assets written off
MOVABLE ASSETS WRITTEN OFF FOR THE YEAR ENDED AS AT 31 MARCH 2019
Machinery and equipment
Total
R’000 R’000
Assets written off 35 35
TOTAL MOVABLE ASSETS WRITTEN OFF 35 35
MOVABLE ASSETS WRITTEN OFF FOR THE YEAR ENDED AS AT 31 MARCH 2018
Machinery and equipment
Total
R’000 R’000
Assets written off 34 34
TOTAL MOVABLE ASSETS WRITTEN OFF 34 34
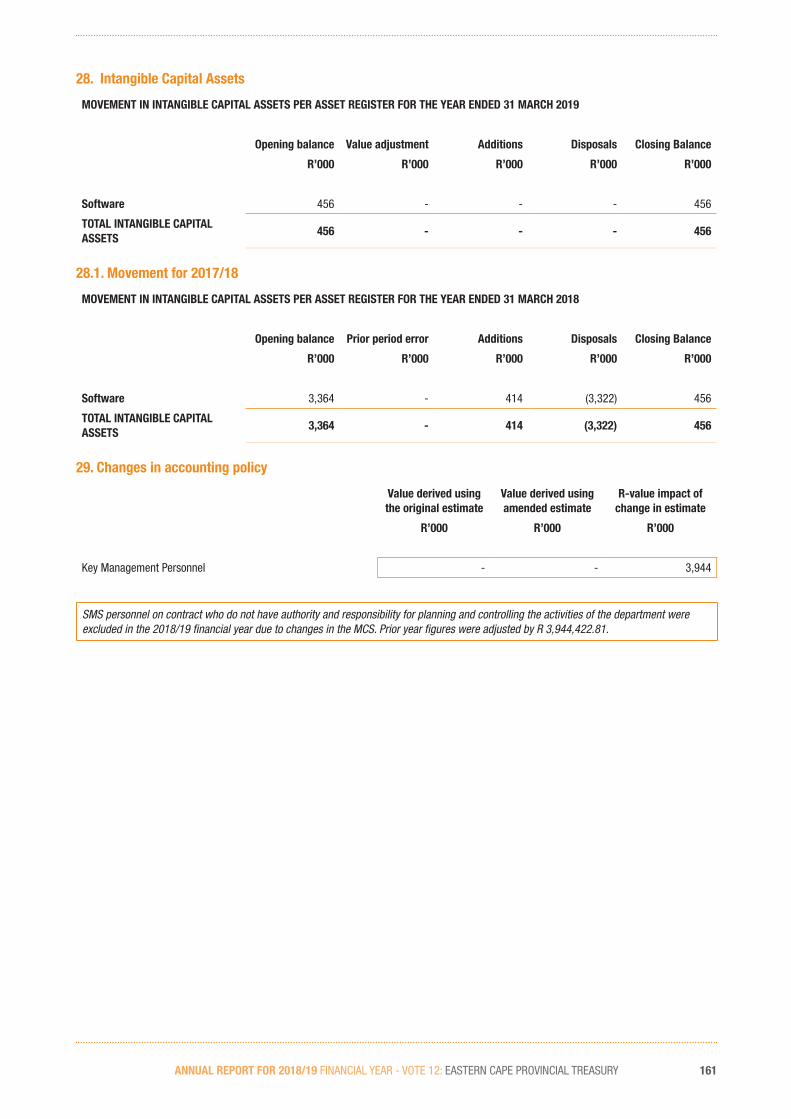
ANNUAL REPORT FOR 2018/19 FINANCIAL YEAR - VOTE 12: EASTERN CAPE PROVINCIAL TREASURY 161
28. Intangible Capital Assets
MOVEMENT IN INTANGIBLE CAPITAL ASSETS PER ASSET REGISTER FOR THE YEAR ENDED 31 MARCH 2019
Opening balance Value adjustment Additions Disposals Closing Balance
R’000 R’000 R’000 R’000 R’000
Software 456 - - - 456
TOTAL INTANGIBLE CAPITAL ASSETS
456 - - - 456
28.1. Movement for 2017/18
MOVEMENT IN INTANGIBLE CAPITAL ASSETS PER ASSET REGISTER FOR THE YEAR ENDED 31 MARCH 2018
Opening balance Prior period error Additions Disposals Closing Balance
R’000 R’000 R’000 R’000 R’000
Software 3,364 - 414 (3,322) 456
TOTAL INTANGIBLE CAPITAL ASSETS
3,364 - 414 (3,322) 456
29. Changes in accounting policy
Value derived using the original estimate
Value derived using amended estimate
R-value impact of change in estimate
R’000 R’000 R’000
Key Management Personnel - - 3,944
SMS personnel on contract who do not have authority and responsibility for planning and controlling the activities of the department were excluded in the 2018/19 financial year due to changes in the MCS. Prior year figures were adjusted by R 3,944,422.81.

ANNUAL REPORT FOR 2018/19 FINANCIAL YEAR - VOTE 12: EASTERN CAPE PROVINCIAL TREASURY162
30. Prior period errors30.1. Correction of prior period errors
NoteAmount before error
correctionPrior period error
RestatedAmount
2017/18 2017/18 2017/18
R’000 R’000 R’000
Revenue:
Departmental revenue-interest 2 751,333 4,022 755,355
Net effect 751,333 4,022 755,355
In the current year an error in the prior year departmental revenue was detected. The error was corrected and the net effect of the adjustment is reflected above. This is as a result of interests earned in March 2018 which was erroneously accounted for as departmental revenue in 2017-18.
2017/18 2017/18 2017/18
R’000 R’000 R’000
Assets:
Claim recoverable 10 217,398 (217,001) 397
Net effect 217,398 (217,001) 397
In the current year an error in the prior year receivables was detected. The error was corrected and the net effect of the adjustment is reflected above. This is as a result of interests earned in March 2018 which was erroneously accounted for as departmental revenue in 2017-18.
2017/18 2017/18 2017/18
R’000 R’000 R’000
Liabilities:
Departmental revenue to be surrendered to the Revenue Fund
12 217,025 (217,001) 24
Net effect 217,025 (217,001) 24
In the current year an error in the prior year liabilities was detected. The error was corrected and the net effect of the adjustment is reflected above. This is as a result of interests earned in March 2018 which was erroneously accounted for as departmental revenue in 2017-18.
NoteAmount before error
correctionPrior period error
RestatedAmount
2017/18 2017/18 2017/18
R’000 R’000 R’000
Other:
Irregular expenditure 22 190 (190) -
Net effect 190 (190) -
In the current year an error in the prior year irregular expenditure was detected. The error was corrected and the net effect of the adjustment is reflected above. Request to condone irregular expenditure was approved in the prior year but received during the current year.
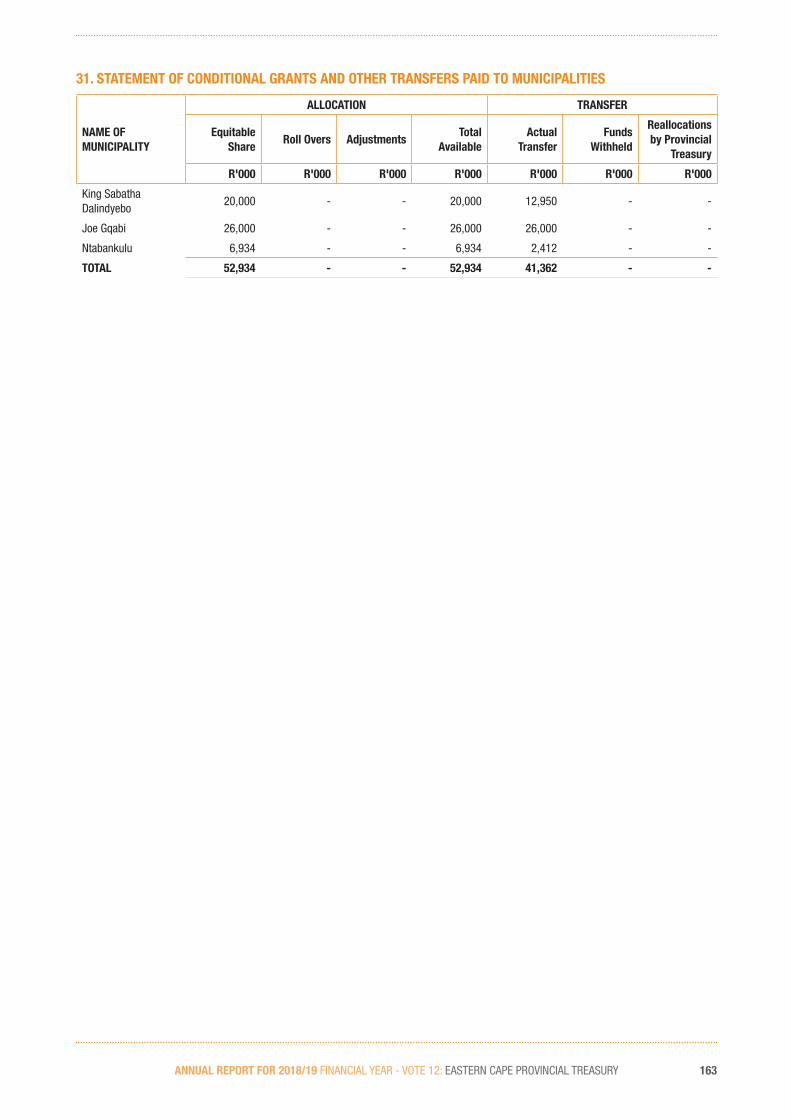
ANNUAL REPORT FOR 2018/19 FINANCIAL YEAR - VOTE 12: EASTERN CAPE PROVINCIAL TREASURY 163
31. STATEMENT OF CONDITIONAL GRANTS AND OTHER TRANSFERS PAID TO MUNICIPALITIES
NAME OF MUNICIPALITY
ALLOCATION TRANSFER
Equitable Share
Roll Overs AdjustmentsTotal
AvailableActual
TransferFunds
Withheld
Reallocations by Provincial
Treasury
R'000 R'000 R'000 R'000 R'000 R'000 R'000
King Sabatha Dalindyebo
20,000 - - 20,000 12,950 - -
Joe Gqabi 26,000 - - 26,000 26,000 - -
Ntabankulu 6,934 - - 6,934 2,412 - -
TOTAL 52,934 - - 52,934 41,362 - -

ANNUAL REPORT FOR 2018/19 FINANCIAL YEAR - VOTE 12: EASTERN CAPE PROVINCIAL TREASURY164
5.2.9. UNAUDITED ANNEXURES TO THE ANNUAL FINANCIAL STATEMENTSANNEXURE 1ASTATEMENT OF CONDITIONAL GRANTS AND OTHER TRANSFERS PAID TO MUNICIPALITIES
NAME OF MUNICIPALITY
ALLOCATION TRANSFER SPENT 2017/18
Equi-table Share
Roll Overs
Adjust-ments
Total Avail-able
Actual Transfer
Funds With-held
Real-locations by Pro-vincial Treasury
Amount received by Mu-nicipality
Amount spent by munici-pality
% of available funds spent by munici-pality
Equi-table Share
Actual Transfer
R'000 R'000 R'000 R'000 R'000 R'000 R'000 R'000 R'000 R'000 R'000
King Sabatha Dalindyebo 20,000 - - 20,000 12,950 - - 12,950 12,950 100% 25,128 25,128
Joe Gqabi 26,000 - - 26,000 26,000 - - 26,000 26,000 100% 63,123 63,123
Ntabankulu 6,934 - - 6,934 2,412 - - 2,412 2,412 100% 4,734 4,734
TOTAL 52,934 - - 52,934 41,362 - - 41,362 41,362 92,985 92,985
ANNEXURE 1BSTATEMENT OF TRANSFERS TO DEPARTMENTAL AGENCIES AND ACCOUNTS
DEPARTMENT/ AGENCY/ ACCOUNT
TRANSFER ALLOCATION TRANSFER 2017/18
AdjustedAppropriation Adjustments
Total Available
Actual Transfer
% of Available
Funds Transferred
Final Appropriation
R'000 R'000 R'000 R'000 % R'000
South African Broadcasting Corporation (SABC) 2 - 2 2 100% 2
Finance and Accounting Services Sector Education and Training Authority (FASSET) 1,165 - 1,165 828 71% 1,100
South African National Road Agency Limited (SANRAL) 21,575 - 21,575 21,575 100% 251,732
Total 22,742 - 22,742 22,405 252,834
Transfer to SABC is for TV licence costs and transfers to FASSET are in respect of skills development fund levies. Transfers to SANRAL are in respect of rural access roads in various municipalities in the Eastern Cape Province.
ANNEXURE 1CSTATEMENT OF TRANSFERS TO HOUSEHOLDS
HOUSEHOLDS
TRANSFER ALLOCATION EXPENDITURE 2017/18
AdjustedAppropriation
ActRoll Overs Adjustments
Total Available
Actual Transfer
% of Available
funds Transferred
Final Appropriation
R'000 R'000 R'000 R'000 R'000 % R'000
Transfers
Leave Gratuity 2,688 - 289 2,977 2,795 94% 7,727
Bursaries to Non-Employees
870 - - 870 779 90% 831
Total 3,558 - 289 3,847 3,574 8,558

ANNUAL REPORT FOR 2018/19 FINANCIAL YEAR - VOTE 12: EASTERN CAPE PROVINCIAL TREASURY 165
ANNEXURE 2STATEMENT OF GIFTS, DONATIONS AND SPONSORSHIPS RECEIVED
NAME OF ORGANISATION
NATURE OF GIFT, DONATION OR SPONSORSHIP2018/19 2017/18
R’000 R’000
Received in kind
Standard BankSponsorship of venue and catering for the Budget Business Breakfast.
72 73
Standard BankSponsorship of accommodation and show tickets for Standard Bank National Arts Festival in Grahamstown.
- 3
Standard Bank Sponsorship of catering for Budget Day. 66 80
Standard Bank Sponsorship of catering for budget media lock-up session. - 30
Standard Bank Sponsorship for Imingcangathelo High School science laboratory. - 436
Standard Bank Sponsorship for Imingcangathelo High School container. - 36
Standard BankArts and Culture performance at Mpekweni Resort for TCF Lekgotla.
6 -
Standard BankSponsorship for Sovereign tech backpacks with legends logo for TCF Lekgotla.
44 -
Standard Bank Comedy performance for TCF Lekgotla. 6 -
Standard Bank Team building and Strategic motivation. 22 -
Standard BankSponsorship for Esethu Sotheni to attend a conference in Kuala Lumpur - Malaysia.
15 -
ECDC & ECPTA Gifts for facilitators of GTAC training on expenditure reviews. 4 -
Nedbank Blanket donation for Duncan Village. 93 -
Nedbank Sponsorship for tablets - Lady Grey Arts School. 199 -
TOTAL 527 658
Eastern Cape Development Corporation (ECDC)
Eastern Cape Parks and Tourism Agency (ECPTA)
Government Technical Advisory Centre (GTAC)
Technical Committee for Finance (TCF)
ANNEXURE 3STATEMENT OF AID ASSISTANCE RECEIVED
NAME OF DONOR PURPOSEOPENING BALANCE
REVENUE EXPENDITUREPAID BACK ON/BY 31 MARCH
CLOSING BALANCE
R'000 R'000 R'000 R'000 R'000
Received in cash
Belgian/South African Study and Consultancy Fund
Evaluation study to assess the effectiveness of Co-operatives Funding in the Eastern Cape.
- 62 50 - 12
Subtotal - 62 50 - 12
TOTAL - 62 50 - 12
The Provincial Treasury embarked on an evaluation project to assess the effectiveness of Co-operatives Funding in the Eastern Cape. National Treasury funded the evaluation study through donor funds from the Belgian/South African Study and Consultancy Fund. The amount of R11,969.30 will be surrendered to the Provincial Revenue Fund.

ANNUAL REPORT FOR 2018/19 FINANCIAL YEAR - VOTE 12: EASTERN CAPE PROVINCIAL TREASURY166
ANNEXURE 4ASTATEMENT OF FINANCIAL GUARANTEES ISSUED AS AT 31 MARCH 2019 - LOCAL
Guarantor institution
Guarantee in respect of
Original guaranteed
capital amount
Opening balance 1 April 2018
Guarantee draw
downsduring the
year
Guarantee repayments/ cancelled/ reduced/ released
during the year
Re-valuations
Closing balance
31 March 2019
Guaranteed interest for year ended 31 March
2019
Realised losses not
recoverable i.e. claims paid out
R’000 R’000 R’000 R’000 R’000 R’000 R’000 R’000
Housing
Standard Bank
Housing 54 54 - (54) - - - -
TOTAL 54 54 - (54) - - - -
ANNEXURE 4BSTATEMENT OF CONTINGENT LIABILITIES AS AT 31 MARCH 2019
Nature of Liability
Opening
Liabilities incurred during the year
Liabilities paid/cancelled/reduced
during the year
Liabilities recoverable
ClosingBalance
31 March 2019R’000
Balance
1 April 2018
R’000 R’000 R’000 R’000
Claims against the department
Litigation 1,130 - - - 1,130
TOTAL 1,130 - - - 1,130
ANNEXURE 5CLAIMS RECOVERABLE
Government Entity
Confirmed balance outstanding
Unconfirmed balance outstanding
TotalCash in transit at year end 2018/19*
31/03/2019 31/03/2018 31/03/2019 31/03/2018 31/03/2019 31/03/2018
Receipt date up
to six (6) working
days after year end
Amount
R’000 R’000 R’000 R’000 R’000 R’000 R'000
Department
EC:Economic Development
20 84 - - 20 84 -
EC:Agriculture - 3 - - - 3 -
EC : Transport - 19 139 - 139 19 -
National Treasury - - - 291 - 291 -
EC:Health 2 - - - 2 - -
EC:Legislature 24 - - - 24 - -
EC: Sport - - 17 - 17 - -
EC: Social Development
- - 122 - 122 - -
Subtotal 46 106 278 291 324 397 -
TOTAL 46 106 278 291 324 397 -

ANNUAL REPORT FOR 2018/19 FINANCIAL YEAR - VOTE 12: EASTERN CAPE PROVINCIAL TREASURY 167
ANNEXURE 6INTER-GOVERNMENT PAYABLES
GOVERNMENT ENTITY
Confirmed balance outstanding
Unconfirmed balance outstanding
TOTALCash in transit at year
end 2018/19*
31/03/2019 31/03/2018 31/03/2019 31/03/2018 31/03/2019 31/03/2018
Payment date up
to six (6) working
days before
year end
Amount
R’000 R’000 R’000 R’000 R’000 R’000 R'000
DEPARTMENTS
Current
EC:Sport, Recreation, Arts and Culture
- 24 - - - 24 -
EC: Human Settlements
- 45 - - - 45 -
EC : Office of the Premier
- 71 - - - 71 -
National Treasury 29 - - - 29 - -
EC: Agriculture 424 - - - 424 - -
National Department of International Relations and Cooperation
56 - - - 56 -
South African Police Services
- - 16 - 16 -
Subtotal 509 140 16 - 525 140 -
TOTAL 509 140 16 - 525 140 -

168
NOTES
ANNUAL REPORT FOR 2018/19 FINANCIAL YEAR - VOTE 12: EASTERN CAPE PROVINCIAL TREASURY

PROVINCIAL TREASURY
2018/19
PROVINCIAL TREASURY ANNUAL REPORT VOTE 12 2018/19CONTACT INFORMATIONPrivate Bag X0029, Bhisho, 5605Tel 040 101 0157 | Fax 040 101 [email protected]
gemprint 043 722 0755 (60624)
ANNUAL REPORTVOTE 12