Provincial Profile 2004 - Statistics South Africa | … List of tables Table 1.1: Area, population...
123
-
Upload
trinhthien -
Category
Documents
-
view
241 -
download
0
Transcript of Provincial Profile 2004 - Statistics South Africa | … List of tables Table 1.1: Area, population...

Provincial Profile 2004
KwaZulu-Natal
Pali Lehohla Statistician-General
Report No. 00-91-05 (2004) Statistics South Africa

Published by Statistics South Africa, Private Bag X44, Pretoria 0001 © Statistics South Africa, 2006 Users may apply or process this data, provided Statistics South Africa (Stats SA) is acknowledged as the original source of the data; that it is specified that the application and/or analysis is the result of the user's independent processing of the data; and that neither the basic data nor any reprocessed version or application thereof may be sold or offered for sale in any form whatsoever without prior permission from Stats SA. Stats SA Library Cataloguing-in-Publication (CIP) Data Provincial Profile 2004: KwaZulu-Natal/Statistics South Africa. Pretoria: Statistics South Africa, 2006 122p. [Report No. 00-91-05 (2004)] ISBN 0-621-36364-2 1. Demography – KwaZulu-Natal (South Africa) 2. Vital Statistics – KwaZulu-Natal (South Africa) 3. Households – KwaZulu-Natal (South Africa) 4. Education – Statistics – KwaZulu-Natal (South Africa) 5. Public Health – KwaZulu-Natal (South Africa) 7. Labour Markets – KwaZulu-Natal (South Africa) 8. Migration, Internal – KwaZulu-Natal (South Africa) 9. Emigration and Immigration – KwaZulu-Natal (South Africa) 10. Crime Statistics – KwaZulu-Natal (South Africa) 11. Gross State Product – KwaZulu-Natal (South Africa) 12. Prices Indexes 13. Legislative Bodies – KwaZulu-Natal (South Africa) I. Statistics South Africa II. Series (LCSH 16) A complete set of Stats SA publications is available at Stats SA Library and the following libraries: National Library of South Africa, Pretoria Division National Library of South Africa, Cape Town Division Library of Parliament, Cape Town Bloemfontein Public Library Natal Society Library, Pietermaritzburg Johannesburg Public Library Eastern Cape Library Services, King William's Town Central Regional Library, Polokwane Central Reference Library, Nelspruit Central Reference Collection, Kimberley Central Reference Library, Mmabatho This report is available on the Stats SA website: www.statssa.gov.za Copies are available from: Printing and Distribution, Statistics South Africa Tel: (012) 310 8044 (012) 310 8161 Fax: (012) 321 7381 E-mail: [email protected]

i
Contents List of tables......................................................................................................................... iii List of figures....................................................................................................................... vi Map: South African provinces and provincial boundaries............................................. ix Executive summary............................................................................................................. 1 Objective ......................................................................................................................... 1 Data sources ......................................................................................................................... 1 Findings in the profile........................................................................................................... 1 Extract from the Report of the Census Sub-committee to the South African Statistics Council on Census 2001 ..................................................................................... 4 Definitions ......................................................................................................................... 5 Chapter 1: Demography .................................................................................................. 7 1.1 Population profile............................................................................................ 7 1.2 Sex ratios......................................................................................................... 12 1.3 Age distribution............................................................................................... 15 1.4 Language......................................................................................................... 21 1.5 Religion........................................................................................................... 23 1.6 Country of birth............................................................................................... 24 1.7 Citizenship ...................................................................................................... 26 1.8 Disability......................................................................................................... 26 1.9 Urbanisation .................................................................................................... 28 Chapter 2: Vital statistics................................................................................................. 30 2.1 Births............................................................................................................... 30 2.2 Deaths.............................................................................................................. 32 2.3 Marriages ........................................................................................................ 36 2.4 Divorces .......................................................................................................... 39 Chapter 3: Migration ....................................................................................................... 41 3.1 Internal migration............................................................................................ 41 3.2 International migration.................................................................................... 43 Chapter 4: Health ............................................................................................................. 45 4.1 Health personnel ............................................................................................. 45 4.2 Healthcare institutions..................................................................................... 46 4.3 HIV and AIDS ................................................................................................ 47 4.4 Childhood mortality ........................................................................................ 48 4.5 Visits to health institutions or a health worker ............................................... 50 4.6 Medical aid coverage ...................................................................................... 51 Chapter 5: Education ....................................................................................................... 52 5.1 Educational attainment.................................................................................... 52 5.2 Literacy ........................................................................................................... 54 5.3 Schools and school data .................................................................................. 56 5.4 Learner:classroom ratio................................................................................... 57 5.5 Learner:educator ratio ..................................................................................... 57 5.6 Gross enrolment ratio (GER) .......................................................................... 58 5.7 Grade 12 pass rate ........................................................................................... 59 5.8 School amenities ............................................................................................. 61 Chapter 6: Safety and security ........................................................................................ 62 6.1 Police stations ................................................................................................. 62 6.2 Murder and attempted murder......................................................................... 62 6.3 Robbery........................................................................................................... 62

ii
6.4 Rape and associated crimes............................................................................. 63 6.5 Burglary .......................................................................................................... 63 6.6 Farm attacks .................................................................................................... 64 Chapter 7: The labour market ........................................................................................ 66 7.1 Labour market status of the population of working age ................................. 66 7.2 Labour market indicators ................................................................................ 67 7.3 Formal and informal sector employment ........................................................ 69 7.4 Industry and occupation .................................................................................. 70 7.5 Employment in formal agriculture .................................................................. 72 7.6 Income of the employed.................................................................................. 72 Chapter 8: Households and household services............................................................. 74 8.1 Distribution of households by province .......................................................... 74 8.2 Housing tenure ................................................................................................ 75 8.3 Dwelling type.................................................................................................. 77 8.4 Female-headed households ............................................................................. 78 8.5 Child-headed households ................................................................................ 80 8.6 Energy ............................................................................................................. 82 8.7 Water ............................................................................................................... 83 8.8 Toilet facilities ................................................................................................ 85 8.9 Refuse removal ............................................................................................... 87 8.10 Access to telephones ....................................................................................... 87 8.11 Ownership of selected household goods......................................................... 88 Chapter 9: Economy......................................................................................................... 91 9.1 Gross Domestic Product per Region (GDPR)................................................. 91 9.2 Selected economic sectors in KwaZulu-Natal ................................................ 97 9.3 Human Development Index (HDI) ................................................................. 106 9.4 Consumer Price Index (CPI) ........................................................................... 107 Chapter 10: Politics ............................................................................................................ 108
iii
List of tables Table 1.1: Area, population and population density by province, 1996 and 2001........... 7 Table 1.2: Population by population group, KwaZulu-Natal and South Africa, 2001 .... 9 Table 1.3: Population by district council and local municipal area, KwaZulu-Natal,
2001................................................................................................................. 10 Table 1.4: Population by district council and population group, KwaZulu-Natal,
2001................................................................................................................. 12 Table 1.5: Population by province, sex and sex ratio, South Africa, 1996 and 2001 ...... 13 Table 1.6: Sex ratio by district council, KwaZulu-Natal, 2001 ....................................... 14 Table 1.7: Age distribution by population group and sex, KwaZulu-Natal, 2001........... 18 Table 1.8: Population by district council and sex, KwaZulu-Natal, 2001 ....................... 20 Table 1.9: Population by home language, KwaZulu-Natal and South Africa, 2001........ 21 Table 1.10: Population by home language and population group, KwaZulu-Natal,
2001................................................................................................................. 22 Table 1.11: Population by religion and population group, KwaZulu-Natal, 2001............. 23 Table 1.12: Country of birth by province, South Africa, 2001 .......................................... 25 Table 1.13: Citizenship by population group, KwaZulu-Natal, 2001................................ 26 Table 1.14: The disabled by type of disability, KwaZulu-Natal and South
Africa, 2001 .................................................................................................... 27 Table 1.15: Population of each district council by urban/rural area,
KwaZulu-Natal, 2001...................................................................................... 29 Table 2.1: Annual registration of live births by municipality, KwaZulu-Natal, 2004..... 32 Table 2.2: Number of deaths by province and year of death, 1997–2003 ....................... 33 Table 2.3: Deaths due to the ten leading underlying causes in KwaZulu-Natal and
South Africa, 2001 .......................................................................................... 34 Table 2.4: Recorded deaths by leading district, KwaZulu-Natal, 1997–2000 ................. 34 Table 3.1: Internal migration by province, South Africa, 1996 ....................................... 41 Table 3.2: Internal migration by province, South Africa, 2001 ....................................... 41 Table 3.3: Migrants into KwaZulu-Natal by district municipality, 2001......................... 43 Table 3.4: Population by region of birth, 2001 ................................................................ 43 Table 4.1: Number of public healthcare personnel per 10 000 population and by
category, KwaZulu-Natal, 2001...................................................................... 46 Table 4.2: Number of hospitals and beds in each province, 2001 ................................... 46 Table 4.3: Primary health-care facilities in each province, 2001..................................... 47 Table 4.4: HIV-prevalence by province (estimated rates and confidence intervals),
2000 and 2001................................................................................................. 48 Table 4.5: Pregnant women interviewed and previous live births reported in each
health district, KwaZulu-Natal, 2001.............................................................. 49 Table 4.6: Calculation of IMR and U5MR, KwaZulu-Natal, 2001 ................................. 50 Table 4.7: Percentage medical aid coverage by province, 2003 and 2004 ...................... 51 Table 5.1: Percentage population aged 20 years and above in each population group
by educational level, KwaZulu-Natal and South Africa, 2001 ....................... 53 Table 5.2: Number of people aged 20+ with no formal schooling by province and
population group, South Africa, 2001............................................................. 55 Table 5.3: Number of schools in each province, 2001..................................................... 56 Table 5.4: Distribution of schools by district municipality, KwaZulu-Natal, 2002......... 56 Table 5.5: Learner:classroom ratio in each district municipality, KwaZulu-Natal,
2002................................................................................................................. 57

iv
Table 5.6: Learner:educator ratio in each district municipality, KwaZulu-Natal, 2002 .. 58 Table 5.7: Number of learners in the ordinary school sector, the school-age
population and the gross enrolment ratio (GER) by sex, KwaZulu-Natal and South Africa, 2001 ................................................................................... 58
Table 5.8: Senior certificate results by province, South Africa, 2003 ............................. 60 Table 5.9: Number and percentage of schools in each district municipality without
selected amenities, KwaZulu-Natal, 2002 ...................................................... 61 Table 6.1: Police stations in each province, 2003 ............................................................ 62 Table 6.2: Murder and attempted murder, KwaZulu-Natal, 2000–2002 ......................... 62 Table 6.3: Reported robbery, KwaZulu-Natal, 2001–2003 ............................................. 63 Table 6.4: Robbery of cash in transit and bank robbery, KwaZulu-Natal, 200–2003 ..... 63 Table 6.5: Cases of rape and associated crimes, KwaZulu-Natal, 2001–2003 ................ 63 Table 6.6: Types of burglary, KwaZulu-Natal, 2001–2003............................................. 64 Table 6.7: Farm attacks in each province, 2001–2003..................................................... 64 Table 7.1: Labour market status of the working-age population (15–65 years) in each
population group, KwaZulu-Natal, 2004 ........................................................ 66 Table 7.2: Labour market status by sex, KwaZulu-Natal and South Africa,
September 2004............................................................................................... 67 Table 7.3: Labour market indicators in each province, South Africa, 2004 .................... 68 Table 7.4: Formal and informal sectors by province, September 2004 ........................... 69 Table 7.5: The employed by sector, population group and sex, KwaZulu-Natal, 2004
(percentage)..................................................................................................... 70 Table 7.6: Employment by occupational category, KwaZulu-Natal and South Africa,
September 2004............................................................................................... 71 Table 7.7: Employment in formal agriculture in each province by full-time/casual,
South Africa, 2002 .......................................................................................... 72 Table 7.8: Distribution of the working-age population by gross monthly income and
population group, KwaZulu-Natal and South Africa, September 2004.......... 73 Table 8.1: Distribution of total households by province, South Africa, 2004 ................. 74 Table 8.2: Tenure status of households’ dwellings within district municipality,
KwaZulu-Natal, 2001...................................................................................... 76 Table 8.3: Distribution of households by type of dwelling, KwaZulu-Natal, 2004......... 77 Table 8.4: Distribution of households by type of dwelling and population group of
household head, KwaZulu-Natal, 2004........................................................... 78 Table 8.5: Number and proportion of female-headed households in each province,
September 2004............................................................................................... 78 Table 8.6: Number and percentage of female-headed households by district
municipality, KwaZulu-Natal, 2001 ............................................................... 79 Table 8.7: Female-headed households by population group of the household head,
KwaZulu-Natal, 2004...................................................................................... 79 Table 8.8: Distribution of households by main source of water and population group,
KwaZulu-Natal, 2004 (percentage)................................................................. 84 Table 8.9: Distribution of households by toilet facility, KwaZulu-Natal and South
Africa, 2004 .................................................................................................... 85 Table 8.10: Toilet facilities by population group, KwaZulu-Natal, 2004.......................... 86 Table 8.11: Distribution of households by type of refuse removal and population
group of the household head, KwaZulu-Natal, 2004 ...................................... 87 Table 8.12: Distribution of households with access to telephone facilities, KwaZulu-
Natal and South Africa, 2001.......................................................................... 88

v
Table 9.1: GDPR and value added estimates per industry at current prices, KwaZulu-Natal, 1996–2004 ............................................................................................ 93
Table 9.2: GDPR and value added estimates per industry at constant 2000 prices, KwaZulu-Natal, 1996–2004............................................................................ 95
Table 9.3: Farming operations by land surface area and province, South Africa, 2001 .. 98 Table 9.4: Gross farming income earned from field crops............................................... 99 Table 9.5: Gross farming income earned from field crops (continued) ........................... 99 Table 9.6: Quantity harvested in each province, South Africa, 2001(maize for grain) ... 100 Table 9.7: Number of farming units and market value of assets by province, South
Africa 2002 ..................................................................................................... 101 Table 9.8: Breakdown of gross farming income by type of division and province,
South Africa, 2002 .......................................................................................... 102 Table 9.9: KwaZulu-Natal supply statistics, 2001 ........................................................... 104 Table 9.10: Hotel trading statistics, KwaZulu-Natal, 2001................................................ 105 Table 9.11: Percentage changes in the number of fatal crashes by province, South
Africa: December 2000 and December 2001.................................................. 105 Table 9.12: Distribution of cost of crash by province, South Africa, 2002 ....................... 106 Table 10.1: Seat allocation in KwaZulu-Natal legislature by political party in 1999
and 2004.......................................................................................................... 108 Table 10.2: KwaZulu-Natal Provincial Legislature key focus areas, 2004........................ 110

vi
List of figures Figure 1.1: Distribution of land area by province, South Africa, 2001....................................8 Figure 1.2: Population density by province, South Africa, 1996 and 2001 .............................8 Figure 1.3: Percentage population by population group, KwaZulu-Natal and South
Africa, 2001 ...........................................................................................................9 Figure 1.4: Percentage population by district council and population group,
KwaZulu-Natal, 2001 ..........................................................................................12 Figure 1.5: Sex ratio by province, South Africa, 1996 and 2001...........................................13 Figure 1.6: Sex ratio in each district council, KwaZulu-Natal, 2001.....................................14 Figure 1.7: Population by age group, KwaZulu-Natal, 1996 and 2001 .................................15 Figure 1.8: Population by age group, KwaZulu-Natal and South Africa, 2001.....................16 Figure 1.9: Population by age group and sex, KwaZulu-Natal, 2001 ....................................17 Figure 1.10: Distribution of the black African population by age group and sex,
KwaZulu-Natal, 2001 ..........................................................................................18 Figure 1.11: Distribution of the coloured population by age group and sex, KwaZulu-Natal,
2001......................................................................................................................19 Figure 1.12: Distribution of the Indian/Asian population by age group and sex,
KwaZulu-Natal, 2001 ..........................................................................................19 Figure 1.13: Distribution of the white population by age and sex,
KwaZulu-Natal, 2001 ..........................................................................................20 Figure 1.14: Percentage distribution of the population by home language,
KwaZulu-Natal and South Africa, 2001 ..............................................................22 Figure 1.15: Percentage population distribution of those not born in South Africa by
province, South Africa, 2001 ...............................................................................25 Figure 1.16: Percentage disabled population by type of disability and population group,
KwaZulu-Natal, 2001 ..........................................................................................27 Figure 1.17: Disabled population by district council and type of disability,
KwaZulu-Natal, 2001 ..........................................................................................28 Figure 1.18: Percentage population by district council and settlement,
KwaZulu-Natal, 2001 ..........................................................................................29 Figure 2.1: Registration of annual live births by province in South Africa, 2004 .................30 Figure 2.2: Percentage distribution of current and late registration of births by province,
South Africa, 2004...............................................................................................31 Figure 2.3: Distribution of deaths by province and year of death, 1997–2002 ......................33 Figure 2.4: Recorded deaths by age at death and sex, KwaZulu-Natal, 1997–2000..............35 Figure 2.5: Recorded deaths by month of death and sex, KwaZulu-Natal, 2000...................36 Figure 2.6: Marriages by province and way of solemnisation, South Africa, 2002...............37 Figure 2.7: Distribution of the population by marital status, KwaZulu-Natal, 2001 .............38 Figure 2.8: Percentage marital status within each population group,
KwaZulu-Natal, 2001 ..........................................................................................38 Figure 2.9: Divorces by province and way of solemnisation, South Africa, 2003.................39 Figure 2.10: Divorces by population group and way of solemnisation,
KwaZulu-Natal, 2002 ..........................................................................................40 Figure 3.1: Gains or losses in internal migration by province, 1996 and 2001......................42 Figure 3.2: Numbers of migrants to KwaZulu-Natal from other provinces, 1996–2001.......42 Figure 3.3: Distribution of persons in each province not born in South Africa by
region of birth, 2001 ............................................................................................44 Figure 4.1: Percentage of vacant posts in KwaZulu-Natal, 2000 and 2001 ...........................45

vii
Figure 4.2: Reported AIDS cases by age, KwaZulu-Natal, 2001 ..........................................48 Figure 4.3: Average percentage of the population in each province who consulted
a health worker in the month prior to the interview, 2003 and 2004...................51 Figure 5.1: Percentage distribution of persons aged 20+ within each province by level of
education, 2001 ....................................................................................................52 Figure 5.2: Urban and rural population aged 20 years and above by educational level,
KwaZulu-Natal and South Africa, 2001 ..............................................................53 Figure 5.3: Percentage population aged 20 years and above by level of education
and sex, KwaZulu-Natal, 2001 ............................................................................54 Figure 5.4: Proportion of persons aged 15 years and older in each province that were
functionally literate, 2001 ....................................................................................55 Figure 6.1: Proportion of farms attacks in which victims were murdered or seriously
injured, South Africa, 2001..................................................................................65 Figure 7.1: Labour market status of the working-age population by sex,
KwaZulu-Natal and South Africa, September 2004 ............................................67 Figure 7.2: Labour market indicators by province, South Africa, 2004.................................69 Figure 7.3: Distribution of the employed of working age by main industry and sex,
KwaZulu-Natal and South Africa, September 2004 ............................................71 Figure 7.4: Percentage distribution of the working-age population by individual gross
monthly income, KwaZulu-Natal and South Africa, 2004 ..................................73 Figure 8.1: Percentage distribution of total households by province, 2004 ...........................74 Figure 8.2: Percentage distribution of households by population group of the household
head, KwaZulu-Natal, 2004.................................................................................75 Figure 8.3: Tenure status of households, KwaZulu-Natal, 2001............................................75 Figure 8.4: Percentage of households by tenure status and district municipality, KwaZulu-
Natal, 2001...........................................................................................................77 Figure 8.5: Percentage distribution of female-headed households by population group,
KwaZulu-Natal, 2004 ..........................................................................................80 Figure 8.6: Distribution of child-headed households by province and age group, South
Africa, 2001 .........................................................................................................80 Figure 8.7: Child-headed households by age and district municipality, KwaZulu-
Natal, 2001...........................................................................................................81 Figure 8.8: Child-headed households by age and population group, KwaZulu-
Natal, 2001...........................................................................................................82 Figure 8.9: Distribution of households by energy sources for cooking, heating and
lighting, KwaZulu-Natal and South Africa, 2004................................................82 Figure 8.10: Percentage distribution of households by main source of water, KwaZulu-
Natal and South Africa, 2004...............................................................................83 Figure 8.11: Distribution of households by source of water and district municipality,
KwaZulu-Natal, 2001 (percentage) .....................................................................84 Figure 8.12: Distribution of toilet facilities by district municipality, KwaZulu-Natal, 2001
(percentage)..........................................................................................................86 Figure 8.13: Distribution of telephone facilities by district municipality, KwaZulu-
Natal, 2001...........................................................................................................88 Figure 8.14: Ownership of selected household goods by population group, KwaZulu-
Natal, 2001...........................................................................................................89 Figure 8.15: Selected household goods by district municipality, KwaZulu-Natal, 2001.........90 Figure 9.1: Real annual economic growth rate per region for 2004.......................................91 Figure 9.2: Percentage GDPR contribution to the national GDP, South Africa, 2004 ..........92 Figure 9.3: Average annual economic growth per region, South Africa 1996–2004.............92

viii
Figure 9.4: Percentage contribution of industries to the Gross Domestic Product per Region at current prices, KwaZulu-Natal, 2005 ..................................................94
Figure 9.5: Gross Domestic Product per Region for KwaZulu-Natal at constant 2000 prices (percentage changes), 2004 .......................................................................95
Figure 9.6: Gross Domestic Product per Region at current prices for KwaZulu-Natal and South Africa, 2004 (percentage contributions)....................................................96
Figure 9.7: Gross Domestic Product per Region for KwaZulu-Natal and South Africa, 2004 (percentage changes) ......................................................................97
Figure 9.8: Distribution of farming operations in South Africa by province, 2001...............98 Figure 9.9: Percentage quantity harvested by province: maize for grain, South
Africa, 2001 .......................................................................................................100 Figure 9.10: Gross farming income and farming debt by province, South Africa, 2002.......101 Figure 9.11: Purpose of visit to KwaZulu-Natal, 2001 ..........................................................103 Figure 9.12: Activities undertaken by tourists in KwaZulu-Natal, 2001 ...............................104 Figure 9.13: Human Development Index by population group and province, South
Africa, 2003 .......................................................................................................107 Figure 9.14: Consumer Price Index for KwaZulu-Natal and South Africa, January 2003 to
December 2003 ..................................................................................................107 Figure 10.1: KwaZulu-Natal MEC representation by political party, 1999 and 2004 ...........109 Figure 10.2: Gender representation of the MECs in KwaZulu-Natal, 1999 and 2004...........109
ix
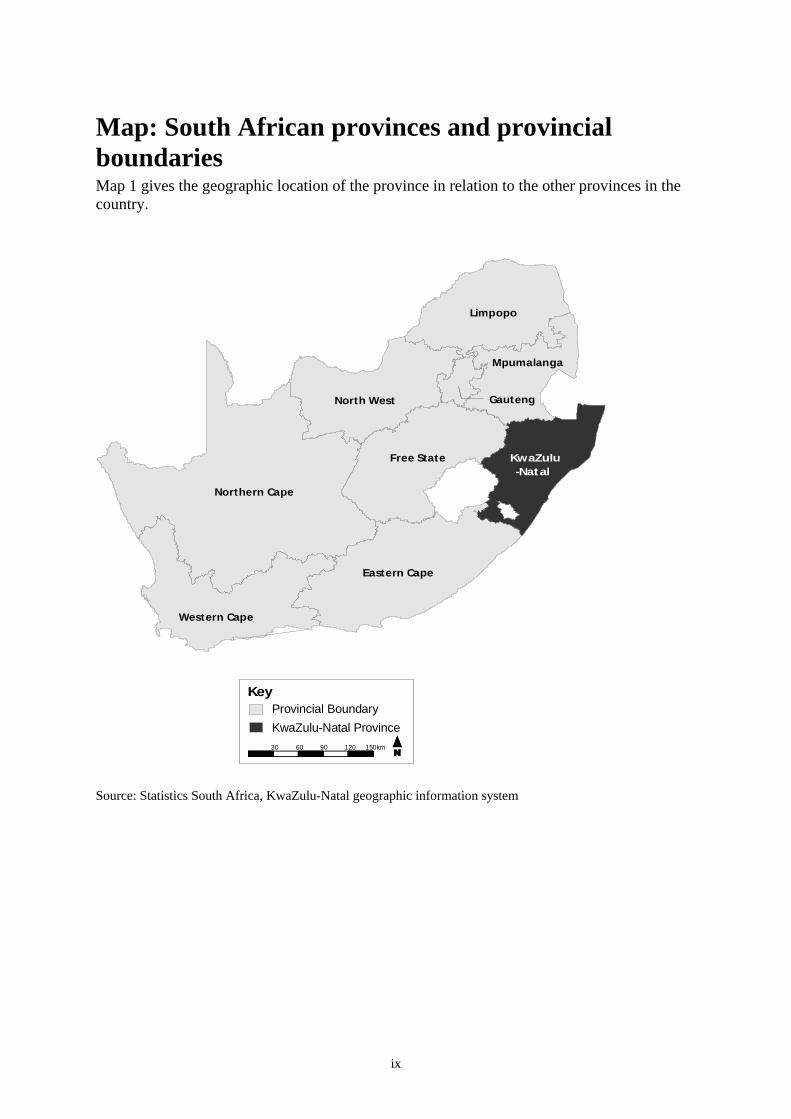
Map: South African provinces and provincial boundaries Map 1 gives the geographic location of the province in relation to the other provinces in the country.
Northern Cape
KwaZulu-Natal
Eastern Cape
Free State
Western Cape
GautengNorth West
Limpopo
Mpumalanga
30 60 12090 150km
KeyProvincial BoundaryKwaZulu-Natal Province
Source: Statistics South Africa, KwaZulu-Natal geographic information system

x

1
Executive summary Objective KwaZulu-Natal, as a province, is facing similar challenges to those of the country as a whole. The priority areas for social, economic and demographic development include rural development, urban renewal, economic and employment growth, poverty reduction and human resource development. The objective of this profile is to give the reader a broad picture of life circumstances in KwaZulu-Natal. The information in this profile can be used in planning and development, as well as to inform the decision-making processes in the province.
Data sources Data from the 2001 Population Census (Census 2001) and other relevant Statistics South Africa (Stats SA) sources were used in the analysis. Additional data came from external sources, mainly the Department of Education, the Department of Health, South African Police Service, KwaZulu-Natal Provincial Legislature and KwaZulu-Natal Provincial Treasury. These data come with various warnings and cautions, such as non-reporting of crime in the case of Safety and security, and late and non-registration of births and deaths in the case of Vital statistics. The information has been compiled at macrolevel using the 10 district councils, and the Unicity area of eThekwini.
Findings in the profile
Background KwaZulu-Natal covers 92 100 km2 or 7,2% of the total land of South Africa and had the largest population of almost 9,4 million people in 2001.
The population of KwaZulu-Natal The majority (84,9%) of the population were black African, followed by 8,5% Indian/Asian, 5,1% white and 1,5% coloured. Approximately 54% of the population of KwaZulu-Natal lived in non-urban areas, while 46% lived in urban areas in 2001. The main language was isiZulu (80,9%) and the main religion was the Zion Christian Church (12,5%). Of the people in KwaZulu-Natal, 5,0% were disabled. Physical disability was the most dominant among those with disability status – 26,3% of the disabled.
Vital statistics KwaZulu-Natal had the second highest rate of current registrations of births in South Africa in 2004, i.e. 41,2% of births were registered as current while 58,8% were late registrations. A total of 116 982 deaths were recorded in KwaZulu-Natal in 2002. KwaZulu-Natal had the second highest number of recorded marriages (26 683) in 2002, while Gauteng recorded the highest number of marriages (45 787). KwaZulu-Natal had more civil than religious divorces.

2
Migration According to Census 2001, between 1996 and 2001 145 078 people moved into KwaZulu-Natal from other provinces. There were 96 763 non-South African residents living in KwaZulu-Natal in 2001.
Health There were 198 hospitals and 428 clinics in KwaZulu-Natal in 2003. Of all the provinces, KwaZulu-Natal had the highest HIV prevalence rate (33,5%) among women attending antenatal clinics in the public sector in 2001. This had decreased from 36,2% in 2000.
Education Approximately 36,7% of the population aged 20 years or older of KwaZulu-Natal had completed Grade 12 or a higher education. Gauteng was the province that had the highest proportion (40,6%). In all the district councils in KwaZulu-Natal, the learner:educator ratios were less than 35:1 in 2002. Northern Cape had the best senior certificate pass rate in 2003 (90,7%), followed by the Western Cape (87,1%) and Gauteng (81,5%), while KwaZulu-Natal had a senior certificate pass rate of 77,2% in 2003.
Safety and security More than half the residents in KwaZulu-Natal felt safe in their neighbourhoods. Burglary at non-residential premises decreased from 14 008 to 12 007 cases reported between 2002 and 2003, while at residential premises, burglary increased from 48 503 to 52 582 cases reported between 2002 and 2003. KwaZulu-Natal had the second highest number of police stations in South Africa (183), while Eastern Cape had the highest number of police stations in South Africa (194) in 2003. There has been a steady decrease in reported murder cases in KwaZulu-Natal from 2001 to 2003 (i.e. from 5 515 to 5 405 reported cases in KwaZulu-Natal), while there was a significant increase in common robbery as well as other robbery cases that were reported in KwaZulu-Natal from 2001 to 2003.
The labour market According to the Labour Force Survey of September 2004, approximately 2,1 million of the total population in KwaZulu-Natal aged 15–65 years were economically active, while approximately 3,0 million aged 15–65 years were not economically active. KwaZulu-Natal had an unemployment rate of 28,7% in September 2004.
Households and household services There were about 2,3 million households in KwaZulu-Natal in 2004, of which about 82,0% were headed by black Africans, 1,0% by coloureds, 9,0% by Indians/Asians, and 8,0% by white people. About 43,0% of the dwellings that households occupied were owned and fully paid up, while 13,4% were owned but not fully paid up. About 66,8% of the households in KwaZulu-Natal lived in formal dwellings, while 33,2% of the households lived in informal dwellings. Approximately 42,9% of the 2,2 million households in KwaZulu-Natal were headed by females. Females in the age group 15 to 34 years headed most of those households. About 1,9% (41 027) of households in KwaZulu-Natal was headed by children between the age group 10 and 19 years, and the majority of those children were black Africans.

3
The General Household Survey of 2004 showed that approximately 72,0% of KwaZulu-Natal households had access to electricity for lighting, 59,3% for cooking, and 51,2% for heating. About 58,6% of KwaZulu-Natal households had access to piped water on site, compared to 67,8% for the whole of South Africa. About 45,7% of households in KwaZulu-Natal had access to telephones or cellphones in their dwellings, compared to 46,9% for the whole of South Africa. Most households in KwaZulu-Natal (for all the population groups except white residents) in 2004 indicated that they had no access to computers.
Economy In 2004, KwaZulu-Natal contributed about 16,7% to the economy of South Africa. Its average annual economic growth rate was about 3,1%. Manufacturing remained the highest contributor to the economy of KwaZulu-Natal over the period 1995 to 2004. Significant contributions were also made by finance, real estate and business services, general government services, wholesale and retail trade, hotels and restaurants, and transport and communication. Mining and quarrying, electricity and water, and construction made the least contribution to the economic growth rate. The proportion of land used for farming in KwaZulu-Natal in 2001 was 15 982 000 hectares, which constituted about 5,1% of the farming area in South Africa. KwaZulu-Natal had the largest harvest of sugarcane in 2001 (108 459 706 tons), followed by Mpumalanga that harvested 335 471 tons in 2001. Approximately 509 000 tourists visited KwaZulu-Natal in 2000. Most of KwaZulu-Natal’s foreign visitors tended to stay in the province for 6 nights or less. The average length of stay for September 2001 was 12 nights, whilst the median was 6 nights. Approximately 40,0% of foreign visitors enjoyed the beaches and visiting nature reserves, with lesser amounts experiencing arts and craft centres, museums and art galleries. In April 2001, KwaZulu-Natal supplied some 206 hotels, 148 guesthouses, 496 bed and breakfast establishments and 127 caravan and camping sites to the accommodation sector of the country. KwaZulu-Natal and Northern Cape had an average Human Development Index (HDI) of 0,56 each, which made them third highest in South Africa.
Politics In 2004, KwaZulu-Natal had 80 members of the Provincial Legislature, with seven political parties filling the seats, namely the African Christian Democratic Party (ACDP), African National Congress (ANC), Democratic Alliance (DA), Inkatha Freedom Party (IFP), Minority Front (MF), and the United Democratic Movement (UDM).

4
Extract from the Report of the Census Sub-committee to the South African Statistics Council on Census 2001 Preliminary investigations indicate that the 2001 census probably resulted in:
• an underestimate of the number of children below age five* • an overestimate of the number of teenagers (aged between 13 and 19) • an underestimate of the number of men relative to the number of women* • an underestimate of the number in the white population • higher than expected numbers aged 80 and older, in the African population • an underestimate of the number of foreign-born, since some identified themselves
incorrectly as being South African-born • age misstatement in the range 60–74 • an overestimate of the extent of unemployment • an underestimate of those who were employed for only a few hours per week • an underestimate of household income • an overestimate of the number of paternal orphans and the number of fathers missing
from the household. * This is a common feature of censuses, particularly in developing countries. In addition:
• Scanning problems caused some births to be recorded in the wrong province. The number of cases is relatively small and should not lead to too much distortion for most purposes for which these data are used; however, it does produce obviously erroneous results when one tries to estimate the extent of inter-provincial migration of those born since the previous census.
• The fertility data (number of children ever born, children surviving) are problematic. For further details of these investigations see the full report of the Census Sub-committee, 2003.

5
Definitions Dependency ratio refers to the number of individuals supported by one employed individual (excluding him/herself). Disability is a physical or mental handicap which has lasted for six months or more which prevents the person from carrying out daily activities independently, or from participating fully in educational, economic or social activities. Domestic tourist is any person travelling to a place which is other than his or her usual environment, but within the borders of his/her country, for a period of less than one year but for at least one night, and whose main purpose of the visit is other than the exercise of an activity which is remunerated from within the place visited. The economically active population includes all individuals of the working-age group who are working (employed/self-employed) or unemployed. This population excludes pensioners, scholars, full-time students, housewives, and all other individuals who are not available for work (due to disability or otherwise). The economic sector or industry refers to the type of organisation or business in which a person works. Employment status refers to whether a person is employed, unemployed or not economically active. The two subcategories of employed and unemployed together constitute the category of the economically active population. The category of the not economically active includes all those who were not regarded as part of the labour force at the time of census. The employed population consists of all those individuals who performed work for pay, profit or family gain in the seven days prior to the date of the census. Individuals who were employed but were temporarily on leave are included in this category. The formal sector includes all those businesses that are registered in any way. Foreign tourist is someone travelling to a place outside the borders of their country, that is other than their usual environment, for a period of less than one year but for at least one night, and whose main purpose of visit is other than the exercise of an activity which is remunerated, from within the place visited. Functional literacy is a higher level of literacy that includes the ability to read, write and basic mathematical numeracy skills, sufficiently advanced to enable the individual to participate fully and efficiently in activities commonly occurring in his life situation that require a reasonable capability of communicating by written language. Gender ratio is the number of men for every hundred women. Household consists of a single person or a group of people who live together for at least four nights a week, who eat together, and share resources and other life essentials. For census data the four-nights-a-week rule does not apply. The informal sector consists of those businesses that are not registered. Labour absorption rate is the percentage of working-age people who were actually employed. Labour force participation rate is the percentage of working-age people who were economically active. Non-urban/rural areas are all those areas that were not proclaimed as urban, including commercial farms, smallholdings, rural settlements, etc. All those areas that were semi-urban (areas next to proclaimed urban areas) were included in this category. Occupation refers to the actual work people perform regardless of the industry where they work. Population density indicates the number of people per square kilometre.

6
Population group describes the racial classification of a particular group. Note that in the past, population group was based on a legal definition, but is now based on self-perception and self-classification. The unemployment rate refers to the percentage of economically active individuals who were not working but looking for work, in the seven days prior to the census enumeration. This is equivalent to the expanded definition of unemployment. (The official or restricted definition requires that the person has taken active steps to find work in the month prior to the interview; this is not a requirement for the expanded definition). An urban area is an area that was legally declared as urban under the old municipal demarcation (before 1999). It includes towns, cities, and metropolitan areas. The working-age population refers to those aged between 15 and 65 years. Assault includes indecent assault, assault with intent to inflict grievous bodily harm and common assault. Robbery includes all fraud cases, forgeries, misappropriations, embezzlement, common robbery, car hijackings, hijacking of trucks, robbery of cash-in-transit and bank robbery. Sexual offence includes rape and attempted rape, intercourse with under-age girls, child molestation, incest and bestiality. Theft of property includes burglary to business premises, residential premises, stock theft, shoplifting, theft of motor vehicles and motorcycles. Malicious damage to property includes arson and any other crime related to the damage of property. Any other crime includes drug-related crime, driving under the influence of alcohol or drugs, illegal possession of a firearm and ammunitions, explosives and any act of public violence. Gross Enrolment Ratio (GER) is defined as the number of learners, regardless of age, enrolled in a specific school phase (e.g. secondary) as a percentage of the total appropriate school-age population (e.g. 14- to 18-year-olds for secondary). GER is used to show the level of participation in education. Fatality Case Ratio is the number of deaths reported as a percentage of total cases reported.

7
Chapter 1: Demography 1.1 Population profile Table 1.1 gives an overview of the land area, population size and population density in each province. The population figures obtained from Census 1996 and 2001 show that:
• KwaZulu-Natal had the largest population of all provinces and constituted 20,7% and 21,0% of the total South African population in 1996 and 2001 respectively.
• KwaZulu-Natal is the third smallest province in terms of area (Gauteng had the smallest area in South Africa, followed by Mpumalanga).
• KwaZulu-Natal had the second largest population density in 2001 (102 people per square kilometre), with Gauteng accounting for the largest population density (520 people per square kilometre).
Table 1.1: Area, population and population density by province, 1996 and 2001
1996 2001 Province
Area (km2) No. of people Density No. of people Density
Western Cape 129 370 3 956 875 30,6 4 524 335 35,0 Eastern Cape 169 580 6 302 525 37,2 6 436 763 38,0 Northern Cape 361 830 840 321 2,3 822 727 2,3 Free State 129 480 2 633 504 20,3 2 706 775 20,9 KwaZulu-Natal 92 100 8 417 021 91,4 9 426 017 102,3 North West 116 320 3 354 825 28,8 3 669 349 31,5 Gauteng 17 010 7 348 423 432,0 8 837 178 519,5 Mpumalanga 79 490 2 800 711 35,2 3 122 990 39,3 Limpopo 123 910 4 929 368 39,8 5 273 642 42,6 South Africa 1 219 090 40 583 573 33,3 44 819 778 36,8 Population density = Number of people per square kilometre Source: Statistics South Africa, Population Census 1996 and 2001 Figure 1.1 shows the proportion of the land area of South Africa that falls in each province. Again it can be seen that for the most populous province, KwaZulu-Natal covers a relatively small proportion of the country.

8
Figure 1.1: Distribution of land area by province, South Africa, 2001 Limpopo
10,2%
Mpumalanga 6,5%
Gauteng 1,4%
North West 9,5%
KwaZulu-Natal 7,6%
Free State 10,6%
Northern Cape29,7%
Eastern Cape 13,9%
Western Cape10,6%
Source: Statistics South Africa, Population Census 2001 Figure 1.2 compares the population density of each province in 1996 and 2001. After Gauteng, the greatest increase in density was in KwaZulu-Natal. Figure 1.2: Population density by province, South Africa, 1996 and 2001
WesternCape
EasternCape
NorthernCape
FreeState
KwaZulu-Natal
NorthWest
Gauteng Mpuma-langa
Limpopo SouthAfr ic a
0,0
100,0
200,0
300,0
400,0
500,0
600,0
1996 30,6 37,2 2,3 20,3 91,4 28,8 432,0 35,2 39,8 33,32001 35,0 38,0 2,3 20,9 102,3 31,5 519,5 39,3 42,6 36,8
Source: Statistics South Africa, Population Census 2001
9
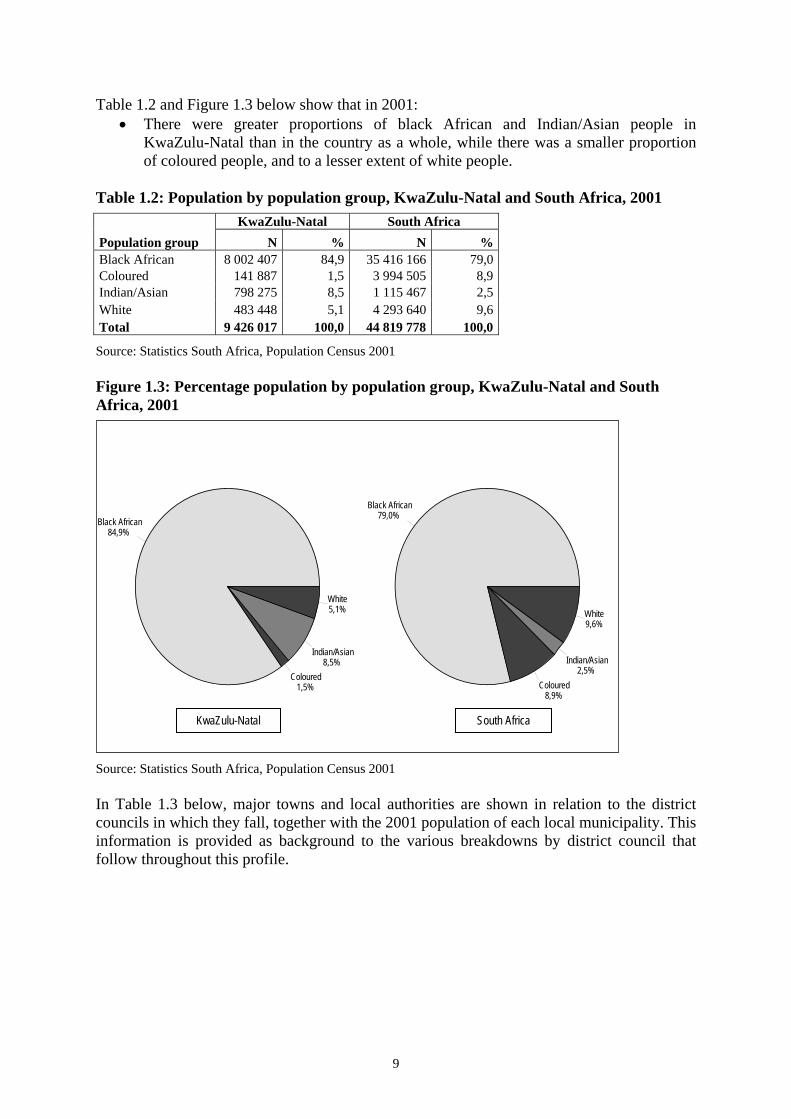
Table 1.2 and Figure 1.3 below show that in 2001: • There were greater proportions of black African and Indian/Asian people in
KwaZulu-Natal than in the country as a whole, while there was a smaller proportion of coloured people, and to a lesser extent of white people.
Table 1.2: Population by population group, KwaZulu-Natal and South Africa, 2001 KwaZulu-Natal South Africa Population group N % N % Black African 8 002 407 84,9 35 416 166 79,0 Coloured 141 887 1,5 3 994 505 8,9 Indian/Asian 798 275 8,5 1 115 467 2,5 White 483 448 5,1 4 293 640 9,6 Total 9 426 017 100,0 44 819 778 100,0
Source: Statistics South Africa, Population Census 2001 Figure 1.3: Percentage population by population group, KwaZulu-Natal and South Africa, 2001
Source: Statistics South Africa, Population Census 2001 In Table 1.3 below, major towns and local authorities are shown in relation to the district councils in which they fall, together with the 2001 population of each local municipality. This information is provided as background to the various breakdowns by district council that follow throughout this profile.
Black African84,9%
Coloured 1,5%
Indian/Asian8,5%
White5,1%
Black African79,0%
Coloured 8,9%
Indian/Asian 2,5%
White9,6%
KwaZulu-Natal South Africa

10
Table 1.3: Population by district council and local municipal area, KwaZulu-Natal, 2001 District and local municipality Major towns Population eThekwini Metro 3 090 143 Durban, Amanzimtoti, Umkomaas, Umlazi, Chatsworth, Pinetown,
Hillcrest, Cato Ridge, Mpumalanga, Kwa-Mashu, Inanda, Verulam, Umhlanga, Tongaat 3 090 143
Ugu 704 053 Vulamehlo Jolivet, Indududu, Kenterton, Mkhunya 83 047 Umdoni Scottburgh, Umzinto, Pennington, Mtwalume, Sezela 62 293 Umzumbe Pungatshe, Mnamfu, Umgai, Nyavini 193 756 uMuziwabantu Harding, Weza, Nhlangwini 92 328 Ezingolweni Ezingolweni, Moguntia 54 427 Hibiscus Coast Port Shepstone, Hibberdene, Port Edward, Impenjati, Umtamvuna 218 172 uMgungundlovu 927 841 uMshwathi Wartburg, New Hanover, Cool Air, Dalton, Mpolweni, Cramond 8 030 Umngeni Howick, Lidgetton, Lions River, Dargle, Hilton, Merrivale 73 895 Mooi Mpofana Mooi River, Bruntville, Rosetta, Hidcote 36 826 Impendle Impendle, Nzinga, Mzumbe, Cibelichle 33 557 Msunduzi Pietermaritzburg, Sweetwaters, Edendale, Bishopstowe, Raisethorpe 553 223 Mkhambathini Camperdown, Umlaas Road, Table Mountain, Eston 59 060 Richmond Richmond, Thornville, Bryne, Baynesfield, KwaMagoda, Ndaleni 63 222 Kamberg 12 Uthukela 656 972 Emnambithi Ladysmith, Colenso, Van Reenen, Driefontein, Ezakheni, Steadville 225 452 Indaka Valkop, Uitval, Kliprivier, Ekuvukeni 113 643 Umtshezi Estcourt, Weenen, Frere, Wembezi 59 925 Okhahlamba Winterton, Mkukwini, Geluksburg, Zwelisha, Bergville 137 515 Imbabazane Draycott, KwaMankonjane, Mahlutshini, Loskop, Maqabaqabeni 119 914 Cathedral Peak 515 Umzinyathi 456 458 Endumeni Dundee, Witbank, Sbongile, Wasbank, Glencoe, Thembalihle 51 105 Nqutu Nqutu, Nondweni, Ndlovana, Mpukunyoni 145 036 Msinga Tugela Ferry, Pomeroy, Mhlumeni, Rorke’s Drift 168 037 Umvoti Kranskop, Greytown, Hermansberg, Muden, Nhlalahle, Ntunjambili 92 290 Amajuba 468 036 Newcastle Newcastle, Charlestown, Osizweni, Madadeni, Chelmsford 332 980 Utrecht Utrecht, Swaartkop, Klipspruit, Bloodriver 32 286 Dannhauser Dannhauser, Hattingspruit, Normandien 102 771 Zululand 804 453 eDumbe Paulpietersburg, Frischgewaagd, Waterloo, Dumbe, Simlangetsha 82 230 uPhongolo Pongola, Golela, Magudu, Vusumuzi, Mvutshini 119 782 Abaqulusi Vryheid, Louwsburg, Clifton, Ekuthuthukeni 191 016 Nongoma Nongoma, Ezilonyeni, Mvulazi, Mahashini, Sidinsi, Bhekumthetho 198 435 Ulundi Ulundi, Kwambambo, Mahlabathini, Dingaanstat, Nkonjeni, Dlebe 212 971 Umkhanyakude 573 331 Umhlabuyalingana Phelandaba, KwaNgwanase, Nhlazana, Tshongwe 140 940 Jozini KwaNdongeni, Ingwavuma, Jozini, Ubombo, Mkhuze, Tendeka 184 083 The Big 5 False Bay Hluhluwe, Dukumbane 31 098 Hlabisa Mpembeni, Hlabisa 176 894

11
Table 1.3: Population by district council and local municipal area, KwaZulu-Natal, 2001 (concluded) District and local municipality
Major towns
Population
Mtubatuba KwaMsane, Mtubatuba 35 215 St Lucia Park Masundwini, Kosi Bay, St Lucia 5 086 Uthungulu 885 959 Mbonambi KwaMbonambi, Cwaka 106 945 uMhlatuze Richards Bay, Empangeni, Ongoye, Esikhawini, Kwadlangezwa 289 192 Ntambanana Qude, Nomponjwana 84 764 uMlalazi Eshowe, Gingindlovu, Mtunzini 221 067 Mthonjaneni Melmoth, Ekuthuleni, KwaMagwaza 50 381 Nkandla Babanango, Nkandla, Vumanhlamvu 133 586 iLembe 560 383 eNdodakusuka Mandeni, Dunn's Reserve, Sundumbili, Tugela Mouth 128 672 KwaDukuza Zinkwazi, Stanger, Shakaskraal, Salt Rock, Ballito 158 586 Ndwedwe Ndwedwe, Glendale Heights 152 482 Maphumulo Maphumulo 120 637 Sisonke 298 387 Ingwe Creighton, Donnybrook, Ncwadi, Nqumeni 107 554 Kwa Sani Underberg, Himeville, Bushmans Nek, Okhalweni 15 308 Matatiele Matatiele, Cedarberg, Itsokolele 16 216 Greater Kokstad Kokstad, Franklin, Swartberg, Bhongweni 56 528 Ubuhlebezwe Ixopo, Highflats, Umgodi 101 946 Sani Pass, Cobham 809 Grand total: KwaZulu-Natal 9 426 017
Source: Statistics South Africa, Population Census 2001 Table 1.4 and Figure 1.4 show the distribution of the population by district council and population group in KwaZulu-Natal in 2001. These show that:
• Black Africans constituted the vast majority of the population in all district councils (i.e. in nine out of eleven district councils they comprised more than 90% of the population).
• In eThekwini, black Africans constituted only 68,3% of the population, with correspondingly larger percentages of Indians/Asians and white people than in other district councils.

12
Table 1.4: Population by district council and population group, KwaZulu-Natal, 2001
District council Black
African
% Coloured % Indian/
Asian % White
% Total % Ugu 646 012 8,1 5 221 3,7 24 057 3,0 28 740 5,9 704 030 7,5 uMgungundlovu 767 149 9,6 20 503 14,5 73 084 9,2 67 110 13,9 927 846 9,9 Uthukela 620 733 7,8 4 055 2,9 17 155 2,1 15 042 3,1 656 985 7,0 Umzinyathi 439 884 5,5 2 635 1,9 6 605 0,8 7 330 1,5 456 454 4,8 Amajuba 431 600 5,4 3 039 2,1 11 926 1,5 21 472 4,4 468 036 5,0 Zululand 788 553 9,9 1 520 1,1 608 0,1 13 772 2,8 804 454 8,5 Umkhanyakude 568 859 7,1 877 0,6 370 0,0 3 235 0,7 573 341 6,1 Uthungulu 838 745 10,5 4 093 2,9 11 192 1,4 31 936 6,6 885 965 9,4 iLembe 509 949 6,4 2 585 1,8 37 458 4,7 10 397 2,2 560 389 5,9 Sisonke 280 341 3,5 10 084 7,1 984 0,1 6 985 1,4 298 394 3,2 eThekwini 2 110 581 26,4 87 277 61,5 614 835 77,0 277 428 57,4 3 090 122 32,8 KwaZulu-Natal 8 002 406 100,0 141 889 100,0 798 274 100,0 483 447 100,0 9 426 016 100,0
Source: Statistics South Africa, Population Census 2001 Figure 1.4: Percentage population by district council and population group, KwaZulu-Natal, 2001
Ugu uMgungundndlovu
Uthukela Umzinyathi
Amajuba Zululand
Umkhanyakude Umthungulu
iLembe Sisonke
eThekwini 0,0% 20,0% 40,0% 60,0% 80,0% 100,0%
Black African Coloured Indian/Asian White Source: Statistics South Africa, Population Census 2001
1.2 Sex ratios Table 1.5 and Figure 1.5 below show the population of each province by sex in 1996 and 2001. Gender ratios (i.e. the number of men per 100 women) are also shown.
• In all provinces except Gauteng, sex ratios were less than 100, implying that the proportion of males was lower than that of females. Gauteng had a sex ratio of 104,3 in 1996, and of 101,2 in 2001.
• KwaZulu-Natal had the third lowest sex ratio of 88,4 in 1996, and 87,9 in 2001.

13
• The province with the lowest sex ratios in 1996 and 2001 was Limpopo (84,2 and 83,2 respectively), followed by Eastern Cape with a sex ratio of 85,7 for both years. These figures imply that large proportions of males had immigrated to other provinces or died.
Table 1.5: Population by province, sex and sex ratio, South Africa, 1996 and 2001 1996 2001
Province
Male Female Total Sex
ratio Male
Female Total Sex
ratio Western Cape 1 935 494 2 021 381 3 956 875 95,8 2 192 321 2 332 014 4 524 335 94,0 Eastern Cape 2 908 056 3 394 469 6 302 525 85,7 2 975 512 3 461 251 6 436 763 86,0 Northern Cape 412 681 427 639 840 320 96,5 401 168 421 559 822 727 95,2 Free State 1 298 348 1 335 156 2 633 504 97,2 1 297 605 1 409 170 2 706 775 92,1 KwaZulu- Natal 3 950 527 4 466 493 8 417 020 88,4 4 409 091 5 016 925 9 426 017 87,9 North West 1 649 835 1 704 990 3 354 825 96,8 1 821 547 1 847 803 3 669 349 98,6 Gauteng 3 750 845 3 597 578 7 348 423 104,3 4 444 679 4 392 499 8 837 178 101,2 Mpumalanga 1 362 028 1 438 683 2 800 711 94,7 1 497 333 1 625 658 3 122 990 92,1 Limpopo 2 253 072 2 676 296 4 929 368 84,2 2 394 785 2 878 857 5 273 642 83,2 South Africa 19 520 886 21 062 685 40 583 571 92,7 21 434 041 23 385 736 44 819 776 91,7
Source: Statistics South Africa, Population Census 2001 Figure 1.5: Sex ratio by province, South Africa, 1996 and 2001
WesternCape
EasternCape
NorthernCape
FreeState
KwaZulu-Natal
NorthW est
Gauteng Mpuma-langa
Lim popo SouthAfrica
0,0
20,0
40,0
60,0
80,0
100,0
120,0Sex ratio
1996 95,8 85,7 96,5 97,2 88,4 96,8 104,3 94,7 84,2 92,72001 94,0 85,7 95,2 92,1 87,9 98,6 101,2 92,1 83,2 91,7
Source: Statistics South Africa, Population Census 2001

14
Table 1.6 and Figure 1.6 below compare sex ratios among district councils in KwaZulu-Natal in 2001.
• eThekwini and Amajuba were the only two district councils with sex ratios greater than 90 (92,5 and 91,9 respectively).
• Umzinyathi had the lowest sex ratio of 78,5. • This implies a large disproportion of women to men.
Table 1.6: Sex ratio by district council, KwaZulu-Natal, 2001 District council
Male Female Total Sex ratio
Ugu 320 345 383 685 704 030 83,5 uMgungundlovu 438 350 489 496 927 846 89,6 Uthukela 301 820 355 164 656 985 85,0 Umzinyathi 200 784 255 670 456 454 78,5 Amajuba 224 154 243 882 468 036 91,9 Zululand 370 208 434 246 804 454 85,3 Umkhanyakude 259 389 313 952 573 341 82,6 Uthungulu 409 781 476 184 885 965 86,1 iLembe 260 828 299 561 560 389 87,1 Sisonke 138 393 160 001 298 394 86,5 eThekwini 1 485 038 1 605 084 3 090 122 92,5 KwaZulu-Natal 4 409 090 5 016 925 9 426 016 87,9
Source: Statistics South Africa, Population Census 2001 Figure 1.6: Sex ratio in each district council, KwaZulu-Natal, 2001
83,5
89,685
78,5
91,9
85,282,6
86,1 87,1 86,5
92,587,9
Ugu uMgung-gundlovu
Uthukela Umzin-yathi
Amajuba Zululand Umkhanya-kude
Uthungulu iLembe Sisonke eThekw ini KwaZulu-Natal
0
20
40
60
80
100
Source: Statistics South Africa, Population Census 2001

15
Age distribution Figure 1.7 below shows the 1996 and 2001 populations of KwaZulu-Natal by five-year age group. Each five-year group in 2001 corresponds to the group 5 years younger in 1996.
• In both 1996 and 2001, the highest proportions of residents were between the ages of 0 and 19 years.
• There was a decrease in the percentage of children aged between 0 and 9 years from 1996 to 2001.
The general shape of the pyramid shows that populations for both years were young, since high proportions were found in the younger age groups. The shape of the pyramid is therefore broad-based, and tapers with increasing ages to the apex. This shape is typical of a developing country. Figure 1.7: Population by age group, KwaZulu-Natal, 1996 and 2001
0,3
0,4
0,8
1,1
1,9 2,1
2,5 3,0
4,0 4,9
6,0 7,0
8,1 10,1
10,9 12,1 12,0
11,5
0,3
0,5
0,8
1,4
1,6
2,3
2,6
3,5
4,2
5,2
6,2
6,7
8,4
9,6
12,0 12,1
11,9 10,7
85+ 80-84 75-79 70-74 65-69 60-64 55-59 50-54 45-49 40-44 35-39 30-34 25-29 20-24 15-19 10-14
5-9 0-4
Age
0.02,0 4,0 6,0 8,0 10,0 12,0 14,0 1996
0,0 2,0 4,0 6,0 8,0 10,0 12,0 14,0 2001
Source: Statistics South Africa, Population Census 1996 and 2001 Figure 1.8 below shows the populations of KwaZulu-Natal and South Africa in 2001. The following comparisons are made:
• KwaZulu-Natal had higher proportions than South Africa in the 0–19 age groups. • In all the age groups from 25–69 years, the KwaZulu-Natal proportions were lower
than the South Africa proportions. • This partly reflects greater than national proportions of deaths and migration in these
age groups.

16
Figure 1.8: Population by age group, KwaZulu-Natal and South Africa, 2001
Source: Statistics South Africa, Population Census 2001 Figure 1.9 below shows the population of KwaZulu-Natal in 2001 by age and sex. The following is observed:
• There were more females than males in KwaZulu-Natal, notably between the ages of 30 and 69 years.
• The highest proportion of females could be found between the ages of 15 and 19, whereas the highest proportion of males was found between the ages of 10 and 14.
• There were more males than females between the ages of 0 and 24. • There were equal proportions of males and females between the ages of 25 and 29.
0,3
0,5
0,8
1,4
1,6
2,3 2,6
3,5 4,2
5,2 6,2
6,7 8,4
9,6 12,0 12,1 11,9
10,7
0,4
0,6
0,8
1,4
1,8
2,4
2,7
3,7
4,7
5,8
6,9
7,5
8,8
9,6
11,1 11,3
10,8 9,9
85+80-8475-7970-7465-6960-6455-5950-5445-4940-4435-3930-3425-2920-2415-1910-14
5-90-4
Age
0.02,04,06,08,010,012,014,0
% KwaZulu-Natal 0,0 2,0 4,0 6,0 8,0 10,0 12,0 14,0
% South Africa

17
Figure 1.9: Population by age group and sex, KwaZulu-Natal, 2001
Note: In the above graph the percentages total 100% for the entire population, not for male and female separately as in the 1996 pyramids previously published by Stats SA Source: Statistics South Africa, Population Census 2001 Table 1.7 and Figures 1.10, 1.11, 1.12 and 1.13 below show the population of KwaZulu-Natal by age, sex and population group, 2001. The following comparisons are made:
• The highest proportions of both males and females were in the 10–14 age group in the case of the black African population. In the case of the coloured and Indian/Asian population groups the highest proportion was found in the age group 15–19 for both males and females. In the case of the white male population group, the highest proportion was also in the 15–19 age group, but in the case of the white female population group, the highest proportion was in the age group 40–44 years.
• Whereas 67,9% of the black African population was between 0 and 29 years old, the proportion in this range falls to 58,5% for coloured residents, 51,3% for Indian/Asian residents, and as low as 38,4% for white residents.
• The pyramid structure of the Indian/Asian and white population groups is different from the other groups. Whereas the pyramid structure of the black African and coloured population groups is broad-based and rapidly tapering with increasing age, the Indian/Asian and white pyramids taper less rapidly with increasing age and resembles that of a developed country.
0,1
0,2
0,3
0,5
0,6
0,9
1,1 1,6 1,9
2,3 2,7
3,0 3,9
4,6 5,9
6,0 5,9
5,4
0,2
0,4
0,5
0,9
1,1
1,4
1,4
1,9
2,3
2,9
3,5
3,7
4,5
5,0
6,1 6,1
5,9 5,4
85+
80-84 75-79 70-74 65-69 60-64 55-59 50-54 45-49 40-44 35-39 30-34 25-29 20-24 15-19 10-14
5-9 0-4
Age
0.01,02,03,04,05,06,07,0
% Male
0,0 1,0 2,0 3,0 4,0 5,0 6,0 7,0
% Female

18
Table 1.7: Age distribution by population group and sex, KwaZulu-Natal, 2001 Black African Coloured Indian/Asian White Age group Male Female Male Female Male Female Male Female 0-4 461 015 463 343 6 309 6 471 25 539 24 968 12 783 12 222 5-9 504 586 506 285 7 059 6 983 31 969 31 925 14 569 13 635 10-14 507 192 512 016 7 503 7 441 37 146 36 254 17 434 16 336 15-19 482 734 508 379 7 606 7 755 41 174 40 281 19 941 18 625 20-24 375 887 416 693 6 302 6 721 35 392 34 907 14 922 14 399 25-29 315 627 363 241 6 093 6 273 33 866 34 913 14 900 15 910 30-34 233 401 288 717 5 351 6 029 31 279 33 670 16 917 17 766 35-39 204 995 270 130 5 015 5 812 30 221 33 859 17 339 18 403 40-44 166 635 218 575 4 382 5 169 27 549 30 904 18 352 19 743 45-49 132 013 170 354 3 306 4 209 24 401 28 462 16 153 17 124 50-54 108 154 138 518 2 558 3 323 22 159 24 623 16 348 17 205 55-59 71 205 99 118 1 870 2 317 17 216 19 598 14 581 15 011 60-64 58 285 100 797 1 487 2 121 11 866 15 341 12 407 13 234 65-69 36 258 77 265 1 078 1 588 7 521 10 193 9 950 10 949 70-74 29 683 71 106 691 1 188 4 636 6 519 8 069 9 886 75-79 16 451 35 285 325 719 2 331 3 555 5 700 8 136 80-84 11 225 26 996 141 387 1 072 1 673 3 277 5 547 85+ 5 456 14 789 74 232 464 828 1 697 3 978 Total 3 720 800 4 281 607 67 149 74 738 385 803 412 472 235 339 248 108
Source: Statistics South Africa, Population Census 2001 Figure 1.10: Distribution of the black African population by age group and sex, KwaZulu-Natal, 2001
0,1
0,3
0,4
0,8
1,0
1,6 1,9
2,9 3,5
4,5 5,5
6,3 8,5
10,1 13,0
13,6 13,6
12,4
0,3
0,6
0,8
1,7
1,8
2,4
2,3
3,2
4,0
5,1
6,3
6,7
8,5
9,7
11,9 12,0
11,8 10,8
85+ 80-84 75-79 70-74 65-69 60-64 55-59 50-54 45-49 40-44 35-39 30-34 25-29 20-24 15-19 10-14
5-9 0-4
Age group in years
0.02,04,0 6,0 8,0 10,0 12,0 14,0 16,0 % Male
0,0 2,0 4,0 6,0 8,0 10,0 12,0 14,0 % Female
Source: Statistics South Africa, Population Census 2001

19
Figure 1.11: Distribution of the coloured population by age group and sex, KwaZulu-Natal, 2001
0,1
0,2
0,5
1,0
1,6 2,2
2,8 3,8
4,9 6,5
7,5 8,0
9,1 9,4
11,3 11,2
10,5 9,4
0,3
0,5
1,0
1,6
2,1
2,8
3,1
4,4
5,6
6,9
7,8
8,1
8,4
9,0
10,4 10,0
9,3
8,7
85+ 80-84 75-79 70-74 65-69 60-64 55-59 50-54 45-49 40-44 35-39 30-34 25-29 20-24 15-19 10-14
5-9 0-4
Age group in years
0.02,0 4,0 6,0 8,0 10,0 12,0 14,0 % Male
0,0 2,0 4,0 6,0 8,0 10,0 12,0 % Female
Source: Statistics South Africa, Population Census 2001 Figure 1.12: Distribution of the Indian/Asian population by age group and sex, KwaZulu-Natal, 2001
0,1
0,3
0,6
1,2 1,9
3,1 4,5
5,7
6,3 7,1
7,8 8,1
8,8 9,2
10,7 9,6
8,3 6,6
0,2
0,4
0,9
1,6
2,5
3,7
4,8
6,0
6,9
7,5
8,2
8,2
8,5
8,5
9,8
8,8
7,7
6,1
85+ 80-84 75-79 70-74 65-69 60-64 55-59 50-54 45-49 40-44 35-39 30-34 25-29 20-24 15-19 10-14
5-9 0-4
Age group in years
0.02,0 4,0 6,0 8,0 10,0 12,0 % Male
0,0 2,0 4,0 6,0 8,0 10,0 12,0 % Female
Source: Statistics South Africa, Population Census 2001

20
Figure 1.13: Distribution of the white population by age and sex, KwaZulu-Natal, 2001
0,7
1,4 2,4
3,4 4,2
5,3 6,2
6,9 6,9
7,8 7,4
7,2 6,3 6,3
8,5 7,4
6,2 5,4
1,6
2,2
3,3
4,0
4,4
5,3
6,1
6,9
6,9
8,0
7,4
7,2
6,4
5,8
7,5
6,6
5,5
4,9
85+ 80-84 75-79 70-74 65-69 60-64 55-59 50-54 45-49 40-44 35-39 30-34 25-29 20-24 15-19 10-14
5-9 0-4
Age group in years
0.02,0 4,0 6,0 8,0 10,0 % Male
0,0 2,0 4,0 6,0 8,0 10,0 % Female
Source: Statistics South Africa, Population Census 2001 Table 1.8 shows that:
• eThekwini had the highest percentage of both males and females (33,7% and 32,0% respectively).
• The majority of the district councils had higher percentages of females than males, except for eThekwini, uMgungundlovu and Amajuba, where the percentage of males was slightly higher than that of females.
Table 1.8: Population by district council and sex, KwaZulu-Natal, 2001 Male Female District council N % N % Ugu 320 345 7,3 383 685 7,6 uMgungundlovu 438 350 9,9 489 496 9,8 Uthukela 301 820 6,8 355 164 7,1 Umzinyathi 200 784 4,6 255 670 5,1 Amajuba 224 154 5,1 243 882 4,9 Zululand 370 208 8,4 434 246 8,7 Umkhanyakude 259 389 5,9 313 952 6,3 Uthungulu 409 781 9,3 476 184 9,5 iLembe 260 828 5,9 299 561 6,0 Sisonke 138 393 3,1 160 001 3,2 eThekwini 1 485 038 33,7 1 605 084 32,0 Total 4 409 090 100,0 5 016 925 100,0
Source: Statistics South Africa, Population Census 2001

21
1.4 Language In this section we report on language. It must be remembered that the language reported is the language ‘most commonly spoken at home’. In Table 1.9 it can be seen that:
• IsiZulu ranked first in KwaZulu-Natal and nationally, being spoken most commonly at home by 80,9% of the KwaZulu-Natal population and 23,8% of the population of South Africa.
• English was the second most common home language in KwaZulu-Natal (13,6%) in 2001, followed by isiXhosa, while isiXhosa was the second most common home language nationally.
• The least spoken languages in KwaZulu-Natal in 2001 were Tshivenda and Xitsonga (both below 0,1%), while the least spoken language nationally was isiNdebele, with just 1,6% of the total South African population who were speaking it in 2001.
Table 1.9: Population by home language, KwaZulu-Natal and South Africa, 2001 KwaZulu-Natal South Africa Language N % N % Afrikaans 140 833 1,5 5 983 426 13,3 English 1 285 011 13,6 3 673 203 8,2 IsiNdebele 18 570 0,2 711 821 1,6 IsiXhosa 219 826 2,3 7 907 153 17,6 IsiZulu 7 624 284 80,9 10 677 305 23,8 Sepedi 10 844 0,1 4 208 980 9,4 Sesotho 66 925 0,7 3 555 186 7,9 Setswana 5 195 0,1 3 677 016 8,2 Siswati 12 792 0,1 1 194 430 2,7 Tshivenda 1 215 0,0 1 021 757 2,3 Xitsonga 3 289 0,0 1 992 207 4,4 Other 37 232 0,4 217 293 0,5 Total 9 426 017 100,0 44 819 778 100,0
Source: Statistics South Africa, Population Census 2001

22
Figure 1.14 shows these proportions graphically. Figure 1.14: Percentage distribution of the population by home language, KwaZulu-Natal and South Africa, 2001
Afrikaans English IsiNdebele IsiXhosa IsiZulu Sepedi Sesotho Setsw ana SiSw ati Tshivenda Xitsonga Other0,0
10,0
20,0
30,0
40,0
50,0
60,0
70,0
80,0
90,0%
Kw aZulu-Natal 1,5 13,6 0,2 2,3 80,9 0,1 0,7 0,1 0,1 0,0 0,0 0,4South Africa 13,3 8,2 1,6 17,6 23,8 9,4 7,9 8,2 2,7 2,3 4,4 0,5
Source: Statistics South Africa, Population Census 2001 Table 1.10 below gives the breakdown of language by population group:
• IsiZulu was the most common home language among black Africans, followed by isiXhosa; while English was the most common home language among all the other population groups, followed by Afrikaans in the case of coloured and white people, and by other languages in the case of the Indian/Asian group.
Table 1.10: Population by home language and population group, KwaZulu-Natal, 2001
Language Black
African Coloured Indian/
Asian White Total Afrikaans 12 241 9 618 2 667 116 307 140 833 English 38 016 124 552 764 476 357 967 1 285 011 IsiNdebele 14 822 544 2 701 503 18 570 IsiXhosa 218 513 387 271 654 219 825 IsiZulu 7 613 730 6 341 2 132 2 081 7 624 284 Sepedi 10 663 48 81 52 10 844 Sesotho 66 696 75 52 102 66 925 Setswana 4 893 68 127 107 5 195 Siswati 12 566 39 97 90 12 792 Tshivenda 1 157 3 33 24 1 217 Xitsonga 3 165 11 30 83 3 289 Other 5 943 201 25 609 5 479 37 232 Total 8 002 405 141 887 798 276 483 449 9 426 017
Source: Statistics South Africa, Population Census 2001

23
1.5 Religion Table 1.11 below shows the population of KwaZulu-Natal by population group and religion. The following observations are made:
• The largest single affiliation was with the Zion Christian Church (1 179 610 people, most of whom were black Africans).
• The Roman Catholic Church was the second biggest church in KwaZulu-Natal with 925 490 members.
• Most coloured people belonged to the Roman Catholic Church (49 195), followed by other Christian churches and the Anglican Church.
• Most Indians/Asians belonged to Hinduism, followed by the Muslim faith and ‘other Christian churches’.
• A large proportion of the population indicated that they did not belong to any religion (1 772 534).
• Most white people fell into the categories ‘other Christian churches’, Methodist, ‘no religion’, Dutch Reformed, Roman Catholic and Anglican.
Table 1.11: Population by religion and population group, KwaZulu-Natal, 2001
Religion Black
African Coloured Indian/
Asian
White
Total Dutch Reformed Church 84 820 1 318 519 59 789 146 446 Reformed churches 710 23 110 1 381 2 224 Nederduits Hervormde Kerk 898 15 34 1 976 2 923 Anglican Church 146 538 13 983 2 049 43 842 206 412 Church of England in SA 41 320 185 69 11 239 52 813 International Fellowship of Christian churches (Rhema, etc.) 3 071 415 773 670 4 929 Methodist churches of SA 351 570 4 458 1 756 68 174 425 958 Presbyterian churches 93 204 430 498 14 220 108 352 United Congregational Church of SA 78 029 308 154 269 78 760 Lutheran Church of Southern Africa 265 731 1 077 282 5 350 272 440 Roman Catholic Church 819 102 49 195 9 973 47 220 925 490 Apostolic Faith Mission of SA 26 626 275 942 6 140 33 983 Other Apostolic churches 771 331 6 914 9 728 14 913 802 886 Baptist churches of Southern Africa 41 271 820 3 391 12 329 57 811 Pinkster Protestante Kerk 384 29 211 721 1 345 Afrikaanse Protestante Kerk 48 - - 398 446 Full Gospel Church of God in Southern Africa 25 065 2 823 29 398 8 640 65 926 Orthodox churches - - - - - Church of Christ of Latter Day Saints 1 668 56 139 515 2 378 Pentecostal churches 3 380 53 449 45 3 927 Salvation Army United Church 22 140 143 195 334 22 812 Seventh-Day Adventist Church 19 519 915 632 1 062 22 128 New Apostolic Church 614 28 5 91 738 Assemblies of God of SA 48 375 1 820 534 1 975 52 704 St Engenas Zion Christian Church 958 18 90 85 1 151 Zion Christian Church 1 176 599 1 169 1 074 768 1 179 610 Bandla Lama Nazaretha 111 897 141 265 205 112 508 African Methodist Episcopal Church 6 194 26 - 23 6 243 St John's Apostolic Church 78 840 162 286 272 79 560 International Pentecost Church 5 265 30 75 67 5 437 Other African Independent churches 120 737 685 2 256 2 518 126 196 Other Christian Churches 349 473 16 468 105 445 75 489 546 875

24
Table 1.11: Population by religion and population group, KwaZulu-Natal, 2001 (concluded)
Religion Black
African Coloured Indian/
Asian White Total African Traditional Belief 20 907 28 9 15 20 959 Jewish Faith/Hebrew 946 40 313 2 964 4 263 Buddhism 93 8 365 396 862 Taoist 21 - - 6 27 Confucian 89 - 4 19 112 Hinduism 5 184 3 310 443 987 749 453 230 Muslim Faith 17 856 6 143 117 424 1 036 142 459 Bahais 77 7 3 35 122 Other non-Christian churches - - - - - New Age 43 195 1 509 1 903 4 187 50 794 Other non-Christian religions 1 469 4 53 360 1 886 Other Methodist churches 21 927 76 126 242 22 371 Other Presbyterian churches 15 195 12 22 63 15 292 Other Congregational churches 54 696 1 225 196 2 006 58 123 Other Lutheran churches 6 581 43 185 275 7 084 Other Catholic churches 6 125 47 125 132 6 429 Other Baptist churches 227 770 232 597 686 229 285 Other Pentecostal churches 74 968 9 045 13 985 5 649 103 647 Other Orthodox churches 2 610 24 89 1 166 3 889 Other (Seventh-Day) Adventist Churches 20 685 126 414 272 21 497 Other African Apostolic churches 5 422 21 49 24 5 516 Other Assemblies 15 044 549 1 304 464 17 361 Other Zionist churches 465 655 2 258 6 689 3 604 478 206 Church of the Nazarene - - - - - Christian Scientist 584 24 95 225 928 Christian centres 36 340 2 658 9 037 4 028 52 063 Ethiopian type churches 122 403 461 800 863 124 527 Ethnic churches 71 292 144 195 256 71 887 Other Evangelical churches 223 048 2 348 9 727 3 992 239 115 Other Charismatic churches 495 47 172 683 1 397 No religion 1 696 039 5 697 12 227 58 571 1 772 534 Refused 2 812 13 148 153 3 126 Other 4 424 32 214 373 5 043 Unknown 143 080 1 772 6 486 9 231 160 569 Total 8 002 409 141 885 798 275 483 445 9 426 017
Source: Statistics South Africa, Population Census 2001
1.6 Country of birth Table 1.12 examines the region of birth of those not born in South Africa, with the population born in South Africa added for completeness. The largest number were born in SADC countries, followed by Europe, the rest of Africa, Asia, Central and South America, and then North America. The same is true for KwaZulu-Natal.
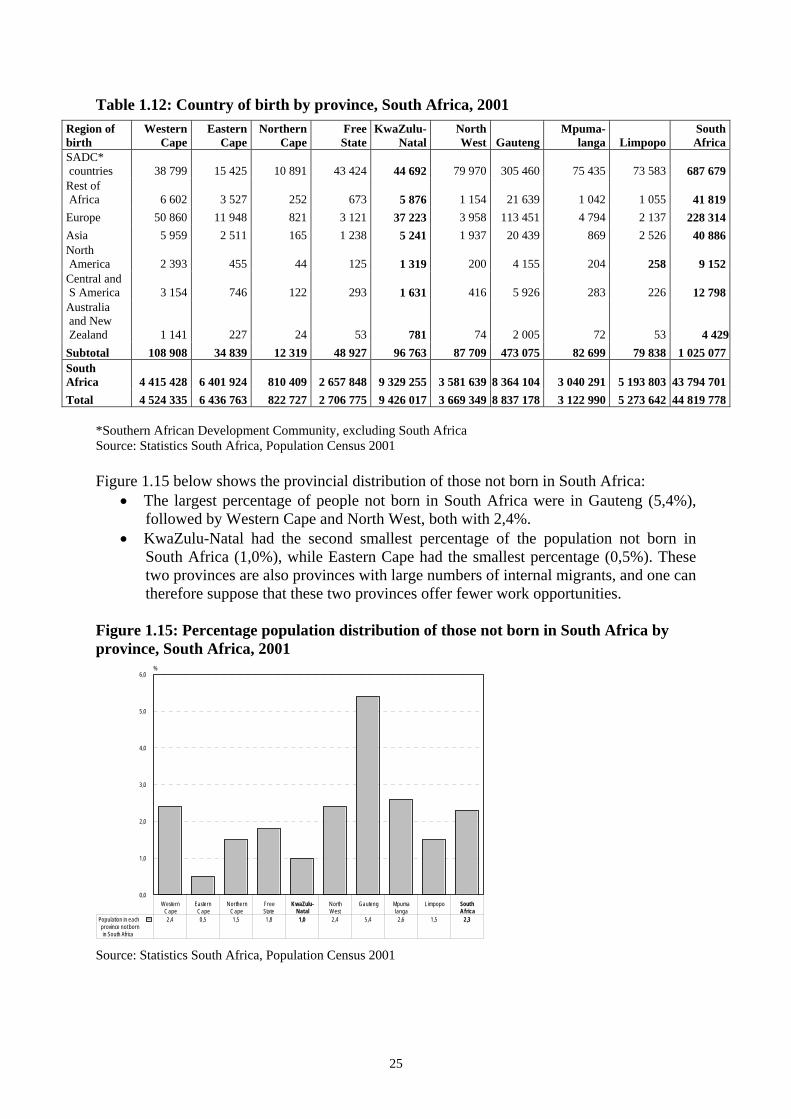
25
Table 1.12: Country of birth by province, South Africa, 2001 Region of birth
Western Cape
Eastern Cape
Northern Cape
Free State
KwaZulu- Natal
North West Gauteng
Mpuma- langa Limpopo
South Africa
SADC* countries 38 799 15 425 10 891 43 424 44 692 79 970 305 460 75 435 73 583 687 679 Rest of Africa 6 602 3 527 252 673 5 876 1 154 21 639 1 042 1 055 41 819 Europe 50 860 11 948 821 3 121 37 223 3 958 113 451 4 794 2 137 228 314 Asia 5 959 2 511 165 1 238 5 241 1 937 20 439 869 2 526 40 886 North America 2 393 455 44 125 1 319 200 4 155 204 258 9 152 Central and S America 3 154 746 122 293 1 631 416 5 926 283 226 12 798 Australia and New Zealand 1 141 227 24 53 781 74 2 005 72 53 4 429 Subtotal 108 908 34 839 12 319 48 927 96 763 87 709 473 075 82 699 79 838 1 025 077 South Africa 4 415 428 6 401 924 810 409 2 657 848 9 329 255 3 581 639 8 364 104 3 040 291 5 193 803 43 794 701 Total 4 524 335 6 436 763 822 727 2 706 775 9 426 017 3 669 349 8 837 178 3 122 990 5 273 642 44 819 778
*Southern African Development Community, excluding South Africa Source: Statistics South Africa, Population Census 2001 Figure 1.15 below shows the provincial distribution of those not born in South Africa:
• The largest percentage of people not born in South Africa were in Gauteng (5,4%), followed by Western Cape and North West, both with 2,4%.
• KwaZulu-Natal had the second smallest percentage of the population not born in South Africa (1,0%), while Eastern Cape had the smallest percentage (0,5%). These two provinces are also provinces with large numbers of internal migrants, and one can therefore suppose that these two provinces offer fewer work opportunities.
Figure 1.15: Percentage population distribution of those not born in South Africa by province, South Africa, 2001
WesternCape
EasternCape
NorthernCape
FreeState
KwaZulu-Natal
NorthWest
Gauteng Mpumalanga
Limpopo SouthAfrica
0,0
1,0
2,0
3,0
4,0
5,0
6,0%
Population in each province not born in South Africa
2,4 0,5 1,5 1,8 1,0 2,4 5,4 2,6 1,5 2,3
Source: Statistics South Africa, Population Census 2001

26
1.7 Citizenship Citizenship and country of birth are separate variables, as immigrants to South Africa may have become South African citizens. This section looks at citizenship. Table 1.13 below shows that:
• In 2001, the majority of KwaZulu-Natal population (across population groups) were South African citizens.
• Of the total population of KwaZulu-Natal in 2001, approximately 14 000 black Africans were from other SADC countries.
Table 1.13: Citizenship by population group, KwaZulu-Natal, 2001 Black African Coloured Indian/Asian White Total Citizenship N % N % N % N % N % South Africa 7 984 764 99,8 141 445 99,7 796 534 99,8 464 640 96,1 9 387 383 99,6 SADC* countries 13 733 0,2 213 0,2 193 0,0 2 448 0,5 16 587 0,2 Rest of Africa 3 125 0,0 32 0,0 64 0,0 232 0,0 3 452 0,0 Europe 298 0,0 60 0,0 100 0,0 14 336 3,0 14 793 0,2 Asia 263 0,0 44 0,0 1 371 0,2 391 0,1 2 070 0,0 North America 100 0,0 16 0,0 21 0,0 590 0,1 727 0,0 Central and South America 57
0,0 3
0,0 6
0,0 562
0,1 628 0,0
Australia and New Zealand 21
0,0 19
0,0 15
0,0 318
0,1 373 0,0
Total 8 002 362 100,0 141 832 100,0 798 303 100,0 483 517 100,0 9 426 013 100,0 *Southern African Development Community, excluding South Africa Source: Statistics South Africa, Population Census 2001
1.8 Disability Table 1.14 shows the number of people that were classified as disabled in 2001 in KwaZulu-Natal and South Africa, and the proportions suffering from each type of disability.
• The largest proportion of disabled residents in KwaZulu-Natal suffered from a physical disability, whereas most of the South African disabled population suffered from visual disabilities.
• Apart from the disabled in KwaZulu-Natal suffering from physical and visual disabilities (26,3% and 23,6% respectively), 14,2% of the disabled suffered from hearing disabilities.
• The disability that the disabled in KwaZulu-Natal suffered least from was communication disabilities.

27
Table 1.14: The disabled by type of disability, KwaZulu-Natal and South Africa, 2001 KwaZulu-Natal South Africa
Disability N % N % Sight 110 937 23,6 577 096 25,6 Hearing 67 004 14,2 313 585 13,9 Communication 17 971 3,8 75 454 3,3 Physical 123 853 26,3 557 512 24,7 Intellectual 45 451 9,7 206 451 9,2 Emotional 55 883 11,9 268 713 11,9 Multiple 49 489 10,5 257 170 11,4 Total 470 588 100,0 2 255 981 100,0 Note: For each of the specific categories, the numbers represent the people with that particular disability only People with more than one disability are only included in the category ‘multiple’ Source: Statistics South Africa, Population Census 2001 Figure 1.16 below shows disabled population by type of disability and population group in KwaZulu-Natal. The following observations are made:
• Physical disability was dominant across all population groups. It was followed by sight disability except in the case of white people where hearing disability followed.
• These were followed by hearing disability for black Africans; emotional disability for coloured people and Indians/Asians; and sight disability for white persons.
• Communication disability was the least across all population groups.
Figure 1.16: Percentage disabled population by type of disability and population group, KwaZulu-Natal, 2001
Black African Coloured Indian/Asian White Total0,0
20,0
40,0
60,0
80,0
100,0%
Multiple 10,1 10,3 11,9 15,5 10,5Emotional 12,1 15,0 11,6 7,6 11,9
Intellectual 9,4 12,4 10,3 12,3 9,7Physical 25,5 33,8 33,5 30,3 26,3
Communication 3,9 3,6 3,7 3,1 3,8Hearing 14,4 10,1 10,7 16,9 14,2
Sight 24,6 14,9 18,4 14,2 23,6
Source: Statistics South Africa, Population Census 2001

28
Figure 1.17 below shows disabled population by district council and type of disability in KwaZulu-Natal. The following observations are made:
• Physical disability was dominant in Ugu, uMgungundlovu, iLembe, Sisonke, Uthungulu, and eThekwini; whereas sight disability was dominant in Uthukela, Umzinyathi, Amajuba, Zululand and Umkhanyakude.
• Across all types of disability, eThekwini was dominant; followed by Zululand, Uthukela for sight, hearing and multiple disability; and uMgungundlovu for communication, intellectual, physical and emotional disability.
• Across all types of disability, Sisonke had the least number of disabilities, followed by Umzinyathi.
Figure 1.17: Disabled population by district council and type of disability, KwaZulu-Natal, 2001
Sight Hearing Communication Physical Intellectual Emotional Multiple0,0
5,0
10,0
15,0
20,0
25,0
30,0
Ugu 7,3 7,6 8,6 8,2 7,4 8,6 7,0uMgungundlovu 7,2 8,7 9,6 9,6 9,8 9,2 8,8
Uthukela 10,6 10,1 8,8 8,3 9,7 7,7 9,3Umzinyathi 5,8 6,1 5,3 4,7 4,8 7,2 5,9
Amajuba 7,9 5,4 5,5 6,8 4,9 7,2 5,9Zululand 13,8 15,1 13,5 10,5 11,4 11,7 13,9
Umkhanyakude 8,2 8,9 7,4 5,6 6,7 6,1 7,1Uthungulu 9,1 8,5 7,9 8,3 8,9 8,4 7,2
iLembe 6,6 5,8 6,5 6,6 5,6 6,8 7,2Sisonke 3,6 4,1 3,9 3,8 3,8 3,8 3,3
eThekw ini 19,8 19,6 23,0 27,6 26,7 24,9 25,7 Source: Statistics South Africa, Population Census 2001
1.9 Urbanisation Definitions: Urban area: An urban area is one that has been legally proclaimed as being urban. This includes towns, cities and metropolitan areas. Non-urban area: This consists of commercial farms, small settlements, rural villages and other areas that are further away from towns and cities. Table 1.15 and Figure 1.18 below show that:
• Only three district councils were primarily urban, namely eThekwini (89,3% urban), Amajuba (55,6% urban) and uMgungundlovu (53,7% urban).
• Overall, 54,0% of the provincial population lived in areas not classified as urban.

29
Table 1.15: Population of each district council by urban/rural area, KwaZulu-Natal, 2001
Urban Rural Total District council N % N % N % Ugu 93 848 13,3 610 182 86,7 704 030 100,0 uMgungundlovu 498 155 53,7 429 692 46,3 927 847 100,0 Uthukela 180 138 27,4 476 847 72,6 656 985 100,0 Umzinyathi 76 186 16,7 380 268 83,3 456 454 100,0 Amajuba 260 461 55,6 207 575 44,4 468 036 100,0 Zululand 107 527 13,4 696 927 86,6 804 454 100,0 Umkhanyakude 21 648 3,8 551 693 96,2 573 341 100,0 Uthungulu 130 260 14,7 755 705 85,3 885 965 100,0 iLembe 151 349 27,0 409 039 73,0 560 388 100,0 Sisonke 54 714 18,3 243 680 81,7 298 394 100,0 eThekwini 2 760 365 89,3 329 757 10,7 3 090 122 100,0 Total 4 334 651 46,0 5 091 365 54,0 9 426 017 100,0
Source: Statistics South Africa, Population Census 2001 Figure 1.18: Percentage population by district council and settlement, KwaZulu-Natal, 2001
Ugu uMgung- undlovu
Uthukela
Umzin- yathi
Amajuba
Zululand Umkhan- yakude
Umthun- gulu
iLembe Sisonke
eThekwini
0
20
40
60
80
100
%
Urban 13,3 537 27,4 16,7 55,6 13,4 3,8 14,7 27 18,3 89,3 Rural 86,7 46,3 72,6 83,3 44,4 86,6 96,2 85,3 73,0 81,7 10,7
Source: Statistics South Africa, Population Census 2001

30
Chapter 2: Vital statistics Vital statistics cover births, deaths, marriages and divorces.
2.1 Births The total number of live birth registrations for any given year comprises both current registrations (for births registered in the year of birth) and late registrations (for births registered later than the year of birth). According to Figure 2.1 below, the total number of births registered in South Africa in 2004 was 1 475 809. Of this total number, 328 650 occurred in KwaZulu-Natal. It is further observed that, in terms of registration numbers:
• The largest total number of births was registered in KwaZulu-Natal, followed by Eastern Cape, Gauteng and Limpopo.
• The largest number of current registrations occurred in Gauteng followed by KwaZulu-Natal, Eastern Cape and Limpopo.
• The largest number of late registrations occurred in Eastern Cape followed by KwaZulu-Natal, Limpopo and Gauteng.
Figure 2.1: Registration of annual live births by province in South Africa, 2004
WesternCape
EasternCape
NorthernCape
Free State KwaZulu-Natal
North West Gauteng Mpumalanga Limpopo SouthAfrica
0
200 000
400 000
600 000
800 000
1 000 000
1 200 000
1 400 000
Thousands
Current 80 969 99 672 15 741 44 248 135 469 55 641 149 792 53 715 91 314 728 283Late 26 934 204 602 6 462 29 632 193 181 48 829 69 127 64 597 99 811 747 526
T otal 107 903 304 274 22 203 73 880 328 651 104 469 218 919 118 312 191 124 1 475 809 Source: Statistics South Africa, Recorded live births, 2004 Figure 2.2 shows the percentages of current and late registration of births according to province. It is observed that:
• Western Cape registered the highest percentage of current births (75,0%), followed by Northern Cape (70,9%), Gauteng (68,4%), Free State (59,9%) and North West (53,3%).

31
• The rest of the provinces registered more late births than current births. Eastern Cape registered the highest proportion of late births (67,2%), followed by KwaZulu-Natal (58,8%), Mpumalanga (54,6%) and Limpopo (52,2%).
Figure 2.2: Percentage distribution of current and late registration of births by province, South Africa, 2004
WesternCape
EasternCape
NorthernCape
FreeState
KwaZulu-Natal
NorthWest
Gauteng Mpuma-langa
Limpopo SouthAfr ic a
0,0
20,0
40,0
60,0
80,0%
Current 75,0 32,8 70,9 59,9 41,2 53,3 68,4 45,4 47,8 49,3Late 25,0 67,2 29,1 40,1 58,8 46,7 31,6 54,6 52,2 50,7
Source: Statistics South Africa, Recorded live births, 2004 Table 2.1 shows registration of births by municipality in KwaZulu-Natal for 2004. The following information is observed from this table:
• Most of the district municipalities in KwaZulu-Natal recorded a higher proportion of late registrations than current registrations, except for Durban metro, Hibiscus Coast, and Vulamehlo.
• The highest number of births registered occurred in Durban metro (95 445), followed by Msunduzi (24 796), Ulundi (19 945) and then Mbonambi (19 189).
• The lowest number of births registered was at uMshwathi (99), and Impendle (201). • Mooi Mpofana was the only district where the number of late registrations and
current registrations was exactly the same (67 each).

32
Table 2.1: Annual registration of live births by municipality, KwaZulu-Natal, 2004
Magisterial district Current birth
registrations Late birth
registrations Total birth
registrations Dannhauser 86 428 514 Durban Metropolitan 48 473 46 972 95 445 eDumbe 65 319 384 Emnambithi 5 190 6 441 11 631 Endumeni 1 310 2 271 3 581 Greater Kokstad 2 281 4 419 6 700 Hibiscus Coast 5 627 4 566 10 193 Hlabisa 3 224 6 639 9 863 Impendle 32 169 201 Ingwe 103 417 520 Ixopo 2 740 4 213 6 953 KwaDukuza 2 870 2 986 5 856 Kwa Sani 87 314 401 Maphumulo 1 005 2 112 3 117 Mbonambi 9 490 9 699 19 189 Mkhambathini 638 1 699 2 337 Mooi Mpofana 67 67 134 Msinga 1 114 2 455 3 569 Msunduzi 10 702 14 094 24 796 Mthonjaneni 1 033 1 943 2 976 Ndwedwe 503 1 706 2 209 Newcastle 5 649 9 991 15 640 Nkandla 1 076 2 853 3 929 Nongoma 2 780 8 413 11 193 Nqutu 2 483 3 607 6 090 Okhahlamba 1 233 3 643 4 876 Richmond 943 2 119 3 062 Ulundi 6 002 13 943 19 945 Umhlabuyalingana 4 761 9 684 14 445 uMlalazi 3 561 5 282 8 843 uMshwathi 6 93 99 Umtshezi 2 718 6 032 8 750 uMuziwabantu 830 2 017 2 847 Umvoti 1 903 3 939 5 842 uPhongolo 1 944 5 618 7 562 Utrecht 101 258 359 Vulamehlo 2 839 1 760 4 599 KwaZulu-Natal 135 469 193 181 328 650
Source: Statistics South Africa, Recorded live births, 2004
2.2 Deaths The recorded deaths are for a given reference year during which the deaths occurred (occurrence-based perspective), irrespective of when the deaths were registered. Table 2.2 shows the distribution of recorded deaths by province in South Africa for the period 1997 to 2002. It can be observed from this table that:
• The number of deaths recorded showed an increase from 1997 to 2002 in all the provinces except in Northern Cape and Gauteng where the number of recorded deaths decreased from 1998 to 1999.

33
• The highest proportions of recorded deaths occurred in KwaZulu-Natal, followed by Gauteng and then Eastern Cape from 1997 to 2002.
Table 2.2: Number of deaths by province and year of death, 1997–2003
1997 1998 1999 2000 2001 2002 Province N % N % N % N % N % N % Western Cape 33 292 10,5 36 347 9,9 38 088 0,0 38 540 9,3 41 042 9,1 43 667 8,7 Eastern Cape 45 345 14,2 50 918 13,8 53 851 14,1 60 602 14,6 65 719 14,5 73 072 14,6 Northern Cape 8 495 2,7 9 441 2,6 9 187 2,4 9 847 2,4 10 421 2,3 11 267 2,3 Free State 25 375 8,0 30 142 8,2 31 625 8,3 34 101 8,2 36 877 8,2 40 715 8,2 KwaZulu- Natal 70 487 22,1 83 048 22,6 86 156 22,6 95 353 23,0 105 256 23,3 116 982 23,4 North West 25 026 7,9 29 458 8,0 32 395 8,5 35 437 8,6 39 723 8,8 44 269 8,9 Gauteng 67 734 21,3 75 993 20,7 75 445 19,8 80 425 19,4 86 213 19,1 95 186 19,1 Mpumalanga 20 122 6,3 23 926 6,5 25 899 6,8 28 273 6,8 31 548 7,0 35 277 7,1 Limpopo 22 338 7,0 28 302 7,7 29 135 7,6 31 263 7,6 34 901 7,7 38 639 7,7 Total 318 214 100,0 367 465 100,0 381 781 100,0 413 841 100,0 451 700 100,0 499 074 100,0
Note: Numbers for 2003 are excluded, as Stats SA has not yet received all the death notification forms for 2003 from the Department of Home Affairs Source: Statistics South Africa, Mortality and causes of death in South Africa, 1997–2003 Figure 2.3 shows the distribution of deaths by province. The data used for this information suggest that:
• While all provinces have had an increase in the number of deaths over time, the increase has been more rapid in KwaZulu-Natal. This is also the province with the largest proportion of deaths in the country, followed by Gauteng.
Figure 2.3: Distribution of deaths by province and year of death, 1997–2002
WesternCape
EasternCape
NorthernCape
FreeState
KwaZulu -Natal
NorthWest
Gauteng M pum a-langa
Lim popo0,0
5,0
10,0
15,0
20,0
25,0%
1997 10,5 14,2 2,7 8,0 22,1 7,9 21,3 6,3 7,01998 9,9 13,8 2,6 8,2 22,6 8,0 20,7 6,5 7,71999 10,0 14,1 2,4 8,3 22,6 8,5 19,8 6,8 7,62000 9,3 14,6 2,4 8,2 23,0 8,6 19,4 6,8 7,62001 9,1 14,5 2,3 8,2 23,3 8,8 19,1 7,0 7,72002 8,7 14,6 2,3 8,2 23,4 8,9 19,1 7,1 7,7
Source: Statistics South Africa, Mortality and causes of death in South Africa, 1997–2002

34
Table 2.3 shows the number of recorded deaths due to the ten leading underlying causes in KwaZulu-Natal and South Africa in 2001. It is observed that:
• The figures indicate that the numbers of deaths due to tuberculosis, influenza and pneumonia had the same rankings for both KwaZulu-Natal and South Africa.
• The lowest number of deaths in KwaZulu-Natal was caused by respiratory and
cardiovascular disorders specific to the perinatal period, while in South Africa it was caused by hypertensive disease.
Table 2.3: Deaths due to the ten leading underlying causes in KwaZulu-Natal and South Africa, 2001
KwaZulu-Natal South Africa Causes of death Rank N % Rank N % Tuberculosis (A15-A19) 1 15 345 14,6 1 50 872 11,3 Influenza and pneumonia (J10-J18) 2 6 477 6,2 2 31 495 7,0 Other forms of heart disease (I30-I52) 5 4 565 4,4 3 22 602 5,0 Cerebrovascular diseases (I60-I69) 3 5 231 5,0 4 22 577 5,0 Intestinal infectious diseases (A00-A09) 4 4 877 4,6 5 16 060 3,6 Chronic lower respiratory diseases (J40-J47) 7 2 667 2,5 6 14 681 3,2 Diabetes mellitus (E10-E14) 6 3 700 3,5 7 14 557 3,2 Ischaemic heart diseases (I20-I25) 8 2 363 2,2 8 11 777 2,6 Certain disorders involving the immune mechanism (D80-D89) 9 2 232 2,1 9 11 670 2,6 Hypertensive diseases (I10-I15) *** *** *** 10 10 748 2,4 Respiratory and cardiovascular disorders specific to the perinatal period (P20-P29) 10 2 138 2,0 *** *** *** Other causes *** 55 661 52,9 *** 244 897 54,2 All causes *** 105 256 100,0 *** 451 936 100,0
Source: Statistics South Africa, Mortality and causes of death in South Africa, 1997–2003 Table 2.4 shows the number of recorded deaths by leading magisterial districts in KwaZulu-Natal from 1997 to 2000. It is observed that:
• Among the leading districts, Durban had the highest number of recorded deaths in all the years, followed by Pietermaritzburg and Inanda.
Table 2.4: Recorded deaths by leading district, KwaZulu-Natal, 1997–2000
1997 1998 1999 2000 Leading district N % N % N % N % Durban 10 964 19,0 11 219 16,6 12 076 16,0 11 940 14,1 Pietermaritzburg 5 823 10,1 6 506 9,6 7 128 9,5 8 368 9,9 Inanda 3 044 5,3 3 804 5,6 4 139 5,5 4 775 5,6 Lower Umfolozi 2 301 4,0 2 940 4,4 3 073 4,1 3 297 3,9 New Castle 2 221 3,8 2 637 3,9 2 826 3,8 3 196 3,8 Chatsworth 2 108 3,6 2 358 3,5 2 658 3,5 3 757 4,4 Port Shepstone 2 248 3,9 2 556 3,8 2 973 3,9 3 110 3,7 Subtotal 24 380 42,2 29 662 43,9 32 215 42,8 35 247 41,5 Other districts 33 449 57,8 37 868 56,1 43 134 57,2 49 661 58,5 Total 57 829 100,0 67 530 100,0 75 349 100,0 84 908 100,0
Source: Statistics South Africa, Advance release of recorded deaths, 1997–2000
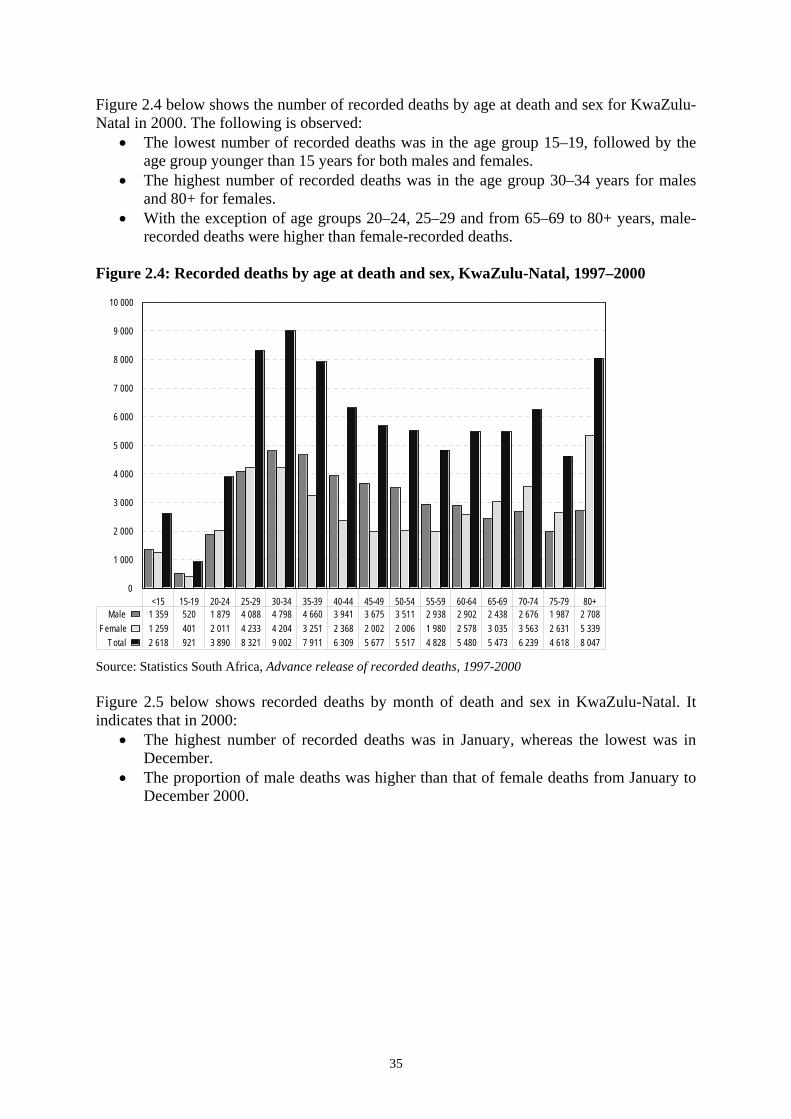
35
Figure 2.4 below shows the number of recorded deaths by age at death and sex for KwaZulu-Natal in 2000. The following is observed:
• The lowest number of recorded deaths was in the age group 15–19, followed by the age group younger than 15 years for both males and females.
• The highest number of recorded deaths was in the age group 30–34 years for males and 80+ for females.
• With the exception of age groups 20–24, 25–29 and from 65–69 to 80+ years, male-recorded deaths were higher than female-recorded deaths.
Figure 2.4: Recorded deaths by age at death and sex, KwaZulu-Natal, 1997–2000
<15 15-19 20-24 25-29 30-34 35-39 40-44 45-49 50-54 55-59 60-64 65-69 70-74 75-79 80+0
1 000
2 000
3 000
4 000
5 000
6 000
7 000
8 000
9 000
10 000
Male 1 359 520 1 879 4 088 4 798 4 660 3 941 3 675 3 511 2 938 2 902 2 438 2 676 1 987 2 708Female 1 259 401 2 011 4 233 4 204 3 251 2 368 2 002 2 006 1 980 2 578 3 035 3 563 2 631 5 339
Total 2 618 921 3 890 8 321 9 002 7 911 6 309 5 677 5 517 4 828 5 480 5 473 6 239 4 618 8 047 Source: Statistics South Africa, Advance release of recorded deaths, 1997-2000 Figure 2.5 below shows recorded deaths by month of death and sex in KwaZulu-Natal. It indicates that in 2000:
• The highest number of recorded deaths was in January, whereas the lowest was in December.
• The proportion of male deaths was higher than that of female deaths from January to December 2000.

36
Figure 2.5: Recorded deaths by month of death and sex, KwaZulu-Natal, 2000
January February March April May June July August September October November December1 000
2 000
3 000
4 000
5 000
6 000
7 000
8 000
9 000
10 000Number
Male 4 952 3 171 3 384 3 527 3 770 3 724 3 922 3 898 3 770 3 955 3 780 2 227Female 4 558 2 994 3 177 3 397 3 427 3 391 3 539 3 565 3 500 3 626 3 608 1 989
Total 9 510 6 165 6 561 6 924 7 197 7 115 7 461 7 463 7 270 7 581 7 388 4 216 Source: Statistics South Africa, Advance release of recorded deaths, 1997–2000
2.3 Marriages Marriages are registered and recorded by the Department of Home Affairs. Figure 2.6 below shows the number of marriages by province and way of solemnisation in 2002. It can be observed from these figures that:
• Gauteng had the highest total number of recorded marriages, followed by Western Cape and then KwaZulu-Natal.
• Northern Cape had the smallest number of recorded marriages (both civil and religious), followed by Mpumalanga and then North West.
• Western Cape had the highest number of religious marriages, followed by Gauteng and then KwaZulu-Natal. Limpopo had the lowest number of religious marriages (564).
• Gauteng had the highest number of civil marriages, followed by Western Cape and then KwaZulu-Natal. Northern Cape had the lowest number of civil marriages.

37
Figure 2.6: Marriages by province and way of solemnisation, South Africa, 2002
WesternCape
EasternCape
NorthernCape
FreeState
KwaZulu-Natal
NorthWest
Gauteng Mpuma-langa
Limpopo Unspecified 0
10 000
20 000
30 000
40 000
50 000
Religious 12 319 5 476 1 306 2 915 12 167 2 929 11 395 1 651 605 462Civil 11 946 10 585 1 663 9 718 10 078 9 822 27 448 4 436 8 584 4 712
Unspecified 1 439 3 919 1 035 517 4 438 1 644 6 944 4 422 3 461 304Total 25 704 19 981 4 004 13 151 26 683 14 395 45 787 10 508 12 649 5 478
Source: Statistics South Africa, Marriages and divorces, 2003 Figure 2.7 below shows the distribution of the population of KwaZulu-Natal by marital status. The figure depicts the following:
• The largest proportion (55,6%) of the population had never been married. • 8,8% of the population was living together like married partners. • Only 0,2% of the population was in a polygamous marriage. • 6,6% of the population was married in the traditional/customary way. • 21,4% of the population was married in accordance with civil/religious customs. • 1,0% of the population was divorced. • 0,5% of the population was separated. • 5,9% of the population was widowed.

38
Figure 2.7: Distribution of the population by marital status, KwaZulu-Natal, 2001
Source: Statistics South Africa, Population Census 2001 Figure 2.8 below shows the marital status among those aged 15 years and older within each population group in KwaZulu-Natal in 2001. The following is information indicated from the graph:
• The largest proportions of the black African and coloured population groups in KwaZulu-Natal had never been married. Among the Indian/Asian and white population groups, most of them were married in accordance with civil or religious custom.
• Polygamous marriages formed the smallest proportion among all population groups. The same applied to the separated and divorced categories in the case of the black African population group, and separated in the case of the white population group.
Figure 2.8: Percentage marital status within each population group, KwaZulu-Natal, 2001
Marriedcivil/
religious
Marriedtraditional/customary
Polygamousmarriage
Living togetherlike married
partners
Nevermarried
Widower/widow
Separated Divorced0,0
10,0
20,0
30,0
40,0
50,0
60,0
70,0%
Black African 14,7 7,2 0,2 10,1 61,3 5,6 0,5 0,4Coloured 39,0 1,4 0,1 5,8 42,8 5,8 1,0 4,3
Indian/Asian 50,9 5,6 0,1 1,5 31,1 7,7 0,8 2,4White 57,2 1,0 0,0 4,8 23,3 7,7 0,6 5,3
Source: Statistics South Africa, Population Census 2001
Married religious/civil 21,4%
Married traditional/customary 6,6%Polygamous marriage 0,2%
Living together 8,8% Separated 0,5% Widower/
widow 5,9%
Never married 55,6%
Divorced 1,0%

39
2.4 Divorces Figure 2.9 shows the number of divorces recorded by province and way of solemnisation of the marriages in South Africa in 2003. From this figure it can be observed that:
• The total number of divorces recorded in South Africa in 2003 was 31 566. From this total, civil divorces were the highest (23 644).
• The highest number of religious and civil divorces was recorded in Gauteng, followed by Western Cape.
• The smallest number of religious and civil divorces was recorded in Northern Cape, followed by Limpopo and then Mpumalanga.
• KwaZulu-Natal had more civil divorces than religious divorces. Figure 2.9: Divorces by province and way of solemnisation, South Africa, 2003
WesternCape
EasternCape
NorthernCape
FreeState
KwaZulu-Natal
NorthWest
Gauteng Mpuma-langa
Limpopo Foreign Unspecified SouthAfr ic a
0
5 000
10 000
15 000
20 000
25 000
30 000
35 000Number
Religious 766 473 76 528 776 285 2 760 226 144 4 286 6 324Civil 4 678 1 872 511 1 183 3 161 1 471 7 534 857 832 8 1 537 23 644
Unspecified 105 210 35 97 153 84 591 25 55 1 242 1 598Total 5 549 2 555 622 1 808 4 090 1 840 10 885 1 108 1 031 13 2 065 31 566
Source: Statistics South Africa, Marriages and divorces, 2003 Figure 2.10 below indicates divorces by population group and way of solemnisation in KwaZulu-Natal in 2002. The following is shown in this figure:
• The highest total number of divorces was registered among the white population group, followed by the Indian/Asian, black African and then coloured population groups.
• Among all population groups, most of registered divorces were civil divorces. • The Indian/Asian group registered the highest number of civil divorces among all
population groups, followed by the white and then black African group. • The white population group registered the highest number of religious divorces,
followed by black Africans. • Mixed divorces were registered mostly in civil cases.

40
Figure 2.10: Divorces by population group and way of solemnisation, KwaZulu-Natal, 2002
Black African Coloured Indian/Asian White Mix ed Unspecified0
200
400
600
800
1 000
1 200
1 400
1 600
1 800Number
Religious 147 17 84 733 12 67Civil 893 200 1 074 915 49 197
Unspecified 128 7 56 55 1 28Total 1 168 224 1 214 1 703 62 292
Source: Statistics South Africa, Marriages and divorces, 2003

41
Chapter 3: Migration Migration describes the movement into and out of countries, and within countries, from non-urban to urban areas or vice versa, or from one province to another.
3.1 Internal migration This refers to the movement of people into a specific part of the country from another part of the same country. Tables 3.1 and 3.2 show the number of people who migrated between provinces in South Africa for the five years from October 1996 to October 2001 respectively. In the case of more than one move by the same individual in the period only the last move is recorded. Table 3.1: Internal migration by province, South Africa, 1996
Moved out of
Moved into Western
Cape
Eastern
Cape Northern
Cape Free State
KwaZulu- Natal
North West
Gauteng
Mpuma-
langa Limpopo Total Western Cape - 200 760 27 346 10 827 18 500 3 810 58 842 3 312 1 774 325 171 Eastern Cape 21 219 - 4 162 6 729 10 955 1 388 22 330 1 617 928 69 328 Northern Cape 10 161 3 267 - 8 288 1 265 15 186 6 465 833 548 46 013 Free State 6 887 38 626 9 583 - 13 459 15 684 47 589 6 560 4 009 142 397 KwaZulu-Natal 8 102 64 915 1 719 8 641 - 2 549 49 954 11 964 2 974 150 818 North West 2 704 22 618 18 083 34 372 5 059 - 124 094 15 157 41 097 263 184 Gauteng 26 086 106 542 11 809 67 057 137 439 173 057 - 101 174 196 093 819 257 Mpumalanga 4 470 14 433 2 138 11 174 23 139 11 853 119 102 - 65 692 252 001 Limpopo 1 310 3 059 357 1 571 1 717 9 127 39 391 33 344 - 89 876 Total 80 939 454 220 75 197 148 659 211 533 232 654 467 767 173 961 313 115 2 158 045 Excluding undetermined Source: Statistics South Africa, Population Census 2001 Table 3.2: Internal migration by province, South Africa, 2001
Moved out of
Moved into Western
Cape Eastern
Cape Northern
Cape Free State
KwaZulu- Natal
North West Gauteng
Mpuma- langa Limpopo Total
Western Cape - 142 366 21 430 13 017 24 631 7 057 58 169 6 003 5 207 277 880 Eastern Cape 26 688 - 2 954 8 761 18 233 4 302 29 166 3 187 2 679 95 970 Northern Cape 9 649 4 142 - 6 417 1 893 16 360 6 829 1 486 1 385 48 161 Free State 5 235 16 810 7 635 - 8 948 10 327 25 205 5 720 4 133 84 013 KwaZulu-Natal 9 318 59 708 1 847 8 578 - 4 362 44 909 11 282 5 072 145 078 North West 3 769 21 227 7 529 20 119 7 910 - 53 413 11 560 21 374 146 901 Gauteng 32 602 90 032 11 060 60 031 132 948 108 719 - 88 950 171 142 695 484 Mpumalanga 3 133 10 087 1 429 6 991 18 852 6 354 34 721 - 37 739 119 306 Limpopo 2 491 6 368 1 719 4 380 7 065 11 602 39 652 18 143 - 91 420 Total 92 881 350 761 55 606 128 272 220 480 169 073 292 158 146 298 248 753 1 704 282 Excluding undetermined Source: Statistics South Africa, Population Census 2001

42
Figure 3.1 shows gains or losses for each province in each five-year period. From this figure it can be observed that:
• Losses in internal migration for KwaZulu-Natal in 1996 and 2001 were 60 715 and 75 333 respectively.
• Gauteng and Western Cape were the only provinces that gained substantial numbers of people in both 1996 and 2001.
Figure 3.1: Gains or losses in internal migration by province, 1996 and 2001
WesternCape
EasternCape
NorthernCape
FreeState
KwaZulu-Natal
NorthWest
Gauteng Mpuma-langa
Limpopo
0
100 000
200 000
300 000
400 000
-100 000
-200 000
-300 000
-400 000
Number
1996 244 232 -384 892 -29 184 -6 262 -60 715 30 530 351 490 78 040 -223 2392001 184 999 -254 791 -7 445 -44 259 -75 333 -22 172 403 326 -26 992 -157 333
Source: Statistics South Africa, Population Census 1996 and 2001 Figure 3.2 shows the number of people who moved from other provinces into KwaZulu-Natal in the five-year-period up to 2001. The largest number came from Eastern Cape (59 708), whilst the smallest number came from Limpopo (5 072). Figure 3.2: Numbers of migrants to KwaZulu-Natal from other provinces, 1996–2001
WesternCape
EasternCape
NorthernCape
FreeState
NorthWest
Gauteng Mpuma-langa
Limpopo0
10 000
20 000
30 000
40 000
50 000
60 000Number
Net gain 9 318 59 708 1 847 8 578 4 362 44 909 11 282 5 072 Source: Statistics South Africa, Population Census 2001

43
Table 3.3 shows the distribution of migrants from other provinces into KwaZulu-Natal over the five-year period up to 2001, by district municipality. It can be seen that the largest number moved into eThekwini (64 228). Table 3.3: Migrants into KwaZulu-Natal by district municipality, 2001
Province from where moved District municipality of residence
Western Cape
Eastern Cape
Northern Cape
Free State
North West Gauteng
Mpuma- langa Limpopo Total
Ugu 372 7 564 113 512 497 4 110 609 575 14 352 uMgungundlovu 1 537 5 982 306 938 530 4 489 1 227 911 15 920 Uthukela 410 1 040 125 940 204 2 358 520 292 5 890 Umzinyathi 114 317 27 167 138 1 196 234 67 2 260 Amajuba 364 754 129 1 082 332 3 064 2 222 320 8 268 Zululand 296 618 98 290 150 2 076 1 295 246 5 068 Umkhanyakude 104 269 27 122 63 529 180 96 1 390 Uthungulu 658 1 362 141 687 471 3 351 1 535 620 8 825 iLembe 257 3 362 77 230 203 1 815 380 164 6 488 Sisonke 318 10 507 49 262 120 879 156 96 12 387 eThekwini 4 889 27 933 754 3 347 1 654 21 043 2 924 1 684 64 228 Total 9 318 59 708 1 847 8 578 4 362 44 909 11 282 5 072 145 078
Source: Statistics South Africa, Population Census 2001
3.2 International migration International migration is defined as the movement between South Africa and other countries. The following table shows the region of birth of the population of South Africa in 2001. Table 3.4: Population by region of birth, 2001
Eastern Free KwaZulu- Mpuma- Northern North Western South Country of birth Cape State Gauteng Natal Limpopo Langa Cape West Cape Africa South Africa 6 401 924 2 657 848 8 364 104 9 329 255 5 193 803 3 040 291 810 409 3 581 639 4 415 428 43 794 702 SADC countries* 15 425 43 424 305 460 44 692 73 583 75 435 10 891 79 970 38 799 687 683 Rest of Africa 3 527 673 21 639 5 876 1 055 1 042 252 1 154 6 602 41 819 Europe 11 948 3 121 113 451 37 223 2 137 4 794 821 3 958 50 860 228 314 Asia 2 511 1 238 20 439 5 241 2 526 869 165 1 937 5 959 40 886 North America 455 125 4 155 1 319 258 204 44 200 2 393 9 152 Central and South America 746 293 5 926 1 631 226 283 122 416 3 154 12 798 Australia and New Zealand 227 53 2 005 781 53 72 24 74 1 141 4 429 Total 6 436 763 2 706 775 8 837 178 9 426 017 5 273 642 3 122 990 822 727 3 669 349 4 524 335 44 819 778
* Southern African Development Community countries other than South Africa Source: Statistics South Africa, Population Census 2001

44
Figure 3.3 shows the distribution of non-South Africans born in each province by region of birth, using the data from the above table excluding the first row. The pattern for KwaZulu-Natal reflects that for the country as a whole. It is similar to the patterns for Western Cape and Eastern Cape, and to a certain extent Gauteng. Immigrants were primarily from other SADC countries (46,2%) and from Europe (38,5%). Figure 3.3: Distribution of persons in each province not born in South Africa by region of birth, 2001
WesternCape
EasternCape
NorthernCape
FreeState
KwaZulu-Natal
NorthWest
Gauteng Mpuma-langa
Limpopo SouthAfr ic a
0,0%
20,0%
40,0%
60,0%
80,0%
100,0%Percentage
Australia and New Zealand 1,0 0,7 0,2 0,1 0,8 0,1 0,4 0,1 0,1 0,4
Central and South America 2,9 2,1 1,0 0,6 1,7 0,5 1,3 0,3 0,3 1,2North America 2,2 1,3 0,4 0,3 1,4 0,2 0,9 0,2 0,3 0,9
Asia 5,5 7,2 1,3 2,5 5,4 2,2 4,3 1,1 3,2 4,0Europe 46,7 34,3 6,7 6,4 38,5 4,5 24,0 5,8 2,7 22,3
Rest of Africa 6,1 10,1 2,0 1,4 6,1 1,3 4,6 1,3 1,3 4,1SADC countries 35,6 44,3 88,4 88,8 46,2 91,2 64,6 91,2 92,2 67,1
Source: Statistics South Africa, Population Census 2001

45
Chapter 4: Health 4.1 Health personnel The total number of health care posts throughout the country in 2001 was 60 183, and the total number of vacant posts was 11 650 (approximately 20%). The number of vacant posts had increased significantly in the professional field (from 20% in 2000 to 40% in 2001), and in the general field (from 17% in 2000 to 26% in 2001). Figure 4.1: Percentage of vacant posts in KwaZulu-Natal, 2000 and 2001
0%
10%
20%
30%
40%
50%
Administration General Labourprovisioning
Medicinal Nursing Paramedical Professional Technical
2000 2001
Source: Department of Health, Health Informatics, 2001 The table below gives the number of public healthcare personnel per 10 000 of the population in KwaZulu-Natal in 2001.

46
Table 4.1: Number of public healthcare personnel per 10 000 of the population and by category, KwaZulu-Natal, 2001
Healthcare personnel
Per 10 000 of the population
Doctors: Private and public sectors, 2001 4,8 Private sector, 2001 2,2 Public sector, 2001 2,6 Nurses: Private and public sectors, 2001 64,0 Private sector, 2001 28,1 Public sector, 2001 35,9 Pharmacists: Private and public sectors, 2001 2,5 Private sector, 2001 0,9 Public sector, 2001 1,7 Dentists: Private and public sectors, 2001 1,8 Private sector, 2001 0,6 Public sector, 2001 1,2 Occupational therapists 1,1 Radiographers 1,3
Source: Department of Health, Health informatics, 2001
4.2 Healthcare institutions Table 4.2 looks at the number of hospitals in each province in 2001 and the number of hospital beds. The table shows that:
• Eastern Cape had the largest number of public hospitals (84) of all provinces, followed by KwaZulu-Natal (59).
• KwaZulu-Natal had the largest number of beds in public hospitals (23 705), as well as the largest number of hospital beds altogether (31 266).
Table 4.2: Number of hospitals and beds in each province, 2001
Private hospitals Semi-private hospitals Public hospitals Province
Number of hospitals
Number of beds
Number of hospitals
Number ofBeds
Number of hospitals
Number of beds
Western Cape 30 3 770 2 410 54 10 461 Eastern Cape 14 1 283 7 1 178 84 18 275 Northern Cape 6 386 0 0 26 1 839 Free State 9 1 647 0 0 34 7 075 KwaZulu-Natal 27 3 471 14 4 090 59 23 705 North West 10 883 0 0 22 5 506 Gauteng 75 11 631 1 120 29 17 471 Mpumalanga 6 785 4 553 25 3 710 Limpopo 1 186 1 160 43 12 012 Total 178 24 042 29 6 511 376 100 054
Sources: Hospital Association of South Africa (HASA) and Hospital minimum data set, Department of Health, 2001

47
Table 4.3 shows that: • Eastern Cape had the largest number of medical clinics, but the smallest number of
visiting points. • Northern Cape was the only province with fewer than 100 clinics (96). • KwaZulu-Natal had the highest number of medical mobile facilities and visiting
points (166 and 97 respectively) in South Africa. This is because the province has the largest population of all provinces and also as a result of the scattered nature of the rural population in the province.
Table 4.3: Primary healthcare facilities in each province, 2001
Province
Clinics
Community health
centres Mobile
facilities Visiting
points
Total Western Cape 340 6 136 55 537 Eastern Cape 724 12 43 1 780 Northern Cape 96 6 13 37 152 Free State 212 5 78 3 298 KwaZulu-Natal 365 10 166 97 638 North West 380 20 71 3 474 Gauteng 333 26 62 17 438 Mpumalanga 221 28 91 46 386 Limpopo 506 5 95 63 669 Total 3 177 118 755 322 4 372
Source: South African Institute of Race Relations, 2001/02 Survey
4.3 HIV and AIDS The Department of Health conducts HIV prevalence surveys every year among pregnant mothers who attend public antenatal clinics. Table 4.4 and Figure 4.2 show the following estimates:
• In KwaZulu-Natal, the HIV prevalence among pregnant women was 36,2% for the year 2000, and although having decreased to 33,5% in 2001, remained the highest of all provinces.
• In South Africa overall, 24,8% of pregnant women were infected with HIV by the end of 2001. This was in comparison with a prevalence rate of 24,5% for the year 2000. Whilst this rate of infection was high and a significant public health problem, the findings indicated that there was no statistically significant growth in the epidemic from the previous year.
• In 2001, a total of 4 634 AIDS cases were reported to hospitals in South Africa, an increase of 11,0%.
• Approximately 82,0% of the cases reported in South Africa were between the ages of 15 and 45 years. Of this total, 7,0% were children under the age of 5 years.

48
Table 4.4: HIV prevalence by province (estimated rates and confidence intervals), 2000 and 2001
2000 2001 Province Est (HIV+) 95% CI Est (HIV+) 95% CI Western Cape 8,7 (6,0–11,4) 8,6 (5,8–11,5) Eastern Cape 20,2 (17,2–23,1) 21,7 (19,0–24,4) Northern Cape 11,2 (8,5–13,8) 15,9 (10,1–21,6) Free State 27,9 (24,6–31,3) 30,1 (26,5–33,7) KwaZulu-Natal 36,2 (33,4–39,0) 33,5 (30,6–36,4) North West 22,9 (20,1–25,7) 25,2 (21,9–28,6) Gauteng 29,4 (27,2–31,5) 29,8 (27,5–32,1 ) Mpumalanga 29,7 (25,9–33,6) 29,2 (25,6–32,8) Limpopo 13,2 (11,7–14,8) 14,5 (12,2–16,9) South Africa 24,5 (23,4–25,6) 24,8 (23,6–26,1)
Source: Department of Health, National HIV and Syhilis Antenatal Seroprevalence Survey 2001 Figure 4.2: Reported AIDS cases by age, KwaZulu-Natal, 2001
0% 5% 10% 15% 20% 25%
0-4
5-9
10-14
15-19
20-24
25-29
30-34
35-39
40-44
45-49
50-54
55-59
60+
Source: Department of Health, Health Informatics, 2001
4.4 Childhood mortality Childhood mortality rates, namely the Infant mortality rate (IMR) and the Under-five mortality rate (U5MR), are key indicators used internationally, nationally and locally as a sensitive but non-specific way of comparing health status and development within countries, between countries and among communities. A cross-sectional facility-based survey was conducted using the Rapid Epidemiological Assessment tool (Preceding Birth Technique) throughout KwaZulu-Natal over the month of

49
May 2001. Data were collected using midwife-administered questionnaires from all first antenatal attendees at health facilities. The total facility response rate of 48% (from all facilities that provide antenatal care) is considered low, with a breakdown of 71% from fixed clinics, 16% from mobile clinics, 10% from district hospitals, and 3% from regional and central hospitals. However, the response rate from rural districts such as Ugu, uMgungundlovu, Uthukela and Umzinyathi (90%, 92%, 72% and 74% respectively) is considered acceptable for the estimation of childhood mortality for those districts. The Durban Metropolitan District (eThekwini) had the lowest estimated IMR and U5MR of 74 and 103 respectively per 1 000 live births. The highest IMR and U5MR of 112 and 164 per 1 000 live births respectively were observed in the district of Uthungulu. The IMR and U5MR for KwaZulu-Natal being 96,5 and 138,8 per 1 000 live births respectively, is high compared to the South African Demographic Survey 1998 where the IMR was estimated at 52 per 1 000 live births and the under-five mortality rate at 74,5 per 1 000 live births. The survey randomly selected 7 087 pregnant women who attended their first antenatal bookings at the selected health facilities. Of these, 4 990 (70%) pregnant women had had previous live births, the outcome of which was analysed to estimate the infant mortality and under-five mortality rates. Table 4.5 below shows that Ugu provided the largest proportion of the sample population (17%), followed by Zululand with 13%. eThekwini had the highest proportion of the KwaZulu-Natal population (33%) but contributed only 8% of the sample population. Table 4.5: Pregnant women interviewed and previous live births reported in each health district, KwaZulu-Natal, 2001
District municipality
Number of pregnant women
interviewed
No. and % of receding live births
analysed
Percentage of total preceding live
births Ugu 1 304 826 (63%) 17% uMgungundlovu 841 482 (63%) 9% Uthukela 923 611 (57%) 12% Umzinyathi 379 262 (69%) 5% Amajuba 604 369 (61%) 8% Zululand 634 552 (87%) 13% Umkhanyakude 518 352 (68%) 7% Uthungulu 301 246 (81%) 55,0% iLembe 430 430 (100%) 9% Sisonke 512 356 (69%) 7% eThekwini 640 404 (63%) 8% KwaZulu-Natal 7 087 4 990 (70%) 100%
Source: KwaZulu-Natal Department of Health, 2001 Table 4.6 looks at the data resulting from the analysis of the births reported, dead or alive.
• The highest mortality rates of 112 (95% CI, 52–161) and 164 (95% CI, 71–245) per 1 000 live births IMR and U5MR respectively were observed in Uthungulu.
• The lowest infant mortality rate of 74 (95% CI, 30–115) per 1 000 live births and under-five mortality rate of 103 (95% CI, 32–148) per 1 000 live births were observed in eThekwini.

50
• The overall estimated childhood mortality rate of KwaZulu-Natal was an IMR of 92 and a U5MR of 132 per 1 000 live births.
Table 4.6: Calculation of IMR and U5MR, KwaZulu-Natal, 2001
District municipality Last baby
alive (A) Last baby
dead (D) Proportion
(D÷A+D)
IMR/ 1 000 live births* (95%
confidence interval)
U5MR/ 1 000 live births*(95%
confidence interval)
Ugu 728 98 0,118 95 (60–130) 136 (81–191) uMgungundlovu 417 65 0,134 107 (64–149) 156 (82–220) Uthukela 548 63 0,103 86 (52–115) 122 (67–168) Umzinyathi 226 36 0,137 111 (52–161) 162 (142–246) Amajuba 331 38 0,101 84 (36–167) 120 (48–246) Zululand 566 86 0,127 100 (62–136) 145 (81–203) Umkhanyakude 307 45 0,127 100 (51–147) 145 (72–222) Uthungulu 212 34 0,138 112 (52–161) 164 (71–245) iLembe 379 51 0,130 102 (85–129) 148 (120–191) Sisonke 308 48 0,134 107 (54–157) 156 (72–234) eThekwini 369 35 0,086 74 (30–115) 103 (32–148) KwaZulu-Natal 4 391 560 0,113 92 (87–102) 132 (121–147)
Source: KwaZulu-Natal Department of Health, 2001
4.5 Visits to health institutions or a health worker The data in this section are taken from the General Household Survey 2003 and 2004. Figure 4.3 below shows that:
• An average of approximately 85% of the population of KwaZulu-Natal, who were sick or injured in 2003 and 2004 consulted a health worker in the month prior to the interview, while only 15,5% of the population in KwaZulu-Natal who were sick during the same period did not consult a health worker.
• Northern Cape had the highest average of sick or injured people who consulted a health worker in 2003 and 2004 (86,5%), followed by Limpopo (86,2%) and Free State (85,6%).
• Mpumalanga had the smallest average of sick or injured people who consulted a health worker in the month prior to the interview in 2003 and 2004 (80,9%), followed by Western Cape (81,7%) and Eastern Cape (82,3%).
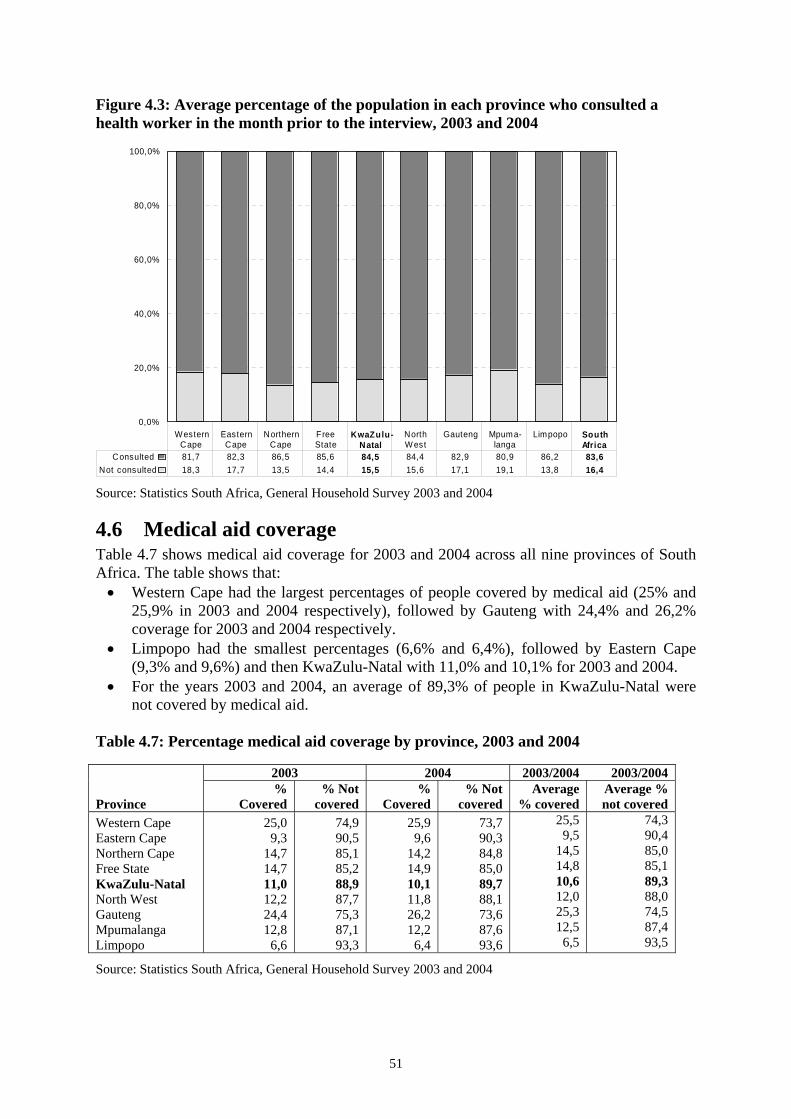
51
Figure 4.3: Average percentage of the population in each province who consulted a health worker in the month prior to the interview, 2003 and 2004
WesternCape
EasternCape
NorthernCape
FreeState
KwaZulu-Natal
NorthW est
Gauteng Mpuma-langa
Limpopo SouthAfrica
0,0%
20,0%
40,0%
60,0%
80,0%
100,0%
Not consulted 18,3 17,7 13,5 14,4 15,5 15,6 17,1 19,1 13,8 16,4Consulted 81,7 82,3 86,5 85,6 84,5 84,4 82,9 80,9 86,2 83,6
Source: Statistics South Africa, General Household Survey 2003 and 2004
4.6 Medical aid coverage Table 4.7 shows medical aid coverage for 2003 and 2004 across all nine provinces of South Africa. The table shows that: • Western Cape had the largest percentages of people covered by medical aid (25% and
25,9% in 2003 and 2004 respectively), followed by Gauteng with 24,4% and 26,2% coverage for 2003 and 2004 respectively.
• Limpopo had the smallest percentages (6,6% and 6,4%), followed by Eastern Cape (9,3% and 9,6%) and then KwaZulu-Natal with 11,0% and 10,1% for 2003 and 2004.
• For the years 2003 and 2004, an average of 89,3% of people in KwaZulu-Natal were not covered by medical aid.
Table 4.7: Percentage medical aid coverage by province, 2003 and 2004
2003 2004 2003/2004 2003/2004
Province %
Covered % Not
covered %
Covered % Not
covered Average
% covered Average % not covered
Western Cape Eastern Cape Northern Cape Free State KwaZulu-Natal North West Gauteng Mpumalanga Limpopo
25,0 9,3
14,7 14,7 11,0 12,2 24,4 12,8
6,6
74,9 90,5 85,1 85,2 88,987,7 75,3 87,1 93,3
25,9 9,6
14,2 14,9 10,111,8 26,2 12,2
6,4
73,7 90,3 84,8 85,0 89,788,1 73,6 87,6 93,6
25,5 9,5
14,5 14,8 10,6 12,0 25,3 12,5
6,5
74,3 90,4 85,0 85,1 89,388,0 74,5 87,4 93,5
Source: Statistics South Africa, General Household Survey 2003 and 2004

52
Chapter 5: Education 5.1 Educational attainment Figure 5.1 looks at the proportions of people aged 20 and above in each province in each level of education category.
• In all provinces except Mpumalanga and Limpopo, the largest proportion of persons aged 20 and above had some secondary education, as opposed to one of the other levels listed. In Limpopo, the largest proportion had some secondary education, whilst in Mpumalanga, the largest proportion had no education.
• Gauteng had the highest proportion of persons with Grade 12 or higher (40,6%), followed by Western Cape (34,6%), while Eastern Cape had the lowest (20,4%), followed by Limpopo (20,8%). The national average was 28,8%.
• The KwaZulu-Natal pattern was very similar to the national pattern. Figure 5.1: Percentage distribution of persons aged 20+ within each province by level of education, 2001
WesternCape
EasternCape
NorthernCape
FreeState
KwaZulu-Natal
NorthWest
Gauteng Mpuma-langa
Limpopo SouthAfr ic a
0,0%
20,0%
40,0%
60,0%
80,0%
100,0%%
Tertiary 11,2 6,3 6,1 6,3 6,9 5,9 12,6 5,9 6,8 8,4Std 10/Grade 12 23,4 14,1 16,5 17,5 19,8 18,5 28,0 18,2 14,0 20,4Some secondary 36,5 29,6 29,9 30,7 28,8 29,0 34,3 26,6 26,1 30,8
Complete primary 7,9 7,4 8,3 7,8 5,7 6,8 5,5 5,9 5,5 6,4Some primary 15,2 19,8 21,0 21,7 16,9 20,0 11,2 15,9 14,1 16,0No schooling 5,7 22,8 18,2 16,0 21,9 19,9 8,4 27,5 33,4 17,9
Source: Statistics South Africa, Population Census 2001 Table 5.1 looks at level of education of within population group for KwaZulu-Natal and the country as a whole.
• Approximately 30% of the white population aged 20 and above in both KwaZulu-Natal and South Africa as a whole had at least Grade 12 (the categories of Grade 12 and tertiary taken together).
• Among black Africans of this age group, 4,3% in KwaZulu-Natal had tertiary education, compared with 5,2% nationally.

53
Table 5.1: Percentage population aged 20 years and above in each population group by educational level, KwaZulu-Natal and South Africa, 2001
Black African
Coloured
Indian/Asian
White
Total
Level of education KZN SA KZN SA KZN SA KZN SA KZN SA No schooling 26,1 22,3 4,1 8,3 6,1 5,3 1,6 1,4 21,9 17,9 Some primary 19,5 18,5 6,3 18,4 8,8 7,7 1,3 1,2 16,9 16,0 Complete primary 6,3 6,9 4,9 9,8 4,6 4,2 0,7 0,8 5,7 6,4 Some secondary 27,8 30,4 46,3 40,1 35,4 33,0 26,2 25,9 28,8 30,8 Std 10/Grade 12 16,0 16,8 29,1 18,5 33,6 34,9 40,3 40,9 19,8 20,4 Tertiary 4,3 5,2 9,2 4,9 11,6 14,9 29,9 29,8 6,9 8,4 Total 100,0 100,0 100,0 100,0 100,0 100,0 100,0 100,0 100,0 100,0
Source: Statistics South Africa, Population Census 2001 Figure 5.2 below looks at the level of education according to urban and rural area of residence (the definition of urban can be found in Chapter 1).
• The urban pattern for KZN more or less reflects the urban pattern for the whole country.
• The rural patterns show that a larger percentage of those aged 20 and above had no schooling in KZN (36,0%) than in the country as a whole (32,7%). Levels from complete primary and above showed correspondingly smaller proportions for the province than for the country as a whole.
Figure 5.2: Urban and rural population aged 20 years and above by educational level, KwaZulu-Natal and South Africa, 2001
Kw aZulu-Natal (urban)
SouthAfrica (urban)
Kw aZulu-Natal (rural)
SouthAfrica (rural)
0,0
5,0
10,0
15,0
20,0
25,0
30,0
35,0
40,0%
No schooling 9,5 9,5 36,0 32,7Some primary 12,8 13,3 21,6 20,9
Complete primary 5,5 6,3 5,9 6,5Some secondary 34,0 34,3 22,8 24,7Std10/Grade 12 27,5 25,5 11,0 11,4
Tertiary 10,7 11,1 2,6 3,8 Source: Statistics South Africa, Population Census 2001

54
Figure 5.3 looks at the same variable by sex. • Considerably more females than males in KwaZulu-Natal aged 20 years and above
had no formal schooling (20,1% as against 16,2%). The proportion of males with some primary education (32,8%) is correspondingly larger than that of females (29,8%).
• Slightly more males than females had Grade 12 or above. Figure 5.3: Percentage population aged 20 years and above by level of education and sex, KwaZulu-Natal, 2001
No schooling Some primary Completeprimary
Somesecondary
Standard 10/Grade 12
Tert iary0,0
5,0
10,0
15,0
20,0
25,0
30,0
35,0%
Male 18,5 16,5 5,7 30,6 21,5 7,3Female 24,6 17,2 5,7 27,4 18,5 6,6 Source: Statistics South Africa, Population Census 2001
5.2 Literacy In what follows, a person who is 15 years or older with seven years of schooling is defined as functionally literate. The main difference between the data shown here and the data shown above is that all educational levels from complete primary upwards are grouped for the purpose, as we are only interested in the attainment of Grade 7; and the population is larger, including all those who could have completed primary school, namely those aged 15 and above. Figure 5.4 looks at the proportions in each province in 2001 with no schooling, some primary schooling and at least complete primary schooling, the latter group being defined as functionally literate.
• In South Africa, 68,5% of persons aged 15 years or older were functionally literate, while 15,5% had no schooling and 16,0% had some primary education.
• KwaZulu-Natal had a literacy rate of 64,8%, lower than the national average, but in the middle of the provincial ranking for this variable. Gauteng had the highest literacy rate (81,4%), followed by Western Cape (80,4%); whilst Limpopo had the lowest (58,7%).

55
Figure 5.4: Proportion of persons aged 15 years and older in each province that were functionally literate, 2001
WesternCape
EasternCape
NorthernCape
FreeState
KwaZulu-Natal
NorthWest
Gauteng Mpuma-langa
Limpopo SouthAfr ic a
0,0
20,0
40,0
60,0
80,0
100,0%
Literate 80,4 60,1 63,7 65,3 64,8 62,9 81,4 60,7 58,7 68,5Grade 1-6 14,5 20,8 20,4 21,0 16,5 19,7 11,0 16,2 14,4 16,0
No schooling 5,1 19,1 16,0 13,7 18,6 17,4 7,6 23,1 26,9 15,5 Source: Statistics South Africa, Population Census 2001 Table 5.2 below shows the number of people aged 20 or older with no formal schooling by province and population group in South Africa in 2001. The following is observed:
• Among black Africans, KwaZulu-Natal had the highest number of those with no formal schooling. This correlates with their being the majority in the province.
• Notable, however, is the large proportions of other population groups with no formal schooling.
Table 5.2: Number of people aged 20+ with no formal schooling by province and population group, South Africa, 2001
Province Black African Coloured Indian/Asian White Total Western Cape 68 192 90 476 643 3 471 162 781 Eastern Cape 715 922 25 300 313 2 165 743 700 Northern Cape 40 985 46 534 105 1 055 88 680 Free State 240 686 7 859 85 2 778 251 408 KwaZulu-Natal 1 059 131 3 503 32 076 5 581 1 100 291 North West 414 394 6 072 226 3 095 423 787 Gauteng 468 467 11 352 5 299 19 501 504 619 Mpumalanga 451 825 1 551 355 3 016 456 747 Limpopo 832 633 728 274 1 850 835 485 South Africa 4 292 235 193 375 39 375 42 513 4 567 497
Source: Statistics South Africa, Population Census 2001

56
5.3 Schools and school data Table 5.3 shows that in 2001:
• Eastern Cape had the largest number of schools in South Africa (6 087), followed by KwaZulu-Natal (5 751).
• Northern Cape had the smallest number of schools in South Africa (478). These numbers reflect the provincial populations. Table 5.3: Number of schools in each province, 2001
Province N % Western Cape 1 602 5,8 Eastern Cape 6 087 22,2 Northern Cape 478 1,7 Free State 2 459 9,0 KwaZulu-Natal 5 751 20,9 North West 2 311 8,4 Gauteng 2 213 8,1 Mpumalanga 1 926 7,0 Limpopo 4 631 16,9 South Africa 27 458 100
Source: National Department of Education, 2001 The next table gives the breakdown of KwaZulu-Natal schools by district municipality. It can be seen that eThekwini had the highest proportion of schools in KwaZulu-Natal (18,3%), while Amajuba had the lowest proportion (4,2%). Table 5.4: Distribution of schools by district municipality, KwaZulu-Natal, 2002
District municipality N % Ugu 509 8,4 uMgungundlovu 638 10,5 Uthukela 456 7,5 Umzinyathi 456 7,5 Amajuba 253 4,2 Zululand 722 11,9 Umkhanyakude 505 8,3 Uthungulu 675 11,1 iLembe 442 7,3 Sisonke 315 5,2 eThekwini 1 112 18,3 KwaZulu-Natal 6 083 100,0
Source: KwaZulu-Natal Department of Education, 2002

57
5.4 Learner:classroom ratio Table 5.5 below shows the average learner:classroom ratio, which is calculated by dividing the total number of learners for all schools in an area by the total number of classrooms in the same area. The following is indicated:
• High classroom ratios (more than 50:1) were predominantly found in Umzinyathi, Umkhanyakude, Sisonke, Ugu, iLembe, Uthungulu and Zululand, while lower ratios (less than 46:1) were found in Uthukela, Amajuba, uMgungundlovu and eThekwini.
• The average learner:classroom ratio for KwaZulu-Natal was 49:1. Table 5.5: Learner:classroom ratio in each district municipality, KwaZulu-Natal, 2002
District municipality Number of
learners Number of classrooms
Learner:classroom ratio
Ugu 222 196 3 959 56,1:1 uMgungundlovu 239 429 5 359 44,7:1 Uthukela 198 606 5 088 39,0:1 Umzinyathi 166 800 2 608 64,0:1 Amajuba 132 352 3 079 43,0:1 Zululand 283 414 5 589 50,7:1 Umkhanyakude 226 684 3 783 59,9:1 Uthungulu 291 480 5 534 52,7:1 iLembe 175 050 3 205 54,6:1 Sisonke 97 770 1 665 58,7:1 eThekwini 694 785 15 361 45,2:1 KwaZulu-Natal 2 728 566 55 230 49,4:1
Source: KwaZulu-Natal Department of Education, 2002
5.5 Learner:educator ratio While the variation in class size does not strongly predict or explain variation in learning achievement, the learner:educator ratio is an important indicator. The learner:educator ratio is calculated by dividing the total number of learners for all schools in a given area by the total number of educators in the same area. The norm for the learner:educator ratio is between 35:1 and 40:1.

58
Table 5.6 shows that the average learner:educator ratio in all the district municipalities in KwaZulu-Natal in 2002 was less than 35:1. Table 5.6: Learner:educator ratio in each district municipality, KwaZulu-Natal, 2002
District municipality
Number of
learners Number of educators
Learner:educator ratio
Ugu 222 196 6 756 32,9:1 uMgungundlovu 239 429 7 975 30,0:1 Uthukela 198 606 5 836 34,0:1 Umzinyathi 166 800 4 851 34,4:1 Amajuba 132 352 3 825 34,6:1 Zululand 283 414 8 202 34,6:1 Umkhanyakude 226 684 6 427 35,3:1 Uthungulu 291 480 8 644 33,7:1 iLembe 175 050 5 319 32,9:1 Sisonke 97 770 2 898 33,7:1 eThekwini 694 785 21 992 31,6:1 KwaZulu-Natal 2 728 566 82 725 33,0:1
Source: KwaZulu-Natal Department of Education, 2002
5.6 Gross enrolment ratio (GER) The gross enrolment ratio (GER) is defined as the number of learners, regardless of age, enrolled in a specific school phase (e.g. secondary) as a percentage of the total appropriate school-age population (e.g. 14- to 18-year-olds for secondary). GER is used to show the level of participation in education. Table 5.7 below shows that in 2001:
• The overall GER (primary and secondary) for KwaZulu-Natal was 109%, compared to 103% nationally.
• In KwaZulu-Natal, the GER of 119% for primary education was much higher than the GER of 94% for secondary education. This pattern is seen in the national figures as well.
• In both KwaZulu-Natal and nationally, the GER for females was higher than that for males in the secondary phase, but lower in the primary phase.
Table 5.7: Number of learners in the ordinary school sector, the school-age population and the gross enrolment ratio (GER) by sex, KwaZulu-Natal and South Africa, 2001
Number of learners1 School-age population2 GER (%)
Province Gender Primary
(Grade 1-7) Secondary
(Grade 8-12) Total
(Grade1-12) Primary
(7-13 yrs) Secondary (14-18 yrs)
Total (7-18 yrs) Primary
Secon-dary Total
Male 864 648 447 446 1 312 094 686 681 510 073 1 196 754 126 88 110 Female 820 465 484 169 1 304 634 689 472 517 712 1 207 184 119 94 108
KwaZulu- Natal
Total 1 685 113 931 615 2 616 728 1 376 153 1 027 785 2 403 938 122 91 109
Male 3 789 985 1 903 992 5 693 977 3 171 206 2 339 734 5 510 940 120 81 103 Female 3 623 431 2 125 282 5 748 713 3 183 272 2 370 890 5 554 161 114 90 104
South Africa
Total 7 413 416 4 029 274 11 442 690 6 354 478 4 710 624 1 1065 102 117 86 103
Source 1: KwaZulu-Natal Departmenr of Education, 2001 Snap Survey (conducted on the 10th school day) Source 2: Statistics South Africa, Mid-year population estimates for 2001

59
5.7 Grade 12 pass rate Table 5.8 shows that in 2003: • In South Africa as a whole 440 267 candidates wrote the senior certificate examination
and about 73,3% passed, 18,6% with endorsement (university entrance). • Northern Cape had the best pass rate (90,7%), followed by Western Cape (87,1%) and
then Gauteng (81,5%). • Eastern Cape recorded the second lowest pass rate (60,0%) after Mpumalanga (58,2%). • Generally, within provinces, males had higher pass rates than females. Only in Gauteng
and KwaZulu-Natal did females have higher pass rates with endorsement than males.

60
Table 5.8: Senior certificate results by province, South Africa, 2003
Candidates passed Gender Total who wrote Failed Passed With endorsement Province N %* N %** N %** N %** Western Cape Male 17 095 44,1 1 941 11,4 15 154 88,6 4 611 27,0 Female 21 655 55,9 3 040 14,0 18 615 86,0 5 712 26,4 Total 38 750 4 981 12,9 33 769 87,1 10 323 26,6 Eastern Cape Male 27 390 43,9 10 501 38,3 16 887 61,7 2 768 10,1 Female 35 067 56,1 14 484 41,3 20 581 58,7 3 185 9,1 Total 62 457 24 985 40,0 37 468 60,0 5 953 9,5 Northern Male 2 912 46,6 234 8,0 2 677 92,0 582 20,0 Cape Female 3 338 53,4 348 10,4 2 990 89,6 645 19,3 Total 6 250 582 9,3 5 667 90,7 1 227 19,6 Free State Male 11 400 48,2 2 043 17,9 9 357 82,1 2 779 24,4 Female 12 256 51,8 2 697 22,0 9 559 78,0 2 619 21,4 Total 23 656 4 740 20,0 18 916 80,0 5 398 22,8 KwaZulu- Male 45 457 46,7 10 332 22,8 35 060 77,2 8 951 19,7 Natal Female 51 910 53,3 11 801 22,8 40 017 77,2 10 936 21,1 Total 97 367 22 133 22,8 75 077 77,2 19 887 20,5 North West Male 16 538 46,5 4 531 27,4 12 004 72,6 2 676 16,2 Female 19 029 53,5 5 974 31,4 13 051 68,6 2 763 14,5 Total 35 569 10 505 29,5 25 055 70,5 5 439 15,3 Gauteng Male 31 365 45,9 5 676 18,1 25 689 81,9 7 127 22,7 Female 36 920 54,1 6 988 18,9 29 932 81,1 8 795 23,8 Total 68 285 12 664 18,5 55 621 81,5 15 922 23,3 Mpumalanga Male 17 931 45,9 6 943 38,7 10 986 61,3 2 491 13,9 Female 21 101 54,1 9 387 44,5 11 714 55,5 2 349 11,1 Total 39 032 16 330 41,8 22 700 58,2 4 840 12,4 Limpopo Male 31 320 45,5 8 007 25,6 23 313 74,4 7 139 22,8 Female 37 583 54,5 12 677 33,7 24 906 66,3 5 882 15,7 Total 68 903 20 684 30,0 48 219 70,0 13 021 18,9 South Africa Male 201 408 45,7 50 208 42,7 151 127 75,1 39 124 19,4 Female 238 859 54,3 67 396 57,3 171 365 71,8 42 886 18,0 Total 440 267 100,0 117 604 100,0 322 492 73,3 82 010 18,6 * These percentages show the male:female proportions ** These percentages show the proportion out of the total that wrote Source: Department of Education, 2003
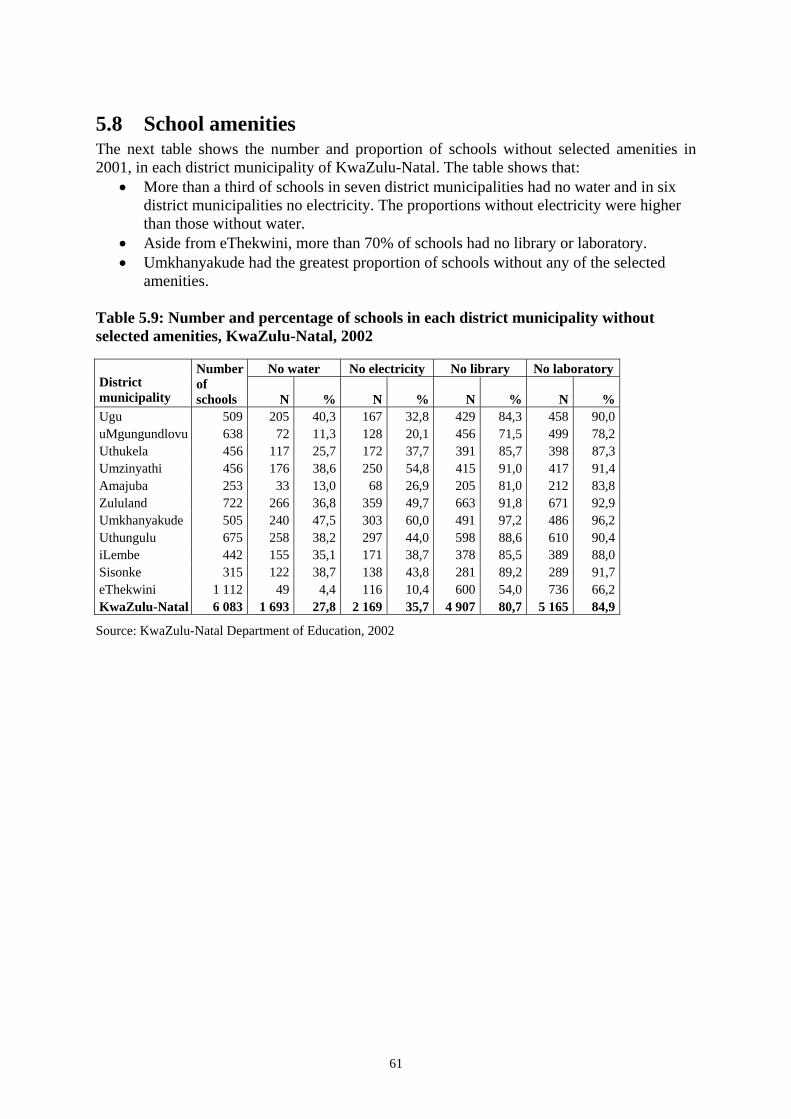
61
5.8 School amenities The next table shows the number and proportion of schools without selected amenities in 2001, in each district municipality of KwaZulu-Natal. The table shows that:
• More than a third of schools in seven district municipalities had no water and in six district municipalities no electricity. The proportions without electricity were higher than those without water.
• Aside from eThekwini, more than 70% of schools had no library or laboratory. • Umkhanyakude had the greatest proportion of schools without any of the selected
amenities. Table 5.9: Number and percentage of schools in each district municipality without selected amenities, KwaZulu-Natal, 2002
No water No electricity No library No laboratory District municipality
Number of schools N % N % N % N %
Ugu 509 205 40,3 167 32,8 429 84,3 458 90,0 uMgungundlovu 638 72 11,3 128 20,1 456 71,5 499 78,2 Uthukela 456 117 25,7 172 37,7 391 85,7 398 87,3 Umzinyathi 456 176 38,6 250 54,8 415 91,0 417 91,4 Amajuba 253 33 13,0 68 26,9 205 81,0 212 83,8 Zululand 722 266 36,8 359 49,7 663 91,8 671 92,9 Umkhanyakude 505 240 47,5 303 60,0 491 97,2 486 96,2 Uthungulu 675 258 38,2 297 44,0 598 88,6 610 90,4 iLembe 442 155 35,1 171 38,7 378 85,5 389 88,0 Sisonke 315 122 38,7 138 43,8 281 89,2 289 91,7 eThekwini 1 112 49 4,4 116 10,4 600 54,0 736 66,2 KwaZulu-Natal 6 083 1 693 27,8 2 169 35,7 4 907 80,7 5 165 84,9
Source: KwaZulu-Natal Department of Education, 2002

62
Chapter 6: Safety and security In this chapter we explore the extent to which the police report crime activities in KwaZulu-Natal and South Africa as a whole, as well as some responses from households regarding their perceptions and experiences of crime and how safe they feel.
6.1 Police stations Table 6.1 shows the number of police stations in each province in South Africa. From a total of 1 110 police stations in 2003, Eastern Cape had the highest number of police stations (194) followed by KwaZulu-Natal with 183. Table 6.1: Police stations in each province, 2003
Province N % Western Cape 146 13,2 Eastern Cape 194 17,5 Northern Cape 83 7,5 Free State 107 9,6 KwaZulu-Natal 183 16,5 North West 93 8,4 Gauteng 123 11,1 Mpumalanga 91 8,2 Limpopo 90 8,1 South Africa 1 110 100,0
Source: South African Police Service, Crime Information Analysis Centre, 2003
6.2 Murder and attempted murder Table 6.2 looks at the number of cases of murder and attempted murder and the rates per 100 000 of the population in KwaZulu-Natal from 2000 to 2002. It can be seen that while attempted murder increased in number and rate, the murder rate has stabilised. Table 6.2: Murder and attempted murder, KwaZulu-Natal, 2000–2002
Murder Attempted murder Year
No. of cases
Cases per 100 000
people
No. of cases
Cases per 100 000
people 2000 5 515 61,4 7 087 78,9 2001 5 371 58,7 7 203 78,8 2002 5 405 58,1 8 498 91,3
Source: South African Police Service, Crime Information Analysis Centre, 2003
6.3 Robbery Tables 6.3 and 6.4 show that:
• In KwaZulu-Natal there was a significant increase in the number of robberies with aggravating circumstances and other types of robbery from the year 2001 until 2003 in KwaZulu-Natal.

63
• Although there was an increase in the robbery of cash in transit cases, the figures show that this type of crime was not significant in the province of KwaZulu-Natal between the years 2001 to 2003.
• There was a sharp decline in bank robbery cases in KwaZulu-Natal between 2001 and 2003.
Table 6.3: Number of reported robberies, KwaZulu-Natal, 2001–2003
Type of robbery 2001 2002 2003 Robbery with aggravating circumstances 23 893 24 115 26 575 Other robbery 14 041 14 623 16 827 Total 39 935 40 740 45 405
Source: South African Police Service, Crime Information Analysis Centre, 2003 Table 6.4: Robbery of cash in transit and bank robbery, KwaZulu-Natal, 2001 to 2003
Type of robbery 2001 2002 2003 Robbery of cash in transit* 29 41 85 Bank robbery 50 42 18 * These two crimes are included in robbery with aggravating circumstances in the previous table Source: South African Police Service, Crime Information Analysis Centre, 2003
6.4 Rape and associated crimes Table 6.5 shows the number of cases of rape and associated crimes in KwaZulu-Natal from 2001 to 2003.
• Cases of rape and attempted rape increased steadily in KwaZulu-Natal from 9 196 in 2001 to 9 489 in 2003.
• Cases of abduction increased sharply in 2003 as compared to 2002. • Cases of kidnapping decreased considerably from 977 in 2001 to 678 in 2003.
Table 6.5: Cases of rape and associated crimes, KwaZulu-Natal, 2001–2003
Crime category 2001 2002 2003Rape and attempted rape 9 196 9 346 9 489Indecent assault 1 051 1 169 1 405Kidnapping 977 851 678Abduction 485 445 628Total 11 709 11 811 12 200
Source: South African Police Service, Crime Information Analysis Centre, 2003
6.5 Burglary Table 6.6 looks at various types of burglary in KwaZulu-Natal in the three years under discussion.
• Burglary and attempted burglary of business premises decreased from 14 946 in 2001 to 12 007 in 2003, while burglary and attempted burglary of residential premises increased from 48 297 to 52 582.
• Stock theft increased. • Theft of or out of motor vehicles decreased. • Cases of fraud decreased.

64
It should be noted firstly that these figures are of reported crimes, and secondly, in this particular dataset, that cases of theft not categorised elsewhere increased, therefore an exact interpretation of the data is difficult. Table 6.6: Number of burglaries committed, KwaZulu-Natal, 2001–2003
Crime category 2001 2002 2003 Burglary and attempted burglary: business premises 14 946 14 008 12 007 Burglary and attempted burglary: residential premises 48 297 48 503 52 582 Stock theft 9 444 9 457 10 389 Shoplifting 13 140 13 215 13 158 Theft of motor vehicles and motorcycles 17 345 17 932 16 763 Theft out of or from motor vehicles 34 306 33 259 31 936 Theft not mentioned elsewhere 90 365 96 017 95 655 Arson 1 857 1 804 1 809 Malicious damage to property 7 883 8 084 8 542 All fraud, forgeries, misappropriations, embezzlements, etc. 10 980 9 690 8 845 Total 248 563 251 969 251 686
Source: South African Police Service, Crime Information Analysis Centre, 2003
6.6 Farm attacks Table 6.7 shows the number of farm attack cases reported in all provinces from 2001 to 2003:
• Gauteng had the highest number of farm attack cases reported in all three years, followed by KwaZulu-Natal for 2000/01 and 2001/02 and Mpumalanga for 2002/03. It should be remembered that while Gauteng is primarily an urban province, there are considerable smallholding areas in Gauteng, as well as some larger farming areas.
• Northern Cape had the lowest number of farm attack cases reported in all years. • The total number of cases reported in South Africa remained the same for the first two
years and decreased considerably in 2002/03. Table 6.7: Farm attacks in each province, 2001–2003
Province 2000/2001 2001/2002 2002/2003 Total Western Cape 9 10 7 26 Eastern Cape 12 18 1 31 Northern Cape 4 2 2 8 Free State 7 5 6 18 KwaZulu-Natal 26 24 19 69 North West 17 17 14 48 Gauteng 38 34 24 96 Mpumalanga 21 23 21 65 Limpopo 6 7 9 22 Total 140 140 103 383
Source: South African Police Service, Annual Report 2002/2003

65
Figure 6.1 looks at the proportion of reported farm attacks in 2001 that resulted in murder or grievous bodily harm.
• Northern Cape had the highest percentage of farm attacks with murder (18,8%), while Free State had the highest percentage with persons suffering grievous bodily harm (46,2%).
• In KwaZulu-Natal, 14,4% of farm attacks included murder and 33,9% included serious injury.
• In the country as a whole, 10,5% of farm attacks resulted in murder and 34,6% resulted in a victim being seriously injured.
Figure 6.1: Proportion of farms attacks in which victims were murdered or seriously injured, South Africa, 2001
WesternCape
EasternCape
NorthernCape
FreeState
KwaZulu-Natal
NorthWest
Gauteng Mpuma-langa
Limpopo SouthAfr ic a
0,0
5,0
10,0
15,0
20,0
25,0
30,0
35,0
40,0
45,0
50,0%
Murder 18,8 18,5 19,0 12,8 14,4 10,7 8,5 7,2 5,9 10,5Serious injuries 39,1 41,3 23,8 46,2 33,9 29,9 29,8 38,8 36,9 34,6 Source: South African Police Service, Annual Report, 2002/2003

66
Chapter 7: The labour market Data used in this section were mainly derived from the Labour Force Survey of September 2004. Where the breakdown is at district municipality level, data are from Census 2001, as information at that level is not obtainable from regular household surveys.
7.1 Labour market status of the population of working age Table 7.1 below shows the labour market status of the working-age population (15–65 years) in each population group in KwaZulu-Natal in September 2004. The following can be observed:
• The white population group had the largest percentage of employed people (63,8%), followed by the Indian/Asian (49,0%), black African (31,6%) and coloured (30,9%) population groups.
• Regarding unemployment, 17,1% of the coloured people of working age were unemployed, followed by 15,5% of the black African, 9,5% of the Indian/Asian and 2,4% of the white population group.
• A large percentage of the working-age population in KwaZulu-Natal was not economically active (50,5%) and 14,2% was unemployed, whereas only 35,3% of the population was employed.
Table 7.1: Labour market status of the working-age population (15–65 years) in each population group, KwaZulu-Natal, 2004
Black African Coloured Indian or Asian White Total Labour market status N % N % N % N % N % Employed 1 530 554 31,6 42 879 30,9 293 121 49,0 218 074 63,8 2 092 406 35,3 Unemployed 751 019 15,5 23 752 17,1 57 033 9,5 8 225 2,4 840 551 14,2 NEA* 2 559 906 52,9 72 132 52,0 248 511 41,5 115 635 33,8 2 997 997 50,5 Total 4 841 478 100,0 138 763 100,0 598 666 100,0 341 933 100,0 5 930 954 100,0 * NEA = not economically active Source: Statistics South Africa, Labour Force Survey September 2004 Table 7.2 and Figure 7.1 examine labour market status by sex, comparing KwaZulu-Natal with the rest of South Africa. It can be seen that:
• Of the employed in KwaZulu-Natal in September 2004, 54,4% were male and 45,6% were female, compared to 58,2% of males and 41,8% of females in South Africa. In other words the sex balance of employment was more even in KwaZulu-Natal than nationally.
• Of the unemployed, 48,7% were males and 51,3% were females, compared with 49,1% and 50,9% respectively in South Africa. These proportions are very similar.
• More females than males were not economically active, both in KwaZulu-Natal and in the country as a whole.

67
Table 7.2: Labour market status by sex, KwaZulu-Natal and South Africa, September 2004
KwaZulu-Natal South Africa Labour market status Male Female Total Male Female Total Employed 1 137 276 955 131 2 092 406 6 771 686 4 865 868 11 642 728 Unemployed 409 521 431 030 840 551 2 028 510 2 103 153 4 135 381 NEA* 1 183 782 1 814 215 2 997 997 5 393 671 8 127 739 13 526 502 Total 2 730 579 3 200 376 5 930 954 14 193 867 15 096 760 29 304 612 * NEA = not economically active Source: Statistics South Africa, Labour Force Survey September 2004 Figure 7.1: Labour market status of the working-age population by sex, KwaZulu-Natal and South Africa, September 2004
M ale (KZN) M ale (RSA) Fem ale (KZN) Fem ale (RSA)0,0
10,0
20,0
30,0
40,0
50,0
60,0
70,0%
Employed 54,4 58,2 45,6 41,8Unemployed 48,7 49,1 51,3 50,9
NEA 39,5 39,9 60,5 60,1 * NEA = not economically active Source: Statistics South Africa, Labour Force Survey September 2004
7.2 Labour market indicators The unemployment rate is the proportion of the economically active that is not employed. It is therefore larger than the percentages of unemployed shown above, as it is calculated out of a smaller universe. This indicator is widely used in conjunction with the labour participation and labour absorption rates to assess labour market performance. The labour market participation rate defines the proportion of economically active, whether employed or not employed, out of the total population of working age. The lower the participation rate, the larger the proportion of people that are out of the labour force, that is, not even looking for employment.

68
The labour absorption rate is the percentage of employed out of the total population of working age. This criterion is indicative of employment opportunities in the economy. The higher the labour absorption rate, the greater the degree to which people are engaged in productive economic activities. The three labour market indicators for 2004 are shown in Table 7.3 and Figure 7.2 below:
• Eastern Cape had the highest unemployment rate (29,6%), followed by KwaZulu-Natal (28,7%) and Free State (28,6%).
• Western Cape had the highest labour participation rate, indicating that a smaller proportion than that in other provinces was not economically active. This was followed closely by Gauteng (65,9%).
• Western Cape and Gauteng also had the highest labour absorption rates (53,7% and 49,0% respectively). These two findings reflect the employment opportunities of the more urban provinces.
Table 7.3: Labour market indicators in each province, South Africa, 2004
Economically active
Province Employed Unemployed Total NEA
Working-age population
(15–65 years)
Unemploy- ment rate LPR LAR
Western Cape 1 691 128 386 616 2 077 744 1 069 302 3 147 046 18,6 66,0 53,7
Eastern Cape 1 277 582 536 474 1 814 056 2 191 170 4 005 226 29,6 45,3 31,9 Northern Cape 228 792 74 045 302 837 264 690 567 527 24,5 53,4 40,3 Free State 777 074 311 427 1 088 501 820 945 1 909 446 28,6 57,0 40,7 KwaZulu-Natal 2 092 406 840 551 2 932 957 2 997 997 5 930 954 28,7 49,5 35,3 North West 834 824 324 639 1 159 463 1 239 711 2 399 174 28,0 48,3 34,8 Gauteng 3 069 516 1 062 496 4 132 012 2 135 447 6 267 459 25,7 65,9 49,0 Mpumalanga 788 674 260 011 1 048 685 894 893 1 943 577 24,8 54,0 40,6 Limpopo 882 734 339 122 1 221 856 1 912 347 3 134 202 27,8 39,0 28,2 South Africa 11 642 728 4 135 381 15 778 110 13 526 502 29 304 612 26,2 53,8 39,7 LPR = labour participation rate LAR = labour absorption rate Source: Statistics South Africa, Labour Force Survey September 2004

69
Figure 7.2: Labour market indicators by province, South Africa, 2004
WesternCape
EasternCape
NorthernCape
FreeState
KwaZulu-Natal
NorthWest
Gauteng Mpuma-langa
Limpopo0,0
10,0
20,0
30,0
40,0
50,0
60,0
70,0%
Unemployment rate 18,6 29,6 24,5 28,6 28,7 28,0 25,7 24,8 27,8Labour participation rate 66,0 45,3 53,4 57,0 49,5 48,3 65,9 54,0 39,0
Labour absorption rate 53,7 31,9 40,3 40,7 35,3 34,8 49,0 40,6 28,2 Source: Statistics South Africa, Labour Force Survey September 2004
7.3 Formal and informal sector employment Table 7.4 shows employment in the formal and informal sectors by province in September 2004. The following is observed:
• Gauteng had the largest proportion of the country’s formal sector employment (28,2%), followed by Western Cape (17,1%) and KwaZulu-Natal (16,9%).
• Gauteng also provided the largest proportion of informal sector employment (20,8%). KwaZulu-Natal and Eastern Cape had the next largest proportions with 19,6% and 17,9% respectively.
Table 7.4: Formal and informal sectors by province, September 2004
Formal Informal Total Province N ('000) % N ('000) % N ('000) % Western Cape 1 419 17,1 166 7,1 1 584 14,8 Eastern Cape 743 8,9 426 17,9 1 169 10,9 Northern Cape 184 2,2 21 0,9 206 1,9 Free State 597 7,2 123 5,2 720 6,7 KwaZulu-Natal 1 407 16,9 465 19,6 1 872 17,5 North West 577 6,9 184 7,7 751 7,1 Gauteng 2 346 28,2 494 20,8 2 839 26,6 Mpumalanga 502 6,1 221 9,3 723 6,8 Limpopo 543 6,5 273 11,5 816 7,6 Total 8 318 100,0 2 372 100,0 10 690 100,0 Totals exclude domestic workers and unspecified Source: Statistics South Africa, Labour Force Survey September 2004

70
Table 7.5 looks at formal and informal sector employment in KwaZulu-Natal by population group. It shows that:
• Informal sector workers were found mostly among African males and females and coloured males.
• It is also noticeable that of the employed black African population, far more women than men were employed in the informal sector.
Table 7.5: The employed by sector, population group and sex, KwaZulu-Natal, 2004 (percentage)
Black African Coloured Indian/Asian White Sector Male Female Male Female Male Female Male Female Formal 72,9 59,1 80,0 100,0 90,1 93,6 96,0 96,7 Informal 27,1 40,7 20,0 0,0 9,9 6,4 4,0 3,3 Total 100,0 100,0 100,0 100,0 100,0 100,0 100,0 100,0
Source: Statistics South Africa, Labour Force Survey September 2004
7.4 Industry and occupation Figure 7.3 below compares the proportions of males and females employed in each economic sector in KwaZulu-Natal and South Africa in 2004. The following observations are made:
• Wholesale and retail trade was the largest employer with 22,2% of the employed in South Africa and 21,5% in KwaZulu-Natal, followed by community, social and personal services with 19,5% in South Africa and 18,8% in KwaZulu-Natal.
• Manufacturing accounted for 18,0% and 14,4% of employment in KwaZulu-Natal and South Africa respectively.
• Mining and quarrying accounted for the smallest employment sector in KwaZulu-Natal (0,2%), while electricity, gas and water was the smallest sector nationally (0,8%).

71
Figure 7.3: Distribution of the employed of working age by main industry and sex, KwaZulu-Natal and South Africa, September 2004
Male (KZN) Female (KZN) Total (KZN) Male (RSA) Female (RSA) Total (RSA)0,0
5,0
10,0
15,0
20,0
25,0
30,0%
Agriculture,hunting, forestry and fishing
9,2 10,9 10,0 10,4 7,4 9,1
Mining and quarrying 0,4 0,0 0,2 5,8 0,2 3,5Manufacturing 20,8 15,2 18,3 16,5 12,3 14,7
Electricity, gas and w ater supply
0,8 0,5 0,6 1,1 0,5 0,8
Construction 9,0 1,9 5,4 11,0 1,6 6,3Wholesale and retail trade 21,3 21,7 21,5 19,9 24,6 22,2
Transport, storage and communication
9,6 2,1 5,9 6,5 2,5 4,5
F inancial intermediation insurance, real estate, and business service
9,6 5,5 7,5 10,3 9,3 9,8
Community, social and personal service
15,9 21,6 18,8 14,9 24,2 19,5
Private households w ith employed persons
3,2 20,4 11,8 3,4 17,4 10,4
Source: Statistics South Africa, Labour Force Survey September 2004 We now examine the occupations of the employed. Table 7.6 below shows that:
• Elementary occupations accounted for the largest proportion of the working population in both South Africa and KwaZulu-Natal (22,5% and 19,5% respectively).
• The next largest groups were service, shop and market workers, and craft and related trade workers.
• Skilled agriculture and fishery workers accounted for the smallest proportions of workers in KwaZulu-Natal (4,7%) and in the country as a whole (2,8%).
Table 7.6: Employment by occupational category, KwaZulu-Natal and South Africa, September 2004
KwaZulu-Natal South Africa Main occupation N ('000) % N ('000) % Legislator, senior officials and managers 172 8,2 910 7,8 Professionals 89 4,2 458 3,9 Technical and associate professionals 208 10,0 1 149 9,9 Clerks 174 8,3 1 169 10,0 Service workers and shop and market sale workers 265 12,6 1 453 12,5 Skilled agricultural and fishery workers 98 4,7 329 2,8 Craft and related trade workers 258 12,3 1 538 13,2 Plant and machine operators and assemblers 216 10,3 1 113 9,6 Elementary occupations 407 19,5 2 619 22,5 Domestic workers 203 9,7 881 7,6 Total 2 092 100,0 11 643 100,0 Totals include ‘don't know’ and unspecified sector Source: Statistics South Africa, Labour Force Survey September 2004

72
7.5 Employment in formal agriculture Table 7.7 below shows employment and total remuneration in formal agriculture by province in 2002. The following is observed:
• The lowest percentage of full-time workers in the agricultural sector was found in Gauteng and Northern Cape (4,5% and 7,1% respectively).
• Western Cape had the highest percentage of casual and seasonal workers (25,5%) followed by Northern Cape and Free State (15,9% and 13,5% respectively).
• It is notable that the percentage casual and seasonal workers in KwaZulu-Natal was much lower than the percentage of full-time workers.
Table 7.7: Employment in formal agriculture in each province by full-time/casual, South Africa, 2002
Owners/proprietors Full-time workers Casual and seasonal
workers
Province N % N %
N % Western Cape 7 283 15,8 94 659 19,7 117 149 25,5 Eastern Cape 5 597 12,2 36 442 7,6 33 504 7,3 Northern Cape 6 948 15,1 34 195 7,1 73 072 15,9 Free State 8 576 18,6 61 277 12,7 62 152 13,5 KwaZulu-Natal 3 775 8,2 79 662 16,5 37 545 8,2 North West 5 516 12,0 39 587 8,2 45 060 9,8 Gauteng 1 320 2,9 21 492 4,5 9 054 2,0 Mpumalanga 3 947 8,6 68 297 14,2 51 767 11,3 Limpopo 3 065 6,7 45 750 9,5 30 141 6,6 South Africa 46 027 100,0 481 371 100,0 459 444 100,0
Source: Statistics South Africa, Census of commercial agriculture, 2002
7.6 Income of the employed Table 7.8 and Figure 7.4 show that:
• Some 3,8% of the employed had no income in KwaZulu-Natal in 2004, compared with 3,0% in South Africa a whole. This probably reflects persons working for payment in kind, such as food or accommodation.
• Overall the proportion of the employed in the lower income categories was larger in KwaZulu-Natal than nationally.

73
Table 7.8: Distribution of the working-age population by gross monthly income and population group, KwaZulu-Natal and South Africa, September 2004
KwaZulu-Natal South Africa
Income category Black
African Coloured Indian/
Asian White Total Black
African Coloured Indian/
Asian White Total N ('000) None 77 - 1 - 79 331 5 2 8 347 R1–R500 290 1 5 1 297 1 438 83 7 21 1 550 R501–R1 000 369 1 15 4 389 1 733 220 17 31 2 004 R1 001–R2 500 422 11 77 13 525 2 210 355 95 139 2 807 R2 501–R8 000 307 22 141 76 546 1 617 366 186 688 2 859 R8 001+ 44 6 34 82 174 228 53 59 586 938 Total 1 531 43 293 218 2 092 7 874 1 298 419 2 016 11 643 Totals include unspecified Source: Statistics South Africa, Labour Force Survey September, 2004 Figure 7.4: Percentage distribution of the working-age population by individual gross monthly income, KwaZulu-Natal and South Africa, 2004
KwaZulu-Natal
South Africa0,0
5,0
10,0
15,0
20,0
25,0
30,0%
None 3,8 3,0R1-R500 14,2 13,3
R501-R1 000 18,6 17,2R1 001-R2 500 25,1 24,1R2 501-R8 000 26,1 24,6
R8 001+ 8,3 8,1 Excluding unspecified Source: Statistics South Africa, Labour Force Survey September 2004

74
Chapter 8: Households and household services This chapter deals with households and services provided to these households. Data are from the General Household Survey of 2004, except where information is given at district municipality level, for which Census 2001 data are used.
8.1 Distribution of households by province Table 8.1 and Figure 8.1 below show the distribution of total households by province in South Africa in 2004, as background to the analyses that follow. The following observations are made:
• There were approximately 12 194 000 households in South Africa in 2004. • Gauteng had the highest proportion of households (22,5%), followed by KwaZulu-
Natal (19,5%) and Eastern Cape (13,5%). • Northern Cape had the lowest proportion of households (1,9%), followed by
Mpumalanga (6,6%) and Free State (6,9%). Table 8.1: Distribution of total households by province, South Africa, 2004
Province N ('000) % Western Cape 1 228 10,1 Eastern Cape 1 651 13,5 Northern Cape 236 1,9 Free State 844 6,9 KwaZulu-Natal 2 380 19,5 North West 1 022 8,4 Gauteng 2 747 22,5 Mpumalanga 805 6,6 Limpopo 1 283 10,5 South Africa 12 194 100,0
Source: Statistics South Africa, General Household Survey 2004 Figure 8.1: Percentage distribution of total households by province, 2004
WesternCape10,1%
EasternCape13,5%
NorthernCape1,9%
FreeState6,9%
KwaZulu-Natal19,5%
NorthWest8,4%
Gauteng22,5%
Mpumalanga6,6%
Limpopo10,5%
Source: Statistics South Africa, General Household Survey 2004

75
Figure 8.2 looks at the households in KwaZulu-Natal according to the population group of the household head. As households can contain people of different population groups, the household head is used as a proxy for the household with regard to this variable.
• In KwaZulu-Natal, the largest proportion of households was headed by black Africans (82%), followed by the Indian/Asian (9,0%) and white population (8,0%).
• The lowest proportion was coloured-headed households (1,0%).
Figure 8.2: Percentage distribution of households by population group of the household head, KwaZulu-Natal, 2004
Black African81,5%
Coloured1,4%
Indian/Asian8,9%
White8,2%
Source: Statistics South Africa, General Household Survey 2004
8.2 Housing tenure Figure 8.3 below shows the tenure status of households’ dwellings in KwaZulu-Natal. It is observed that:
• Approximately 44% of households occupied dwellings that were owned and fully paid off, 13% were owned but not yet fully paid off, 18% were rented, and 25% of KwaZulu-Natal households were occupied rent-free. It should be noted that ‘owned and fully paid off’ could include Reconstruction and Development Programme (RDP) houses.
Figure 8.3: Tenure status of households, KwaZulu-Natal, 2001
Source: Statistics South Africa, Population Census 2001
Owned and fully paid off 43,0%
Owned but not
yet paid off 13,4%
Rented 18,4%
Occupied rent-free 25,2%

76
Table 8.2 and Figure 8.4 below show the tenure status of households’ dwellings in each district municipality in KwaZulu-Natal in 2001. The following observations are made:
• In all district municipalities the largest proportion of households lived in dwellings that were owned and fully paid off.
• Ugu had the highest proportion of households in such dwellings (55,4%), followed by Umzinyathi (50,4%), and then uMgungundlovu (46,4%) and Zululand (45,9%).
• eThekwini had the largest proportion of households owned but not yet paid off (18,7%) (reflecting property being purchased through a mortgage), followed by uMgungundlovu (14,6%) and then Amajuba (11,6%).
• Amajuba had the largest proportion of rented households (29,7%), followed by eThekwini (25,1%) and iLembe (18,3%).
• In all district municipalities except eThekwini, the proportion of households that occupied rent-free dwellings was higher than 20%.
Table 8.2: Tenure status of households’ dwellings within district municipality, KwaZulu-Natal, 2001
Owned and fully paid off
Owned but not yet paid off Rented
Occupied rent-free Total District
municipality N % N % N % N % N % Ugu 83 438 55,4 11 446 7,6 17 414 11,6 3 813 2,5 150 611 100,0 uMgungundlovu 100 581 46,4 31 623 14,6 34 867 16,1 49 572 22,9 216 643 100,0 Uthukela 52 643 39,0 12 291 9,1 21 707 16,1 48 204 35,7 134 846 100,0 Umzinyathi 45 374 50,4 6 633 7,4 9 321 10,3 28 778 31,9 90 106 100,0 Amajuba 35 578 36,8 11 194 11,6 28 728 29,7 21 171 21,9 96 670 100,0 Zululand 66 529 45,9 13 379 9,2 13 011 9,0 52 035 35,9 144 955 100,0 Umkhanyakude 38 174 37,6 8 970 8,8 5 326 5,2 49 092 48,3 101 563 100,0 Uthungulu 68 751 40,1 19 565 11,4 26 038 15,2 57 126 33,3 171 480 100,0 iLembe 47 049 39,1 10 885 9,0 21 979 18,3 40 477 33,6 120 390 100,0 Sisonke 30 520 42,2 5 574 7,7 8 588 11,9 27 558 38,1 72 240 100,0 eThekwini 328 144 41,7 147 290 18,7 197 128 25,1 114 185 14,5 786 746 100,0 Total 896 782 43,0 278 850 13,4 384 107 18,4 526 512 25,2 2 086 250 100,0
Source: Statistics South Africa, Population Census 2001

77
Figure 8.4: Percentage of households by tenure status and district municipality, KwaZulu-Natal, 2001
Ugu uMgung-undlovu
Uthukela Umzin-yathi
Amajuba Zululand Umkhanya-kude
Uthungulu iLembe Sisonke eThekw ini0,0
10,0
20,0
30,0
40,0
50,0
60,0%
Ow ned and fully paid off 55,4 46,4 39,0 50,4 36,8 45,9 37,6 40,1 39,2 42,2 41,7Ow ned but not yet paid off 7,6 14,6 9,1 7,4 11,6 9,2 8,8 11,4 9,0 7,7 18,7
Rented 11,6 16,1 16,1 10,3 29,7 9,0 5,2 15,2 18,3 11,9 25,1Occupied rent-free 2,5 22,9 35,7 31,9 21,9 35,9 48,3 33,3 33,6 38,1 14,5
Source: Statistics South Africa, Population Census 2001
8.3 Dwelling type Table 8.3 shows the number and percentage of households living in each type of dwelling in KwaZulu-Natal in 2004. It can be seen that approximately 46,2% of households in KwaZulu-Natal lived in a house on a separate stand, and 23,8% in traditional dwellings. Table 8.3: Distribution of households by type of dwelling, KwaZulu-Natal, 2004
Type of dwelling N ('000) % House on separate stand or yard or on farm 1 098 46,1 Traditional dwelling 566 23,8 Flat 191 8,0 Town/cluster/semi-detached house 78 3,3 Unit in retirement village 2 0,1 Dwelling/house/flat/room in backyard 59 2,5 Informal dwelling/shack in backyard 52 2,2 Informal dwelling/shack not in backyard 166 7,0 Room/flatlet not in backyard but on shared property 164 6,9 Other 2 0,1 Total 2 380 100,0 Total includes unspecified type of dwelling Source: Statistics South Africa, General Household Survey 2004 Table 8.4 looks at the type of dwelling in KwaZulu-Natal by population group of the household head.
• The black African population occupied the largest percentage of informal dwellings in KwaZulu-Natal (11,2%), followed by the Indian/Asian population (0,9%).

78
• The largest percentage of traditional dwellings was occupied by black African residents (28,9%), followed by the Indian/Asian (2,8%) population group.
• Overall, the largest percentage (66,8%) of households for all population groups in KwaZulu-Natal was living in formal dwellings in 2004.
Table 8.4: Distribution of households by type of dwelling and population group of household head, KwaZulu-Natal, 2004
Black African Coloured Indian/Asian White Total Type of dwelling N ('000) % N ('000) % N ('000) % N ('000) % N ('000) % Formal 1 159 59,8 34 100,0 204 95,8 192 98,5 1 590 66,8 Informal 216 11,2 0 0,0 2 0,9 0 0,0 218 9,2 Traditional 559 28,9 0 0,0 6 2,8 0 0,0 566 23,8 Other 1 0,1 0 0,0 - - 3 1,5 5 0,2 Total 1 937 100,0 34 100,0 213 100,0 195 100,0 2 380 100,0
Total includes unspecified type of dwelling Numbers are rounded to the nearest thousand; numbers lower than 950 households are not given here Source: Statistics South Africa, General Household Survey 2004
8.4 Female-headed households Table 8.5 shows female-headed households by province. Female-headed households partly reflect migrant labour among males, but they also include households headed by single, widowed or divorced women. The table reveals that:
• The number of female-headed households in South Africa in 2004 was approximately 4,5 million.
• KwaZulu-Natal was the province with the largest number of female-headed households (approximately 1 million), followed by Eastern Cape (778 000) and Gauteng (760 000).
• Limpopo had the highest proportion of female-headed households in 2004 (50,3%), followed by Eastern Cape (47,1%) and KwaZulu-Natal (42,9%).
Table 8.5: Number and proportion of female-headed households in each province, September 2004
Province
Female-headed households
('000)
Totalhouseholds
('000) % Western Cape 360 1 228 29,3 Eastern Cape 778 1 651 47,1 Northern Cape 68 236 28,8 Free State 244 844 28,9 KwaZulu-Natal 1 020 2 380 42,9 North West 358 1 022 35,0 Gauteng 760 2 747 27,7 Mpumalanga 291 805 36,1 Limpopo 645 1 283 50,3 Total 4 525 12 194 37,1
Source: Statistics South Africa, General Household Survey 2004

79
Table 8.6 below examines female-headed households in the district municipalities of KwaZulu-Natal in 2001. The following observations are made:
• eThekwini had the highest percentage of female-headed households (31,4%), followed by uMgungundlovu (10,6%), and Uthungulu (8,8%).
• Sisonke had the lowest percentage of female-headed households (4,1%). Table 8.6: Number and percentage of female-headed households by district municipality, KwaZulu-Natal, 2001
District municipality N % Ugu 82 822 8,3 uMgungundlovu 106 627 10,6 Uthukela 72 559 7,2 Umzinyathi 56 830 5,7 Amajuba 44 052 4,4 Zululand 80 799 8,1 Umkhanyakude 53 512 5,3 Uthungulu 88 280 8,8 iLembe 61 245 6,1 Sisonke 41 248 4,1 eThekwini 314 512 31,4 Total 1 001 885 100,0
Source: Statistics South Africa, Population Census 2001 Lastly we look at the incidence of female-headed households across the population groups in KwaZulu-Natal. Table 8.7 and Figure 8.5 below show that:
• Black African residents had the largest percentage of female-headed households (90,6%), followed by the Indian/Asian population group (4,4%).
Table 8.7: Female-headed households by population group of the household head, KwaZulu-Natal, 2004
Population group N ('000) % Black African 924 90,6 Coloured 14 1,4 Indian/Asian 44 4,4 White 37 3,7 Total 1 020 100,0
Source: Statistics South Africa, General Household Survey 2004

80
Figure 8.5: Percentage distribution of female-headed households by population group, KwaZulu-Natal, 2004
Black Af rican90,5%
Coloured1,4%
Indian/Asian4,4%
White3,7%
Source: Statistics South Africa, General Household Survey 2004
8.5 Child-headed households Child-headed households are becoming more common with the increase in the number of AIDS orphans. Figure 8.6 below shows the distribution of child-headed households in South Africa by province and age group. Once more these data are from Census 2001.
• Limpopo had the highest total number of child-headed households (58 025), followed by Eastern Cape (42 249), KwaZulu-Natal (41 027) and Gauteng (32 224).
Figure 8.6: Distribution of child-headed households by province and age group, South Africa, 2001
WesternCape
EasternCape
NorthernCape
FreeState
KwaZulu-Natal
NorthWest
Gauteng Mpuma-langa
Limpopo0
10 000
20 000
30 000
40 000
50 000
60 000
70 000
10-14 290 3 393 287 682 2 974 879 895 1 266 4 80415-19 10 642 38 856 3 452 15 463 38 053 19 086 31 330 19 617 53 221Total 10 932 42 249 3 739 16 145 41 027 19 964 32 224 20 883 58 025
Source: Statistics South Africa, Population Census 2001
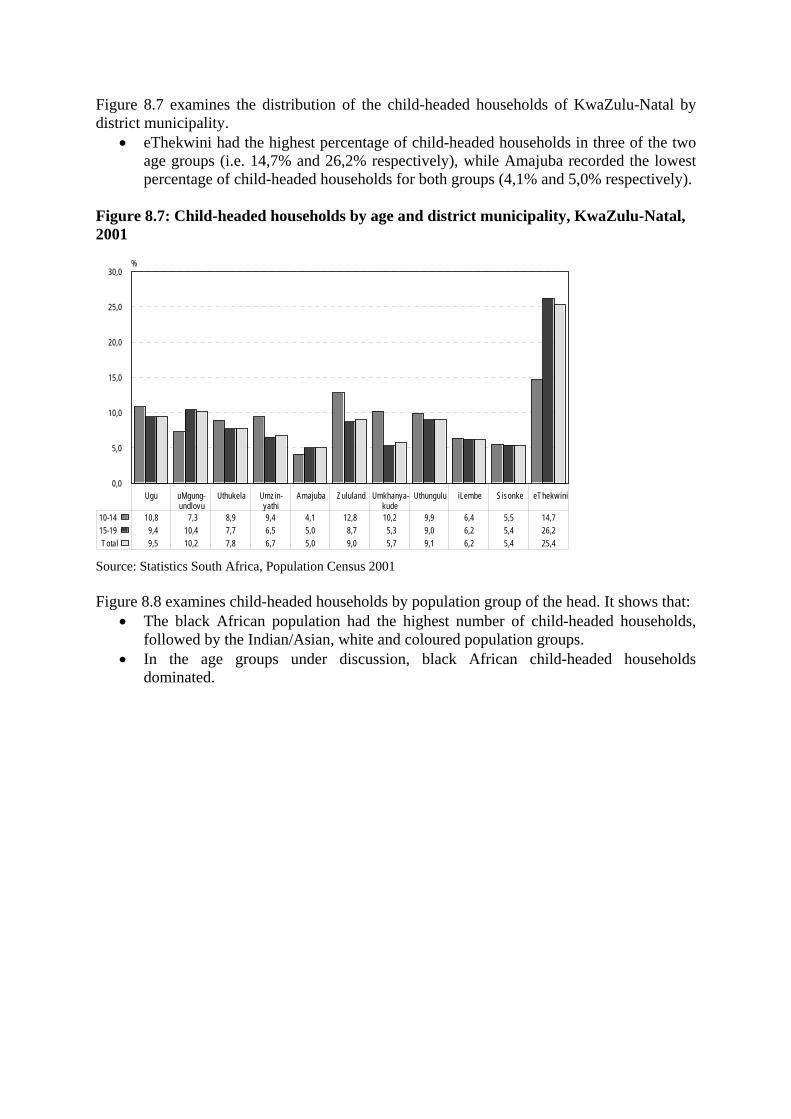
81
Figure 8.7 examines the distribution of the child-headed households of KwaZulu-Natal by district municipality.
• eThekwini had the highest percentage of child-headed households in three of the two age groups (i.e. 14,7% and 26,2% respectively), while Amajuba recorded the lowest percentage of child-headed households for both groups (4,1% and 5,0% respectively).
Figure 8.7: Child-headed households by age and district municipality, KwaZulu-Natal, 2001
Ugu uMgung-undlovu
Uthukela Umzin-yathi
Amajuba Zululand Umkhanya-kude
Uthungulu iLembe Sisonke eThekw ini0,0
5,0
10,0
15,0
20,0
25,0
30,0%
10-14 10,8 7,3 8,9 9,4 4,1 12,8 10,2 9,9 6,4 5,5 14,715-19 9,4 10,4 7,7 6,5 5,0 8,7 5,3 9,0 6,2 5,4 26,2Total 9,5 10,2 7,8 6,7 5,0 9,0 5,7 9,1 6,2 5,4 25,4
Source: Statistics South Africa, Population Census 2001 Figure 8.8 examines child-headed households by population group of the head. It shows that:
• The black African population had the highest number of child-headed households, followed by the Indian/Asian, white and coloured population groups.
• In the age groups under discussion, black African child-headed households dominated.

82
Figure 8.8: Child-headed households by age and population group, KwaZulu-Natal, 2001
10-14 15-19 T otal0
5 000
10 000
15 000
20 000
25 000
30 000
35 000
40 000
Black African 2 938 36 324 39 262Coloured 7 227 235
Indian/As ian 19 780 799White 9 722 731
Source: Statistics South Africa, Population Census 2001
8.6 Energy We now look at services provided to households using 2004 General Household Survey data. Figure 8.9 below examines the source of energy used by households in KwaZulu-Natal and South Africa. The following observations are made:
• In both KwaZulu-Natal and South Africa, electricity was the most commonly used source of energy for cooking, heating and lighting. This was followed by wood for cooking and heating, in the case of KwaZulu-Natal, except for lighting where candles were used.
Figure 8.9: Distribution of households by energy sources for cooking, heating and lighting, KwaZulu-Natal and South Africa, 2004
Cooking (KZN) Cooking (RSA) Heating (KZN) Heating (RSA) Lighting (KZN) Lighting (RSA)0,0%
20,0%
40,0%
60,0%
80,0%
100,0%%
Unspecified 0,2 0,1 0,3 0,1 0,3 0,1None 0,1 0,5 12,7 0,0 0,0 0,0Other 0,0 0,5 0,0 0,0 0,0 0,0
Solar energy 0,0 0,0 0,0 0,2 0,3 0,2Animal dung 0,3 0,4 0,3 0,0 0,0 0,0
Candles 0,0 0,0 0,0 15,0 26,4 15,0Coal 1,4 2,5 2,0 0,0 0,0 0,0
Wood 22,9 19,8 27,2 0,0 0,0 0,0Paraffin 13,7 15,1 5,4 4,3 0,8 4,3
Gas 2,0 1,7 0,9 0,2 0,0 0,2Generator 0,0 0,0 0,0 0,1 0,1 0,1Electric ity 59,3 59,3 51,2 80,2 72,0 80,2
For all values lower than 1 000 the sample size is too small for reliable estimates Source: Statistics South Africa, General Household Survey 2004

83
8.7 Water Figure 8.10 shows the distribution of households by source of water in KwaZulu-Natal and South Africa in 2004:
• Of all the households in KwaZulu-Natal, 34,9% had piped water inside the dwelling, compared with 38,7% of households in South Africa as a whole.
• KwaZulu-Natal also lagged behind the country in the next category, dwellings with piped water in the yard (23,8% of households in KwaZulu-Natal, compared with 29,1% of households nationally).
• In KwaZulu-Natal 8,4% of households used water from rivers or streams, compared with 5,2% of households in South Africa as a whole.
Figure 8.10: Percentage distribution of households by main source of water, KwaZulu-Natal and South Africa, 2004
KwaZulu-Natal South Africa0,0
20,0
40,0
60,0
80,0
100,0%
Other 0,0 0,2Spring 1,5 2,0
Well 2,4 1,2Dam/pool/stagnant water 0,9 0,6
F lowing water/stream/river 8,4 5,2Borehole off site/communal 6,9 2,8
Water carrier/tanker 1,0 0,7Public tap 17,3 15,2
Neighbour's tap 2,1 2,3Rain-water tank on site 0,5 0,3
Borehole on site 0,2 1,7Piped (tap) water on site or in yard 23,7 29,1
Piped (tap) water in dwelling 34,9 38,7
Total includes unspecified main source of water Source: Statistics South Africa, General Household Survey 2004 Table 8.8 examines the main source of water by population group of the household head. The following can be observed:
• The majority of households headed by the white, Indian/Asian and coloured population groups in KwaZulu-Natal had piped water inside their dwellings.
• Of those households headed by black African residents in KwaZulu-Natal, 28,8% had piped (tap) water on site or in their yards.
• On average, 34,9% of households in KwaZulu-Natal in 2004 had piped (tap) water in their dwellings.

84
Table 8.8: Distribution of households by main source of water and population group, KwaZulu-Natal, 2004 (percentage)
Main source of water Black
African Coloured Indian/Asian White Total Piped (tap) water in dwelling 20,5 94,1 97,2 99,5 34,9 Piped (tap) water on site or in yard 28,8 5,9 1,9 1,0 23,7 Borehole on site 0,2 0,0 0,0 0,0 0,2 Rain-water tank on site 0,7 0,0 0,0 0,0 0,5 Neighbour's tap 2,5 0,0 0,0 0,0 2,1 Public tap 21,1 2,9 0,9 0,0 17,3 Water-carrier/tanker 1,2 0,0 0,0 0,0 1,0 Borehole off site/communal 8,5 0,0 0,0 0,0 6,9 Flowing water/stream/river 10,4 0,0 0,0 0,0 8,4 Dam/pool/stagnant water 1,1 0,0 0,0 0,0 0,9 Well 3,0 0,0 0,0 0,0 2,4 Spring 1,8 0,0 0,0 0,0 1,5 Total 100,0 100,0 100,0 100,0 100,0
Source: Statistics South Africa, General Household Survey 2004 Figure 8.11 examines the source of water by district municipality, using Census 2001 data. It shows that:
• eThekwini had the highest percentage of households with piped water inside the dwelling (51,2%), followed by uMgungundlovu with 31,4%.
• In Ugu district municipality 31,5% of households used water from rivers or streams as their main source.
• On average, more than 10% of households in each district municipality in KwaZulu-Natal had piped water inside their yards.
Figure 8.11: Distribution of households by source of water and district municipality, KwaZulu-Natal, 2001 (percentage)
Ugu uMgung-undlovu
Uthukela Umzin-yathi
Amajuba Zululand Umkhan-yakude
Uthungulu iLembe Sisonke eThekwini0,0
20,0
40,0
60,0
80,0
100,0Percentage
Other 2,9 2,2 2,5 1,8 2,7 3,0 3,5 2,9 3,0 1,9 2,2Water vendor 0,9 0,4 1,1 0,9 0,5 1,0 1,1 0,7 2,4 0,3 0,7River/stream 31,5 6,3 6,2 31,8 2,7 24,5 24,1 24,3 28,4 15,9 1,3
Dam/pool/stagnant water 4,1 1,0 2,7 2,9 1,1 4,2 6,3 3,9 2,3 3,5 0,2Rain-water tank 1,5 0,5 0,8 1,1 0,7 1,2 1,6 1,0 2,2 1,0 0,1
Spring 4,0 3,1 8,7 6,7 1,3 7,7 6,0 3,7 4,0 9,4 0,2Borehole 4,9 1,4 10,3 8,1 12,6 6,9 13,2 4,8 3,4 5,0 0,3
Piped water on community stand:
distance greater than 200 m from dwelling 15,7 11,2 18,6 13,5 15,5 14,4 17,9 10,4 11,6 11,1 12,0
Piped water on community stand: distance less than
200 m from dwelling 8,4 9,4 11,9 7,9 12,2 7,5 8,5 6,2 7,9 10,0 12,4
Piped water inside yard 10,1 33,0 20,6 15,1 26,6 20,1 12,9 24,5 19,4 28,7 19,4
Piped water inside dwelling 16,0 31,4 16,7 10,2 24,0 9,6 4,7 17,7 15,2 13,2 51,2
Source: Statistics South Africa, Population Census 2001

85
8.8 Toilet facilities Table 8.9 looks at the main toilet facility used by households. It shows that:
• Approximately 31,4% of KwaZulu-Natal households had a flush toilet in the dwelling connected to the sewerage system, compared with 35,5% of all the households in South Africa.
• About 8,5% of KwaZulu-Natal households had no toilet facilities, compared with 9,0% of all households in South Africa.
Table 8.9: Distribution of households by toilet facility, KwaZulu-Natal and South Africa, 2004
KwaZulu-Natal South Africa Sanitation facility N ('000) % N ('000) % Sanitation in dwelling Flush toilet connect to a public sewerage system 747 31,4 4 325 35,5 Flush toilet connected to a septic tank 50 2,1 189 1,5 Sanitation on site Flush toilet connected to a public sewerage system 209 8,8 2 082 17,1 Flush toilet connected to a septic tank 48 2,0 240 2,0 Chemical toilet 21 0,9 44 0,4 Pit latrine with ventilation pipe 241 10,1 859 7,0 Pit latrine without ventilation 686 28,8 2 732 22,4 Bucket toilet 3 0,1 223 1,8 Sanitation off site Flush toilet connected to a public sewerage system 17 0,7 82 0,7 Flush toilet connected to a septic tank 4 0,2 9 0,1 Chemical toilet 2 0,1 6 0,1 Pit latrine with ventilation pipe 28 1,2 56 0,5 Pit latrine without ventilation 112 4,7 221 1,8 Bucket toilet 10 0,4 25 0,2 None 201 8,5 1 092 9,0 Total 2 380 100,0 12 194 100,0
Source: Statistics South Africa, General Household Survey 2004 Table 8.10 below shows that:
• A large number of black African households used pit latrines without ventilation on site as their main toilet facility in KwaZulu-Natal in 2004.
• A large proportion of households across all population groups used a flush toilet (connected to a sewerage system or a septic tank) in their dwellings as their main toilet facilities.

86
Table 8.10: Toilet facilities by population group, KwaZulu-Natal, 2004
N ('000)
Sanitation facility Black African
Other population
groups Total
Flush toilet connected to a public sewerage system or a septic tank 6 36 439 1 075 Chemical toilet 23 0 23 Pit latrine with ventilation pipe 268 0 268 Pit latrine without ventilation 796 4 800 Bucket toilet 13 0 13 None 201 0 201 Total 1 937 443 2 380 Total includes unspecified toilet facility Source: Statistics South Africa, General Household Survey 2004 We now examine toilet facilities by district municipality, using Census 2001 data. Figure 8.12 shows that:
• eThekwini district municipality recorded the highest percentage of households that used a flush toilet (connected to a sewerage system) in KwaZulu-Natal in 2001 (61,3%), followed by uMgungundlovu with 40,4%.
• Nine out of eleven district municipalities in KwaZulu-Natal (excluding Sisonke and eThekwini), mostly used pit latrines without ventilation in their households as the main toilet facility.
• In all the district municipalities in KwaZulu-Natal, the percentage of households with no toilet facilities was higher than those that were using the bucket latrine system.
Figure 8.12: Distribution of toilet facilities by district municipality, KwaZulu-Natal, 2001 (percentage)
Ugu uMgung-undlovu
Uthukela Umzin-yathi
Amajuba Zululand Umkhan-yakude
Uthungulu iLembe Sisonke eThekwini0,0%
20,0%
40,0%
60,0%
80,0%
100,0%
None 17,1 6,0 18,1 41,4 6,7 39,0 55,4 28,1 19,0 11,4 4,1Bucket latrine 1,0 1,2 1,0 1,3 0,6 0,8 1,4 1,6 1,4 1,3 1,1
Pit latrine w ithout ventilation 39,0 33,8 40,0 23,2 30,5 25,6 13,4 24,5 34,5 44,3 18,2
Pit latrine w ith ventilation (VIP) 12,0 8,6 11,7 8,6 11,0 9,6 10,9 10,4 11,5 7,0 6,7
Chemical toilet 7,3 3,4 2,1 4,0 4,2 5,7 6,8 6,8 7,8 5,5 5,1
F lush toilet (w ith septic tank) 5,6 6,7 1,7 1,8 2,1 2,3 1,9 3,7 4,3 4,2 3,5
F lush toilet (connected to sew erage system) 18,0 40,4 25,4 19,7 44,8 17,2 10,3 24,9 21,5 26,2 61,3
Source: Statistics South Africa, Population Census 2001

87
8.9 Refuse removal Table 8.11 below examines refuse removal among KwaZulu-Natal households by population group. It shows that:
• About 42,4% of black African households used local authorities for their refuse removal.
• Of those households headed by black African residents in KwaZulu-Natal, 48,7% used their own refuse dump.
Table 8.11: Distribution of households by type of refuse removal and population group of the household head, KwaZulu-Natal, 2004
Black African Coloured Indian/Asian White Total Refuse removal N % N % N % N % N % Removed by local authority at least once a week 796 795 41,1 33 267 96,7 205 805 96,7 189 431 97,0 1 225 297 51,5 Removed by local authority less often than once a week 26 131 1,3 912 2,7 1 490 0,7 226 0,1 28 759 1,2 Removed by community members at least once a week 979 0,1 0,0 0,0 0,0 979 0,0 Removed by community members less often than once a week 2 651 0,1 0,0 0,0 0,0 2 651 0,1 Communal refuse dump/communal container 88 120 4,5 227 0,7 0,0 350 0,2 88 696 3,7 Own refuse dump 944 272 48,7 0,0 2 288 1,1 5 188 2,7 951 749 40,0 No refuse removal 74 735 3,9 0,0 0,0 0,0 74 735 3,1 Unspecified 3 778 0,2 0,0 3 209 1,5 0,0 6 987 0,3 Total 1 937 461 100,0 34 405 100,0 212 792 100,0 195 194 100,0 2 379 852 100,0
Source: Statistics South Africa, General Household Survey 2004
8.10 Access to telephones Table 8.12 below compares household with access to telephones facilities in each population group in KwaZulu-Natal. The following observations were made:
• The majority of coloured, Indian/Asian and white households had access to telephone facilities, while only 37,7% of black African households had access to telephone facilities in KwaZulu-Natal in 2004.
• Owing to a larger percentage of black African households that had no access to telephone facilities in KwaZulu-Natal, the percentage of households with no access to telephone facilities in the province was higher than those who had the same facilities in 2004.

88
Table 8.12: Distribution of households with access to telephone facilities, KwaZulu-Natal and South Africa, 2001
Black African Coloured Indian/Asian White Total Telephone N % N % N % N % N % Have access 730 37,7 28 81,0 172 80,9 157 80,4 1 087 45,7 Do not have access 1 205 62,2 6 17,6 40 18,9 38 19,6 1 289 54,2 Unspecified 3 0,1 1 1,5 - 0,0 - 0,0 4 0,2 Total 1 938 100,0 35 100,0 212 100,0 195 100,0 2 380 100,0
Source: Statistics South Africa, General Household Survey 2004 Figure 8.13 looks at KwaZulu-Natal households in each district municipality with access to telephone facilities in 2001:
• In all the district municipalities, the percentage of households that had access to public telephones nearby was higher compared to the percentage of households that had access to the other telephonic facilities.
• More than 10% of households in eThekwini as well as in uMgungundlovu district municipalities indicated that they had access to telephones inside their dwellings.
Figure 8.13: Distribution of telephone facilities by district municipality, KwaZulu-Natal, 2001
Ugu Umgung-undlovu
Uthukela Umzinyathi Amajuba Zululand Umkhanya-kude
Uthungulu iLembe Sisonke eThekw ini0,0
10,0
20,0
30,0
40,0
50,0
60,0
70,0
80,0
90,0
100,0Percentage
Not applicable (institutions) 0,1 0,1 0,1 0,1 0,1 0,1 0,1 0,1 0,1 0,1 0,1No access to a telephone 10,2 8,0 9,0 18,1 5,8 15,3 12,9 15,0 9,3 13,4 3,7
At another location; not nearby 5,9 4,9 5,9 11,8 3,1 9,1 10,0 7,9 7,0 9,1 1,4At another location nearby 3,1 3,3 5,1 5,2 4,2 4,4 3,3 4,0 3,2 5,7 1,7
At a public telephone nearby 39,5 35,9 39,7 35,4 39,0 34,5 43,5 32,8 42,3 36,5 32,6At a neighbour nearby 13,9 8,7 10,8 10,3 6,6 10,3 7,4 8,6 11,2 15,6 7,4
Cellphone only 11,1 13,1 16,4 10,8 16,4 17,4 17,0 19,4 12,0 11,5 15,3Telephone in dw elling only 7,9 11,7 6,6 3,9 12,9 3,8 2,4 4,3 7,2 3,2 16,1
Telephone in dw elling and cellphone 8,4 14,2 6,5 4,3 11,9 5,1 3,5 7,9 7,6 4,8 21,6
Source: Statistics South Africa, Population Census 2001
8.11 Ownership of selected household goods Figure 8.14 examines the extent to which households owned selected household goods in working condition. It shows that in 2001:
• Less than 10% of households head by the black African, coloured and Indian/Asian population had access to computers, while 13,8% of the white population had access to computers.

89
• The highest percentage of households with access to radios in KwaZulu-Natal was black African households (48,3%), followed by the coloured population (31,4%) and then the Indian/Asian population (30,3%).
• More than 30% of coloured and Indian/Asian households had refrigerators and televisions.
Figure 8.14: Ownership of selected household goods by population group, KwaZulu-Natal, 2001
Black African Coloured Indian/Asian White0,0
20,0
40,0
60,0
80,0
100,0Percentage
Computer 1,2 5,7 7,6 13,8Radio 48,3 31,4 30,3 28,5
Refrigerator 24,7 32,0 31,9 29,5Television 25,8 30,9 30,2 28,2
Source: Statistics South Africa, Population Census 2001 Figure 8.15 examines the ownership of these household goods at district municipality level. It shows that:
• Less than 5% of households in all district councils in KwaZulu-Natal indicated that they had access to computers.
• Umkhanyakude district council had the highest percentage of households with access to radios, followed by Umzinyathi (58,4%) and Sisonke (57,2%).
• Only three district councils, namely Sisonke, Umzinyathi and Umkhanyakude had less than 20% of households with refrigerators.

90
Figure 8.15: Selected household goods by district municipality, KwaZulu-Natal, 2001
Ugu uMgungund-lovu
Uthukela Umzin-yathi
Amajuba Zululand Umkhan-yakude
Uthungulu iLembe Sisonke eThekwini0,0
10,0
20,0
30,0
40,0
50,0
60,0
70,0%
Television 27,4 27,8 26,4 20,8 28,7 22,0 17,8 23,8 25,8 23,5 27,6Radio 46,4 40,6 46,9 58,4 40,9 52,6 61,4 47,5 47,5 57,2 41,4
Refrigerator 23,4 27,0 24,9 19,2 27,9 24,0 19,9 25,8 24,4 17,1 27,5Computer 2,8 4,6 1,8 1,6 2,4 1,4 0,9 2,9 2,3 2,2 3,5
Source: Statistics South Africa, Population Census 2001

91
Chapter 9: Economy 9.1 Gross Domestic Product per Region (GDPR) Figure 9.1 below shows the real annual economic growth rate per region for 2004. The following comparisons are observed:
• Preliminary estimates indicated that the highest real annual economic growth rate per region, as measured by the Gross Domestic Product per Region (GDPR) at market prices for 2004 compared with 2003, was recorded in Western Cape with 5,3%, followed by KwaZulu-Natal and North West with 4,9% and Eastern Cape with 4,6%. The rate of these provinces was higher than that for South Africa.
• Limpopo had the lowest real annual economic growth rate of 2,7%. • KwaZulu-Natal's real annual economic growth rate of 4,9% was higher than that of
South Africa, which was 4,5%. Figure 9.1: Real annual economic growth rate per region for 2004
! !! ! ! ! ! ! !
WesternCape
EasternCape
NorthernCape
FreeState
KwaZulu-Natal
NorthWest
Gauteng Mpuma-langa
Limpopo0,0
1,0
2,0
3,0
4,0
5,0
6,0%
2004 5,3 4,6 3,0 3,9 4,9 4,9 4,4 4,2 2,7RSA 4,5 4,5 4,5 4,5 4,5 4,5 4,5 4,5 4,5!
Source: Statistics South Africa, Gross Domestic Product, Third quarter 2005 Figure 9.2 below shows the contribution of GDPR by province (region) to the GDP of South Africa in 2004. The following comparisons are observed:
• Gauteng made the largest contribution to the economy of South Africa (33,3%), followed by KwaZulu-Natal (16,7%) and Western Cape (14,4%).
• Northern Cape made the smallest contribution (2,2%) to the economy of South Africa in 2004.

92
Figure 9.2: Percentage GDPR contribution to the national GDP, South Africa, 2004
W esternCape
EasternCape
NorthernCape
FreeState
KwaZulu-Natal
NorthWest
Gauteng Mpuma-langa
Limpopo0,0
5,0
10,0
15,0
20,0
25,0
30,0
35,0%
2004 14,4 8,1 2,2 5,5 16,7 6,3 33,3 6,8 6,7 Source: Statistics South Africa, Gross Domestic Product, Third quarter 2005 Figure 9.3 shows the average annual economic growth for the period 1996–2004.
• The highest average annual economic growth rate recorded among the nine provinces over the period 1996 to 2004 was that of Limpopo (3,5%).
• Limpopo, Western Cape and Gauteng had a higher average annual economic growth than that of South Africa, which was 3,1%.
• Free State recorded the lowest average real annual economic growth rate over the period with 2,0%.
• KwaZulu-Natal had an average annual economic growth rate of 3,1%, which was similar to that of South Africa.
Figure 9.3: Average annual economic growth per region, South Africa 1996–2004
! !! ! ! ! ! ! ! !
WesternCape
EasternCape
NorthernCape
FreeState
KwaZulu-Natal
NorthWest
Gauteng Mpuma-langa
Limpopo SouthAfrica
0,0
0,5
1,0
1,5
2,0
2,5
3,0
3,5
4,0%
Province 3,4 2,5 2,2 2,0 3,1 2,2 3,3 3,0 3,5 2,8South Africa 3,1 3,1 3,1 3,1 3,1 3,1 3,1 3,1 3,1 3,1! Source: Statistics South Africa, Gross Domestic Product, Third quarter 2005

93
Table 9.1 and Figure 9.4 show the Gross Domestic Product per Region at current prices for KwaZulu-Natal in 1996–2004. The following is observed:
• For GDPR at current prices, manufacturing remained the highest contributor to the economy of KwaZulu-Natal over the period 1996 to 2004, which was 21,8%.
• Significant contributions were also made by finance, real estate and business services (15,9%); wholesale and retail trade, hotels and restaurants (12,7%); and transport and communication (11,6%). The lowest contributors were mining and quarrying (1,6%), construction (2,1%), and electricity and water (2,3%).
Table 9.1: GDPR and value added estimates per industry at current prices, KwaZulu-Natal, 1996–2004
(Rand million) Industry 1996 1997 1998 1999 2000 2001 2002 2003 2004
Primary industries 8 074 8 746 9 916 9 281 10 454 12 196 14 076 13 485 13 709
Agriculture, forestry and fishing 6 235 6 816 7 642 7 052 7 687 9 154 10 909 10 446 10 014
Mining and quarrying 1 839 1 929 2 274 2 229 2 766 3 042 3 167 3 039 3 695
Secondary industries 30 785 33 601 34 618 36 035 41 670 46 333 53 672 55 971 60 726
Manufacturing 24 470 26 604 27 698 29 046 34 255 37 560 44 928 47 217 50 448
Electricity, gas and water 3 255 3 477 3 583 3 754 4 095 4 268 5 185 4 820 5 319
Construction 3 060 3 519 3 337 3 235 3 320 4 505 3 559 3 934 4 958
Tertiary industries 56 676 62 770 68 414 75 552 85 275 94 956 106 622 118 707 133 277 Wholesale and retail trade; hotels and restaurants 12 703 13 750 14 506 16 364 19 454 21 860 24 100 26 430 29 448 Transport, storage and communication 12 080 13 314 14 249 15 538 17 678 19 758 22 237 24 478 26 755 Finance, real estate and business services 13 004 15 141 16 880 19 547 21 524 24 432 28 085 32 267 36 798
Personal services 5 158 5 841 6 481 7 320 8 565 9 383 10 449 11 677 12 774
General government services 13 730 14 725 16 298 16 783 18 054 19 523 21 752 23 856 27 501
All industries at basic prices 95 535 105 116 112 948 120 868 137 398 153 485 174 370 188 163 207 711
Taxes less subsidies on products 8 545 9 528 10 933 11 918 13 514 14 907 16 919 18 884 23 905 GDPR at market prices 104 081 114 644 123 882 132 785 150 912 168 392 191 289 207 047 231 616
Source: Statistics South Africa, Gross Domestic Product, Third quarter 2005

94
Figure 9.4: Percentage contribution of industries to the Gross Domestic Product per Region at current prices, KwaZulu-Natal, 2005
Agriculture,forestry and
fishing
Mining andquarrying
Manufacturing Electricity, gasand water
Construction Wholesale andretail trade;hotels andrestaurants
Transport,storage and
communication
Finance, realestate andbusiness
Personalservices
Generalgovernment
services
0,0
5,0
10,0
15,0
20,0
25,0%
2004 4,3 1,6 21,8 2,3 2,1 12,7 11,6 15,9 5,5 11,9 Source: Statistics South Africa, Gross Domestic Product, Third quarter 2005 Table 9.2 and Figure 9.5 show the Gross Domestic Product per Region at constant 2000 prices for KwaZulu-Natal for 1996 to 2004. The following is observed:
• For GDPR at constant 2000 prices, the growth rate for most of the industries in KwaZulu-Natal was steadily increasing at a positive growth rate, except for the agriculture, forestry and fishing industry which had a negative growth rate (-0,1%).
• The highest growth rate in KwaZulu-Natal was recorded by the construction industry (28,8%), followed by the finance, real estate and business industry (7,9%).

95
Table 9.2: GDPR and value added estimates per industry at constant 2000 prices, KwaZulu-Natal, 1996–2004
(Rand million) Industry 1996 1997 1998 1999 2000 2001 2002 2003 2004
Primary industries 11 499 11 511 11 523 10 247 10 453 10 293 10 372 10 719 10 856
Agriculture, forestry and fishing 7 570 7 540 7 609 7 408 7 687 7 667 8 027 8 221 8 213
Mining and quarrying 3 929 3 971 3 914 2 839 2 766 2 625 2 345 2 498 2 643
Secondary industries 37 978 39 149 38 315 38 607 41 670 43 778 44 145 43 445 46 355
Manufacturing 30 386 31 213 31 063 31 546 34 255 35 235 36 141 35 865 37 465
Electricity, gas and water 3 979 4 115 3 864 3 868 4 095 4 091 4 486 3 923 4 179
Construction 3 613 3 821 3 388 3 194 3 320 4 452 3 519 3 657 4 711
Tertiary industries 76 121 77 361 79 488 82 145 85 276 89 141 92 895 97 445 101 821 Wholesale and retail trade; hotels and restaurants 16 532 16 623 16 771 17 985 19 454 20 969 21 481 23 040 24 094 Transport, storage and communication 14 531 15 340 16 029 16 605 17 678 18 443 20 184 21 505 22 382 Finance, real estate and business services 18 780 19 577 20 053 21 275 21 523 22 742 23 909 25 078 27 052
Personal services 7 431 7 427 7 886 8 178 8 565 8 764 8 975 9 339 9 458
General government services 18 847 18 394 18 750 18 101 18 054 18 223 18 346 18 482 18 836
All industries at basic prices 125 599 128 021 129 326 130 999 137 399 143 212 147 412 151 609 159 032
Taxes less subsidies on products 12 380 13 527 13 447 13 184 13 514 14 366 14 280 14 563 15 235 GDPR at market prices 137 979 141 548 142 774 144 183 150 913 157 578 161 692 166 172 174 268
Source: Statistics South Africa, Gross Domestic Product, Third quarter 2005 Figure 9.5: Gross Domestic Product per Region for KwaZulu-Natal at constant 2000 prices (percentage changes), 2004
Agriculture,forestry and
fishing
Mining andquarrying
Manufacturing Electricity, gasand water
Construction Wholesale andretail trade;hotels andrestaurants
Transport,storage and
communication
Finance, realestate andbusiness
Personalservices
Generalgovernment
services
0,0
5,0
10,0
15,0
20,0
25,0
30,0
35,0
-5,0
%
2004 -0,1 5,8 4,5 6,5 28,8 4,6 4,1 7,9 1,3 1,9 Source: Statistics South Africa, Gross Domestic Product, Third quarter 2005

96
Figure 9.6 compares the Gross Domestic Product per Region at current prices for KwaZulu-Natal and South Africa in 1996–2004. The following is observed:
• For GDPR at current prices, manufacturing remained the highest contributor to the economy of KwaZulu-Natal over the period 1996 to 2004, which was 21,8%, while transport, storage and communication remained the highest contributor to the economy of South Africa (21,9%).
• The lowest contributor to the economy of KwaZulu-Natal was the construction industry (2,1%), while the mining and quarrying industry contributed the least to the economy of South Africa (4,2%).
Figure 9.6: Gross Domestic Product per Region at current prices for KwaZulu-Natal and South Africa, 2004 (percentage contributions)
Agriculture,forestry and
fishing
Mining andquarrying
Manufacturing Electricity, gasand water
Construction Wholesale andretail trade;hotels andrestaurants
Transport,storage and
communication
Finance, realestate andbusiness
Personalservices
Generalgovernment
services
0,0
5,0
10,0
15,0
20,0
25,0
30,0%
KwaZulu-Natal 4,3 1,6 21,8 2,3 2,1 12,7 11,6 15,9 5,5 11,9South Africa 26,4 4,2 21,3 18,1 17,0 16,8 21,9 14,1 16,7 14,7
Source: Statistics South Africa, Gross Domestic Product, Third quarter 2005 Figure 9.7 compares the Gross Domestic Product per Region at constant 2000 prices for KwaZulu-Natal and South Africa in 1996–2004. The following is observed:
• For GDPR at constant 2000 prices, the construction industry remained the highest contributor to the growth rate of the economy of KwaZulu-Natal and South Africa, i.e. 28,8% and 10,7% respectively.
• The lowest contributor to the growth rate of the economy of KwaZulu-Natal and South Africa was recorded for agriculture, forestry and fishing industry, which was -0,1% and -1,7% respectively.

97
Figure 9.7: Gross Domestic Product per Region for KwaZulu-Natal and South Africa, 2004 (percentage changes)
Agriculture,forestry and
fishing
Mining andquarrying
Manufacturing Electricity, gasand water
Construction Wholesale andretail trade;hotels andrestaurants
Transport,storage and
communication
Finance, realestate andbusiness
Personalservices
Generalgovernment
services
0,0
5,0
10,0
15,0
20,0
25,0
30,0
35,0
-5,0
%
KwaZulu-Natal -0,1 5,8 4,5 6,5 28,8 4,6 4,1 7,9 1,3 1,9South Africa -1,7 2,8 4,6 2,4 10,7 5,7 4,6 7,5 1,1 1,4
Source: Statistics South Africa, Gross Domestic Product, Third quarter 2005
9.2 Selected economic sectors in KwaZulu-Natal
9.2.1 Agriculture Table 9.3 and Figure 9.8 show that:
• The proportion of land used as farming area in KwaZulu-Natal in 2001 was 15 982 000 hectares, which constituted about 5,1% of the farming area in South Africa.
• There were 216 000 farming operations on land in the province during the period of the survey, and this constituted about 19,8% of the entire farming operations in South Africa.
• Eastern Cape had the highest farming operations of 37,3%, while Gauteng had the lowest farming operations of 0,4% in South Africa.

98
Table 9.3: Farming operations by land surface area and province, South Africa, 2001
Land area Farming operations
Province Ha ('000) % Ha ('000) % Western Cape 33 915 10,8 23 2,1 Eastern Cape 61 063 19,4 407 37,3 Northern Cape 45 780 14,5 12 1,1 Free State 19 559 6,2 56 5,1 KwaZulu-Natal 15 982 5,1 216 19,8 North West 18 780 6,0 51 4,7 Gauteng 5 922 1,9 4 0,4 Mpumalanga 10 755 3,4 45 4,1 Limpopo 103 372 32,8 278 25,5 South Africa 315 128 100,0 1 092 100,0
Source: National Department of Agriculture, 2001 Figure 9.8: Distribution of farming operations in South Africa by province, 2001
WesternCape
EasternCape
NorthernCape
FreeState
KwaZulu-Natal
NorthWest
Gauteng Mpuma-langa
Limpopo0
50
100
150
200
250
300
350
400
450
Farm
ing
oper
atio
ns in
1 0
00
Farm ing operations (1 000 hectares)
23 407 12 56 216 51 4 45 278
Source: National Department of Agriculture, 2001 Tables 9.4 and 9.5 below show the different types of crops and the quantities that were harvested in each of the nine provinces in South Africa in 2001. The following are observed:
• Free State had the largest harvest of maize for grain (5 156 801 tons), grain sorghum (552 594 tons), wheat (153 957 tons) and maize for fresh consumption (70 635 tons)
• KwaZulu-Natal had the largest harvest of sugarcane in 2001 (108 459 706 tons), followed by Mpumalanga that harvested 335 471 tons in 2001.
• Only three provinces harvested cotton in 2001, namely Northern Cape (21 516 tons), Mpumalanga (1 364 tons) and KwaZulu-Natal (2 tons).
• Only three provinces harvested tobacco in 2001, namely North West (9 339 tons), Mpumalanga (7 568 tons) and Eastern Cape (2 328 tons).
• The most harvested crop in South Africa in 2001 was sugarcane (10 879 5877 tons), followed by maize for grain (13 791 056 tons) and wheat (3 078 338 tons).

99
Table 9.4: Gross farming income earned from field crops
Summer cereals Winter cereals
Province Maize for
grain Grain sorghum Other Wheat Barley Other Total R '000
Western Cape 36 621 9 350 512 983 339 99 774 30 058 1 159 654 Eastern Cape 49 297 1 084 40 14 372 2 329 1 470 68 592 Northern Cape 372 155 2 040 0 365 151 21 708 1 227 762 281 Free State 3 213 902 95 065 1 296 1 058 228 1 451 8 417 4 378 359 KwaZulu-Natal 357 568 0 71 42 520 0 81 400 240 North West 1 755 904 13 692 871 127 001 1 265 135 1 898 868 Gauteng 323 490 465 110 7 627 0 28 331 720 Mpumalanga 1 490 707 49 470 2 638 106 647 0 140 1 649 602 Limpopo 205 850 31 539 1 075 80 460 0 17 318 941 South Africa 7 768 873 193 355 6 101 1 802 006 26 753 11 515 10 968 257
Source: Statistics South Africa, Census of commercial agriculture, 2002 Table 9.5: Gross farming income earned from field crops (continued)
Oil-seeds Legumes
Province Sunflower
seed Ground-nuts Soya beans Other Dry beans Other Total R '000
Western Cape 1 001 382 0 34 486 5 750 1 471 43 090 Eastern Cape 215 0 550 0 887 0 1 652 Northern Cape 4 683 60 196 523 11 2 443 2 185 70 041 Free State 386 740 93 653 33 203 116 92 658 172 606 542 KwaZulu-Natal 3 255 631 44 326 1 176 10 581 70 60 039 North West 291 871 66 694 18 727 0 15 357 101 392 750 Gauteng 9 118 0 4 476 9 24 922 1 203 39 728 Mpumalanga 42 173 1 212 89 572 0 94 674 1 228 228 859 Limpopo 111 527 12 816 27 953 220 4 752 280 157 548 South Africa 850 583 235 584 219 330 36 018 252 024 6 710 1 600 249
Source: Statistics South Africa, Census of commercial agriculture, 2002 Table 9.6 and Figure 9.9 below show the quantity harvested for maize for grain by province in South Africa. The table shows that:
• Free State had the largest percentage of maize harvested in 2001 (37,4%), followed by North West (36,6%).
• Both KwaZulu-Natal and Gauteng harvested 2,6% maize in 2001. • Limpopo had the lowest percentage of maize harvested in 2001 (0,4%). • The total quantity of maize that was harvested in South Africa in 2001 was
13 791 055 tons.

100
Table 9.6: Quantity harvested in each province, South Africa, 2001(maize for grain)
Province Tons % Western Cape 211 252 1,5 Eastern Cape 1 217 242 8,8 Northern Cape 84 639 0,6 Free State 5 156 801 37,4 KwaZulu-Natal 352 538 2,6 North West 5 053 151 36,6 Gauteng 354 300 2,6 Mpumalanga 1 306 202 9,5 Limpopo 54 930 0,4 South Africa 13 791 055 100,0
Source: National Department of Agriculture, 2001 Figure 9.9: Percentage quantity harvested by province: maize for grain, South Africa, 2001
WesternCape2,0%
EasternCape9,0%
NorthernCape1,0%
FreeState36,0%
KwaZulu-Natal3,0%
North West36,0%
Gauteng3,0%
Mpuma-langa10,0%
Source: National Department of Agriculture, 2001 Table 9.7 below shows the number of farming units and market value of their assets by province in South Africa. The following is observed from this table:
• Free State had the highest number of farming units (8 531) with an asset market value of R12 477 269 million, followed by Western Cape (7 185) with an asset market value of R27 863 636 million, and then Northern Cape (6 114) with an asset market value of R9 698 368 million.
• Gauteng had the lowest number of farming units (2 206) with an asset market value of R2 962 276 million, followed by Limpopo (2 915) with an asset market value of R9 720 910 million, and then KwaZulu-Natal (4 038) with an asset value of R9 900 145 million.
• There were 45 818 farming units with an asset market value of R98 428 255 million in South Africa.

101
Table 9.7: Number of farming units and market value of assets by province, South Africa 2002
Province Number of
farming units
Market value of assets
(R'000) Western Cape Eastern Cape Northern Cape Free State KwaZulu-Natal North West Gauteng Mpumalanga Limpopo South Africa
7 185 4 376 6 114 8 531 4 0385 349 2 206 5 104 2 915
45 818
27 863 636 7 704 486 9 698 368
12 477 269 9 900 1458 419 760 2 962 276 9 720 910 9 681 405
98 428 255
Source: Statistics South Africa, Census of commercial agriculture, 2002 Figure 9.10 shows gross farming income and farming debts by province in South Africa. The following is observed in this figure:
• The formal agricultural sector generated a total gross farming income of approximately R53 billion in 2002.
• Western Cape contributed the highest gross income, followed by Free State, then Mpumalanga, KwaZulu-Natal, North West, Gauteng, Northern Cape, Limpopo and Eastern Cape.
• Farming debts amounted to approximately R31 billion. • Western Cape was responsible for the largest part of the debt, followed by Free State
and Northern Cape, while Gauteng had the lowest proportion of debts.
Figure 9.10: Gross farming income and farming debt by province, South Africa, 2002
WesternCape
EasternCape
NorthernCape
FreeState
KwaZulu-Natal
NorthWest
Gauteng Mpuma-langa
Limpopo SouthAfr ic a
0
10 000 000
20 000 000
30 000 000
40 000 000
50 000 000
60 000 000
Gross farming income 11 129 958 3 213 986 3 578 025 9 125 579 6 429 273 5 125 343 3 962 582 6 186 402 4 577 904 53 329 052Farming debt 7 913 782 1 948 108 3 086 128 5 060 522 3 144 070 2 808 754 997 487 3 164 808 2 734 233 30 857 891
Source: Statistics South Africa, Census of commercial agriculture, 2002

102
Table 9.8 shows a breakdown of gross farming income by type of division and province in South Africa. The table depicts the following:
• In total, field crops generated the highest income, followed by animals, horticulture, animal products and then other products.
• Free State contributed the largest share of field crops and animals to the gross farming income, followed by KwaZulu-Natal and then Mpumalanga in the case of field crops; whereas Western Cape contributed the largest share in horticulture, animal products and other products.
• Eastern Cape contributed the least share in field crops and animals, North West in horticulture and other products, and Limpopo in animal products.
Table 9.8: Breakdown of gross farming income by type of division and province, South Africa, 2002
Field crops Horticulture Animals and animal
products Other products Province R'000 % R'000 % R'000 % R'000 % Western Cape 1 295 835 7,9 5 976 340 42,0 3 295 138 15,5 562 645 40,2 Eastern Cape 184 361 1,1 833 403 5,9 2 160 350 10,2 35 871 2,6 Northern Cape 971 869 5,9 1 065 784 7,5 1 517 207 7,1 23 163 1,7 Free State 5 067 205 30,8 620 318 4,4 3 410 581 16,1 27 475 2,0 KwaZulu-Natal 2 773 151 16,8 614 458 4,3 2 615 346 12,3 426 317 30,4 North West 2 448 308 14,9 363 358 2,6 2 305 785 10,9 7 892 0,6 Gauteng 384 056 2,3 811 240 5,7 2 696 978 12,7 71 307 5,1 Mpumalanga 2 566 165 15,6 1 624 945 11,4 1 853 552 8,7 141 740 10,1 Limpopo 785 982 4,8 2 319 058 16,3 1 368 681 6,4 104 181 7,4 South Africa 16 476 933 100,0 14 228 904 100,0 21 223 618 100,0 1 400 591 100,0
Source: Statistics South Africa, Census of commercial agriculture, 2002
9.2.2 Tourism Domestic ands foreign visitors The value of KwaZulu-Natal’s foreign holiday market was estimated at R3,6 billion for 2000. The Western Cape and Gauteng were still visited by the largest proportion of foreign tourists to South Africa. Approximately 509 000 tourists visited KwaZulu-Natal in 2000. Most of KwaZulu-Natal’s foreign visitors tend to stay in the province for 6 nights or less. The average length of stay for September 2001 was 12 nights, while the median was 6 nights. Figure 9.11 below indicates the purpose of holiday trips to KwaZulu-Natal for domestic and foreign visitors.
• For domestic holidaymakers, 47% of holiday trips were for the purpose of visiting friends and relatives and a further 32% were for holiday.
• Of this, 57% of domestic holidaymakers in the province stayed with friends or family, 5% stayed in hotels and less than 1% stayed in game or country lodges.
• For foreign travellers, only 16% of trips were for the purpose of visiting friends and family, with the large majority (58%) for a holiday.
• Travel to destinations was mainly by private cars (49%) and minibus taxis (9%). • Domestic tourists to this province tend to regard their friends and relatives and
KwaZulu-Natal’s beaches as the primary factors that attract them to this province, while foreign tourists cite reasons such as the wildlife within the province, business and beaches.

103
Figure 9.11: Purpose of visit to KwaZulu-Natal, 2001
47%
16%
32%
58%
16%21%
5% 5%
Domestic Foreign
Visiting friends and relatives Holiday Business Other
Source: KwaZulu-Natal Tourism Authority, 2001 Figure 9.12 below outlines activities undertaken by foreign and domestic tourists in KwaZulu-Natal.
• The most important activity that domestic tourists engaged in when visiting this province was beach-related activities, accounting for almost 50% of all activities.
• Approximately 40% of foreign visitors enjoyed the beaches and going to nature reserves, with lesser amounts visiting arts and craft centres, museums and art galleries.
• One of the largest growth areas is the so-called ‘Township Tourism’ which has seen the growth in interest more than double over the last 5 years.

104
Figure 9.12: Activities undertaken by tourists in KwaZulu-Natal, 2001
47%
42%
10%
28%
9%
19%
9%
19%
8%
18%
6%
40%
Domestic Foreign Beach Arts and crafts Tow nship or cultural
village Museum or gallery
Hiking or mountain climbing
Nature reserve
Source: KwaZulu-Natal Tourism Authority, 2001 Supply statistics The following tables outline the supply statistics (i.e. statistics for the accommodation sector) in KwaZulu-Natal. The accommodation sector was the most important sector of the tourism industry.
• In April 2001, KwaZulu-Natal supplied some 206 hotels, 148 guest houses, 496 bed and breakfast establishments and 127 caravan and camping sites to the accommodation sector of the country.
• KwaZulu-Natal had 289 tour guides and 178 tour operators with some 27% of foreign tourists to SA (over 300 000 p.a.) who participated in organised tours.
• The conference, convention and exhibition sector is currently undergoing rapid growth. Durban's International Convention Centre, the largest in the southern hemisphere, began operating during 1997 and is presently being extended.
Table 9.9: KwaZulu-Natal supply statistics, 2001
Supply N Hotels 206 Guest houses 148 Bed and breakfasts 496 Caravan and camp
sites 127 Conference venues 218 Tour guides 289 Tour operators 178
Source: KwaZulu-Natal Tourism Authority, 2001

105
Table 9.10: Hotel trading statistics, KwaZulu-Natal, 2001
Type Unit January 2000–
December 2000 January 2001–
December 2001
Room statistics: Room nights available per day Room nights available per month
Number Number Number
%
639 056
19 491 270 10 245 487
52,6
630 134
19 167 025 10 214 706
53,3
Bed statistics: Bed nights available per day Bed nights available per month
Number Number Number
%
1 327 320
40 483 340 14 233 073
35,2
1 321 786
40 205 619 14 300 897
35,6 Income statistics: Room income Income from catering Income from bar sales Other income Total hotel income
R'000 R'000 R'000 R'000 R'000
3 239 112 1 212 826
491 953 349 764
5 293 655
3 351 295 1 210 563
472 528 338 318
5 372 704
Source: KwaZulu-Natal Tourism Authority, 2001
9.2.3 Transport Table 9.11 below shows that all provinces except Mpumalanga recorded a decrease in fatal crashes between December 2000 and December 2001, with Northern Cape recording the highest decrease.
Table 9.11: Percentage changes in the number of fatal crashes by province, South Africa: December 2000 and December 2001
Province
Change
% change
Western Cape -8 -6,2 Eastern Cape -12 -13,2 Northern Cape -30 -56,6 Free State -24 -13,2 KwaZulu-Natal -31 -14,4 North West -14 -16,9 Gauteng -15 -6,5 Mpumalanga 40 50,6 Limpopo -46 -54,8 South Africa -140 -13,2
Source: Road Accident Fund, 2002 The calculated cost of road traffic crashes over the period December 2000 to December 2001 is shown in Table 9.12 below. The table shows that:
• The cost of fatal crashes dropped by R56,72 million or 13,2% from a cost of R431,46 million in December 2000 to a cost of R374,74 million in December 2001.
• In 2000 KwaZulu-Natal had the second highest cost of fatal crashes (R87,10 million), and Gauteng had the highest cost of fatal crashes (R93,99 million).
• Gauteng had the highest cost of fatal crashes in 2001 (R87,91 million), followed by KwaZulu-Natal with a cost of R74,54 million in 2001.
• Mpumalanga was the only province in which the cost of fatal crashes had increased from December 2000 to December 2001 (from R32,00 million in December 2000 to R48,21 million in December 2001).

106
Table 9.12: Distribution of cost of crash by province, South Africa, 2002
December 2000 December 2001 Change Province R million R million R million Western Cape 52,26 49,02 -3,24 Eastern Cape 36,87 32,00 -4,86 Northern Cape 21,47 9,32 -12,12 Free State 40,11 30,38 -9,72 KwaZulu-Natal 87,10 74,54 -12,56 North West 33,63 27,95 -5,67 Gauteng 93,99 87,91 -6,08 Mpumalanga 32,00 48,21 +16,20 Limpopo 34,03 15,39 -18,64 South Africa 431,46 374,74 -56,72
Source: Road Accident Fund (RAF), 2002
9.3 Human Development Index (HDI)
Figure 9.13 below shows the Human Development Index by province and population group in South Africa. It shows that:
• Overall, the HDI for all the population groups except for the black African group in South Africa was above 0,60.
• In all the provinces except Gauteng, the HDI for the black African population was less than 0,60.
• KwaZulu-Natal and Northern Cape had an average HDI of 0,56 each, which made them third highest in South Africa.
• On average, the HDI measured for all the provinces in South Africa in 2003 was 0,59.
Human Development Index: The Human Development Index of the United Nations Development Program is used for obtaining internationally comparable indicators of the ability of individuals within a country or across various countries to live long, informed and comfortable lives. It has three components: (1) Longevity measured by life expectancy at birth. (2) Educational attainment measured by adult literacy rate (two-thirds weighting)
and combined gross enrolment at primary, secondary and tertiary. (3) Comfortable lives measured by a GDP Index. (4) The Human Development Index is the average of these three components.

107
Figure 9.13: Human Development Index by population group and province, South Africa, 2003
WesternCape
EasternCape
NorthernCape
FreeState
KwaZulu-Natal
NorthWest
Gauteng Mpuma-langa
Limpopo SouthAfr ic a
0,0
0,1
0,2
0,3
0,4
0,5
0,6
0,7
0,8
0,9
Black African 0,6 0,5 0,5 0,5 0,5 0,5 0,6 0,5 0,5 0,5 Coloured 0,6 0,6 0,5 0,6 0,7 0,6 0,7 0,7 0,7 0,6
Indian/Asian 0,8 0,8 0,8 0,7 0,7 0,8 0,8 0,7 0,8 0,7 White 0,9 0,8 0,8 0,8 0,9 0,8 0,9 0,8 0,8 0,9
Total 0,7 0,5 0,6 0,6 0,6 0,5 0,7 0,5 0,5 0,6 Source: Global Insight SA: Ref 2003
9.4 Consumer Price Index (CPI) Figure 9.14 below shows the trend that the CPI for KwaZulu-Natal and that of South Africa had followed from January 2003 to December 2003. The inflation figures for both seem to show more or less the same pattern from January 2003 to December 2003, although KwaZulu-Natal indices were much higher than those of South Africa. Figure 9.14: Consumer Price Index for KwaZulu-Natal and South Africa, January 2003 to December 2003
'
'
'
' ' ''
' ' ''
'
&
&
&&
&& & & & &
&
&
Jan 4 Feb 4 Mar 4 Apr 4 May 4 Jun 4 Jul 4 Aug 4 Sep 4 Oct 4 Nov 4 Dec 4119
120
121
122
123
124
125
126
127Indices
KwaZulu-Natal 123,1 123,5 124,1 124,7 125,1 125,3 125,1 124,9 124,8 125,5 126,3 125,7South Africa 121,8 122,4 123,2 123,4 123,5 123,9 124,3 124,1 124,1 124,6 125,3 125
&'
Source: Statistics South Africa, Consumer Price Index, 2003

108
Chapter 10: Politics The aim of this chapter is to give an indication of the structure and composition of the KwaZulu-Natal Provincial Legislature. Table 10.1 below compares the 1999 and 2004 KwaZulu-Natal provincial seat allocations. The following is indicated:
• In 1999 the African National Congress (ANC) occupied 32 seats from a total of 80 seats. In 2004 this number increased to 38.
• The Inkatha Freedom Party (IFP) occupied 34 seats from a total of 80 seats in 1999, and this number decreased to 30 in 2004.
• The Democratic Alliance (DA) occupied the same number of seats (7) in both 1999 and 2004.
• The New National Party (NNP) occupied 3 seats in 1999 and lost all its seats in the 2004 elections.
• The Minority Front (MF) occupied 2 seats in both 1999 and 2004. • Other small parties such as the African Christian Democratic Party (ACDP) and the
United Democratic Movement (UDM) occupied one seat each in 1999. In 2004 the ACDP won 2 seats while the UDM retained its one seat.
Table 10.1: Seat allocation in KwaZulu-Natal Legislature by political party, 1999 and 2004
Number of seats Political Party 1999 2004 African Christian Democratic Party (ACDP) 1 2 African National Congress (ANC) 32 38 Democratic Alliance (DA) 7 7 Inkatha Freedom Party (IFP) 34 30 Minority Front (MF) 2 2 New National Party (NNP) 3 0 United Democratic Movement (UDM) 1 1 KZN Provincial Legislature 80 80
Source: KwaZulu-Natal Provincial Legislature, 1999 and 2004 Figure 10.1 shows KwaZulu-Natal Members of the Executive Council (MEC) by political party in 1999 and 2004. It shows that:
• The IFP had the highest number of MECs (5) in 1999, compared to other political parties in the province.
• The ANC had the highest number of MECs (7) in 2004, compared to other political parties in the province.
• Overall, the MEC scenario in KwaZulu-Natal shows that there was an increase in the number of ANC MECs from 4 in 1999 to 7 in 2004, and a decrease in the number of IFP MECs from 5 to 3 during the same period.
• MEC representatives for the DA decreased from 2 in 1999 to nil in 2004. • In 2004 there was 1 MEC representing the MF.

109
Figure 10.1: KwaZulu-Natal MEC representation by political party, 1999 and 2004
ANC IFP DA MF0
1
2
3
4
5
6
7
8Number
MEC 1999 4 5 2 0MEC 2004 7 3 0 1
Source: KwaZulu-Natal Provincial Legislature, 1999 and 2004 Figure 10.2 below shows MEC representation by sex in KwaZulu-Natal. It shows that no female MECs were appointed in 1999, while only one female MEC was appointed in 2004. Figure 10.2: Gender representation of the MECs in KwaZulu-Natal, 1999 and 2004
MEC 1999 Mec 20040
2
4
6
8
10
12Num ber
Male 11 10Female 0 1 Source: KwaZulu-Natal Provincial Legislature, 1999 and 2004 In 2004, the KwaZulu-Natal Provincial Legislature identified key focus areas for improvement as shown in Table 10.2 below in order of priority.
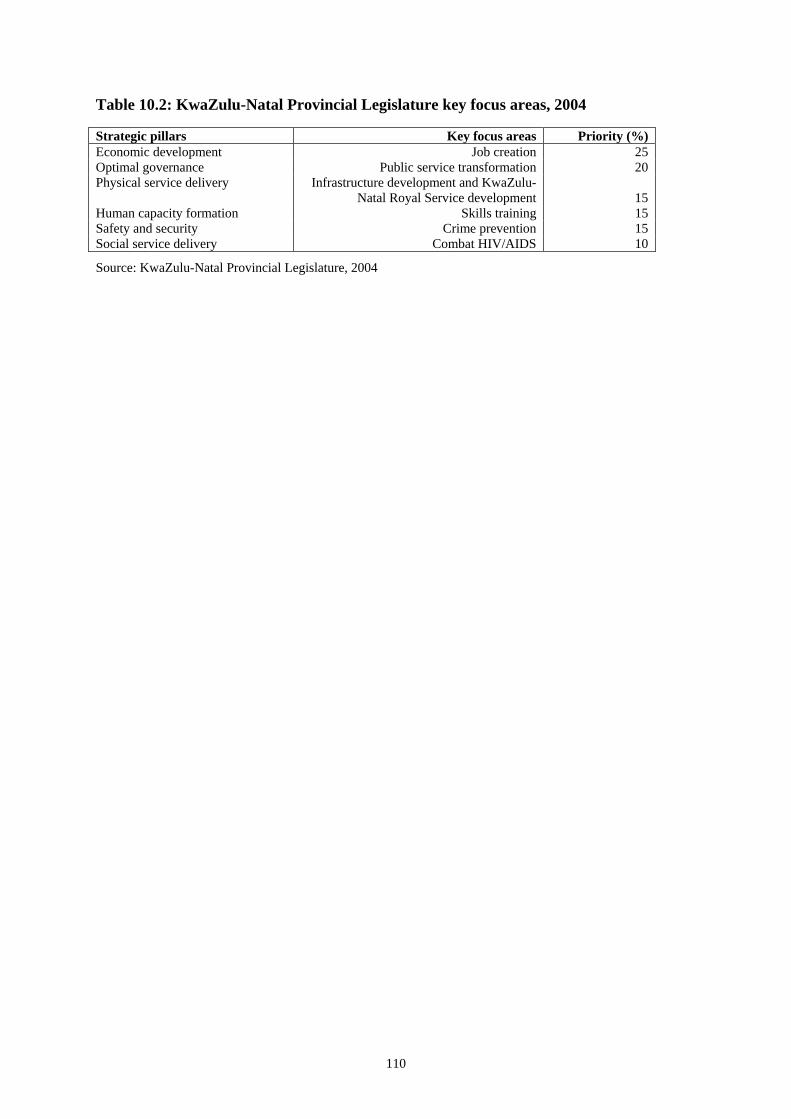
110
Table 10.2: KwaZulu-Natal Provincial Legislature key focus areas, 2004
Strategic pillars Key focus areas Priority (%) Economic development Job creation 25 Optimal governance Public service transformation 20 Physical service delivery Infrastructure development and KwaZulu-
Natal Royal Service development
15 Human capacity formation Skills training 15 Safety and security Crime prevention 15 Social service delivery Combat HIV/AIDS 10
Source: KwaZulu-Natal Provincial Legislature, 2004