Provincial Digital Elevation Model Technical Speci cations...
23
Background This document provides a full description of the data sources used to create the Provincial DEM, the structure of the dataset, as well as data use and limitation considerations For more information, please contact Spatial Data Infrastructure, Ontario Ministry of Natural Resources; [email protected]. 2013 [email protected] Provincial Digital Elevation Model Technical Specifications, v0.1 Objective The Provincial Digital Elevation Model (DEM) is designed to represent true ground elevation across the Province. The Provincial DEM is based on three source datasets: the Ontario Radar DSM, OBM, DTM points and contours, and 2002 GTA Ortho contours. The Provincial DEM can be used for a number of applications such as landscape classification and general terrain analysis. This dataset has not been conditioned for any specific application. As a result, for hydrologic applications, it is suggested that the Ontario Integrated Hydrology dataset is used. This is a separate data product that is available through Land Information Ontario (LIO). The Ontario Integrated Hydrology data is specifically designed for hydrologic analysis, such as watershed creation and flow tracing.
Transcript of Provincial Digital Elevation Model Technical Speci cations...
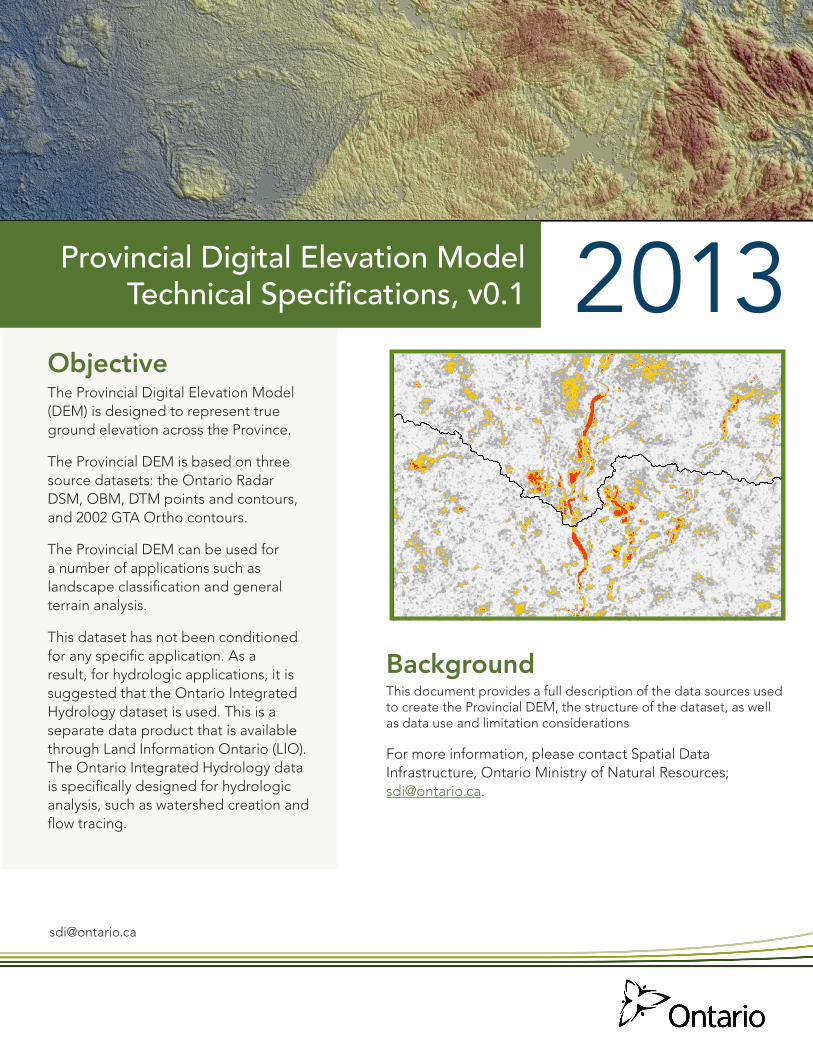
BackgroundThis document provides a full description of the data sources used to create the Provincial DEM, the structure of the dataset, as well as data use and limitation considerations
For more information, please contact Spatial Data Infrastructure, Ontario Ministry of Natural Resources; [email protected].
2013
Provincial Digital Elevation Model Technical Specifications, v0.1
ObjectiveThe Provincial Digital Elevation Model (DEM) is designed to represent true ground elevation across the Province.
The Provincial DEM is based on three source datasets: the Ontario Radar DSM, OBM, DTM points and contours, and 2002 GTA Ortho contours.
The Provincial DEM can be used for a number of applications such as landscape classification and general terrain analysis.
This dataset has not been conditioned for any specific application. As a result, for hydrologic applications, it is suggested that the Ontario Integrated Hydrology dataset is used. This is a separate data product that is available through Land Information Ontario (LIO). The Ontario Integrated Hydrology data is specifically designed for hydrologic analysis, such as watershed creation and flow tracing.
Provincial Digital Elevation Model, Technical Specifications Version 3.0
SDI-ProvincialDigitalElevationModelTechSpec-2013-10-31
Authors: Spatial Data Infrastructure
Ontario Ministry of Natural Resources, Peterborough Ontario
Disclaimer
This technical documentation has been prepared by Her Majesty the Queen in right of Ontario as represented by the Ministry of Natural Resources (the “Ministry”). No warranties or representations, express or implied, statutory or otherwise shall apply or are being made by the Ministry with respect to the documentation, its accuracy or its completeness. In no event will the Ministry be liable or responsible for any lost profits, loss of revenue or earnings, claims by third parties or for any economic, indirect, special, incidental, consequential or exemplary damage resulting from any errors, inaccuracies or omissions in this documentation; and in no event will the Ministry’s liability for any such errors, inaccuracies or omissions on any particular claim, proceeding or action, exceed the actual consideration paid by the claimant involved to the Ministry for the materials to which this instructional documentation relates. Save and except for the liability expressly provided for above, the Ministry shall have no obligation, duty or liability whatsoever in contract, tort or otherwise, including any liability or negligence. The limitations, exclusions and disclaimers expressed above shall apply irrespective of the nature of any cause of action, demand or action, including but not limited to breach of contract, negligence, strict liability, tort or any other legal theory, and shall survive any fundamental breach or breaches.
Additional Information
For more information about this document, please contact the Spatial Data Infrastructure Unit at [email protected]
© 2013, Queen’s Printer for Ontario
Cette publication spécialisée n’est disponible qu’en anglais
Key Words: DEM, elevation, terrain, topography, raw, interpolation, accuracy assessment, unenforced
ii
Provincial Digital Elevation Model Technical Specifications v3.0 | [email protected]
Contents
Acronyms and Abbreviations � � � � � � � � � � � � � � � � � � � � � � � � � � � � � � � � iv
List of Figures � � � � � � � � � � � � � � � � � � � � � � � � � � � � � � � � � � � � � � � � v
List of Tables � � � � � � � � � � � � � � � � � � � � � � � � � � � � � � � � � � � � � � � � v
Executive Summary � � � � � � � � � � � � � � � � � � � � � � � � � � � � � � � � � � � � � 1
Résumé � � � � � � � � � � � � � � � � � � � � � � � � � � � � � � � � � � � � � � � � � � � 1
Revision History � � � � � � � � � � � � � � � � � � � � � � � � � � � � � � � � � � � � � � � 1
1� Introduction� � � � � � � � � � � � � � � � � � � � � � � � � � � � � � � � � � � � � � � � 21�1 Previous and Current DEM Products � � � � � � � � � � � � � � � � � � � � � � � � 31�2 Geographic Extent � � � � � � � � � � � � � � � � � � � � � � � � � � � � � � � 61�3 Void Areas � � � � � � � � � � � � � � � � � � � � � � � � � � � � � � � � � � 61�4 Horizontal Reference System � � � � � � � � � � � � � � � � � � � � � � � � � � � 61�5 Vertical Reference System � � � � � � � � � � � � � � � � � � � � � � � � � � � � 71�6 Spatial Resolution� � � � � � � � � � � � � � � � � � � � � � � � � � � � � � � � 71�7 Spatial Representation � � � � � � � � � � � � � � � � � � � � � � � � � � � � � � 71�8 Data Delivery � � � � � � � � � � � � � � � � � � � � � � � � � � � � � � � � � 71�9 Source Elevation Data � � � � � � � � � � � � � � � � � � � � � � � � � � � � � � 81�10 Interpolation Process � � � � � � � � � � � � � � � � � � � � � � � � � � � � � � 101�11 DEM Mosaic using Path of Least Difference � � � � � � � � � � � � � � � � � � � � � 13
2 Recommended Data Uses and Considerations 142�1 Recommended Data Uses � � � � � � � � � � � � � � � � � � � � � � � � � � � � 142�2 Considerations � � � � � � � � � � � � � � � � � � � � � � � � � � � � � � � � � 14
3 Definitions � � � � � � � � � � � � � � � � � � � � � � � � � � � � � � � � � � � � � � � �15
4 References � � � � � � � � � � � � � � � � � � � � � � � � � � � � � � � � � � � � � � � �164�1 General References � � � � � � � � � � � � � � � � � � � � � � � � � � � � � � � 164�2 Guideline References � � � � � � � � � � � � � � � � � � � � � � � � � � � � � � 164�3 Metadata References � � � � � � � � � � � � � � � � � � � � � � � � � � � � � � 17
iii
Ministry of Natural Resources | Mapping and Information Resources Branch | Spatial Data Infrastructure
Acronyms and AbbreviationsANUDEM Australian National University Digital Elevation Model software
CGVD28 Canadian Geodetic Vertical Datum 1928
CNT Canadian National Transformation
DEM Digital Elevation Model
DSM Digital Surface Model
DTM Digital Terrain Model
EFDIR Enhanced Flow Direction
GTA Greater Toronto Area
LCC Lambert Conformal Conic
LIO Land Information Ontario
MNR (Ontario) Ministry of Natural Resources
MSL Mean Sea Level
NAD83 North American Datum of 1983
NHN National Hydro Network
NRCan Natural Resources Canada
NRVIS Natural Resources Values Information System
OBM Ontario Base Mapping
OFAT Ontario Flow Assessment Tools
OHN Ontario Hydro Network
RMSE Root Mean Squared Error
SDI Spatial Data Infrastructure
USGS United States Geological Survey
WRIP Water Resources Information Program
iv
Provincial Digital Elevation Model Technical Specifications v3.0 | [email protected]
List of Figures
List of Tables
Figure 1� Extent of north and south data packages for the Provincial DEM� � � � � � � � � � 8
Figure 2� Example of contents within a Provincial DEM package� � � � � � � � � � � � � 8
Figure 3� Extent of source elevation datasets used to create the Enforced DEM�� � � � � � � � 9
Figure 4� Interpolation workflow for the Provincial DEM� � � � � � � � � � � � � � � � 11
Figure 5� Striping in the DEM� � � � � � � � � � � � � � � � � � � � � � � � 12
Figure 6� Example of least cost path � � � � � � � � � � � � � � � � � � � � � 13
Table 1� Description of past and present versions of the Provicial DEM product � � � � � � � � 3
Table 2� Elevation products available in Ontario�� � � � � � � � � � � � � � � � � � 5
Table 3�Description of data package version number sequence� � � � � � � � � � � � � 6
Table 4� Description of reference feature classes in the Provincial DEM packages � � � � � � � 8
Table 5� Ontario Base Mapping specifications (adapted from MNR, 1994)� � � � � � � � � � 9
v
Ministry of Natural Resources | Mapping and Information Resources Branch | Spatial Data Infrastructure
Executive SummaryThe Provincial DEM is designed to represent true ground elevation across the Province. Based on best source data for different parts of the Province, it is a general purpose dataset from which other special purpose datasets have been derived. The Provincial DEM is based on three source datasets: the Ontario Radar DSM, OBM, DTM points and contours, and 2002 GTA Ortho contours. The Provincial DEM can be used for a number of applications such as landscape classification and general terrain analysis. This dataset has not been conditioned for any specific application. As a result, for hydrologic applications, it is suggested that the Ontario Integrated Hydrology dataset is used. This is a separate data product that is available through Land Information Ontario (LIO). The Ontario Integrated Hydrology data is specifically designed for hydrologic analysis, such as watershed creation and flow tracing.
This document provides a full description of the data sources used to create the Provincial DEM, the structure of the dataset, as well as data use and limitation considerations.
RésuméLe MAN provincial est conçu pour donner une représentation véritable de l’élévation dans la province. Basé sur la meilleure source de données pour les différentes parties de la province, il est un ensemble de données polyvalentes à partir duquel d’autres ensembles de données à usage déterminé ont été dérivés. Le MAN provincial est basé sur trois sources d’ensembles de données le MNS ontarien des données radar, les points et les courbes de niveau du MNT du programme de cartographie de base de l’Ontario et les courbes de niveaux des projets d’orthographie de la RGT de 2002. Le MAN provincial peut être utilisé pour un certain nombre d’applications, comme la classification des paysages et l’analyse générale du terrain. Cet ensemble de données n’a pas été conditionné pour une application déterminée. Par conséquent, pour les applications hydrologiques, utilisez Ontario Integrated Hydrology Data (données hydrologiques intégrées de l’Ontario) - un produit de données distinct qui est disponible par l’entremise d’Information sur les terres de l’Ontario (ITO). Ontario Integrated Hydrology Data (données hydrologiques intégrées de l’Ontario) est conçu particulièrement pour l’analyse hydrologique, comme la création de bassins versants et le tracé des débits.
Ce document donne une description complète des sources de données utilisées pour créer le MAN provincial, la structure de l’ensemble de données ainsi que l’utilisation des données et les considérations relatives aux limitations.
Provincial Digital Elelvation Model, Technical Specifications Version 3.0
1
Ministry of Natural Resources | Mapping and Information Resources Branch | Spatial Data Infrastructure

Revision HistoryDate Document Version Section DescriptionOctober, 2013 1�0 Spatial Data Infrastructure Initial Release
2
Provincial Digital Elevation Model Technical Specifications v3.0 | [email protected]
1. IntroductionDEMs are used for a broad range of studies including projects tied to the fields of geology, forestry, ecology, climatology, and hydrology. A DEM that more closely represents ground elevations, such as the Provincial DEM, can be used to determine terrain attributes such as slope, aspect, or elevation at a specific location. DEMs are also used for remotely predicting geologic features such as fault lines, landforms and inferring material types. One of the main drivers and dependencies is the need for an elevation model to support the generation of Provincial integrated hydrology data. For hydrologic analysis, such as generating watersheds, use of the Ontario Integrated Hydrology Data product is recommended (MNR, 2012a). However, the Provincial DEM can serve as a useful reference for watershed analysis particularly when unmodified ground elevations are required along river corridors, which are altered during the hydrologic conditioning process.
The Provincial DEM is a raster elevation surface that is interpolated from “raw” ground elevation data sources such as Digital Terrain Model (DTM) points, contour lines or spot heights. Contours and spot heights have been used as an interpolation source where coverage of DTM is lacking. For the majority of Ontario’s Far North region, the Ontario Radar DSM was used in order to provide complete provincial coverage for the product. It should be noted that, unlike the other source elevation data mentioned, elevation values in the Ontario Radar DSM are more influenced by vegetation and other surface features which reduces the accuracy of ground elevations. An accuracy assessment is being generated to report on the accuracy of ground elevations associated with each elevation data source which will allow data users to consider limitations and suitable uses of the Provincial DEM.
1.1 Previous and Current DEM Products1.1.1 Previous DEM Prodcuts
The Water Resources Information Program (WRIP) developed two previous versions of the Provincial DEM (see Table 1). In September 2013, WRIP was merged with the former Base Data Infrastructure Unit (BDI) to create the Spatial Data Infrastructure Unit (SDI). The SDI Unit is now responsible for Provincial DEM Version 3 maintenance and updates. For more information please contact SDI ([email protected]).
Versions 1 and 2 were hydrologically conditioned DEMs and were intended to be primarily used for watershed analysis (MNR, 2008). The geographical extent was limited to the lower two thirds of Ontario. The DEMs were projected in UTM zones 15, 16, 17, and 18. The cell resolution was 10 metres for the southern area of Ontario and 20 metres for the northern area. Source elevation data for DEM version 1 was primarily OBM contour based. Source elevation data for DEM version 2 included OBM contours, OBM DTM points, OBM Spot Heights, and 2002 GTA Ortho contours.
3
Ministry of Natural Resources | Mapping and Information Resources Branch | Spatial Data Infrastructure
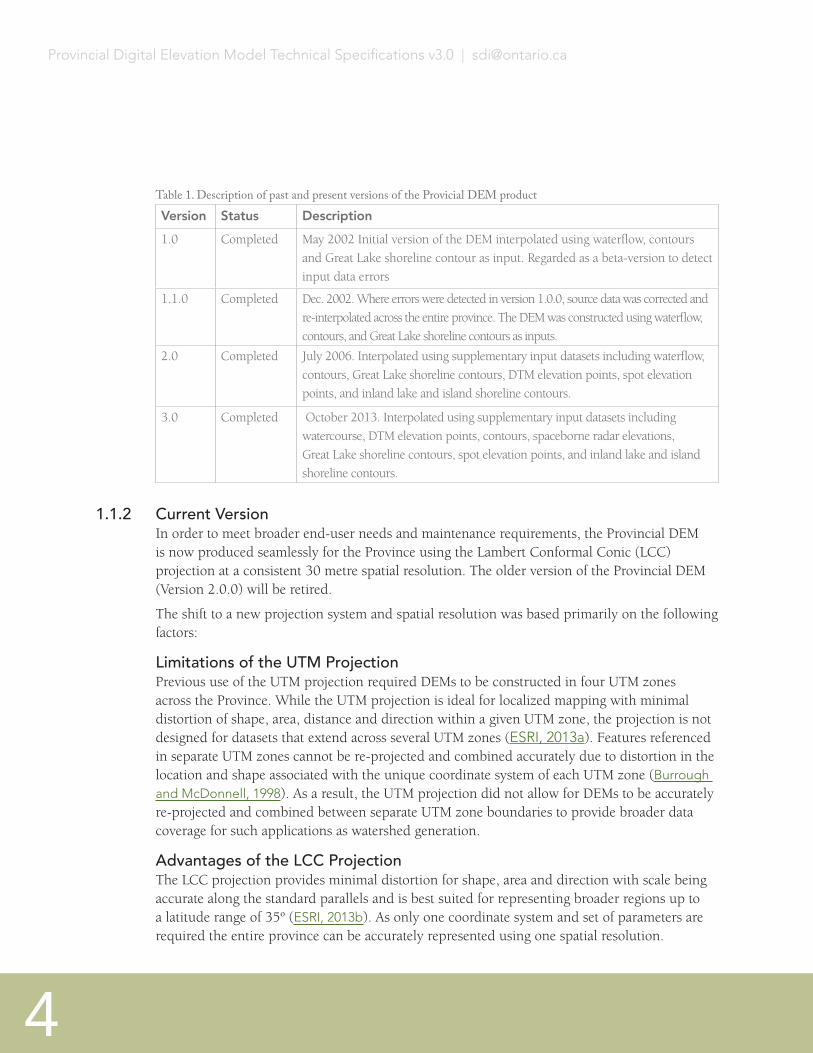
Table 1. Description of past and present versions of the Provicial DEM product
Version Status Description
1.0 Completed May 2002 Initial version of the DEM interpolated using waterflow, contours and Great Lake shoreline contour as input. Regarded as a beta-version to detect input data errors
1.1.0 Completed Dec. 2002. Where errors were detected in version 1.0.0, source data was corrected and re-interpolated across the entire province. The DEM was constructed using waterflow, contours, and Great Lake shoreline contours as inputs.
2.0 Completed July 2006. Interpolated using supplementary input datasets including waterflow, contours, Great Lake shoreline contours, DTM elevation points, spot elevation points, and inland lake and island shoreline contours.
3.0 Completed October 2013. Interpolated using supplementary input datasets including watercourse, DTM elevation points, contours, spaceborne radar elevations, Great Lake shoreline contours, spot elevation points, and inland lake and island shoreline contours.
1.1.2 Current VersionIn order to meet broader end-user needs and maintenance requirements, the Provincial DEM is now produced seamlessly for the Province using the Lambert Conformal Conic (LCC) projection at a consistent 30 metre spatial resolution. The older version of the Provincial DEM (Version 2.0.0) will be retired.
The shift to a new projection system and spatial resolution was based primarily on the following factors:
Limitations of the UTM ProjectionPrevious use of the UTM projection required DEMs to be constructed in four UTM zones across the Province. While the UTM projection is ideal for localized mapping with minimal distortion of shape, area, distance and direction within a given UTM zone, the projection is not designed for datasets that extend across several UTM zones (ESRI, 2013a). Features referenced in separate UTM zones cannot be re-projected and combined accurately due to distortion in the location and shape associated with the unique coordinate system of each UTM zone (Burrough and McDonnell, 1998). As a result, the UTM projection did not allow for DEMs to be accurately re-projected and combined between separate UTM zone boundaries to provide broader data coverage for such applications as watershed generation.
Advantages of the LCC ProjectionThe LCC projection provides minimal distortion for shape, area and direction with scale being accurate along the standard parallels and is best suited for representing broader regions up to a latitude range of 35o (ESRI, 2013b). As only one coordinate system and set of parameters are required the entire province can be accurately represented using one spatial resolution.
4
Provincial Digital Elevation Model Technical Specifications v3.0 | [email protected]
Consistent Spatial ResolutionOlder versions of the Provincial DEM (Versions 1 and 2) were produced using two separate spatial resolutions (10 and 20 metres). A DEM product with a consistent spatial resolution and seamless Provincial extent is required for a number of regional and provincial-scale applications. Hydrologic modeling applications, such as the Ontario Flow Assessment Tools (OFAT), and hydrology data products, such as the Ontario Integrated Hydrology Data product, can be constructed and maintained more readily using a seamless DEM with a consistent spatial resolution. A 30 metre spatial resolution was identified to provide an optimal consistent resolution based on the range in densities and accuracies of elevation data being sourced across the province. See section 1.9 for more details on the elevation source datasets.
1.1.3 Elevation Products Available in OntarioTable 2 provides a listing of elevation products available in Ontario. Each product has specific characteristics and limitations that should be considered before the product is used for an application. It is important to note that a range of local DEM products are available for more site specific purposes that may offer higher vertical and horizontal accuracies depending on the needs of a given study. For further information on these local DEM products, please contact SDI ([email protected])
Table 2. Elevation products available in Ontario.
Title Ontario Radar Digital Surface Model (DSM)
Provincial Digital Elevation Model (DEM) 3.0
Provincial Digital Elevation Model (DEM) 2.0
Local Digital Elevation Model (DEM)
Source Single-source, spaceborne radar
Multi-source Multi-source Multi-source (lidar, pixel correlation, softcopy)
Projection Lambert Conformal Conic
Lambert Conformal Conic
UTM UTM
Vertical Datum EGM96, CGVD28 CGVD28 CGVD28 CGVD28
Included
derivatives
None (un-conditioned product)
Un-conditioned DEM Hydro-enforced DEM Products vary based on initiative
Extent Provincial seamless Provincial seamless AOU and southern Ontario
Localised, site specific and non-contiguous
Resolution 30m 30m Variable (10m/20m) Variable (<10m)
Suggested
Data Uses
Source of elevation data for Far North region
Suited for Provincial applications and to duplicate results from OFAT
Retired dataset Greatest accuracy on a local level. Every local area can be different
Associated
Integrated
Hydrology
Product
Ontario Integrated Hydrology (OIH)
Ontario Integrated Hydrology (OIH)
ArcHydro Quaternary Sessions
Varies based on initiative
5
Ministry of Natural Resources | Mapping and Information Resources Branch | Spatial Data Infrastructure
1.1.4 Version SystemA version system has been developed to track changes made to the Provincial DEM which makes use of a two number sequence identifier (See Table 3). A major number increase indicates major changes have taken place such as the recreation of the entire dataset. A minor number increase indicates minor changes have taken place such as corrections to specific tiles within the dataset. A text file named ‘Version.txt’ can be found in the root folder of the packaged data
Table 3.Description of data package version number sequence.
Version Notes
3.0 Initial Release of Data
3.1 Update to single or select few tiles
4.0 Major change to DEM such as new elevation source data on regional level
1.2 Geographic ExtentThe horizontal extent of the data provides continuous spatial coverage for the entire province of Ontario. The bounding extent for all data layers is:
• West-bounding coordinate: -950 longitude• East-bounding coordinate: -740 longitude• North-bounding coordinate: 560 latitude• South-bounding coordinate: 410 latitude
The vertical extent of the dataset is expressed in metres. The lowest vertical extent is along the coast of James Bay and Hudson Bay which reaches the elevation of mean sea level. The highest vertical extent is 689.59 metres, located at Ishpatina Ridge (47.320N, 80.750W) in Lady Evelyn-Smoothwater Wilderness Park located approximately 70 kilometres west of the town of Latchford.
1.3 Void AreasAll raster DEM cells extending beyond 1000 metres of the official Provincial boundary dataset have been classified as no data values.
1.4 Horizontal Reference System1.4.1 Horizontal Datum and Coordinate System
The horizontal datum and coordinate system used for the data is North American Datum 1983 (NAD83) / Ontario MNR Lambert. This datum and coordinate system are defined within the European Petroleum Survey Group’s (EPSG) Geodetic Parameter Registry (Code 3161). The following parameters are used in association with the coordinate system:
6
Provincial Digital Elevation Model Technical Specifications v3.0 | [email protected]
• False Easting: 930000.00• False Northing: 6430000.00• Central Meridian: -85.00• 1st Standard Parallel: 44.50• 2nd Standard Parallel: 53.50• Latitude of Origin: 0.00• Linear Unit: Metres
1.4.2 Horizontal Unit of Measure (coordinate system axis units)The horizontal unit of measure is metres (m).
1.5 Vertical Reference System1.5.1 Vertical Coordinate System
The vertical datum of the DEM is based on the Canadian Geodetic Vertical Datum 1928 (CGVD28) of the Geodetic Survey Division, and is measured in metres above mean sea level. This datum is defined within the European Petroleum Survey Group’s (EPSG) Geodetic Parameter Registry (Code 5713).
1.5.2 Vertical Unit of Measure (coordinate system axis units)The vertical unit of measure for all raster grid cells in the DEM is metres (m). One single vertical elevation value is associated with each raster grid cell in the DEM.
1.6 Spatial ResolutionThe grid spacing is based on the Lambert Conformal Conic projection with a raster cell resolution of 30 metres across the entire extent of the Province. A common grid reference has been used for all raster datasets when developing the Provincial DEM using the following lower-left cell centre reference point:
• Lower-left X: 180000 metres• Lower-left Y: 1780000 metres
1.7 Spatial RepresentationA raster grid is used to represent the DEM where each raster grid cell has a single elevation value associated.
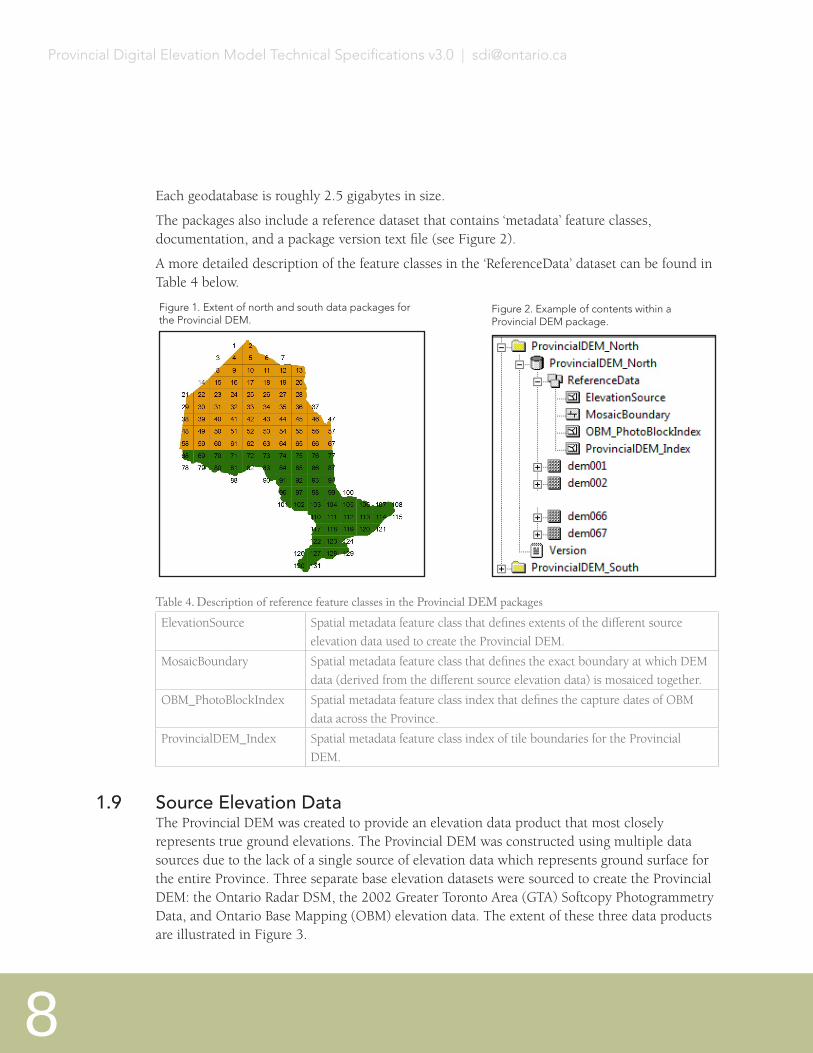
1.8 Data DeliveryThe Provincial DEM and metadata are currently stored and distributed through Land Information Ontario (LIO) www.lio.gov.on.ca. Within LIO, metadata for the Provincial DEM can be accessed through the LIO Metadata Management Tool https://www.appliometadata.lrc.gov.on.ca/geonetwork/srv/en/main.home. The physical data is distributed as two ESRI File Geodatabases. The first (ProvincialDEM_North.gdb) contains 67 tiles (1 to 67) and covers the northern extent of Ontario (see Figure 1). The second (ProvincialDEM_South.gdb) contains 59 tiles (68 to 131) and covers the southern extent of Ontario.
7
Ministry of Natural Resources | Mapping and Information Resources Branch | Spatial Data Infrastructure
Each geodatabase is roughly 2.5 gigabytes in size.
The packages also include a reference dataset that contains ‘metadata’ feature classes, documentation, and a package version text file (see Figure 2).
A more detailed description of the feature classes in the ‘ReferenceData’ dataset can be found in Table 4 below.
Table 4. Description of reference feature classes in the Provincial DEM packages
ElevationSource Spatial metadata feature class that defines extents of the different source elevation data used to create the Provincial DEM.
MosaicBoundary Spatial metadata feature class that defines the exact boundary at which DEM data (derived from the different source elevation data) is mosaiced together.
OBM_PhotoBlockIndex Spatial metadata feature class index that defines the capture dates of OBM data across the Province.
ProvincialDEM_Index Spatial metadata feature class index of tile boundaries for the Provincial DEM.
1.9 Source Elevation DataThe Provincial DEM was created to provide an elevation data product that most closely represents true ground elevations. The Provincial DEM was constructed using multiple data sources due to the lack of a single source of elevation data which represents ground surface for the entire Province. Three separate base elevation datasets were sourced to create the Provincial DEM: the Ontario Radar DSM, the 2002 Greater Toronto Area (GTA) Softcopy Photogrammetry Data, and Ontario Base Mapping (OBM) elevation data. The extent of these three data products are illustrated in Figure 3.
Figure 1. Extent of north and south data packages for the Provincial DEM.
Figure 2. Example of contents within a Provincial DEM package.
8
Provincial Digital Elevation Model Technical Specifications v3.0 | [email protected]
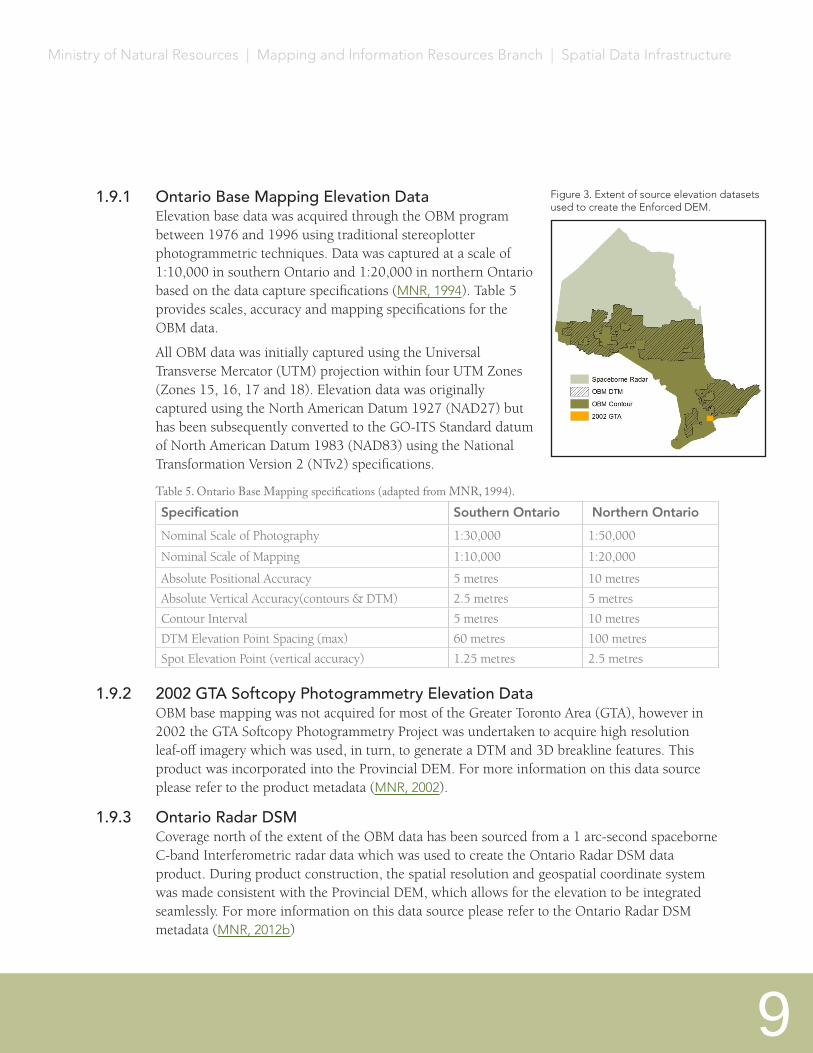
1.9.1 Ontario Base Mapping Elevation DataElevation base data was acquired through the OBM program between 1976 and 1996 using traditional stereoplotter photogrammetric techniques. Data was captured at a scale of 1:10,000 in southern Ontario and 1:20,000 in northern Ontario based on the data capture specifications (MNR, 1994). Table 5 provides scales, accuracy and mapping specifications for the OBM data.
All OBM data was initially captured using the Universal Transverse Mercator (UTM) projection within four UTM Zones (Zones 15, 16, 17 and 18). Elevation data was originally captured using the North American Datum 1927 (NAD27) but has been subsequently converted to the GO-ITS Standard datum of North American Datum 1983 (NAD83) using the National Transformation Version 2 (NTv2) specifications.
Table 5. Ontario Base Mapping specifications (adapted from MNR, 1994).
Specification Southern Ontario Northern Ontario
Nominal Scale of Photography 1:30,000 1:50,000
Nominal Scale of Mapping 1:10,000 1:20,000
Absolute Positional Accuracy 5 metres 10 metres
Absolute Vertical Accuracy(contours & DTM) 2.5 metres 5 metres
Contour Interval 5 metres 10 metres
DTM Elevation Point Spacing (max) 60 metres 100 metres
Spot Elevation Point (vertical accuracy) 1.25 metres 2.5 metres
1.9.2 2002 GTA Softcopy Photogrammetry Elevation DataOBM base mapping was not acquired for most of the Greater Toronto Area (GTA), however in 2002 the GTA Softcopy Photogrammetry Project was undertaken to acquire high resolution leaf-off imagery which was used, in turn, to generate a DTM and 3D breakline features. This product was incorporated into the Provincial DEM. For more information on this data source please refer to the product metadata (MNR, 2002).
1.9.3 Ontario Radar DSMCoverage north of the extent of the OBM data has been sourced from a 1 arc-second spaceborne C-band Interferometric radar data which was used to create the Ontario Radar DSM data product. During product construction, the spatial resolution and geospatial coordinate system was made consistent with the Provincial DEM, which allows for the elevation to be integrated seamlessly. For more information on this data source please refer to the Ontario Radar DSM metadata (MNR, 2012b)
Figure 3. Extent of source elevation datasets used to create the Enforced DEM.
9
Ministry of Natural Resources | Mapping and Information Resources Branch | Spatial Data Infrastructure
1.9.4 Temporal ExtentThe source datasets used to construct the product are commensurate to the OBM project, which was captured between 1976 and 1996 (See OBM_PhotoBlockIndex feature class in ReferenceData feature dataset of data packages). Partial coverage for areas in DEM Tiles 123 and 124 was not captured during the OBM project. Source elevation data for these tiles was obtained from the Greater Toronto Area Ortho-photo project captured using softcopy photogrammetry in 2002. The Ontario Radar DSM data was acquired in February of 2000. Some data improvements have been made to the original source elevation data over time. These are described in the next section.
1.9.5 ElevationsElevations of the Provincial DEM are orthometric and expressed in reference to metres above mean sea level.
1.9.6 WaterbodiesShoreline elevations for the Great Lakes have been incorporated into the Provincial DEM. Where possible, shoreline elevations for inland waterbodies have also been included across the province. Actual elevations within lakes are not maintained as areas of constant elevation (i.e. flat surfaces).
1.10 Interpolation Process1.10.1 ANUDEM Software
ANUDEM (Australian National University Digital Elevation Model) is an internationally renowned software package that “calculates values on a regular grid of a discretized smooth surface fitted to large numbers of irregularly spaced elevation data points, contour line data and stream line data” (Hutchinson, 1989). ANUDEM was used for creating previous DEM products, such as DEM Version 1.0.0 and DEM Version 2.0.0. After a review of other interpolation products, ANUDEM was still identified as the optimal software package for consecutively interpolating both contour and point elevation datasets. A recent upgrade was made to ANUDEM with the release of Version 5.2 (Hutchinson, 2005) which was used for this product. This new version includes a number of enhancements: i) a major revision of the drainage enforcement algorithm, ii) improved handling of stream and lake data as an input to the DEM, and iii) improved interpolation for complex topography around ridges and valleys using contour data.
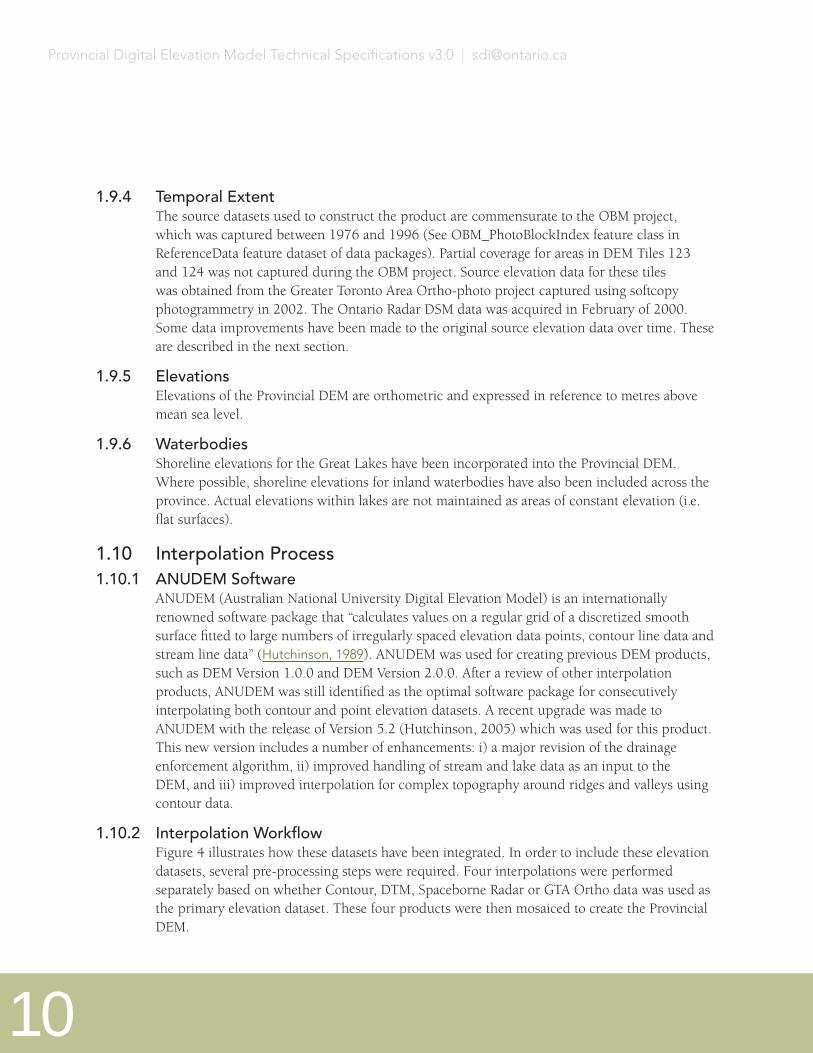
1.10.2 Interpolation WorkflowFigure 4 illustrates how these datasets have been integrated. In order to include these elevation datasets, several pre-processing steps were required. Four interpolations were performed separately based on whether Contour, DTM, Spaceborne Radar or GTA Ortho data was used as the primary elevation dataset. These four products were then mosaiced to create the Provincial DEM.
10
Provincial Digital Elevation Model Technical Specifications v3.0 | [email protected]
1.10.3 DTM De-StripingDTM elevation points were not captured for all areas of the province during the OBM program. Between 1978 and 1987, only contours were generated using traditional cartographic techniques and a DTM was not produced. In 1988, digital contours were produced from the DTM elevation point dataset using automated photogrammetric software utilities. In total, OBM DTM elevation point data was captured for approximately 70% of the extent of OBM mapping in the province (See Figure 3, page 9).
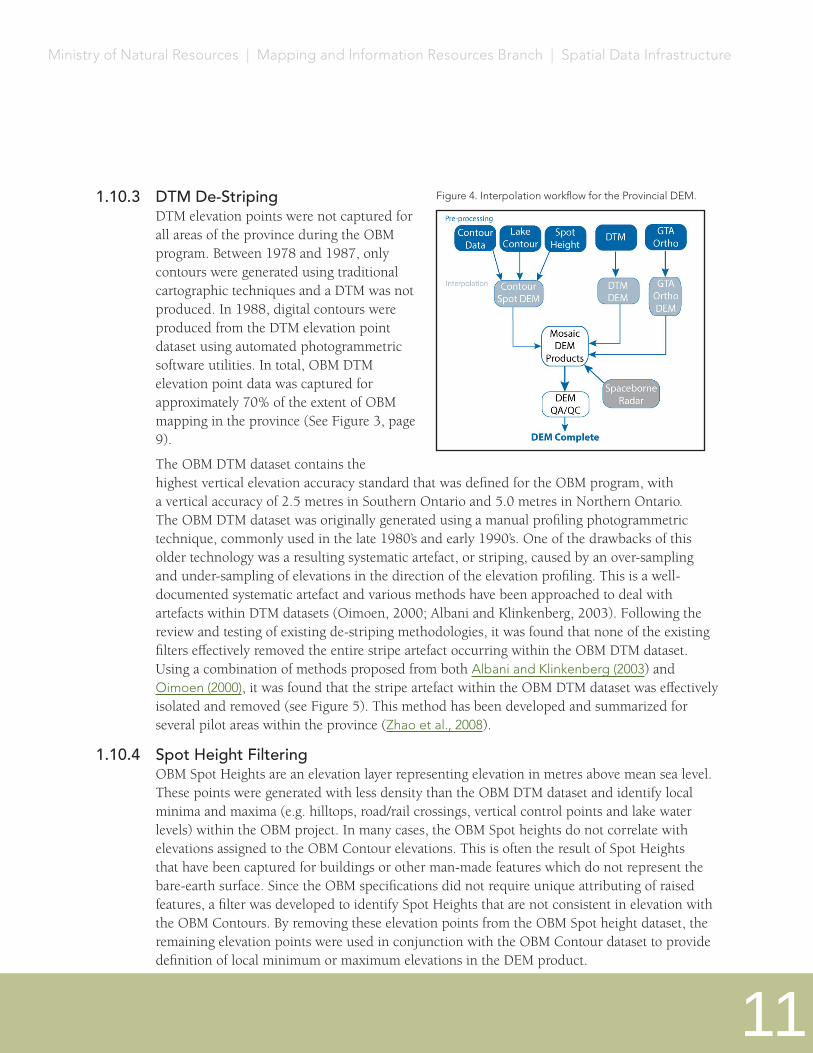
The OBM DTM dataset contains the highest vertical elevation accuracy standard that was defined for the OBM program, with a vertical accuracy of 2.5 metres in Southern Ontario and 5.0 metres in Northern Ontario. The OBM DTM dataset was originally generated using a manual profiling photogrammetric technique, commonly used in the late 1980’s and early 1990’s. One of the drawbacks of this older technology was a resulting systematic artefact, or striping, caused by an over-sampling and under-sampling of elevations in the direction of the elevation profiling. This is a well-documented systematic artefact and various methods have been approached to deal with artefacts within DTM datasets (Oimoen, 2000; Albani and Klinkenberg, 2003). Following the review and testing of existing de-striping methodologies, it was found that none of the existing filters effectively removed the entire stripe artefact occurring within the OBM DTM dataset. Using a combination of methods proposed from both Albani and Klinkenberg (2003) and Oimoen (2000), it was found that the stripe artefact within the OBM DTM dataset was effectively isolated and removed (see Figure 5). This method has been developed and summarized for several pilot areas within the province (Zhao et al., 2008).
1.10.4 Spot Height FilteringOBM Spot Heights are an elevation layer representing elevation in metres above mean sea level. These points were generated with less density than the OBM DTM dataset and identify local minima and maxima (e.g. hilltops, road/rail crossings, vertical control points and lake water levels) within the OBM project. In many cases, the OBM Spot heights do not correlate with elevations assigned to the OBM Contour elevations. This is often the result of Spot Heights that have been captured for buildings or other man-made features which do not represent the bare-earth surface. Since the OBM specifications did not require unique attributing of raised features, a filter was developed to identify Spot Heights that are not consistent in elevation with the OBM Contours. By removing these elevation points from the OBM Spot height dataset, the remaining elevation points were used in conjunction with the OBM Contour dataset to provide definition of local minimum or maximum elevations in the DEM product.
Figure 4. Interpolation workflow for the Provincial DEM.
11
Ministry of Natural Resources | Mapping and Information Resources Branch | Spatial Data Infrastructure
1.10.5 Lake Shoreline ElevationsAn additional enhancement for the Provincial DEM was the inclusion of lake shoreline elevations for lake features. Lake elevations were photogrammetrically captured during the OBM program and included within the OBM Spot Height dataset. By associating the OBM Spot Height dataset with lake polygons, lake shoreline contours were integrated into the Provincial DEM. Pre-processing techniques were developed to capture elevations for both inland lakes and the Great Lakes water system.
1.10.6 Contour EditsA contour is a linear vector layer representing isolines, or lines of equal elevation, in metres above mean sea level. Within the OBM program, contours were captured for each OBM mapping tile across the province. However, the process for acquiring this contour mapping varied based on the timeframe at which the OBM tile was interpreted. A general history of the transformations of the OBM contour data is documented below:
• From 1976 to 1988, contours were derived using photogrammetric techniques for the original OBM program. These contours were originally intended for cartographic use and were only plotted in hard copy format.
• In 1988, digital contours were produced from the DTM elevation point data set using automated software utilities. DTM elevation points were acquired through photogrammetric techniques only in certain portions of the province, therefore digital contours only existed in these areas.
• Starting in 1992, areas without digital contours were digitized from the original hardcopy OBM series. Approximately 5,000 of the 10,000+ tiles were created using this method.
• In 1996, individual OBM tiles were aggregated into NRVIS and stored by MNR district.• In 1998, several automated procedures were developed by the NRVIS team to search and
correct attribute coding errors in the contour coverage. This process did not eliminate all attribute errors.
• In 2001, WRIP developed new procedures to search and correct additional attribute coding errors in the contour coverage. This process did not eliminate all attribute errors.
before stripe removal after stripe removal
Figure 5. Striping in the DEM resulting from the systematic artefact in the OBM DTM elevation data
12
Provincial Digital Elevation Model Technical Specifications v3.0 | [email protected]
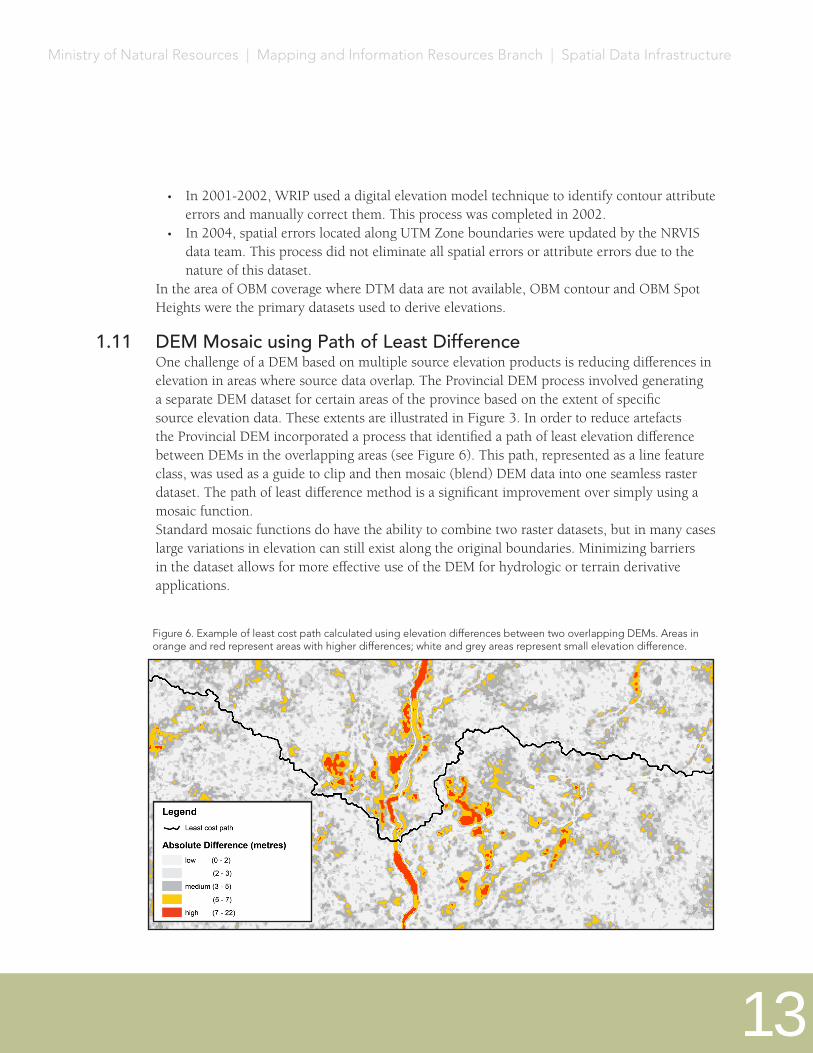
• In 2001-2002, WRIP used a digital elevation model technique to identify contour attribute errors and manually correct them. This process was completed in 2002.
• In 2004, spatial errors located along UTM Zone boundaries were updated by the NRVIS data team. This process did not eliminate all spatial errors or attribute errors due to the nature of this dataset.
In the area of OBM coverage where DTM data are not available, OBM contour and OBM Spot Heights were the primary datasets used to derive elevations.
1.11 DEM Mosaic using Path of Least DifferenceOne challenge of a DEM based on multiple source elevation products is reducing differences in elevation in areas where source data overlap. The Provincial DEM process involved generating a separate DEM dataset for certain areas of the province based on the extent of specific source elevation data. These extents are illustrated in Figure 3. In order to reduce artefacts the Provincial DEM incorporated a process that identified a path of least elevation difference between DEMs in the overlapping areas (see Figure 6). This path, represented as a line feature class, was used as a guide to clip and then mosaic (blend) DEM data into one seamless raster dataset. The path of least difference method is a significant improvement over simply using a mosaic function. Standard mosaic functions do have the ability to combine two raster datasets, but in many cases large variations in elevation can still exist along the original boundaries. Minimizing barriers in the dataset allows for more effective use of the DEM for hydrologic or terrain derivative applications.
Figure 6. Example of least cost path calculated using elevation differences between two overlapping DEMs. Areas in orange and red represent areas with higher differences; white and grey areas represent small elevation difference.
13
Ministry of Natural Resources | Mapping and Information Resources Branch | Spatial Data Infrastructure
2 Recommended Data Uses and Considerations2.1 Recommended Data Uses
The Provincial DEM has several important applications and uses where true ground elevations are required especially along riparian channels and other areas altered in the hydro-enforcement process. Some suitable uses include:
• Generating slope and aspect derived products;• Querying elevation values in a given area, such as a watershed unit;• As a reference or input dataset for predictive mapping associated with the study or
mapping of surficial geology, land cover, morphology, and terrestrial and aquatic ecology; and,
• Where users prefer to apply their own hydrology enforcement techniques to address site-specific issues not addressed in the Enforced DEM and Enhanced Flow Direction products the Provincial DEM can serve as a suitable input data source.
2.2 Considerations2.2.1 Other Elevation Datasets
A number of large-scale elevation datasets have been acquired within the Province for more localized areas. These datasets can provide greater accuracy and precision depending on given applications. To obtain information on other available elevation data products within the Province, please contact SDI ([email protected]).
2.2.2 DEM InterpolationANUDEM software makes use of a spline interpolation algorithm and applies a decreasing elevation value along streams in a downstream direction during the hydrologic enforcement process. Other interpolation methods (e.g. Inverse Distance Weighting, Natural Neighbours, local or global polynomial, etc.) will produce slightly different elevation surfaces and may be more suitable for other applications. It is the responsibility of the user to determine if the Provincial DEM is suitable for their application or whether another product should be used. To obtain information on other available elevation data products within the Province, please contact SDI ([email protected]).
2.2.3 Raster Merging and MosaicingWhen two or more raster datasets need to be assembled together to cover a specific study area a raster merge or mosaic function must be used. This allows for a smooth transition along the raster boundaries with a minor amount of interpolation. It is recommended to use a mosaic tool with a blend option when mosaicing DEM data tiles. Blending uses a weight-based algorithm which is most commonly used for non-categorical, continuous data.
2.2.4 Future MaintenanceA maintenance schedule is currently being developed for the Provincial DEM product to
14
Provincial Digital Elevation Model Technical Specifications v3.0 | [email protected]
address errors and data improvements. Future updates may include the incorporation of large scale elevation products currently available for areas of the Province to improve vertical accuracy. In some areas a change detection analysis could be used to determine if the current Provincial DEM needs to be updated, depending on the magnitude of change. Large scale elevation data would need to be re-processed into a suitable medium scale data product before incorporating into the Provincial DEM. At the present moment there are no definitive plans to implement these procedures in future versions. With the recent availability of newer, finer elevation data products for Ontario SDI will need to develop specific maintenance processes to incorporate the data into the Provincial DEM. These maintenance processes will provide a clear, streamlined approach for creating future product versions.
3 DefinitionsContours
A contour is a linear vector feature representing isolines, or lines of equal elevation, in metres above mean sea level.
Digital Terrain ModelA Digital Terrain Model (DTM) is a series of points, typically collected using photogrammetry, which provide unique elevation points in metres above mean sea level. DTM points are primarily designed for constructing DEMs, and therefore have a high density of elevation samples.
Digital Elevation ModelA Digital Elevation Model (DEM) is an interpolated raster elevation dataset that provides a measure of ground surface elevations in metres above mean sea level. A DEM provides a 3-dimensional (3D) model of the ground surface and is represented as a grid of regularly spaced square cells (raster pixels) to which elevation values are referenced, using a defined horizontal and vertical datum.
Hydrologic EnforcementHydrologic enforcement is the process of conditioning a DEM to allow each cell to drain in a downward direction with barriers to flow being removed, where possible. The two main functions of hydrologic enforcement include clearing spurious sinks and ensuring that cells along streams decrease with elevation in a downstream direction.
InterpolationThe process of deriving elevations for a location on the Earth’s surface based on points where elevations have been measured. Many interpolation algorithms exist including spline, inverse distance weighting, and kriging.
15
Ministry of Natural Resources | Mapping and Information Resources Branch | Spatial Data Infrastructure
4 References4.1 General References
Albani, M. and Klinkenberg, B., 2003. A spatial filter for the removal of striping artefacts in digital elevation models. Photogrammetric Engineering & Remote Sensing, Vol. 69, No. 7, pp. 755 – 765.
Burrough, P.A. and McDonnell, R.A. 1998. Principles of Geographical Information Systems, New York: Oxford University Priess, 333p.
Environmental Science Research Institute (ESRI). 2012. Hydro Resource Centre, http://resources.arcgis.com/content/hydro.
Environmental Science Research Institute (ESRI). 2013a. ArcGIS Desktop 9.3 Help, http://webhelp.esri.com/arcgisdesktop/9.3/index.cfm?TopicName=Universal%20Transverse%20Mercator.
Environmental Science Research Institute (ESRI). 2013b. ArcGIS Desktop 9.3 Help, http://webhelp.esri.com/arcgisdesktop/9.3/index.cfm?TopicName=Lambert_Conformal_Conic.
Hutchinson, M.F., 1989. A new procedure for gridding elevation and stream line data with automatic removal of pits. Journal of Hydrology 106: 211-232.
Hutchinson, M.F. 2005. ANUDEM 5.1 User’s Guide. 2005. Centre for Resources and Environmental Studies, Australian National University, Canaberra, Australia.
Ministry of Natural Resources (MNR). 2008. Provincial DEM Version 2.0.0 Product Specification, Geographic Information Branch, Science and Information Resources Division, 25p
Oimoen, M.J., 2000. An effective filter for removal of production artefacts in U.S. Geological Survey 7.5 minute digital elevation models, in Fourteenth International Conference on Applied Geologic Remote Sensing, Las Vegas, Nevada, November 6-8, 2000, Proceedings: Ann Arbor, Michigan, Veridian ERIM International, pp. 311-319.
Zhao, J., Todd, K., Hogg, A. and Kenny, F. 2008. Improving Ontario’s Digital Elevation Model, Internal Report, Water Resources Information Program, Ministry of Natural Resources, 90p.
4.2 Guideline ReferencesMinistry of Natural Resources (MNR). 1994. Ontario Government Specifications For the
Delivery of Digital Topographic Data and Cartographic Representation Products at Medium Scales, Geographic Information Branch, Science and Information Resources Division, 59p.
16
Provincial Digital Elevation Model Technical Specifications v3.0 | [email protected]

4.3 Metadata ReferencesMinistry of Natural Resources (MNR), 2002. Greater Toronto Area Digital Elevation Model
2002, Metadata record, Geographic Information Branch, Science and Information Resources Division, Metadata URL:
Ministry of Natural Resources (MNR), 2012a. Ontario Integrated Hydrology Data, Metadata record, Geographic Information Branch, Science and Information Resources Division, Metadata URL.
Ministry of Natural Resources (MNR). 2012b. Ontario Radar DSM, Metadata record, Geographic Information Branch, Science and Information Resources Division, Metadata URL.
17
Ministry of Natural Resources | Mapping and Information Resources Branch | Spatial Data Infrastructure
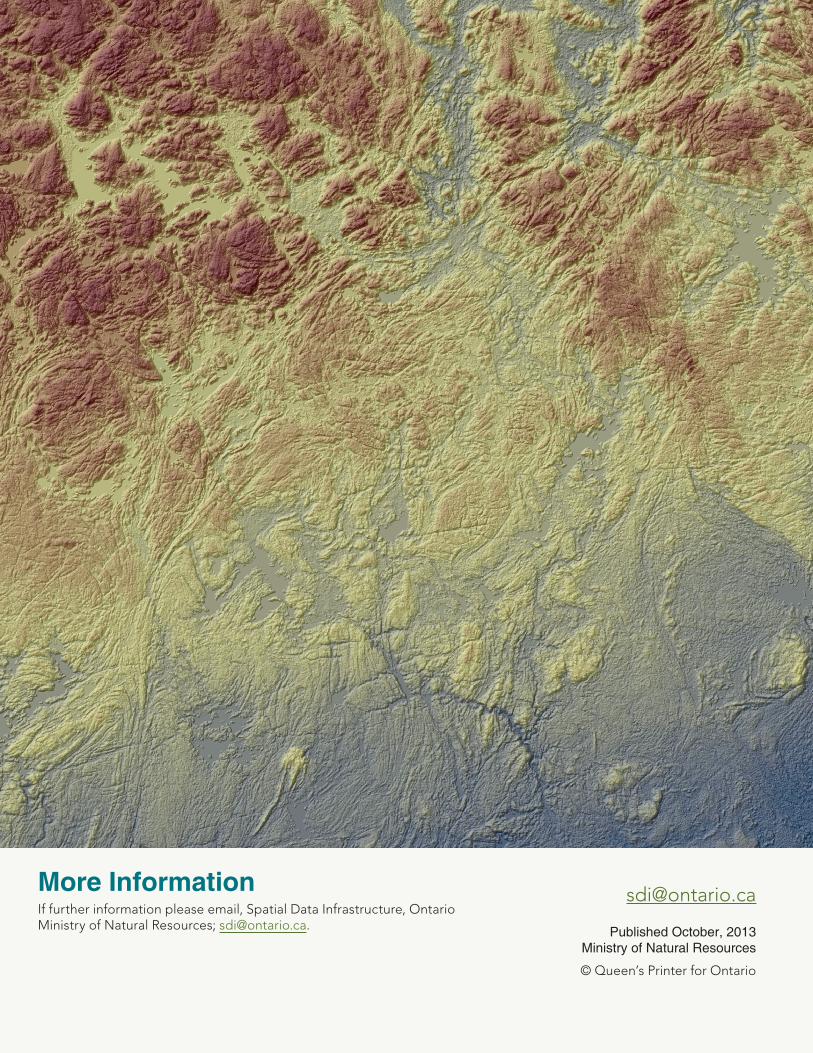
More InformationIf further information please email, Spatial Data Infrastructure, Ontario Ministry of Natural Resources; [email protected].
Published October, 2013Ministry of Natural Resources
© Queen’s Printer for Ontario