Provider Reimbursement Rate Tables KEY - A CR Rate Change ...
12
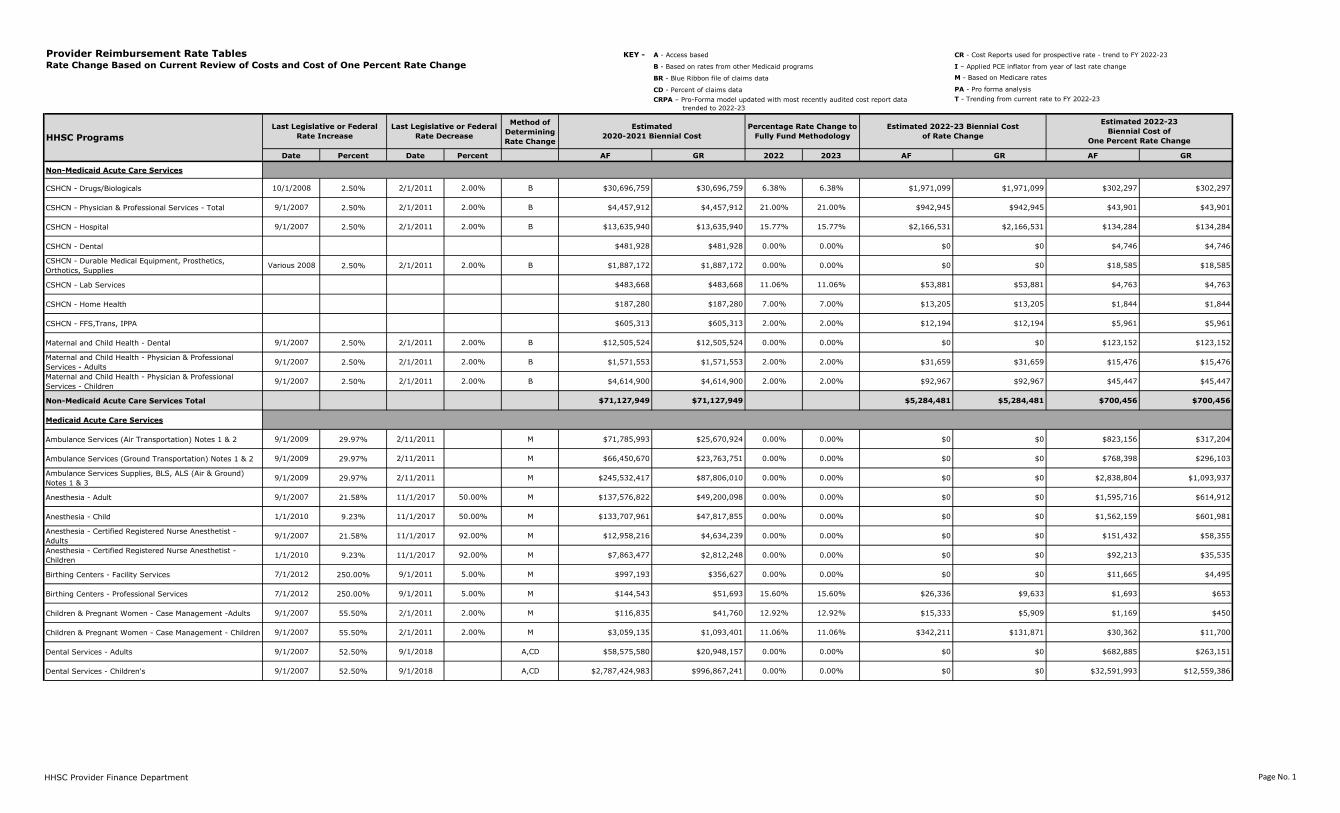
KEY - M - Based on Medicare rates PA - Pro forma analysis T - Trending from current rate to FY 2022-23 Method of Determining Rate Change Date Percent Date Percent AF GR 2022 2023 AF GR AF GR Non-Medicaid Acute Care Services CSHCN - Drugs/Biologicals 10/1/2008 2.50% 2/1/2011 2.00% B $30,696,759 $30,696,759 6.38% 6.38% $1,971,099 $1,971,099 $302,297 $302,297 CSHCN - Physician & Professional Services - Total 9/1/2007 2.50% 2/1/2011 2.00% B $4,457,912 $4,457,912 21.00% 21.00% $942,945 $942,945 $43,901 $43,901 CSHCN - Hospital 9/1/2007 2.50% 2/1/2011 2.00% B $13,635,940 $13,635,940 15.77% 15.77% $2,166,531 $2,166,531 $134,284 $134,284 CSHCN - Dental $481,928 $481,928 0.00% 0.00% $0 $0 $4,746 $4,746 CSHCN - Durable Medical Equipment, Prosthetics, Orthotics, Supplies Various 2008 2.50% 2/1/2011 2.00% B $1,887,172 $1,887,172 0.00% 0.00% $0 $0 $18,585 $18,585 CSHCN - Lab Services $483,668 $483,668 11.06% 11.06% $53,881 $53,881 $4,763 $4,763 CSHCN - Home Health $187,280 $187,280 7.00% 7.00% $13,205 $13,205 $1,844 $1,844 CSHCN - FFS,Trans, IPPA $605,313 $605,313 2.00% 2.00% $12,194 $12,194 $5,961 $5,961 Maternal and Child Health - Dental 9/1/2007 2.50% 2/1/2011 2.00% B $12,505,524 $12,505,524 0.00% 0.00% $0 $0 $123,152 $123,152 Maternal and Child Health - Physician & Professional Services - Adults 9/1/2007 2.50% 2/1/2011 2.00% B $1,571,553 $1,571,553 2.00% 2.00% $31,659 $31,659 $15,476 $15,476 Maternal and Child Health - Physician & Professional Services - Children 9/1/2007 2.50% 2/1/2011 2.00% B $4,614,900 $4,614,900 2.00% 2.00% $92,967 $92,967 $45,447 $45,447 Non-Medicaid Acute Care Services Total $71,127,949 $71,127,949 $5,284,481 $5,284,481 $700,456 $700,456 Medicaid Acute Care Services Ambulance Services (Air Transportation) Notes 1 & 2 9/1/2009 29.97% 2/11/2011 M $71,785,993 $25,670,924 0.00% 0.00% $0 $0 $823,156 $317,204 Ambulance Services (Ground Transportation) Notes 1 & 2 9/1/2009 29.97% 2/11/2011 M $66,450,670 $23,763,751 0.00% 0.00% $0 $0 $768,398 $296,103 Ambulance Services Supplies, BLS, ALS (Air & Ground) Notes 1 & 3 9/1/2009 29.97% 2/11/2011 M $245,532,417 $87,806,010 0.00% 0.00% $0 $0 $2,838,804 $1,093,937 Anesthesia - Adult 9/1/2007 21.58% 11/1/2017 50.00% M $137,576,822 $49,200,098 0.00% 0.00% $0 $0 $1,595,716 $614,912 Anesthesia - Child 1/1/2010 9.23% 11/1/2017 50.00% M $133,707,961 $47,817,855 0.00% 0.00% $0 $0 $1,562,159 $601,981 Anesthesia - Certified Registered Nurse Anesthetist - Adults 9/1/2007 21.58% 11/1/2017 92.00% M $12,958,216 $4,634,239 0.00% 0.00% $0 $0 $151,432 $58,355 Anesthesia - Certified Registered Nurse Anesthetist - Children 1/1/2010 9.23% 11/1/2017 92.00% M $7,863,477 $2,812,248 0.00% 0.00% $0 $0 $92,213 $35,535 Birthing Centers - Facility Services 7/1/2012 250.00% 9/1/2011 5.00% M $997,193 $356,627 0.00% 0.00% $0 $0 $11,665 $4,495 Birthing Centers - Professional Services 7/1/2012 250.00% 9/1/2011 5.00% M $144,543 $51,693 15.60% 15.60% $26,336 $9,633 $1,693 $653 Children & Pregnant Women - Case Management -Adults 9/1/2007 55.50% 2/1/2011 2.00% M $116,835 $41,760 12.92% 12.92% $15,333 $5,909 $1,169 $450 Children & Pregnant Women - Case Management - Children 9/1/2007 55.50% 2/1/2011 2.00% M $3,059,135 $1,093,401 11.06% 11.06% $342,211 $131,871 $30,362 $11,700 Dental Services - Adults 9/1/2007 52.50% 9/1/2018 A,CD $58,575,580 $20,948,157 0.00% 0.00% $0 $0 $682,885 $263,151 Dental Services - Children's 9/1/2007 52.50% 9/1/2018 A,CD $2,787,424,983 $996,867,241 0.00% 0.00% $0 $0 $32,591,993 $12,559,386 Provider Reimbursement Rate Tables Rate Change Based on Current Review of Costs and Cost of One Percent Rate Change CRPA – Pro-Forma model updated with most recently audited cost report data trended to 2022-23 Estimated 2022-23 Biennial Cost of One Percent Rate Change HHSC Programs Last Legislative or Federal Rate Increase Last Legislative or Federal Rate Decrease Estimated 2020-2021 Biennial Cost Percentage Rate Change to Fully Fund Methodology Estimated 2022-23 Biennial Cost of Rate Change I – Applied PCE inflator from year of last rate change A - Access based CR - Cost Reports used for prospective rate - trend to FY 2022-23 B - Based on rates from other Medicaid programs CD - Percent of claims data BR - Blue Ribbon file of claims data HHSC Provider Finance Department Page No. 1
Transcript of Provider Reimbursement Rate Tables KEY - A CR Rate Change ...
KEY -
M - Based on Medicare rates
PA - Pro forma analysis
T - Trending from current rate to FY 2022-23
Method of
Determining
Rate Change
Date Percent Date Percent AF GR 2022 2023 AF GR AF GR
Non-Medicaid Acute Care Services
CSHCN - Drugs/Biologicals 10/1/2008 2.50% 2/1/2011 2.00% B $30,696,759 $30,696,759 6.38% 6.38% $1,971,099 $1,971,099 $302,297 $302,297
CSHCN - Physician & Professional Services - Total 9/1/2007 2.50% 2/1/2011 2.00% B $4,457,912 $4,457,912 21.00% 21.00% $942,945 $942,945 $43,901 $43,901
CSHCN - Hospital 9/1/2007 2.50% 2/1/2011 2.00% B $13,635,940 $13,635,940 15.77% 15.77% $2,166,531 $2,166,531 $134,284 $134,284
CSHCN - Dental $481,928 $481,928 0.00% 0.00% $0 $0 $4,746 $4,746
CSHCN - Durable Medical Equipment, Prosthetics,
Orthotics, SuppliesVarious 2008 2.50% 2/1/2011 2.00% B $1,887,172 $1,887,172 0.00% 0.00% $0 $0 $18,585 $18,585
CSHCN - Lab Services $483,668 $483,668 11.06% 11.06% $53,881 $53,881 $4,763 $4,763
CSHCN - Home Health $187,280 $187,280 7.00% 7.00% $13,205 $13,205 $1,844 $1,844
CSHCN - FFS,Trans, IPPA $605,313 $605,313 2.00% 2.00% $12,194 $12,194 $5,961 $5,961
Maternal and Child Health - Dental 9/1/2007 2.50% 2/1/2011 2.00% B $12,505,524 $12,505,524 0.00% 0.00% $0 $0 $123,152 $123,152
Maternal and Child Health - Physician & Professional
Services - Adults9/1/2007 2.50% 2/1/2011 2.00% B $1,571,553 $1,571,553 2.00% 2.00% $31,659 $31,659 $15,476 $15,476
Maternal and Child Health - Physician & Professional
Services - Children9/1/2007 2.50% 2/1/2011 2.00% B $4,614,900 $4,614,900 2.00% 2.00% $92,967 $92,967 $45,447 $45,447
Non-Medicaid Acute Care Services Total $71,127,949 $71,127,949 $5,284,481 $5,284,481 $700,456 $700,456
Medicaid Acute Care Services
Ambulance Services (Air Transportation) Notes 1 & 2 9/1/2009 29.97% 2/11/2011 M $71,785,993 $25,670,924 0.00% 0.00% $0 $0 $823,156 $317,204
Ambulance Services (Ground Transportation) Notes 1 & 2 9/1/2009 29.97% 2/11/2011 M $66,450,670 $23,763,751 0.00% 0.00% $0 $0 $768,398 $296,103
Ambulance Services Supplies, BLS, ALS (Air & Ground)
Notes 1 & 39/1/2009 29.97% 2/11/2011 M $245,532,417 $87,806,010 0.00% 0.00% $0 $0 $2,838,804 $1,093,937
Anesthesia - Adult 9/1/2007 21.58% 11/1/2017 50.00% M $137,576,822 $49,200,098 0.00% 0.00% $0 $0 $1,595,716 $614,912
Anesthesia - Child 1/1/2010 9.23% 11/1/2017 50.00% M $133,707,961 $47,817,855 0.00% 0.00% $0 $0 $1,562,159 $601,981
Anesthesia - Certified Registered Nurse Anesthetist -
Adults9/1/2007 21.58% 11/1/2017 92.00% M $12,958,216 $4,634,239 0.00% 0.00% $0 $0 $151,432 $58,355
Anesthesia - Certified Registered Nurse Anesthetist -
Children1/1/2010 9.23% 11/1/2017 92.00% M $7,863,477 $2,812,248 0.00% 0.00% $0 $0 $92,213 $35,535
Birthing Centers - Facility Services 7/1/2012 250.00% 9/1/2011 5.00% M $997,193 $356,627 0.00% 0.00% $0 $0 $11,665 $4,495
Birthing Centers - Professional Services 7/1/2012 250.00% 9/1/2011 5.00% M $144,543 $51,693 15.60% 15.60% $26,336 $9,633 $1,693 $653
Children & Pregnant Women - Case Management -Adults 9/1/2007 55.50% 2/1/2011 2.00% M $116,835 $41,760 12.92% 12.92% $15,333 $5,909 $1,169 $450
Children & Pregnant Women - Case Management - Children 9/1/2007 55.50% 2/1/2011 2.00% M $3,059,135 $1,093,401 11.06% 11.06% $342,211 $131,871 $30,362 $11,700
Dental Services - Adults 9/1/2007 52.50% 9/1/2018 A,CD $58,575,580 $20,948,157 0.00% 0.00% $0 $0 $682,885 $263,151
Dental Services - Children's 9/1/2007 52.50% 9/1/2018 A,CD $2,787,424,983 $996,867,241 0.00% 0.00% $0 $0 $32,591,993 $12,559,386
Provider Reimbursement Rate Tables Rate Change Based on Current Review of Costs and Cost of One Percent Rate Change
CRPA – Pro-Forma model updated with most recently audited cost report data
trended to 2022-23
Estimated 2022-23
Biennial Cost of
One Percent Rate ChangeHHSC Programs
Last Legislative or Federal
Rate Increase
Last Legislative or Federal
Rate Decrease
Estimated
2020-2021 Biennial Cost
Percentage Rate Change to
Fully Fund Methodology
Estimated 2022-23 Biennial Cost
of Rate Change
I – Applied PCE inflator from year of last rate change
A - Access based CR - Cost Reports used for prospective rate - trend to FY 2022-23
B - Based on rates from other Medicaid programs
CD - Percent of claims data
BR - Blue Ribbon file of claims data
HHSC Provider Finance Department Page No. 1
KEY -
M - Based on Medicare rates
PA - Pro forma analysis
T - Trending from current rate to FY 2022-23
Method of
Determining
Rate Change
Date Percent Date Percent AF GR 2022 2023 AF GR AF GR
Provider Reimbursement Rate Tables Rate Change Based on Current Review of Costs and Cost of One Percent Rate Change
CRPA – Pro-Forma model updated with most recently audited cost report data
trended to 2022-23
Estimated 2022-23
Biennial Cost of
One Percent Rate ChangeHHSC Programs
Last Legislative or Federal
Rate Increase
Last Legislative or Federal
Rate Decrease
Estimated
2020-2021 Biennial Cost
Percentage Rate Change to
Fully Fund Methodology
Estimated 2022-23 Biennial Cost
of Rate Change
I – Applied PCE inflator from year of last rate change
A - Access based CR - Cost Reports used for prospective rate - trend to FY 2022-23
B - Based on rates from other Medicaid programs
CD - Percent of claims data
BR - Blue Ribbon file of claims data
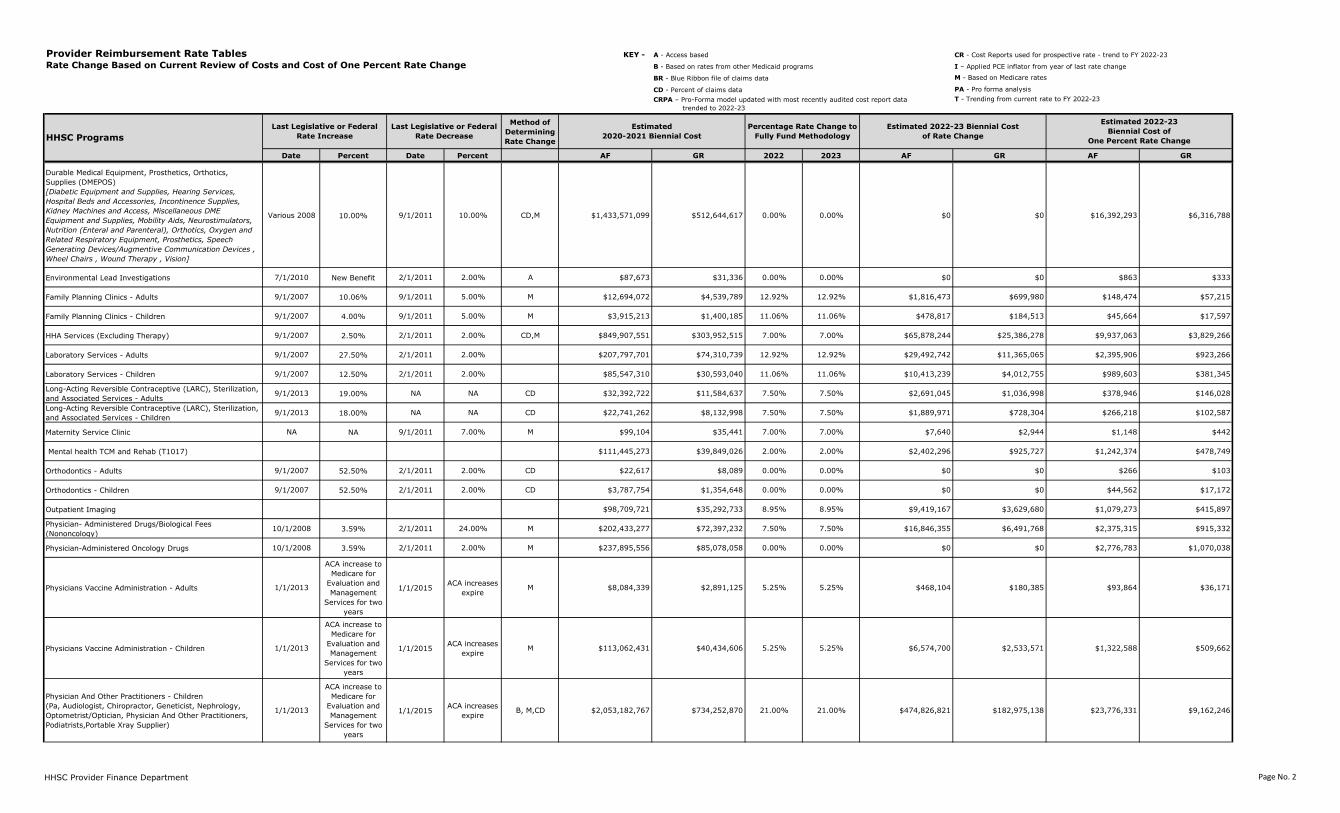
Durable Medical Equipment, Prosthetics, Orthotics,
Supplies (DMEPOS)
[Diabetic Equipment and Supplies, Hearing Services,
Hospital Beds and Accessories, Incontinence Supplies,
Kidney Machines and Access, Miscellaneous DME
Equipment and Supplies, Mobility Aids, Neurostimulators,
Nutrition (Enteral and Parenteral), Orthotics, Oxygen and
Related Respiratory Equipment, Prosthetics, Speech
Generating Devices/Augmentive Communication Devices ,
Wheel Chairs , Wound Therapy , Vision]
Various 2008 10.00% 9/1/2011 10.00% CD,M $1,433,571,099 $512,644,617 0.00% 0.00% $0 $0 $16,392,293 $6,316,788
Environmental Lead Investigations 7/1/2010 New Benefit 2/1/2011 2.00% A $87,673 $31,336 0.00% 0.00% $0 $0 $863 $333
Family Planning Clinics - Adults 9/1/2007 10.06% 9/1/2011 5.00% M $12,694,072 $4,539,789 12.92% 12.92% $1,816,473 $699,980 $148,474 $57,215
Family Planning Clinics - Children 9/1/2007 4.00% 9/1/2011 5.00% M $3,915,213 $1,400,185 11.06% 11.06% $478,817 $184,513 $45,664 $17,597
HHA Services (Excluding Therapy) 9/1/2007 2.50% 2/1/2011 2.00% CD,M $849,907,551 $303,952,515 7.00% 7.00% $65,878,244 $25,386,278 $9,937,063 $3,829,266
Laboratory Services - Adults 9/1/2007 27.50% 2/1/2011 2.00% $207,797,701 $74,310,739 12.92% 12.92% $29,492,742 $11,365,065 $2,395,906 $923,266
Laboratory Services - Children 9/1/2007 12.50% 2/1/2011 2.00% $85,547,310 $30,593,040 11.06% 11.06% $10,413,239 $4,012,755 $989,603 $381,345
Long-Acting Reversible Contraceptive (LARC), Sterilization,
and Associated Services - Adults9/1/2013 19.00% NA NA CD $32,392,722 $11,584,637 7.50% 7.50% $2,691,045 $1,036,998 $378,946 $146,028
Long-Acting Reversible Contraceptive (LARC), Sterilization,
and Associated Services - Children9/1/2013 18.00% NA NA CD $22,741,262 $8,132,998 7.50% 7.50% $1,889,971 $728,304 $266,218 $102,587
Maternity Service Clinic NA NA 9/1/2011 7.00% M $99,104 $35,441 7.00% 7.00% $7,640 $2,944 $1,148 $442
Mental health TCM and Rehab (T1017) $111,445,273 $39,849,026 2.00% 2.00% $2,402,296 $925,727 $1,242,374 $478,749
Orthodontics - Adults 9/1/2007 52.50% 2/1/2011 2.00% CD $22,617 $8,089 0.00% 0.00% $0 $0 $266 $103
Orthodontics - Children 9/1/2007 52.50% 2/1/2011 2.00% CD $3,787,754 $1,354,648 0.00% 0.00% $0 $0 $44,562 $17,172
Outpatient Imaging $98,709,721 $35,292,733 8.95% 8.95% $9,419,167 $3,629,680 $1,079,273 $415,897
Physician- Administered Drugs/Biological Fees
(Nononcology)10/1/2008 3.59% 2/1/2011 24.00% M $202,433,277 $72,397,232 7.50% 7.50% $16,846,355 $6,491,768 $2,375,315 $915,332
Physician-Administered Oncology Drugs 10/1/2008 3.59% 2/1/2011 2.00% M $237,895,556 $85,078,058 0.00% 0.00% $0 $0 $2,776,783 $1,070,038
Physicians Vaccine Administration - Adults 1/1/2013
ACA increase to
Medicare for
Evaluation and
Management
Services for two
years
1/1/2015ACA increases
expireM $8,084,339 $2,891,125 5.25% 5.25% $468,104 $180,385 $93,864 $36,171
Physicians Vaccine Administration - Children 1/1/2013
ACA increase to
Medicare for
Evaluation and
Management
Services for two
years
1/1/2015ACA increases
expireM $113,062,431 $40,434,606 5.25% 5.25% $6,574,700 $2,533,571 $1,322,588 $509,662
Physician And Other Practitioners - Children
(Pa, Audiologist, Chiropractor, Geneticist, Nephrology,
Optometrist/Optician, Physician And Other Practitioners,
Podiatrists,Portable Xray Supplier)
1/1/2013
ACA increase to
Medicare for
Evaluation and
Management
Services for two
years
1/1/2015ACA increases
expireB, M,CD $2,053,182,767 $734,252,870 21.00% 21.00% $474,826,821 $182,975,138 $23,776,331 $9,162,246
HHSC Provider Finance Department Page No. 2
KEY -
M - Based on Medicare rates
PA - Pro forma analysis
T - Trending from current rate to FY 2022-23
Method of
Determining
Rate Change
Date Percent Date Percent AF GR 2022 2023 AF GR AF GR
Provider Reimbursement Rate Tables Rate Change Based on Current Review of Costs and Cost of One Percent Rate Change
CRPA – Pro-Forma model updated with most recently audited cost report data
trended to 2022-23
Estimated 2022-23
Biennial Cost of
One Percent Rate ChangeHHSC Programs
Last Legislative or Federal
Rate Increase
Last Legislative or Federal
Rate Decrease
Estimated
2020-2021 Biennial Cost
Percentage Rate Change to
Fully Fund Methodology
Estimated 2022-23 Biennial Cost
of Rate Change
I – Applied PCE inflator from year of last rate change
A - Access based CR - Cost Reports used for prospective rate - trend to FY 2022-23
B - Based on rates from other Medicaid programs
CD - Percent of claims data
BR - Blue Ribbon file of claims data
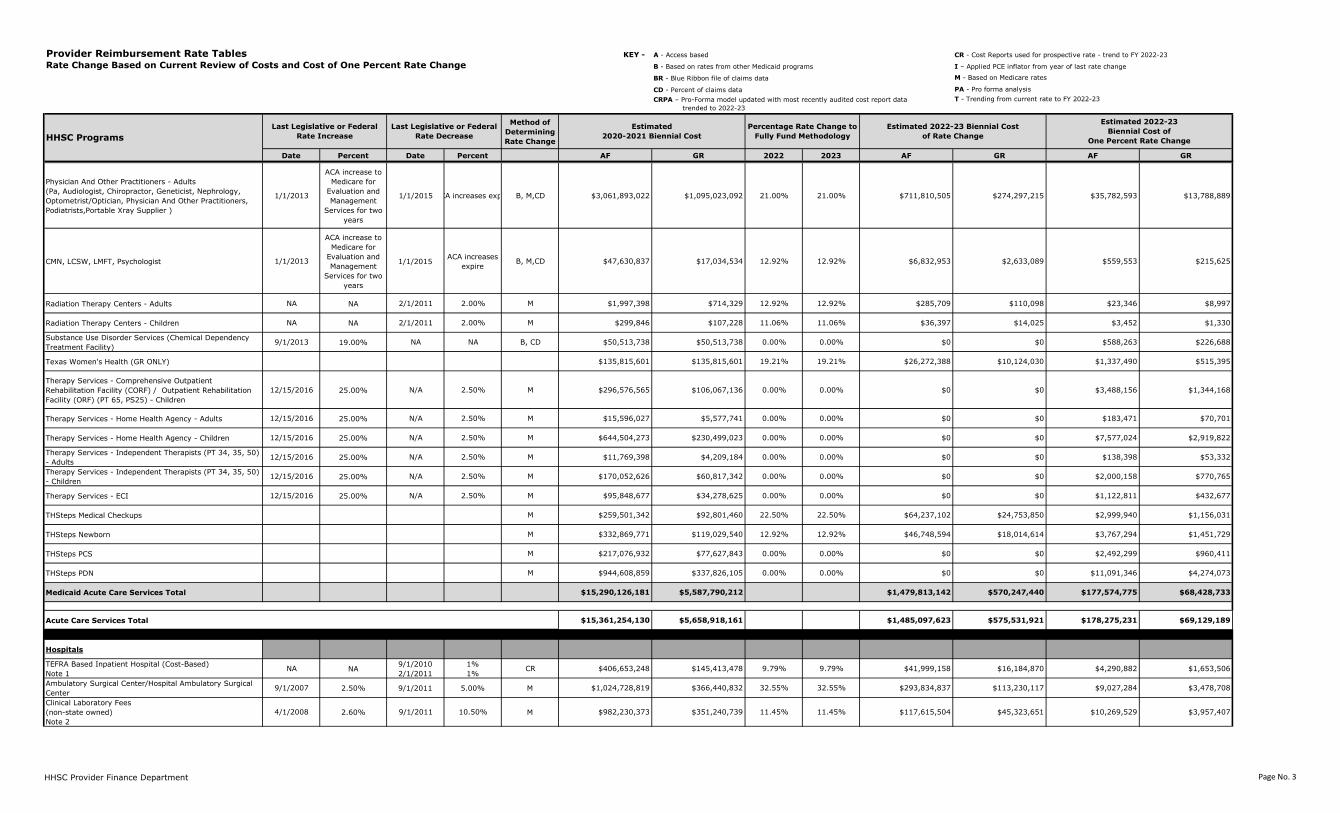
Physician And Other Practitioners - Adults
(Pa, Audiologist, Chiropractor, Geneticist, Nephrology,
Optometrist/Optician, Physician And Other Practitioners,
Podiatrists,Portable Xray Supplier )
1/1/2013
ACA increase to
Medicare for
Evaluation and
Management
Services for two
years
1/1/2015 ACA increases expire B, M,CD $3,061,893,022 $1,095,023,092 21.00% 21.00% $711,810,505 $274,297,215 $35,782,593 $13,788,889
CMN, LCSW, LMFT, Psychologist 1/1/2013
ACA increase to
Medicare for
Evaluation and
Management
Services for two
years
1/1/2015ACA increases
expireB, M,CD $47,630,837 $17,034,534 12.92% 12.92% $6,832,953 $2,633,089 $559,553 $215,625
Radiation Therapy Centers - Adults NA NA 2/1/2011 2.00% M $1,997,398 $714,329 12.92% 12.92% $285,709 $110,098 $23,346 $8,997
Radiation Therapy Centers - Children NA NA 2/1/2011 2.00% M $299,846 $107,228 11.06% 11.06% $36,397 $14,025 $3,452 $1,330
Substance Use Disorder Services (Chemical Dependency
Treatment Facility) 9/1/2013 19.00% NA NA B, CD $50,513,738 $50,513,738 0.00% 0.00% $0 $0 $588,263 $226,688
Texas Women's Health (GR ONLY) $135,815,601 $135,815,601 19.21% 19.21% $26,272,388 $10,124,030 $1,337,490 $515,395
Therapy Services - Comprehensive Outpatient
Rehabilitation Facility (CORF) / Outpatient Rehabilitation
Facility (ORF) (PT 65, PS25) - Children
12/15/2016 25.00% N/A 2.50% M $296,576,565 $106,067,136 0.00% 0.00% $0 $0 $3,488,156 $1,344,168
Therapy Services - Home Health Agency - Adults 12/15/2016 25.00% N/A 2.50% M $15,596,027 $5,577,741 0.00% 0.00% $0 $0 $183,471 $70,701
Therapy Services - Home Health Agency - Children 12/15/2016 25.00% N/A 2.50% M $644,504,273 $230,499,023 0.00% 0.00% $0 $0 $7,577,024 $2,919,822
Therapy Services - Independent Therapists (PT 34, 35, 50)
- Adults12/15/2016 25.00% N/A 2.50% M $11,769,398 $4,209,184 0.00% 0.00% $0 $0 $138,398 $53,332
Therapy Services - Independent Therapists (PT 34, 35, 50)
- Children12/15/2016 25.00% N/A 2.50% M $170,052,626 $60,817,342 0.00% 0.00% $0 $0 $2,000,158 $770,765
Therapy Services - ECI 12/15/2016 25.00% N/A 2.50% M $95,848,677 $34,278,625 0.00% 0.00% $0 $0 $1,122,811 $432,677
THSteps Medical Checkups M $259,501,342 $92,801,460 22.50% 22.50% $64,237,102 $24,753,850 $2,999,940 $1,156,031
THSteps Newborn M $332,869,771 $119,029,540 12.92% 12.92% $46,748,594 $18,014,614 $3,767,294 $1,451,729
THSteps PCS M $217,076,932 $77,627,843 0.00% 0.00% $0 $0 $2,492,299 $960,411
THSteps PDN M $944,608,859 $337,826,105 0.00% 0.00% $0 $0 $11,091,346 $4,274,073
Medicaid Acute Care Services Total $15,290,126,181 $5,587,790,212 $1,479,813,142 $570,247,440 $177,574,775 $68,428,733
Acute Care Services Total $15,361,254,130 $5,658,918,161 $1,485,097,623 $575,531,921 $178,275,231 $69,129,189
Hospitals
TEFRA Based Inpatient Hospital (Cost-Based)
Note 1NA NA
9/1/2010
2/1/2011
1%
1%CR $406,653,248 $145,413,478 9.79% 9.79% $41,999,158 $16,184,870 $4,290,882 $1,653,506
Ambulatory Surgical Center/Hospital Ambulatory Surgical
Center 9/1/2007 2.50% 9/1/2011 5.00% M $1,024,728,819 $366,440,832 32.55% 32.55% $293,834,837 $113,230,117 $9,027,284 $3,478,708
Clinical Laboratory Fees
(non-state owned)
Note 2
4/1/2008 2.60% 9/1/2011 10.50% M $982,230,373 $351,240,739 11.45% 11.45% $117,615,504 $45,323,651 $10,269,529 $3,957,407
HHSC Provider Finance Department Page No. 3
KEY -
M - Based on Medicare rates
PA - Pro forma analysis
T - Trending from current rate to FY 2022-23
Method of
Determining
Rate Change
Date Percent Date Percent AF GR 2022 2023 AF GR AF GR
Provider Reimbursement Rate Tables Rate Change Based on Current Review of Costs and Cost of One Percent Rate Change
CRPA – Pro-Forma model updated with most recently audited cost report data
trended to 2022-23
Estimated 2022-23
Biennial Cost of
One Percent Rate ChangeHHSC Programs
Last Legislative or Federal
Rate Increase
Last Legislative or Federal
Rate Decrease
Estimated
2020-2021 Biennial Cost
Percentage Rate Change to
Fully Fund Methodology
Estimated 2022-23 Biennial Cost
of Rate Change
I – Applied PCE inflator from year of last rate change
A - Access based CR - Cost Reports used for prospective rate - trend to FY 2022-23
B - Based on rates from other Medicaid programs
CD - Percent of claims data
BR - Blue Ribbon file of claims data
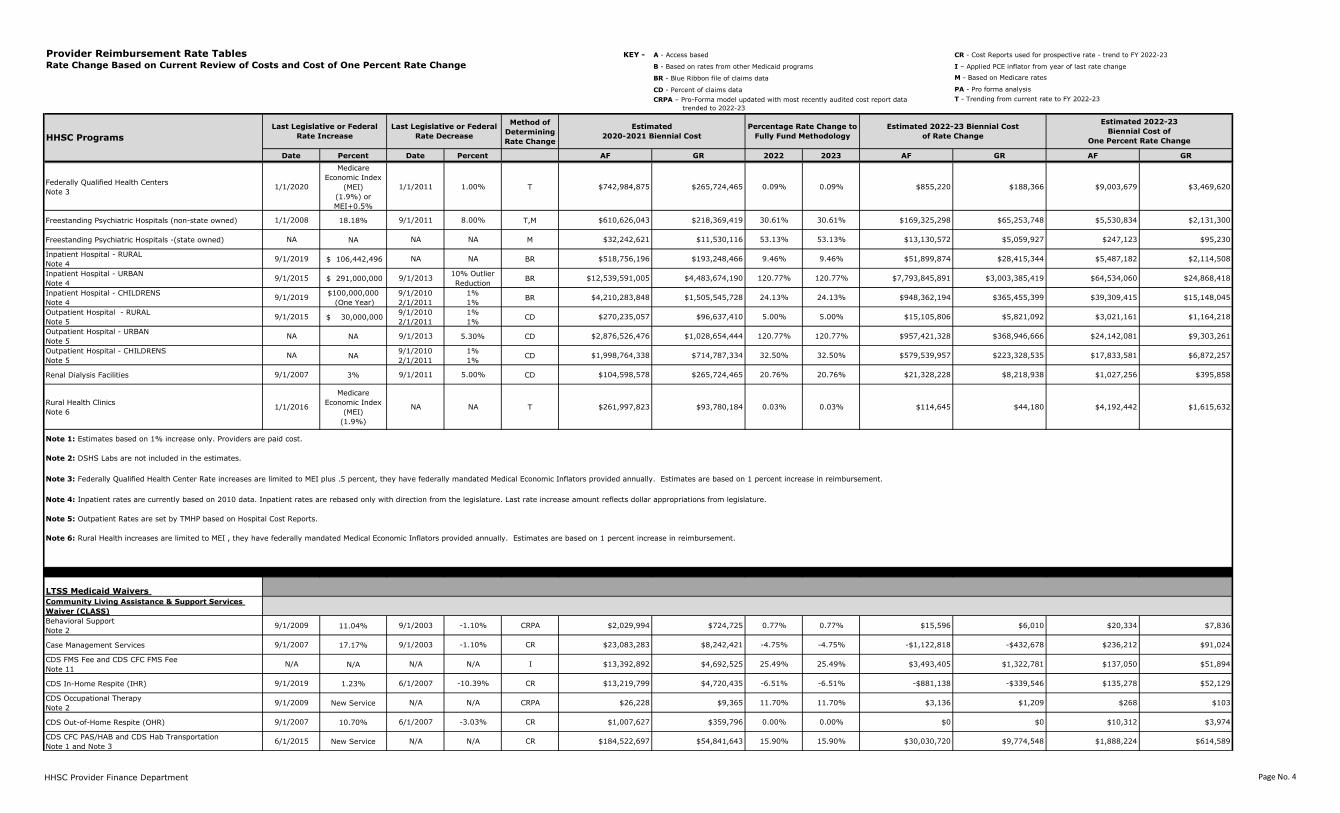
Federally Qualified Health Centers
Note 31/1/2020
Medicare
Economic Index
(MEI)
(1.9%) or
MEI+0.5%
1/1/2011 1.00% T $742,984,875 $265,724,465 0.09% 0.09% $855,220 $188,366 $9,003,679 $3,469,620
Freestanding Psychiatric Hospitals (non-state owned) 1/1/2008 18.18% 9/1/2011 8.00% T,M $610,626,043 $218,369,419 30.61% 30.61% $169,325,298 $65,253,748 $5,530,834 $2,131,300
Freestanding Psychiatric Hospitals -(state owned) NA NA NA NA M $32,242,621 $11,530,116 53.13% 53.13% $13,130,572 $5,059,927 $247,123 $95,230
Inpatient Hospital - RURAL
Note 49/1/2019 $ 106,442,496 NA NA BR $518,756,196 $193,248,466 9.46% 9.46% $51,899,874 $28,415,344 $5,487,182 $2,114,508
Inpatient Hospital - URBAN
Note 49/1/2015 $ 291,000,000 9/1/2013
10% Outlier
ReductionBR $12,539,591,005 $4,483,674,190 120.77% 120.77% $7,793,845,891 $3,003,385,419 $64,534,060 $24,868,418
Inpatient Hospital - CHILDRENS
Note 49/1/2019
$100,000,000
(One Year)
9/1/2010
2/1/2011
1%
1%BR $4,210,283,848 $1,505,545,728 24.13% 24.13% $948,362,194 $365,455,399 $39,309,415 $15,148,045
Outpatient Hospital - RURAL
Note 59/1/2015 $ 30,000,000
9/1/2010
2/1/2011
1%
1%CD $270,235,057 $96,637,410 5.00% 5.00% $15,105,806 $5,821,092 $3,021,161 $1,164,218
Outpatient Hospital - URBAN
Note 5NA NA 9/1/2013 5.30% CD $2,876,526,476 $1,028,654,444 120.77% 120.77% $957,421,328 $368,946,666 $24,142,081 $9,303,261
Outpatient Hospital - CHILDRENS
Note 5NA NA
9/1/2010
2/1/2011
1%
1%CD $1,998,764,338 $714,787,334 32.50% 32.50% $579,539,957 $223,328,535 $17,833,581 $6,872,257
Renal Dialysis Facilities 9/1/2007 3% 9/1/2011 5.00% CD $104,598,578 $265,724,465 20.76% 20.76% $21,328,228 $8,218,938 $1,027,256 $395,858
Rural Health Clinics
Note 61/1/2016
Medicare
Economic Index
(MEI)
(1.9%)
NA NA T $261,997,823 $93,780,184 0.03% 0.03% $114,645 $44,180 $4,192,442 $1,615,632
LTSS Medicaid Waivers
Community Living Assistance & Support Services
Waiver (CLASS)
Behavioral Support
Note 29/1/2009 11.04% 9/1/2003 -1.10% CRPA $2,029,994 $724,725 0.77% 0.77% $15,596 $6,010 $20,334 $7,836
Case Management Services 9/1/2007 17.17% 9/1/2003 -1.10% CR $23,083,283 $8,242,421 -4.75% -4.75% -$1,122,818 -$432,678 $236,212 $91,024
CDS FMS Fee and CDS CFC FMS Fee
Note 11N/A N/A N/A N/A I $13,392,892 $4,692,525 25.49% 25.49% $3,493,405 $1,322,781 $137,050 $51,894
CDS In-Home Respite (IHR) 9/1/2019 1.23% 6/1/2007 -10.39% CR $13,219,799 $4,720,435 -6.51% -6.51% -$881,138 -$339,546 $135,278 $52,129
CDS Occupational Therapy
Note 29/1/2009 New Service N/A N/A CRPA $26,228 $9,365 11.70% 11.70% $3,136 $1,209 $268 $103
CDS Out-of-Home Respite (OHR) 9/1/2007 10.70% 6/1/2007 -3.03% CR $1,007,627 $359,796 0.00% 0.00% $0 $0 $10,312 $3,974
CDS CFC PAS/HAB and CDS Hab Transportation
Note 1 and Note 36/1/2015 New Service N/A N/A CR $184,522,697 $54,841,643 15.90% 15.90% $30,030,720 $9,774,548 $1,888,224 $614,589
Note 1: Estimates based on 1% increase only. Providers are paid cost.
Note 6: Rural Health increases are limited to MEI , they have federally mandated Medical Economic Inflators provided annually. Estimates are based on 1 percent increase in reimbursement.
Note 2: DSHS Labs are not included in the estimates.
Note 3: Federally Qualified Health Center Rate increases are limited to MEI plus .5 percent, they have federally mandated Medical Economic Inflators provided annually. Estimates are based on 1 percent increase in reimbursement.
Note 4: Inpatient rates are currently based on 2010 data. Inpatient rates are rebased only with direction from the legislature. Last rate increase amount reflects dollar appropriations from legislature.
Note 5: Outpatient Rates are set by TMHP based on Hospital Cost Reports.
HHSC Provider Finance Department Page No. 4
KEY -
M - Based on Medicare rates
PA - Pro forma analysis
T - Trending from current rate to FY 2022-23
Method of
Determining
Rate Change
Date Percent Date Percent AF GR 2022 2023 AF GR AF GR
Provider Reimbursement Rate Tables Rate Change Based on Current Review of Costs and Cost of One Percent Rate Change
CRPA – Pro-Forma model updated with most recently audited cost report data
trended to 2022-23
Estimated 2022-23
Biennial Cost of
One Percent Rate ChangeHHSC Programs
Last Legislative or Federal
Rate Increase
Last Legislative or Federal
Rate Decrease
Estimated
2020-2021 Biennial Cost
Percentage Rate Change to
Fully Fund Methodology
Estimated 2022-23 Biennial Cost
of Rate Change
I – Applied PCE inflator from year of last rate change
A - Access based CR - Cost Reports used for prospective rate - trend to FY 2022-23
B - Based on rates from other Medicaid programs
CD - Percent of claims data
BR - Blue Ribbon file of claims data
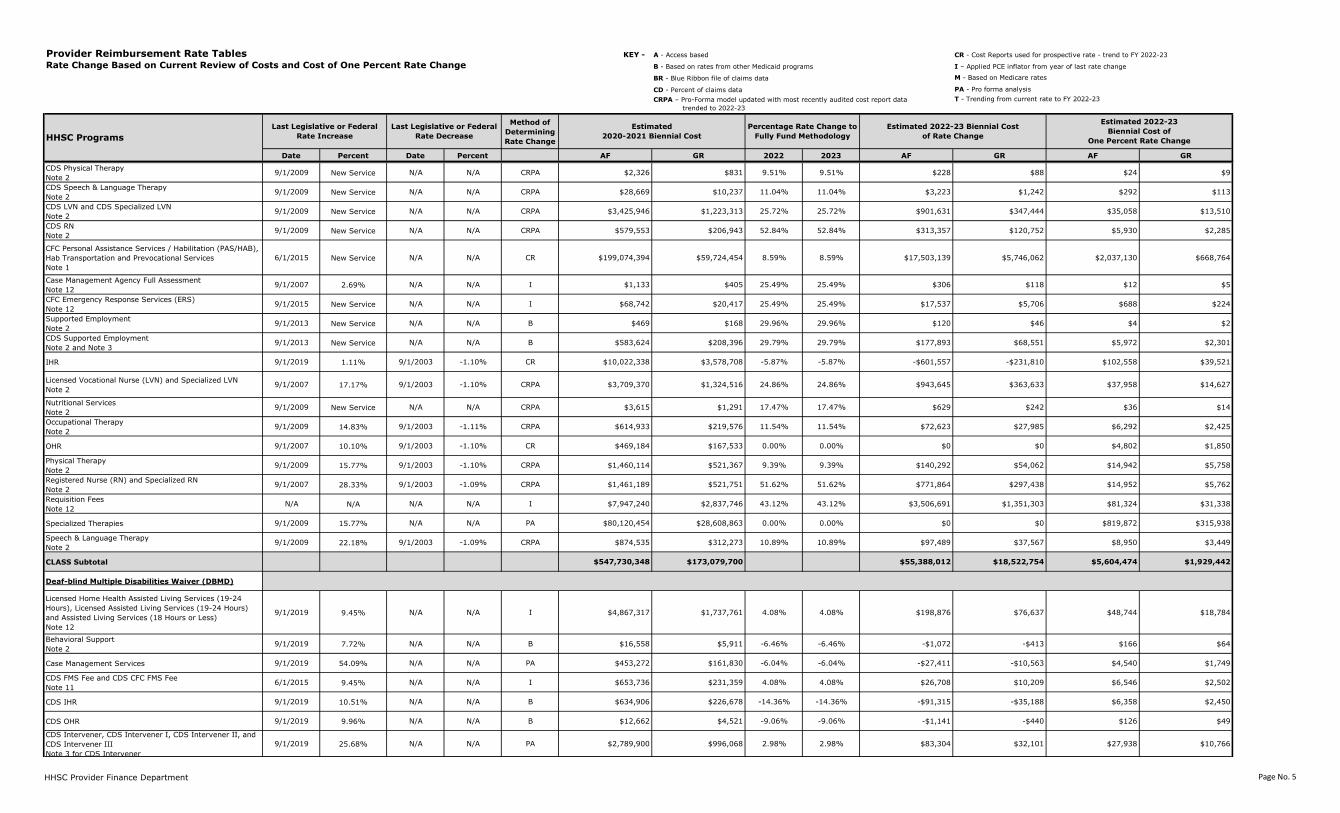
CDS Physical Therapy
Note 29/1/2009 New Service N/A N/A CRPA $2,326 $831 9.51% 9.51% $228 $88 $24 $9
CDS Speech & Language Therapy
Note 29/1/2009 New Service N/A N/A CRPA $28,669 $10,237 11.04% 11.04% $3,223 $1,242 $292 $113
CDS LVN and CDS Specialized LVN
Note 29/1/2009 New Service N/A N/A CRPA $3,425,946 $1,223,313 25.72% 25.72% $901,631 $347,444 $35,058 $13,510
CDS RN
Note 29/1/2009 New Service N/A N/A CRPA $579,553 $206,943 52.84% 52.84% $313,357 $120,752 $5,930 $2,285
CFC Personal Assistance Services / Habilitation (PAS/HAB),
Hab Transportation and Prevocational Services
Note 1
6/1/2015 New Service N/A N/A CR $199,074,394 $59,724,454 8.59% 8.59% $17,503,139 $5,746,062 $2,037,130 $668,764
Case Management Agency Full Assessment
Note 129/1/2007 2.69% N/A N/A I $1,133 $405 25.49% 25.49% $306 $118 $12 $5
CFC Emergency Response Services (ERS)
Note 129/1/2015 New Service N/A N/A I $68,742 $20,417 25.49% 25.49% $17,537 $5,706 $688 $224
Supported Employment
Note 29/1/2013 New Service N/A N/A B $469 $168 29.96% 29.96% $120 $46 $4 $2
CDS Supported Employment
Note 2 and Note 39/1/2013 New Service N/A N/A B $583,624 $208,396 29.79% 29.79% $177,893 $68,551 $5,972 $2,301
IHR 9/1/2019 1.11% 9/1/2003 -1.10% CR $10,022,338 $3,578,708 -5.87% -5.87% -$601,557 -$231,810 $102,558 $39,521
Licensed Vocational Nurse (LVN) and Specialized LVN
Note 29/1/2007 17.17% 9/1/2003 -1.10% CRPA $3,709,370 $1,324,516 24.86% 24.86% $943,645 $363,633 $37,958 $14,627
Nutritional Services
Note 29/1/2009 New Service N/A N/A CRPA $3,615 $1,291 17.47% 17.47% $629 $242 $36 $14
Occupational Therapy
Note 29/1/2009 14.83% 9/1/2003 -1.11% CRPA $614,933 $219,576 11.54% 11.54% $72,623 $27,985 $6,292 $2,425
OHR 9/1/2007 10.10% 9/1/2003 -1.10% CR $469,184 $167,533 0.00% 0.00% $0 $0 $4,802 $1,850
Physical Therapy
Note 29/1/2009 15.77% 9/1/2003 -1.10% CRPA $1,460,114 $521,367 9.39% 9.39% $140,292 $54,062 $14,942 $5,758
Registered Nurse (RN) and Specialized RN
Note 29/1/2007 28.33% 9/1/2003 -1.09% CRPA $1,461,189 $521,751 51.62% 51.62% $771,864 $297,438 $14,952 $5,762
Requisition Fees
Note 12N/A N/A N/A N/A I $7,947,240 $2,837,746 43.12% 43.12% $3,506,691 $1,351,303 $81,324 $31,338
Specialized Therapies 9/1/2009 15.77% N/A N/A PA $80,120,454 $28,608,863 0.00% 0.00% $0 $0 $819,872 $315,938
Speech & Language Therapy
Note 29/1/2009 22.18% 9/1/2003 -1.09% CRPA $874,535 $312,273 10.89% 10.89% $97,489 $37,567 $8,950 $3,449
CLASS Subtotal $547,730,348 $173,079,700 $55,388,012 $18,522,754 $5,604,474 $1,929,442
Deaf-blind Multiple Disabilities Waiver (DBMD)
Licensed Home Health Assisted Living Services (19-24
Hours), Licensed Assisted Living Services (19-24 Hours)
and Assisted Living Services (18 Hours or Less)
Note 12
9/1/2019 9.45% N/A N/A I $4,867,317 $1,737,761 4.08% 4.08% $198,876 $76,637 $48,744 $18,784
Behavioral Support
Note 2 9/1/2019 7.72% N/A N/A B $16,558 $5,911 -6.46% -6.46% -$1,072 -$413 $166 $64
Case Management Services 9/1/2019 54.09% N/A N/A PA $453,272 $161,830 -6.04% -6.04% -$27,411 -$10,563 $4,540 $1,749
CDS FMS Fee and CDS CFC FMS Fee
Note 116/1/2015 9.45% N/A N/A I $653,736 $231,359 4.08% 4.08% $26,708 $10,209 $6,546 $2,502
CDS IHR 9/1/2019 10.51% N/A N/A B $634,906 $226,678 -14.36% -14.36% -$91,315 -$35,188 $6,358 $2,450
CDS OHR 9/1/2019 9.96% N/A N/A B $12,662 $4,521 -9.06% -9.06% -$1,141 -$440 $126 $49
CDS Intervener, CDS Intervener I, CDS Intervener II, and
CDS Intervener III
Note 3 for CDS Intervener
9/1/2019 25.68% N/A N/A PA $2,789,900 $996,068 2.98% 2.98% $83,304 $32,101 $27,938 $10,766
HHSC Provider Finance Department Page No. 5
KEY -
M - Based on Medicare rates
PA - Pro forma analysis
T - Trending from current rate to FY 2022-23
Method of
Determining
Rate Change
Date Percent Date Percent AF GR 2022 2023 AF GR AF GR
Provider Reimbursement Rate Tables Rate Change Based on Current Review of Costs and Cost of One Percent Rate Change
CRPA – Pro-Forma model updated with most recently audited cost report data
trended to 2022-23
Estimated 2022-23
Biennial Cost of
One Percent Rate ChangeHHSC Programs
Last Legislative or Federal
Rate Increase
Last Legislative or Federal
Rate Decrease
Estimated
2020-2021 Biennial Cost
Percentage Rate Change to
Fully Fund Methodology
Estimated 2022-23 Biennial Cost
of Rate Change
I – Applied PCE inflator from year of last rate change
A - Access based CR - Cost Reports used for prospective rate - trend to FY 2022-23
B - Based on rates from other Medicaid programs
CD - Percent of claims data
BR - Blue Ribbon file of claims data
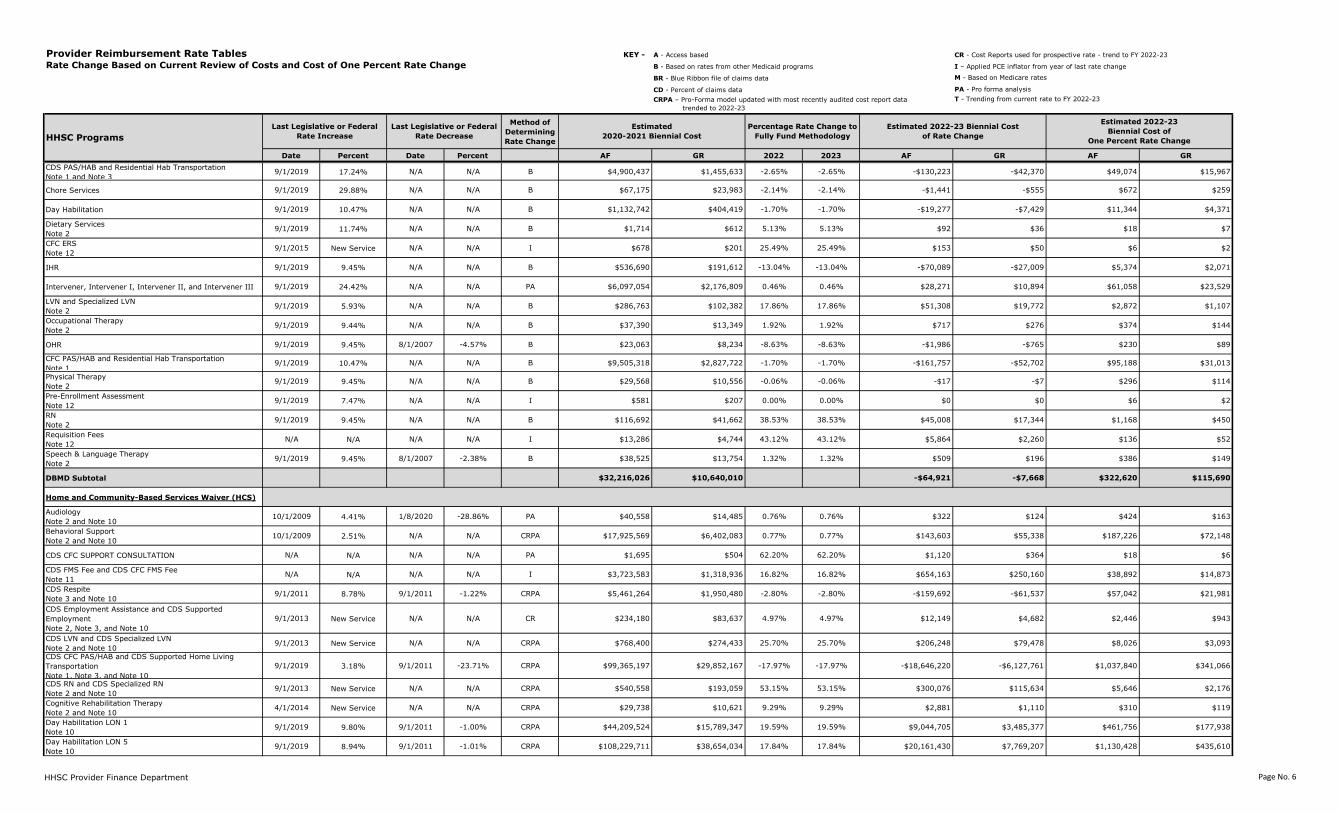
CDS PAS/HAB and Residential Hab Transportation
Note 1 and Note 39/1/2019 17.24% N/A N/A B $4,900,437 $1,455,633 -2.65% -2.65% -$130,223 -$42,370 $49,074 $15,967
Chore Services 9/1/2019 29.88% N/A N/A B $67,175 $23,983 -2.14% -2.14% -$1,441 -$555 $672 $259
Day Habilitation 9/1/2019 10.47% N/A N/A B $1,132,742 $404,419 -1.70% -1.70% -$19,277 -$7,429 $11,344 $4,371
Dietary Services
Note 29/1/2019 11.74% N/A N/A B $1,714 $612 5.13% 5.13% $92 $36 $18 $7
CFC ERS
Note 129/1/2015 New Service N/A N/A I $678 $201 25.49% 25.49% $153 $50 $6 $2
IHR 9/1/2019 9.45% N/A N/A B $536,690 $191,612 -13.04% -13.04% -$70,089 -$27,009 $5,374 $2,071
Intervener, Intervener I, Intervener II, and Intervener III 9/1/2019 24.42% N/A N/A PA $6,097,054 $2,176,809 0.46% 0.46% $28,271 $10,894 $61,058 $23,529
LVN and Specialized LVN
Note 29/1/2019 5.93% N/A N/A B $286,763 $102,382 17.86% 17.86% $51,308 $19,772 $2,872 $1,107
Occupational Therapy
Note 29/1/2019 9.44% N/A N/A B $37,390 $13,349 1.92% 1.92% $717 $276 $374 $144
OHR 9/1/2019 9.45% 8/1/2007 -4.57% B $23,063 $8,234 -8.63% -8.63% -$1,986 -$765 $230 $89
CFC PAS/HAB and Residential Hab Transportation
Note 19/1/2019 10.47% N/A N/A B $9,505,318 $2,827,722 -1.70% -1.70% -$161,757 -$52,702 $95,188 $31,013
Physical Therapy
Note 29/1/2019 9.45% N/A N/A B $29,568 $10,556 -0.06% -0.06% -$17 -$7 $296 $114
Pre-Enrollment Assessment
Note 129/1/2019 7.47% N/A N/A I $581 $207 0.00% 0.00% $0 $0 $6 $2
RN
Note 29/1/2019 9.45% N/A N/A B $116,692 $41,662 38.53% 38.53% $45,008 $17,344 $1,168 $450
Requisition Fees
Note 12N/A N/A N/A N/A I $13,286 $4,744 43.12% 43.12% $5,864 $2,260 $136 $52
Speech & Language Therapy
Note 29/1/2019 9.45% 8/1/2007 -2.38% B $38,525 $13,754 1.32% 1.32% $509 $196 $386 $149
DBMD Subtotal $32,216,026 $10,640,010 -$64,921 -$7,668 $322,620 $115,690
Home and Community-Based Services Waiver (HCS)
Audiology
Note 2 and Note 1010/1/2009 4.41% 1/8/2020 -28.86% PA $40,558 $14,485 0.76% 0.76% $322 $124 $424 $163
Behavioral Support
Note 2 and Note 1010/1/2009 2.51% N/A N/A CRPA $17,925,569 $6,402,083 0.77% 0.77% $143,603 $55,338 $187,226 $72,148
CDS CFC SUPPORT CONSULTATION N/A N/A N/A N/A PA $1,695 $504 62.20% 62.20% $1,120 $364 $18 $6
CDS FMS Fee and CDS CFC FMS Fee
Note 11N/A N/A N/A N/A I $3,723,583 $1,318,936 16.82% 16.82% $654,163 $250,160 $38,892 $14,873
CDS Respite
Note 3 and Note 109/1/2011 8.78% 9/1/2011 -1.22% CRPA $5,461,264 $1,950,480 -2.80% -2.80% -$159,692 -$61,537 $57,042 $21,981
CDS Employment Assistance and CDS Supported
Employment
Note 2, Note 3, and Note 10
9/1/2013 New Service N/A N/A CR $234,180 $83,637 4.97% 4.97% $12,149 $4,682 $2,446 $943
CDS LVN and CDS Specialized LVN
Note 2 and Note 109/1/2013 New Service N/A N/A CRPA $768,400 $274,433 25.70% 25.70% $206,248 $79,478 $8,026 $3,093
CDS CFC PAS/HAB and CDS Supported Home Living
Transportation
Note 1, Note 3, and Note 10
9/1/2019 3.18% 9/1/2011 -23.71% CRPA $99,365,197 $29,852,167 -17.97% -17.97% -$18,646,220 -$6,127,761 $1,037,840 $341,066
CDS RN and CDS Specialized RN
Note 2 and Note 109/1/2013 New Service N/A N/A CRPA $540,558 $193,059 53.15% 53.15% $300,076 $115,634 $5,646 $2,176
Cognitive Rehabilitation Therapy
Note 2 and Note 104/1/2014 New Service N/A N/A CRPA $29,738 $10,621 9.29% 9.29% $2,881 $1,110 $310 $119
Day Habilitation LON 1
Note 109/1/2019 9.80% 9/1/2011 -1.00% CRPA $44,209,524 $15,789,347 19.59% 19.59% $9,044,705 $3,485,377 $461,756 $177,938
Day Habilitation LON 5
Note 109/1/2019 8.94% 9/1/2011 -1.01% CRPA $108,229,711 $38,654,034 17.84% 17.84% $20,161,430 $7,769,207 $1,130,428 $435,610
HHSC Provider Finance Department Page No. 6
KEY -
M - Based on Medicare rates
PA - Pro forma analysis
T - Trending from current rate to FY 2022-23
Method of
Determining
Rate Change
Date Percent Date Percent AF GR 2022 2023 AF GR AF GR
Provider Reimbursement Rate Tables Rate Change Based on Current Review of Costs and Cost of One Percent Rate Change
CRPA – Pro-Forma model updated with most recently audited cost report data
trended to 2022-23
Estimated 2022-23
Biennial Cost of
One Percent Rate ChangeHHSC Programs
Last Legislative or Federal
Rate Increase
Last Legislative or Federal
Rate Decrease
Estimated
2020-2021 Biennial Cost
Percentage Rate Change to
Fully Fund Methodology
Estimated 2022-23 Biennial Cost
of Rate Change
I – Applied PCE inflator from year of last rate change
A - Access based CR - Cost Reports used for prospective rate - trend to FY 2022-23
B - Based on rates from other Medicaid programs
CD - Percent of claims data
BR - Blue Ribbon file of claims data
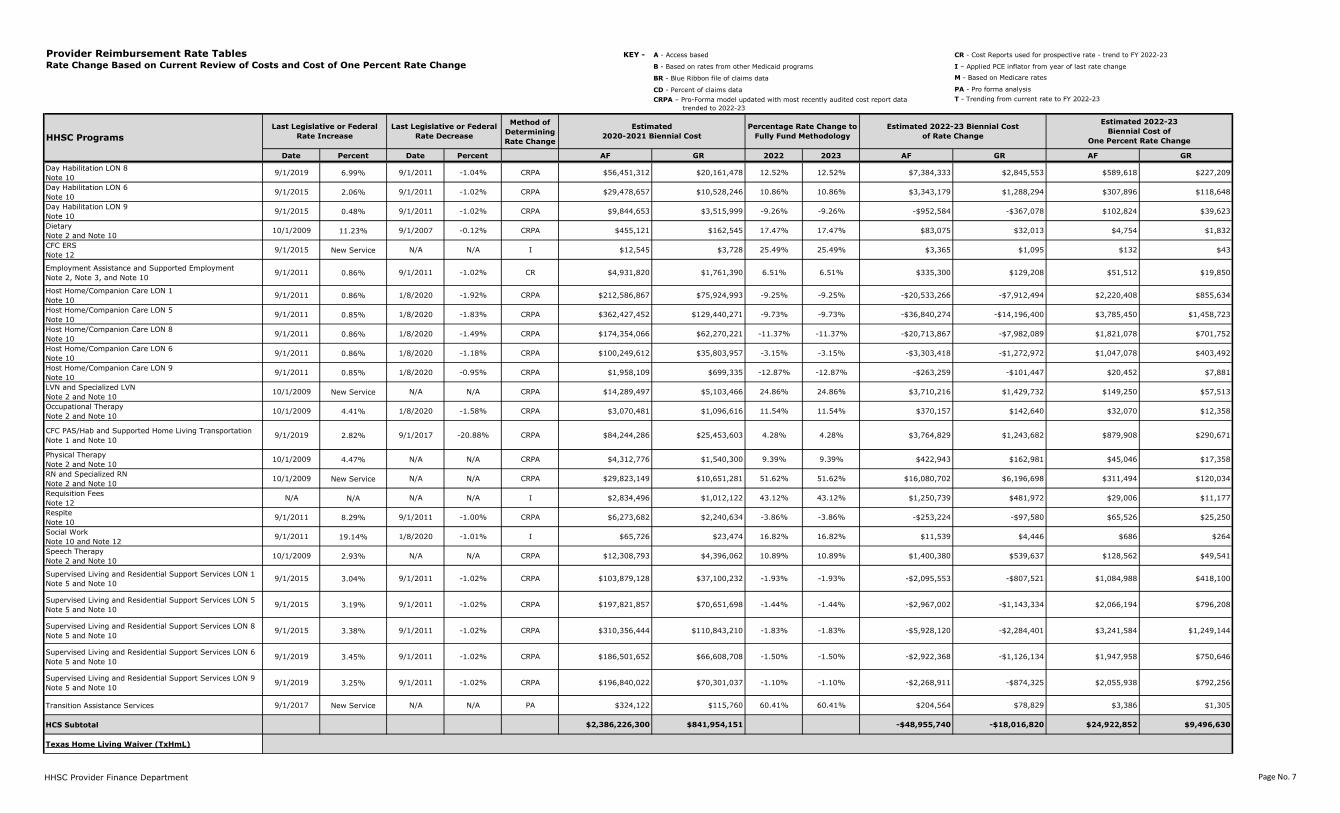
Day Habilitation LON 8
Note 109/1/2019 6.99% 9/1/2011 -1.04% CRPA $56,451,312 $20,161,478 12.52% 12.52% $7,384,333 $2,845,553 $589,618 $227,209
Day Habilitation LON 6
Note 109/1/2015 2.06% 9/1/2011 -1.02% CRPA $29,478,657 $10,528,246 10.86% 10.86% $3,343,179 $1,288,294 $307,896 $118,648
Day Habilitation LON 9
Note 109/1/2015 0.48% 9/1/2011 -1.02% CRPA $9,844,653 $3,515,999 -9.26% -9.26% -$952,584 -$367,078 $102,824 $39,623
Dietary
Note 2 and Note 1010/1/2009 11.23% 9/1/2007 -0.12% CRPA $455,121 $162,545 17.47% 17.47% $83,075 $32,013 $4,754 $1,832
CFC ERS
Note 129/1/2015 New Service N/A N/A I $12,545 $3,728 25.49% 25.49% $3,365 $1,095 $132 $43
Employment Assistance and Supported Employment
Note 2, Note 3, and Note 109/1/2011 0.86% 9/1/2011 -1.02% CR $4,931,820 $1,761,390 6.51% 6.51% $335,300 $129,208 $51,512 $19,850
Host Home/Companion Care LON 1
Note 109/1/2011 0.86% 1/8/2020 -1.92% CRPA $212,586,867 $75,924,993 -9.25% -9.25% -$20,533,266 -$7,912,494 $2,220,408 $855,634
Host Home/Companion Care LON 5
Note 109/1/2011 0.85% 1/8/2020 -1.83% CRPA $362,427,452 $129,440,271 -9.73% -9.73% -$36,840,274 -$14,196,400 $3,785,450 $1,458,723
Host Home/Companion Care LON 8
Note 109/1/2011 0.86% 1/8/2020 -1.49% CRPA $174,354,066 $62,270,221 -11.37% -11.37% -$20,713,867 -$7,982,089 $1,821,078 $701,752
Host Home/Companion Care LON 6
Note 109/1/2011 0.86% 1/8/2020 -1.18% CRPA $100,249,612 $35,803,957 -3.15% -3.15% -$3,303,418 -$1,272,972 $1,047,078 $403,492
Host Home/Companion Care LON 9
Note 109/1/2011 0.85% 1/8/2020 -0.95% CRPA $1,958,109 $699,335 -12.87% -12.87% -$263,259 -$101,447 $20,452 $7,881
LVN and Specialized LVN
Note 2 and Note 1010/1/2009 New Service N/A N/A CRPA $14,289,497 $5,103,466 24.86% 24.86% $3,710,216 $1,429,732 $149,250 $57,513
Occupational Therapy
Note 2 and Note 1010/1/2009 4.41% 1/8/2020 -1.58% CRPA $3,070,481 $1,096,616 11.54% 11.54% $370,157 $142,640 $32,070 $12,358
CFC PAS/Hab and Supported Home Living Transportation
Note 1 and Note 109/1/2019 2.82% 9/1/2017 -20.88% CRPA $84,244,286 $25,453,603 4.28% 4.28% $3,764,829 $1,243,682 $879,908 $290,671
Physical Therapy
Note 2 and Note 1010/1/2009 4.47% N/A N/A CRPA $4,312,776 $1,540,300 9.39% 9.39% $422,943 $162,981 $45,046 $17,358
RN and Specialized RN
Note 2 and Note 1010/1/2009 New Service N/A N/A CRPA $29,823,149 $10,651,281 51.62% 51.62% $16,080,702 $6,196,698 $311,494 $120,034
Requisition Fees
Note 12N/A N/A N/A N/A I $2,834,496 $1,012,122 43.12% 43.12% $1,250,739 $481,972 $29,006 $11,177
Respite
Note 109/1/2011 8.29% 9/1/2011 -1.00% CRPA $6,273,682 $2,240,634 -3.86% -3.86% -$253,224 -$97,580 $65,526 $25,250
Social Work
Note 10 and Note 129/1/2011 19.14% 1/8/2020 -1.01% I $65,726 $23,474 16.82% 16.82% $11,539 $4,446 $686 $264
Speech Therapy
Note 2 and Note 1010/1/2009 2.93% N/A N/A CRPA $12,308,793 $4,396,062 10.89% 10.89% $1,400,380 $539,637 $128,562 $49,541
Supervised Living and Residential Support Services LON 1
Note 5 and Note 109/1/2015 3.04% 9/1/2011 -1.02% CRPA $103,879,128 $37,100,232 -1.93% -1.93% -$2,095,553 -$807,521 $1,084,988 $418,100
Supervised Living and Residential Support Services LON 5
Note 5 and Note 109/1/2015 3.19% 9/1/2011 -1.02% CRPA $197,821,857 $70,651,698 -1.44% -1.44% -$2,967,002 -$1,143,334 $2,066,194 $796,208
Supervised Living and Residential Support Services LON 8
Note 5 and Note 109/1/2015 3.38% 9/1/2011 -1.02% CRPA $310,356,444 $110,843,210 -1.83% -1.83% -$5,928,120 -$2,284,401 $3,241,584 $1,249,144
Supervised Living and Residential Support Services LON 6
Note 5 and Note 109/1/2019 3.45% 9/1/2011 -1.02% CRPA $186,501,652 $66,608,708 -1.50% -1.50% -$2,922,368 -$1,126,134 $1,947,958 $750,646
Supervised Living and Residential Support Services LON 9
Note 5 and Note 109/1/2019 3.25% 9/1/2011 -1.02% CRPA $196,840,022 $70,301,037 -1.10% -1.10% -$2,268,911 -$874,325 $2,055,938 $792,256
Transition Assistance Services 9/1/2017 New Service N/A N/A PA $324,122 $115,760 60.41% 60.41% $204,564 $78,829 $3,386 $1,305
HCS Subtotal $2,386,226,300 $841,954,151 -$48,955,740 -$18,016,820 $24,922,852 $9,496,630
Texas Home Living Waiver (TxHmL)
HHSC Provider Finance Department Page No. 7

KEY -
M - Based on Medicare rates
PA - Pro forma analysis
T - Trending from current rate to FY 2022-23
Method of
Determining
Rate Change
Date Percent Date Percent AF GR 2022 2023 AF GR AF GR
Provider Reimbursement Rate Tables Rate Change Based on Current Review of Costs and Cost of One Percent Rate Change
CRPA – Pro-Forma model updated with most recently audited cost report data
trended to 2022-23
Estimated 2022-23
Biennial Cost of
One Percent Rate ChangeHHSC Programs
Last Legislative or Federal
Rate Increase
Last Legislative or Federal
Rate Decrease
Estimated
2020-2021 Biennial Cost
Percentage Rate Change to
Fully Fund Methodology
Estimated 2022-23 Biennial Cost
of Rate Change
I – Applied PCE inflator from year of last rate change
A - Access based CR - Cost Reports used for prospective rate - trend to FY 2022-23
B - Based on rates from other Medicaid programs
CD - Percent of claims data
BR - Blue Ribbon file of claims data
Behavioral Support
Note 2 and Note 109/1/2009 2.51% N/A N/A CRPA $817,029 $291,580 0.77% 0.77% $6,010 $2,316 $7,836 $3,020
CDS Behavioral Support
Note 2 and Note 1010/1/2009 3.90% N/A N/A CRPA $86,560 $30,891 0.78% 0.78% $645 $248 $830 $320
CDS Support Consultation and CFC Support Consultation N/A N/A N/A N/A PA $2,657 $797 62.20% 62.20% $1,617 $534 $26 $9
CDS Day Habilitation
Note 109/1/2013 0.96% 9/1/2013 -1.13% CRPA $1,442,302 $514,726 46.01% 46.01% $636,489 $245,271 $13,834 $5,331
CDS FMS Fee and CDS CFC FMS Fee
Note 11N/A N/A N/A N/A I $4,489,718 $1,598,801 16.82% 16.82% $724,303 $278,549 $43,062 $16,561
CDS Occupational Therapy
Note 2 and Note 1010/1/2009 N/A 10/1/2009 -0.24% CRPA $5,325 $1,900 11.70% 11.70% $609 $234 $52 $20
CDS Physical Therapy
Note 2 and Note 1010/1/2009 5.98% N/A N/A CRPA $3,114 $1,111 9.51% 9.51% $285 $110 $30 $12
CDS Respite
Note 3 and Note 109/1/2015 8.78% 9/1/2015 -0.17% CRPA $16,413,771 $5,857,718 -2.80% -2.80% -$440,728 -$169,834 $157,428 $60,665
CDS Speech Therapy
Note 2 and Note 1010/1/2009 4.40% N/A N/A CRPA $91,763 $32,748 11.04% 11.04% $9,713 $3,743 $880 $339
CDS Employment Assistance and CDS Supported
Employment
Note 2 and Note 10
9/1/2013 0.88% 9/1/2013 -1.05% CR $254,307 $90,757 6.06% 6.06% $14,777 $5,694 $2,440 $940
CDS CFC PAS/Hab and CDS Community Support Services
Transportation
Note 1, Note 3, and Note 10
6/1/2015 New Service N/A N/A CRPA $55,279,513 $16,562,489 -17.17% -17.17% -$9,105,592 -$2,987,410 $530,196 $173,949
Day Habilitation
Note 109/1/2015 3.57% 9/1/2013 -1.01% CRPA $14,923,649 $5,325,925 28.37% 28.37% $4,060,810 $1,564,833 $143,136 $55,157
Dietary
Note 2 and Note 109/1/2009 11.23% 9/1/2007 -0.12% CRPA $6,086 $2,172 17.47% 17.47% $1,014 $391 $58 $22
CFC PAS/HAB and Community Support Services
Transportation
Note 1 and Note 10
9/1/2010 0.86% 8/1/2017 -20.88% CRPA $82,026,482 $24,663,953 7.22% 7.22% $5,679,735 $1,869,511 $786,732 $258,956
CFC ERS
Note 129/1/2015 New Service N/A N/A I $4,817 $1,719 25.49% 25.49% $1,173 $452 $46 $18
Employment Assistance and Supported Employment
Note 2 and Note 109/1/2013 0.86% 9/1/2013 -1.02% CR $349,410 $124,697 5.45% 5.45% $18,254 $7,034 $3,352 $1,292
LVN
Note 2 and Note 109/1/2009 New Service N/A N/A CRPA $107,254 $38,277 24.86% 24.86% $25,553 $9,847 $1,028 $396
Occupational Therapy
Note 2 and Note 109/1/2009 4.41% 9/1/2009 -1.58% CRPA $88,850 $31,709 11.54% 11.54% $9,834 $3,789 $852 $328
Physical Therapy
Note 2 and Note 109/1/2009 4.47% N/A N/A CRPA $127,914 $45,650 9.39% 9.39% $11,511 $4,436 $1,226 $472
RN
Note 2 and Note 109/1/2009 New Service N/A N/A CRPA $621,648 $221,853 51.62% 51.62% $307,787 $118,606 $5,962 $2,297
Requisition Fees
Note 12N/A N/A N/A N/A I $232,537 $83,033 43.12% 43.12% $102,626 $39,547 $2,380 $917
Respite
Note 109/1/2013 8.29% 9/1/2013 -1.00% CRPA $38,336,581 $13,681,491 -3.86% -3.86% -$1,420,946 -$547,561 $367,694 $141,691
Speech Therapy
Note 2 and Note 109/1/2009 2.93% N/A N/A CRPA $1,233,199 $440,102 10.89% 10.89% $128,838 $49,648 $11,828 $4,558
TxHmL Subtotal $216,944,488 $69,644,098 $774,315 $499,986 $2,080,908 $727,271
Youth Empowerment Services (YES) Waiver
Employment Assistance N/A New Service N/A N/A PA $469 $168 41.35% 41.35% $165 $64 $4 $2
IHR 9/1/2013 110.06% N/A N/A B $1,180,200 $421,876 -9.37% -9.37% -$137,939 -$53,155 $14,726 $5,675
OHR - Camp
Note 129/1/2010 New Service N/A N/A I $252,455 $90,297 12.57% 12.57% $38,665 $14,900 $3,076 $1,185
OHR DFPS RCC 9/1/2010 New Service N/A N/A PA $73,417 $26,291 79.76% 79.76% $79,444 $30,614 $996 $384
HHSC Provider Finance Department Page No. 8
KEY -
M - Based on Medicare rates
PA - Pro forma analysis
T - Trending from current rate to FY 2022-23
Method of
Determining
Rate Change
Date Percent Date Percent AF GR 2022 2023 AF GR AF GR
Provider Reimbursement Rate Tables Rate Change Based on Current Review of Costs and Cost of One Percent Rate Change
CRPA – Pro-Forma model updated with most recently audited cost report data
trended to 2022-23
Estimated 2022-23
Biennial Cost of
One Percent Rate ChangeHHSC Programs
Last Legislative or Federal
Rate Increase
Last Legislative or Federal
Rate Decrease
Estimated
2020-2021 Biennial Cost
Percentage Rate Change to
Fully Fund Methodology
Estimated 2022-23 Biennial Cost
of Rate Change
I – Applied PCE inflator from year of last rate change
A - Access based CR - Cost Reports used for prospective rate - trend to FY 2022-23
B - Based on rates from other Medicaid programs
CD - Percent of claims data
BR - Blue Ribbon file of claims data
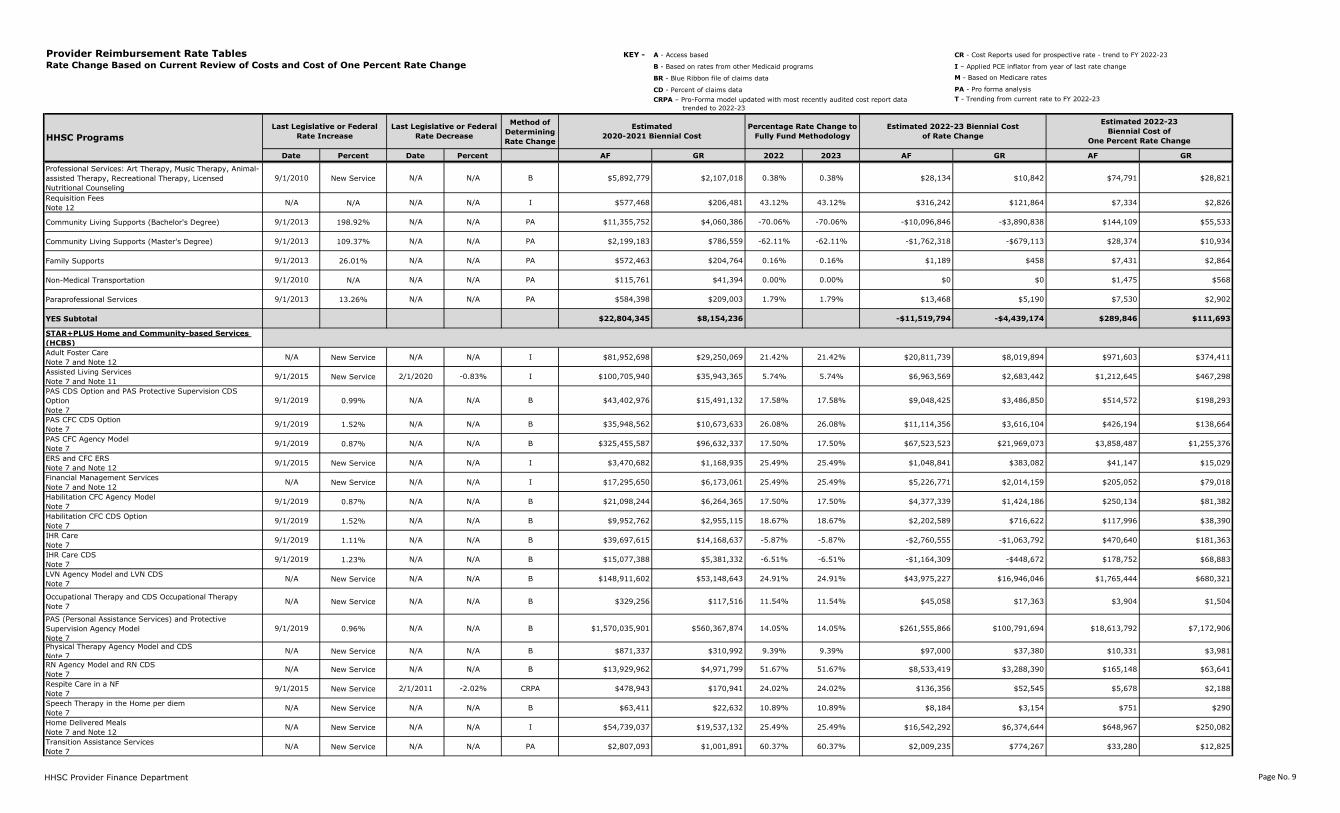
Professional Services: Art Therapy, Music Therapy, Animal-
assisted Therapy, Recreational Therapy, Licensed
Nutritional Counseling
9/1/2010 New Service N/A N/A B $5,892,779 $2,107,018 0.38% 0.38% $28,134 $10,842 $74,791 $28,821
Requisition Fees
Note 12N/A N/A N/A N/A I $577,468 $206,481 43.12% 43.12% $316,242 $121,864 $7,334 $2,826
Community Living Supports (Bachelor's Degree) 9/1/2013 198.92% N/A N/A PA $11,355,752 $4,060,386 -70.06% -70.06% -$10,096,846 -$3,890,838 $144,109 $55,533
Community Living Supports (Master's Degree) 9/1/2013 109.37% N/A N/A PA $2,199,183 $786,559 -62.11% -62.11% -$1,762,318 -$679,113 $28,374 $10,934
Family Supports 9/1/2013 26.01% N/A N/A PA $572,463 $204,764 0.16% 0.16% $1,189 $458 $7,431 $2,864
Non-Medical Transportation 9/1/2010 N/A N/A N/A PA $115,761 $41,394 0.00% 0.00% $0 $0 $1,475 $568
Paraprofessional Services 9/1/2013 13.26% N/A N/A PA $584,398 $209,003 1.79% 1.79% $13,468 $5,190 $7,530 $2,902
YES Subtotal $22,804,345 $8,154,236 -$11,519,794 -$4,439,174 $289,846 $111,693
STAR+PLUS Home and Community-based Services
(HCBS)
Adult Foster Care
Note 7 and Note 12N/A New Service N/A N/A I $81,952,698 $29,250,069 21.42% 21.42% $20,811,739 $8,019,894 $971,603 $374,411
Assisted Living Services
Note 7 and Note 119/1/2015 New Service 2/1/2020 -0.83% I $100,705,940 $35,943,365 5.74% 5.74% $6,963,569 $2,683,442 $1,212,645 $467,298
PAS CDS Option and PAS Protective Supervision CDS
Option
Note 7
9/1/2019 0.99% N/A N/A B $43,402,976 $15,491,132 17.58% 17.58% $9,048,425 $3,486,850 $514,572 $198,293
PAS CFC CDS Option
Note 79/1/2019 1.52% N/A N/A B $35,948,562 $10,673,633 26.08% 26.08% $11,114,356 $3,616,104 $426,194 $138,664
PAS CFC Agency Model
Note 79/1/2019 0.87% N/A N/A B $325,455,587 $96,632,337 17.50% 17.50% $67,523,523 $21,969,073 $3,858,487 $1,255,376
ERS and CFC ERS
Note 7 and Note 129/1/2015 New Service N/A N/A I $3,470,682 $1,168,935 25.49% 25.49% $1,048,841 $383,082 $41,147 $15,029
Financial Management Services
Note 7 and Note 12N/A New Service N/A N/A I $17,295,650 $6,173,061 25.49% 25.49% $5,226,771 $2,014,159 $205,052 $79,018
Habilitation CFC Agency Model
Note 79/1/2019 0.87% N/A N/A B $21,098,244 $6,264,365 17.50% 17.50% $4,377,339 $1,424,186 $250,134 $81,382
Habilitation CFC CDS Option
Note 79/1/2019 1.52% N/A N/A B $9,952,762 $2,955,115 18.67% 18.67% $2,202,589 $716,622 $117,996 $38,390
IHR Care
Note 79/1/2019 1.11% N/A N/A B $39,697,615 $14,168,637 -5.87% -5.87% -$2,760,555 -$1,063,792 $470,640 $181,363
IHR Care CDS
Note 79/1/2019 1.23% N/A N/A B $15,077,388 $5,381,332 -6.51% -6.51% -$1,164,309 -$448,672 $178,752 $68,883
LVN Agency Model and LVN CDS
Note 7N/A New Service N/A N/A B $148,911,602 $53,148,643 24.91% 24.91% $43,975,227 $16,946,046 $1,765,444 $680,321
Occupational Therapy and CDS Occupational Therapy
Note 7N/A New Service N/A N/A B $329,256 $117,516 11.54% 11.54% $45,058 $17,363 $3,904 $1,504
PAS (Personal Assistance Services) and Protective
Supervision Agency Model
Note 7
9/1/2019 0.96% N/A N/A B $1,570,035,901 $560,367,874 14.05% 14.05% $261,555,866 $100,791,694 $18,613,792 $7,172,906
Physical Therapy Agency Model and CDS
Note 7N/A New Service N/A N/A B $871,337 $310,992 9.39% 9.39% $97,000 $37,380 $10,331 $3,981
RN Agency Model and RN CDS
Note 7N/A New Service N/A N/A B $13,929,962 $4,971,799 51.67% 51.67% $8,533,419 $3,288,390 $165,148 $63,641
Respite Care in a NF
Note 79/1/2015 New Service 2/1/2011 -2.02% CRPA $478,943 $170,941 24.02% 24.02% $136,356 $52,545 $5,678 $2,188
Speech Therapy in the Home per diem
Note 7N/A New Service N/A N/A B $63,411 $22,632 10.89% 10.89% $8,184 $3,154 $751 $290
Home Delivered Meals
Note 7 and Note 12N/A New Service N/A N/A I $54,739,037 $19,537,132 25.49% 25.49% $16,542,292 $6,374,644 $648,967 $250,082
Transition Assistance Services
Note 7N/A New Service N/A N/A PA $2,807,093 $1,001,891 60.37% 60.37% $2,009,235 $774,267 $33,280 $12,825
HHSC Provider Finance Department Page No. 9
KEY -
M - Based on Medicare rates
PA - Pro forma analysis
T - Trending from current rate to FY 2022-23
Method of
Determining
Rate Change
Date Percent Date Percent AF GR 2022 2023 AF GR AF GR
Provider Reimbursement Rate Tables Rate Change Based on Current Review of Costs and Cost of One Percent Rate Change
CRPA – Pro-Forma model updated with most recently audited cost report data
trended to 2022-23
Estimated 2022-23
Biennial Cost of
One Percent Rate ChangeHHSC Programs
Last Legislative or Federal
Rate Increase
Last Legislative or Federal
Rate Decrease
Estimated
2020-2021 Biennial Cost
Percentage Rate Change to
Fully Fund Methodology
Estimated 2022-23 Biennial Cost
of Rate Change
I – Applied PCE inflator from year of last rate change
A - Access based CR - Cost Reports used for prospective rate - trend to FY 2022-23
B - Based on rates from other Medicaid programs
CD - Percent of claims data
BR - Blue Ribbon file of claims data
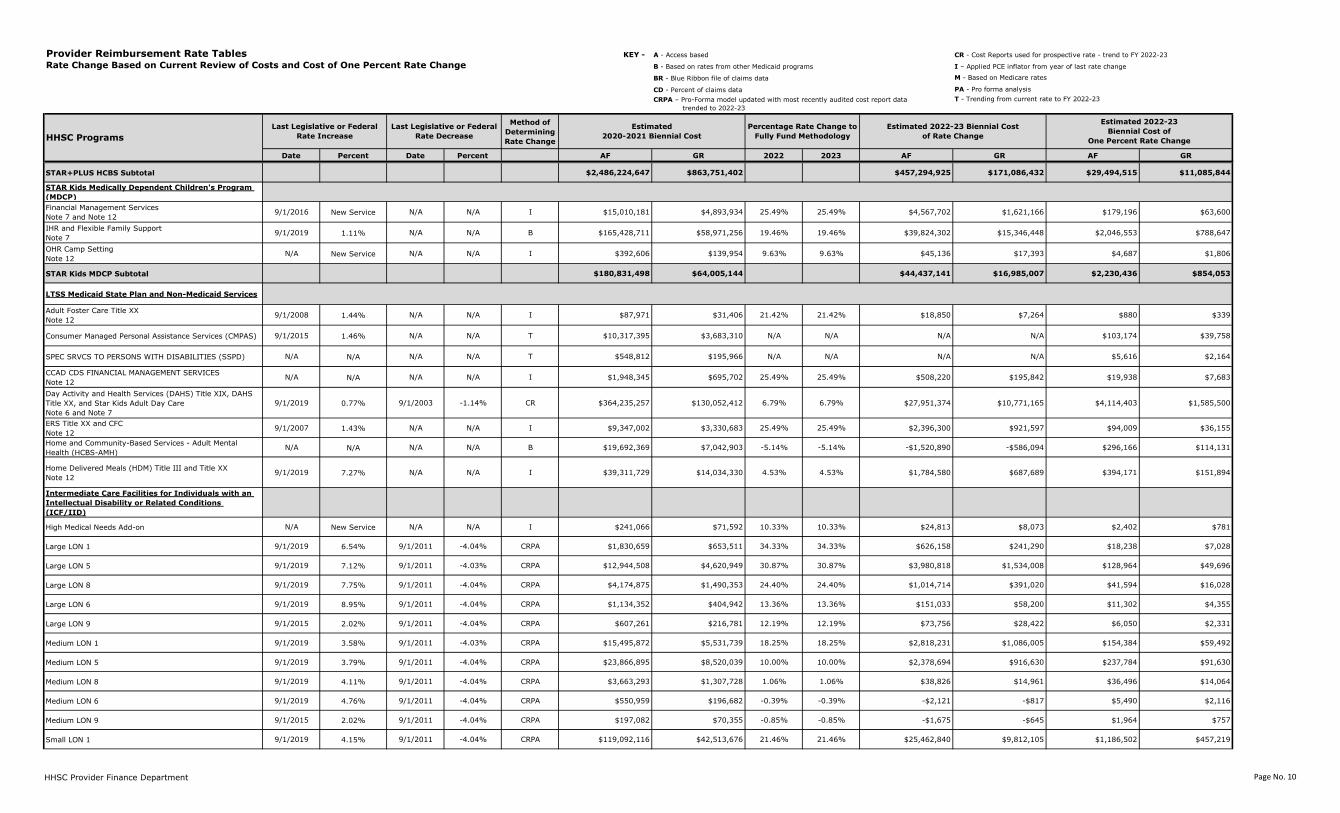
STAR+PLUS HCBS Subtotal $2,486,224,647 $863,751,402 $457,294,925 $171,086,432 $29,494,515 $11,085,844
STAR Kids Medically Dependent Children's Program
(MDCP)
Financial Management Services
Note 7 and Note 129/1/2016 New Service N/A N/A I $15,010,181 $4,893,934 25.49% 25.49% $4,567,702 $1,621,166 $179,196 $63,600
IHR and Flexible Family Support
Note 79/1/2019 1.11% N/A N/A B $165,428,711 $58,971,256 19.46% 19.46% $39,824,302 $15,346,448 $2,046,553 $788,647
OHR Camp Setting
Note 12N/A New Service N/A N/A I $392,606 $139,954 9.63% 9.63% $45,136 $17,393 $4,687 $1,806
STAR Kids MDCP Subtotal $180,831,498 $64,005,144 $44,437,141 $16,985,007 $2,230,436 $854,053
LTSS Medicaid State Plan and Non-Medicaid Services
Adult Foster Care Title XX
Note 129/1/2008 1.44% N/A N/A I $87,971 $31,406 21.42% 21.42% $18,850 $7,264 $880 $339
Consumer Managed Personal Assistance Services (CMPAS) 9/1/2015 1.46% N/A N/A T $10,317,395 $3,683,310 N/A N/A N/A N/A $103,174 $39,758
SPEC SRVCS TO PERSONS WITH DISABILITIES (SSPD) N/A N/A N/A N/A T $548,812 $195,966 N/A N/A N/A N/A $5,616 $2,164
CCAD CDS FINANCIAL MANAGEMENT SERVICES
Note 12N/A N/A N/A N/A I $1,948,345 $695,702 25.49% 25.49% $508,220 $195,842 $19,938 $7,683
Day Activity and Health Services (DAHS) Title XIX, DAHS
Title XX, and Star Kids Adult Day Care
Note 6 and Note 7
9/1/2019 0.77% 9/1/2003 -1.14% CR $364,235,257 $130,052,412 6.79% 6.79% $27,951,374 $10,771,165 $4,114,403 $1,585,500
ERS Title XX and CFC
Note 129/1/2007 1.43% N/A N/A I $9,347,002 $3,330,683 25.49% 25.49% $2,396,300 $921,597 $94,009 $36,155
Home and Community-Based Services - Adult Mental
Health (HCBS-AMH)N/A N/A N/A N/A B $19,692,369 $7,042,903 -5.14% -5.14% -$1,520,890 -$586,094 $296,166 $114,131
Home Delivered Meals (HDM) Title III and Title XX
Note 129/1/2019 7.27% N/A N/A I $39,311,729 $14,034,330 4.53% 4.53% $1,784,580 $687,689 $394,171 $151,894
Intermediate Care Facilities for Individuals with an
Intellectual Disability or Related Conditions
(ICF/IID)
High Medical Needs Add-on N/A New Service N/A N/A I $241,066 $71,592 10.33% 10.33% $24,813 $8,073 $2,402 $781
Large LON 1 9/1/2019 6.54% 9/1/2011 -4.04% CRPA $1,830,659 $653,511 34.33% 34.33% $626,158 $241,290 $18,238 $7,028
Large LON 5 9/1/2019 7.12% 9/1/2011 -4.03% CRPA $12,944,508 $4,620,949 30.87% 30.87% $3,980,818 $1,534,008 $128,964 $49,696
Large LON 8 9/1/2019 7.75% 9/1/2011 -4.04% CRPA $4,174,875 $1,490,353 24.40% 24.40% $1,014,714 $391,020 $41,594 $16,028
Large LON 6 9/1/2019 8.95% 9/1/2011 -4.04% CRPA $1,134,352 $404,942 13.36% 13.36% $151,033 $58,200 $11,302 $4,355
Large LON 9 9/1/2015 2.02% 9/1/2011 -4.04% CRPA $607,261 $216,781 12.19% 12.19% $73,756 $28,422 $6,050 $2,331
Medium LON 1 9/1/2019 3.58% 9/1/2011 -4.03% CRPA $15,495,872 $5,531,739 18.25% 18.25% $2,818,231 $1,086,005 $154,384 $59,492
Medium LON 5 9/1/2019 3.79% 9/1/2011 -4.04% CRPA $23,866,895 $8,520,039 10.00% 10.00% $2,378,694 $916,630 $237,784 $91,630
Medium LON 8 9/1/2019 4.11% 9/1/2011 -4.04% CRPA $3,663,293 $1,307,728 1.06% 1.06% $38,826 $14,961 $36,496 $14,064
Medium LON 6 9/1/2019 4.76% 9/1/2011 -4.04% CRPA $550,959 $196,682 -0.39% -0.39% -$2,121 -$817 $5,490 $2,116
Medium LON 9 9/1/2015 2.02% 9/1/2011 -4.04% CRPA $197,082 $70,355 -0.85% -0.85% -$1,675 -$645 $1,964 $757
Small LON 1 9/1/2019 4.15% 9/1/2011 -4.04% CRPA $119,092,116 $42,513,676 21.46% 21.46% $25,462,840 $9,812,105 $1,186,502 $457,219
HHSC Provider Finance Department Page No. 10

KEY -
M - Based on Medicare rates
PA - Pro forma analysis
T - Trending from current rate to FY 2022-23
Method of
Determining
Rate Change
Date Percent Date Percent AF GR 2022 2023 AF GR AF GR
Provider Reimbursement Rate Tables Rate Change Based on Current Review of Costs and Cost of One Percent Rate Change
CRPA – Pro-Forma model updated with most recently audited cost report data
trended to 2022-23
Estimated 2022-23
Biennial Cost of
One Percent Rate ChangeHHSC Programs
Last Legislative or Federal
Rate Increase
Last Legislative or Federal
Rate Decrease
Estimated
2020-2021 Biennial Cost
Percentage Rate Change to
Fully Fund Methodology
Estimated 2022-23 Biennial Cost
of Rate Change
I – Applied PCE inflator from year of last rate change
A - Access based CR - Cost Reports used for prospective rate - trend to FY 2022-23
B - Based on rates from other Medicaid programs
CD - Percent of claims data
BR - Blue Ribbon file of claims data
Small LON 5 9/1/2019 4.44% 9/1/2011 -4.04% CRPA $269,297,078 $96,134,060 14.62% 14.62% $39,234,638 $15,119,068 $2,682,978 $1,033,886
Small LON 8 9/1/2019 4.98% 9/1/2011 -4.04% CRPA $77,669,364 $27,726,522 8.91% 8.91% $6,894,636 $2,656,848 $773,812 $298,188
Small LON 6 9/1/2019 5.84% 9/1/2011 -4.04% CRPA $36,359,825 $12,979,783 4.83% 4.83% $1,750,406 $674,519 $362,250 $139,593
Small LON 9 9/1/2015 2.02% 9/1/2011 -4.04% CRPA $5,488,574 $1,959,319 -0.19% -0.19% -$10,368 -$3,995 $54,682 $21,072
ICF/IID Subtotal $572,613,779 $204,398,031 $84,435,398 $32,535,692 $5,704,892 $2,198,236
Nursing Facility (NF)
Note 4, Note 6, Note 7 and Note 9
Daily Care (Average RUG-III) 9/1/2014 3.92% 2/1/2011 -2.02% CR $5,493,701,642 $1,961,467,406 24.02% 24.02% $1,483,505,834 $571,674,381 $61,771,511 $23,803,877
Hospice in NF N/A N/A N/A N/A CR $586,630,653 $209,377,059 24.02% 24.02% $138,479,685 $53,363,147 $5,766,138 $2,221,981
Pediatric tracheostomy add-on
Note 129/1/2014 3.92% 2/1/2011 -2.02% I $58,219 $20,779 10.92% 10.92% $6,270 $2,416 $574 $221
Ventilator Add-on
Note 129/1/2014 3.92% 2/1/2011 -2.02% I $13,946,472 $4,975,805 10.92% 10.92% $1,584,968 $610,767 $145,144 $55,931
NF Subtotal $6,094,336,986 $2,175,841,049 $1,623,576,757 $625,650,712 $67,683,367 $26,082,011
NF Therapies and Therapy Assessments
Note 4, Note 6, Note 7, and Note 123/1/2008 New Service N/A N/A I $38,461,980 $13,725,726 21.42% 21.42% $8,272,632 $3,187,859 $386,211 $148,826
Program All-inclusive Care Elderly (PACE) N/A N/A N/A N/A N/A $86,164,981 $30,767,273 10.33% 10.33% $9,144,993 $3,524,023 $885,376 $341,180
PAS Type Services
PAS Agency Model (Non-HCBS)
Note 7N/A N/A N/A N/A B $49,287 $17,598 14.25% 14.25% $8,343 $3,215 $585 $226
PAS CFC Agency Model (Non-HCBS)
Note 79/1/2019 0.87% N/A N/A B $6,231,674 $1,851,175 17.50% 17.50% $1,250,697 $406,919 $71,468 $23,253
PAS/PHC, CAS, and FC Non-Priority CDS
Note 6 and Note 79/1/2019 0.87% N/A N/A CR $212,628,875 $75,920,241 23.52% 23.52% $58,724,439 $22,629,688 $2,496,360 $961,982
PAS/PHC, CAS, and FC Priority Agency
Note 6 and Note 79/1/2019 0.87% N/A N/A CR $17,735,590 $6,331,754 14.97% 14.97% $2,658,633 $1,024,504 $177,652 $68,458
PAS/PHC, CAS, and FC Priority CDS 9/1/2019 0.87% N/A N/A CR $659,930 $235,600 23.64% 23.64% $156,250 $60,211 $6,610 $2,547
PAS/Primary Home Care (PHC), Community Attendant
Services (CAS), Family Care (FC) Non-Priority Agency
Note 6 and Note 7
9/1/2019 0.87% N/A N/A CR $4,137,889,867 $1,477,393,912 15.41% 15.41% $697,102,109 $268,630,131 $45,243,399 $17,434,668
PAS Type Services Subtotal $4,375,195,222 $1,561,750,282 $759,900,470 $292,754,668 $47,996,074 $18,491,133
Habilitation Type Services
CFC Habilitation
Note 79/1/2019 0.87% N/A N/A B $24,642,343 $7,322,415 17.50% 17.50% $4,837,562 $1,573,921 $276,432 $89,938
CFC Habilitation CDS
Note 79/1/2019 0.87% N/A N/A B $52,084,383 $15,478,154 24.74% 24.74% $14,358,651 $4,671,647 $580,306 $188,805
Habilitation Type Services Subtotal PA $76,726,725 $22,800,569 $19,196,213 $6,245,568 $856,738 $278,743
Prescribed Pediatric Extended Care 6/1/2017 New Service N/A N/A PA $1,620,747 $578,928 10.49% 10.49% $188,262 $72,548 $17,948 $6,916
Residential Care
Note 129/1/2015 0.29% 2/1/2020 -1.02% I $5,000,213 $1,785,076 5.74% 5.74% $286,875 $110,547 $50,002 $19,268
Therapy Services
Occupational Therapy: Home per diem
Note 79/1/2015 New Service N/A N/A B $305,891 $109,221 11.54% 11.54% $40,487 $15,602 $3,508 $1,352
Physical Therapy; Home per diem
Note 79/1/2015 New Service N/A N/A B $711,393 $254,009 9.39% 9.39% $76,602 $29,519 $8,159 $3,144
HHSC Provider Finance Department Page No. 11
KEY -
M - Based on Medicare rates
PA - Pro forma analysis
T - Trending from current rate to FY 2022-23
Method of
Determining
Rate Change
Date Percent Date Percent AF GR 2022 2023 AF GR AF GR
Provider Reimbursement Rate Tables Rate Change Based on Current Review of Costs and Cost of One Percent Rate Change
CRPA – Pro-Forma model updated with most recently audited cost report data
trended to 2022-23
Estimated 2022-23
Biennial Cost of
One Percent Rate ChangeHHSC Programs
Last Legislative or Federal
Rate Increase
Last Legislative or Federal
Rate Decrease
Estimated
2020-2021 Biennial Cost
Percentage Rate Change to
Fully Fund Methodology
Estimated 2022-23 Biennial Cost
of Rate Change
I – Applied PCE inflator from year of last rate change
A - Access based CR - Cost Reports used for prospective rate - trend to FY 2022-23
B - Based on rates from other Medicaid programs
CD - Percent of claims data
BR - Blue Ribbon file of claims data
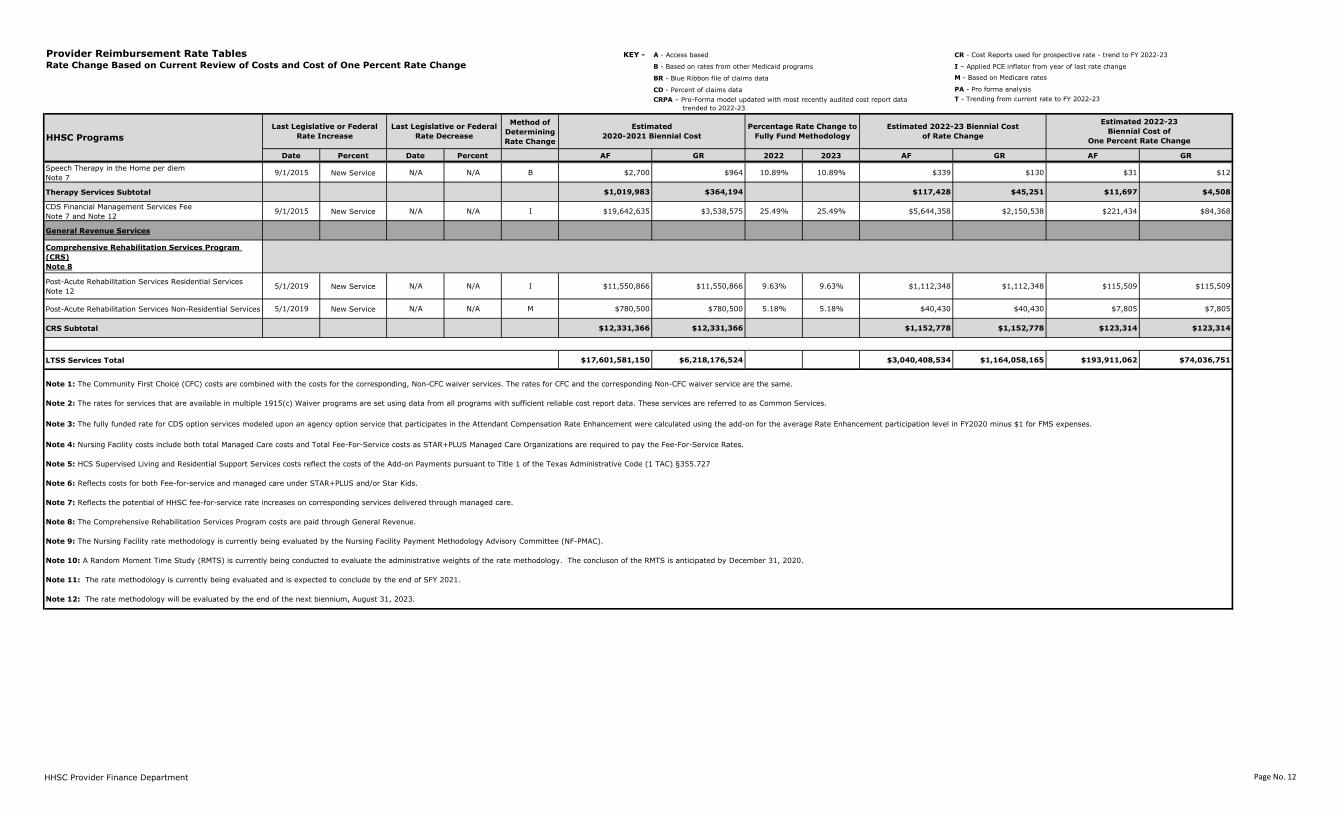
Speech Therapy in the Home per diem
Note 79/1/2015 New Service N/A N/A B $2,700 $964 10.89% 10.89% $339 $130 $31 $12
Therapy Services Subtotal $1,019,983 $364,194 $117,428 $45,251 $11,697 $4,508
CDS Financial Management Services Fee
Note 7 and Note 129/1/2015 New Service N/A N/A I $19,642,635 $3,538,575 25.49% 25.49% $5,644,358 $2,150,538 $221,434 $84,368
General Revenue Services
Comprehensive Rehabilitation Services Program
(CRS)
Note 8
Post-Acute Rehabilitation Services Residential Services
Note 125/1/2019 New Service N/A N/A I $11,550,866 $11,550,866 9.63% 9.63% $1,112,348 $1,112,348 $115,509 $115,509
Post-Acute Rehabilitation Services Non-Residential Services 5/1/2019 New Service N/A N/A M $780,500 $780,500 5.18% 5.18% $40,430 $40,430 $7,805 $7,805
CRS Subtotal $12,331,366 $12,331,366 $1,152,778 $1,152,778 $123,314 $123,314
LTSS Services Total $17,601,581,150 $6,218,176,524 $3,040,408,534 $1,164,058,165 $193,911,062 $74,036,751
Note 11: The rate methodology is currently being evaluated and is expected to conclude by the end of SFY 2021.
Note 12: The rate methodology will be evaluated by the end of the next biennium, August 31, 2023.
Note 3: The fully funded rate for CDS option services modeled upon an agency option service that participates in the Attendant Compensation Rate Enhancement were calculated using the add-on for the average Rate Enhancement participation level in FY2020 minus $1 for FMS expenses.
Note 6: Reflects costs for both Fee-for-service and managed care under STAR+PLUS and/or Star Kids.
Note 7: Reflects the potential of HHSC fee-for-service rate increases on corresponding services delivered through managed care.
Note 8: The Comprehensive Rehabilitation Services Program costs are paid through General Revenue.
Note 9: The Nursing Facility rate methodology is currently being evaluated by the Nursing Facility Payment Methodology Advisory Committee (NF-PMAC).
Note 10: A Random Moment Time Study (RMTS) is currently being conducted to evaluate the administrative weights of the rate methodology. The concluson of the RMTS is anticipated by December 31, 2020.
Note 1: The Community First Choice (CFC) costs are combined with the costs for the corresponding, Non-CFC waiver services. The rates for CFC and the corresponding Non-CFC waiver service are the same.
Note 2: The rates for services that are available in multiple 1915(c) Waiver programs are set using data from all programs with sufficient reliable cost report data. These services are referred to as Common Services.
Note 4: Nursing Facility costs include both total Managed Care costs and Total Fee-For-Service costs as STAR+PLUS Managed Care Organizations are required to pay the Fee-For-Service Rates.
Note 5: HCS Supervised Living and Residential Support Services costs reflect the costs of the Add-on Payments pursuant to Title 1 of the Texas Administrative Code (1 TAC) §355.727
HHSC Provider Finance Department Page No. 12