Proven Advanced Safety Vehicle Laws Technologies · by Advocates for Highway and Auto Safety...
58
Proven Safety Laws Advanced Vehicle Technologies 2018 Roadmap of State Highway Safety Laws 15th Annual Edition
Transcript of Proven Advanced Safety Vehicle Laws Technologies · by Advocates for Highway and Auto Safety...

ProvenSafetyLaws
AdvancedVehicle
Technologies
2018 Roadmap of State Highway Safety Laws15th Annual Edition

15TH ANNUAL ROADMAP OF STATE HIGHWAY SAFETY LAWS
“Safest Route: Proven Safety Laws + Advanced Vehicle Technologies”
We Don’t Have to Wait for Fully Autonomous Cars to Stop Needless Deaths and Injuries
Effective and Available Countermeasures Must Be Adopted Now
Catherine Chase, President
The 2018 Roadmap of State Highway Safety Laws marks the 15th annual publication
by Advocates for Highway and Auto Safety (Advocates). This report serves as a
navigational tool giving guidance on successful measures to reduce preventable motor
vehicle deaths, injuries and crash costs. Each day on average, approximately 100
people are killed and 6,500 more are injured on our roadways across the country. Yet,
solutions continue to languish or be ignored in state capitals, Congress and at the U.S.
Department of Transportation.
In recent years, there has been tremendous focus on the promise of autonomous
vehicles (AVs), also known as driverless cars, to revolutionize our transportation system
and reach the goal of zero traffic fatalities. However, the promise of AVs to completely
solve our nation’s highway safety problem is, realistically, decades away. In the short
term, we have proven traffic safety laws and advanced vehicle technologies available
now that could be saving thousands of lives every year.
This year’s Roadmap Report has identified 407 state laws that are needed in all 50 states and the District of
Columbia. Not a single state has all 16 of the optimal, lifesaving laws. The lack of basic traffic safety laws
addressing occupant protection and child passenger safety as well as teen, impaired and distracted driving is
contributing to our nation’s unacceptable death and injury toll. For instance, government fatality data these past
five years show that on average half of all passenger vehicle occupants killed were not buckled up. Yet, 16
states do not have primary enforcement seat belt laws for all passengers. Nearly one-third of all crashes involve
alcohol-impairment, while 32 critical impaired driving laws are still needed in 30 states. Moreover, year after
year, all-rider motorcycle helmet laws are under attack in state legislatures even though on average 40% of all
motorcyclists killed are not wearing a helmet.
Advocates congratulates the 13 states that adopted optimal safety laws in 2017. However, more laws in more
states need to pass in 2018. It is time for state elected officials to take leadership roles in pushing enactment
of laws that protect every occupant on every ride in every seating position. Also, stronger laws are needed to
safeguard teen drivers and reduce the deadly consequences of alcohol impairment and distraction.
Safety laws combined with safety technologies are a winning strategy to make significant and steady progress in
preventing crashes. The deadly threats of excessive speeding, red light running and impaired driving have
technological solutions. Automated enforcement has a proven track record of combatting two major crash
factors – speed and red light running. Ignition interlock devices (IIDs) have been extremely effective in
preventing attempts to drive while impaired. Crash avoidance technologies such as automatic emergency
braking (AEB) and lane departure warning should be standard equipment in all passenger cars and commercial
motor vehicles. And, ensuring the safety of vulnerable rear seat passengers including children and teens needs
to be prioritized through the installation of rear seat belt reminders and other technological tools.
Advocates is hopeful that in the long term driverless cars will be the catalyst for eliminating crash deaths and
injuries. In the near term, adopting comprehensive safety laws and using proven roadway and in-vehicle
technologies are the safest and surest route to addressing this major public health epidemic. EMBARGOED UNTIL
1/22/1
8

January 2018 Advocates for Highway and Auto Safety 2
Glossary of Acronyms……………………………………………………………………………………………………………4
Urgent Action Needed to Improve Highway Safety………………………………………………………………….5
Sharp Increases in Fatalities………………………………………………………………………………………………...6
Near Term and Long Term Traffic Safety Solutions……………………….…………………...…………………..7
Safety Laws Reduce Crash Costs.………………………………………………………………………………………....8
Legislative Activity in 2017……….……………………………………………………………………………………….....9
Key Things to Know about this Report………………………………………………………………………………...10
Important Changes to Ratings in this Report………………………………………………………………………..11
Definitions of the 16 Lifesaving Laws…………………………………………………………………………………..12
Occupant Protection………………………………………………….…………………………………………………….….14
Primary Enforcement Seat Belt Laws…………………………………………………………………………………...15
All-Rider Motorcycle Helmet Laws………………………………….…………………………………………………....17
Occupant Protection Laws Rating Chart……………………….……………………………………………………...19
Child Passenger Safety………………………………………………….……………………………………………………20
Child Passenger Safety Laws………………………………………….…………………………………………………..21
Child Passenger Safety Laws Rating Chart…………………………………………….…………………………….23
Teen Driving: Graduated Driver Licensing (GDL) Programs………………………………………………..….24
Teen Driving Laws…………………………………………………………………………………………………………......25
Teen Driving Laws Rating Chart……………………………………………………………………………………….....27
Impaired Driving………………………………………………………………………………………………………………...28
Impaired Driving Laws……………………………………………………………………….…………………………….....29
Ignition Interlock Devices for All Offenders…………………………………………………………………………..30
Child Endangerment Laws…………………………………………………………………………………………………..31
Open Container Laws………………………………………………………………………………………………………….31
Impaired Driving Laws Rating Chart……………………………………………………………………………………..32
Distracted Driving……………………………………………………………………………………………………………….33
Distracted Driving Laws………………………………………………………………………………………………………34
Distracted Driving Laws Rating Chart…………………………………………………………………………………..35
Overall State Ratings Based on Number of Laws………………………………………………………………...36
Overall State Ratings Chart………………………………………………………………………………………………...38
States at a Glance (See Individual State Index on Page 3)…………………………………………………...40
Source Information……………………………………………………………………………………………………………..52
Acknowledgements…………………………………………………………………………………………………………….57
About Advocates………………………………………………………………………………………………………………...57
TABLE OF CONTENTS
EMBARGOED UNTIL
1/22/1
8

January 2018 Advocates for Highway and Auto Safety 3
Introduction .................................................................................................................................................. 40
Alabama........................................................................................................................................................ 41
Alaska ........................................................................................................................................................... 41
Arizona .......................................................................................................................................................... 41
Arkansas ....................................................................................................................................................... 41
California ...................................................................................................................................................... 42
Colorado ....................................................................................................................................................... 42
Connecticut .................................................................................................................................................. 42
Delaware ...................................................................................................................................................... 42
District of Columbia ..................................................................................................................................... 42
Florida ........................................................................................................................................................... 43
Georgia ......................................................................................................................................................... 43
Hawaii ........................................................................................................................................................... 43
Idaho . .. ......................................................................................................................................................... 43
Illinois …………………………………………………………………………………………………………………………………………..43
Indiana .......................................................................................................................................................... 44
Iowa… …………………………………………………………………………………………………………………………………………..44
Kansas .......................................................................................................................................................... 44
Kentucky ....................................................................................................................................................... 44
Louisiana ...................................................................................................................................................... 44
Maine ........................................................................................................................................................... 45
Maryland ....................................................................................................................................................... 45
Massachusetts ............................................................................................................................................. 45
Michigan ....................................................................................................................................................... 45
Minnesota..................................................................................................................................................... 45
Mississippi .................................................................................................................................................... 46
Missouri ........................................................................................................................................................ 46
Montana ....................................................................................................................................................... 46
Nebraska ...................................................................................................................................................... 46
Nevada ......................................................................................................................................................... 47
New Hampshire ............................................................................................................................................ 47
New Jersey.................................................................................................................................................... 47
New Mexico .................................................................................................................................................. 47
New York ....................................................................................................................................................... 47
North Carolina .............................................................................................................................................. 48
North Dakota ................................................................................................................................................ 48
Ohio…. ........................................................................................................................................................... 48
Oklahoma ..................................................................................................................................................... 48
Oregon .......................................................................................................................................................... 48
Pennsylvania ................................................................................................................................................ 49
Rhode Island ................................................................................................................................................ 49
South Carolina .............................................................................................................................................. 49
South Dakota ............................................................................................................................................... 49
Tennessee .................................................................................................................................................... 50
Texas . . .......................................................................................................................................................... 50
Utah .. . .......................................................................................................................................................... 50
Vermont ........................................................................................................................................................ 50
Virginia .......................................................................................................................................................... 50
Washington .................................................................................................................................................. 51
West Virginia................................................................................................................................................. 51
Wisconsin ..................................................................................................................................................... 51
Wyoming ....................................................................................................................................................... 51
STATES AT A GLANCE
EMBARGOED UNTIL
1/22/1
8

January 2018 Advocates for Highway and Auto Safety 4
Advocates - Advocates for Highway and Auto Safety
AAA - American Automobile Association
AEB - Automatic Emergency Braking
AV - Autonomous Vehicle
BAC - Blood Alcohol Concentration
CDC - Centers for Disease Control and Prevention
DC - District of Columbia
DUI - Driving Under the Influence
DWI - Driving While Intoxicated
FARS - Fatality Analysis Reporting System
FHWA - Federal Highway Administration
FAST Act - Fixing America’s Surface Transportation Act (Pub. L. 114-94)
GAO - Government Accountability Office
GDL - Graduated Driver Licensing
HOT CARS Act - Helping Overcome Trauma for Children Alone in Rear Seats Act (S. 1666/H.R. 2801)
IID - Ignition Interlock Device
IIHS - Insurance Institute for Highway Safety
LATCH - Lower Anchors and Tethers for Children
MADD - Mothers Against Drunk Driving
MAP-21 - Moving Ahead for Progress in the 21st Century Act (Pub. L. 112-141)
NHTSA - National Highway Traffic Safety Administration
NTSB - National Transportation Safety Board
U.S. DOT - United States Department of Transportation
GLOSSARY OF ACRONYMS
EMBARGOED UNTIL
1/22/1
8

January 2018 Advocates for Highway and Auto Safety 5
Every day on average,
approximately 100 people are killed and 6,500
more are injured on America’s roads.
The Problem
All across the nation people greatly depend on the safety of our transportation system. Whether walking,
biking, driving or riding, Americans are afforded a significant degree of mobility. Yet this comes with an
enormous social cost. In 2016 more than 37,000 people were killed in motor vehicle crashes. Further,
there were nearly 6.3 million police-reported crashes and more than 2.44 million people injured in 2015,
the latest year for which full data is available.
This is a major public health epidemic by any measure.
While federal action and safety requirements can address part of the problem,
state laws have a direct impact on promoting safer behavior by drivers and
occupants. Unfortunately, as demonstrated by this Report, there are still far too
many highway safety laws that are lacking across the nation.
In 2016:
37,461 people were killed in motor vehicle crashes -- a 5.6% increase from the previous year. This follows an
8.4% increase from 2014 to 2015, which was the largest percentage increase in nearly 50 years.
Automobile crashes remain a leading cause of death for Americans age five to 34.
Almost half (48%) of passenger vehicle occupants killed were unrestrained.
A total of 5,286 motorcyclists died, totaling 14% of all crash fatalities.
1,233 children aged 14 and younger were killed in motor vehicle crashes, including 311 children age four
through seven and 228 children age 2 and younger.
Crashes involving young drivers (age 15 - 20) resulted in 4,853 fatalities, accounting for almost 13% of all
crash deaths.
There were 10,585 fatalities in crashes involving a drunk driver.
In crashes involving a distracted driver, 3,450 people were killed.
An additional 407 laws need to be adopted in all states and DC to fully meet Advocates’ recommended optimal safety laws in this report.
URGENT ACTION NEEDED TO IMPROVE HIGHWAY SAFETY
EMBARGOED UNTIL
1/22/1
8

January 2018 Advocates for Highway and Auto Safety 6
In 2016, there were 37,461 people killed in traffic crashes -- up 5.6% from the previous year. This is the
second yearly rise in fatalities in a row, following a multi-year trend of decline. Increases were seen in
nearly every major segment.
The chart below shows the increases in fatalities by category from 2015 to 2016.
SHARP INCREASES IN FATALITIES
Pedestrians Up 9%
Older Driver Involved (Age 65+) Up 8.8%
Occupants Under 16 Up 6.3%
Large Truck Involved Up 5.4%
Motorcyclists Up 5.1%
Unbelted Vehicle Occupants Up 4.6%
Excessive Speed Up 4%
Young Driver (15 - 20) Involved Up 3.2%
Alcohol-Impaired Up 1.7%
Pedalcyclists Up 1.3%
F
A
T
A
L
I
T
I
E
S
EMBARGOED UNTIL
1/22/1
8

January 2018 Advocates for Highway and Auto Safety 7
NEAR TERM AND LONG TERM TRAFFIC SAFETY SOLUTIONS
With more than 37,000 lives lost on our roads
in 2016, the magnitude of this public health
epidemic is clear. While the Roadmap of State
Highway Safety Laws focuses on state laws as
countermeasures to curb this needless death
and injury toll, Advocates takes a
comprehensive approach to ensure the safety
of all road users.
Advocates has always enthusiastically
championed the use of safety technology, and
for good reason. NHTSA estimates that since
1960 more than 600,000 lives have been
saved by motor vehicle safety technologies. In
the long term, autonomous vehicles (AVs)
have the potential to be the catalyst for
meaningful and lasting reductions in fatalities
and injuries. However, in the near term, there
are effective and proven solutions that could
be implemented to save lives now.
In the coming decades as AVs are developed and deployed, near term solutions should be implemented:
Collision Avoidance Technology NHTSA should exercise its authority to require that advanced technologies that have been proven to help avoid or mitigate
crashes be required as standard equipment on all vehicles. These include automatic emergency braking (AEB) and lane
departure warning for cars, trucks and buses. These systems can help prevent crashes from occurring, as well as mitigate
crashes that do occur, potentially lessening the severity. Additionally, when buying a new car, consumers should be able to
purchase optional safety systems separately, rather than as part of an expensive trim package which often includes non-safety
items and luxury upgrades.
Automated Enforcement Automated enforcement can be used as an effective tool against two common crash contributors -- speeding and red light
running. One of the most challenging issues contributing to traffic crashes is speeding, which is driving in excess of the posted
legal limit. In 2016, almost 30% of all fatal crashes involved speeding as a contributing factor according to NHTSA data.
Moreover, the Federal Highway Administration (FHWA) reports that Americans are more likely to be injured in a red light running
related event than any other crash. A study by the Insurance Institute for Highway Safety (IIHS) found that red light cameras
reduced the fatal red light running crash rate by 21% and the rate of all types of fatal crashes at signalized intersections by
14%. Similarly, speed cameras have been shown to reduce both vehicle speed and crashes.
Improving Large Truck Safety Truck crashes continue to occur at an alarmingly high rate. In 2016, 4,317 people were killed in crashes involving large trucks.
This is an increase of 5.4% from the previous year and a staggering 28% increase since 2009. Further, over 100,000 people are
injured in large truck crashes each year. In fatal two-vehicle crashes between a large truck and a passenger vehicle, 97% of the
fatalities are occupants of the passenger vehicle, according to IIHS. Several safety improvements would curb the needless
carnage resulting from large truck crashes. Available safety technologies such as speed limiting devices and AEB could already
be preventing crashes and mitigating severity if they were required on the entire fleet. Further, trucks should be equipped with
underride guards to prevent horrific and violent crashes when a vehicle goes under the rear or side of a truck. Moreover, as
technology continues to improve, other systems such as lane departure warning and advanced driving assistance systems could
help to prevent crashes and mitigate injuries.
Rear Seat Safety The majority of passengers in the rear seat are children and teens, and studies have shown that among different segments of
society, seat belt use by teens is one of the lowest. Congress directed a final rule requiring rear seat belt reminders in all new
motor vehicles by October 2015 as part of MAP-21. NHTSA has failed to initiate the rulemaking, which is woefully overdue.
Adults unintentionally leaving infants and young children in child restraint systems in the rear seats of passenger vehicles
tragically leading to death has been, and continues to be, a well-known safety problem, but one with available technology
solutions. Exposure of young children, particularly in extreme hot and cold weather, leads to hyperthermia and hypothermia that
can result in death or severe injuries. The HOT CARS Act (S. 1666/H.R. 2801) would require the U.S. DOT to issue, within two
years of enactment, a final rule for a reminder system to alert the driver if a child is left unattended in a vehicle.
EMBARGOED UNTIL
1/22/1
8

January 2018 Advocates for Highway and Auto Safety 8
Motor vehicle crashes impose a significant financial burden on society:
Economic costs of $242 billion:
$77.4 billion in lost workplace and household productivity;
$23.4 billion in present and future medical costs;
$76.1 billion in property damage costs; and,
$65.1 billion in other costs.
Comprehensive costs to society of $594 billion:
Loss of life; and
Pain and decreased quality of life.
When loss of life, pain and decreased quality of life are added to economic costs, the toll
is $836 billion each year.
SAFETY LAWS REDUCE CRASH COSTS
Each person living in the U.S.
essentially pays a
$784 annual “crash tax.”
STATE (Millions $) STATE (Millions $)
AL $4,473 MT $898
AK $592 NE $1,295
AZ $4,183 NV $1,978
AR $2,386 NH $1,374
CA $19,998 NJ $12,813
CO $4,173 NM $1,769
CT $4,880 NY $15,246
DE $684 NC $7,909
DC $859 ND $706
FL $10,750 OH $10,125
GA $10,787 OK $2,910
HI $577 OR $1,768
ID $886 PA $5,851
IL $10,885 RI $1,599
IN $6,375 SC $4,045
IA $2,188 SD $720
KS $2,445 TN $5,667
KY $4,363 TX $17,044
LA $5,691 UT $1,725
ME $1,303 VT $538
MD $4,476 VA $4,998
MA $5,835 WA $4,469
MI $9,599 WV $1,482
MN $3,057 WI $4,546
MS $2,718 WY $788
MO $5,560 Total $241,988
Annual Economic Cost of Motor
Vehicle Crashes to States
Source: The Economic and Societal Impact of Motor Vehicle Crashes, 2010, NHTSA (2015). EMBARGOED UNTIL
1/22/1
8

January 2018 Advocates for Highway and Auto Safety 9
In 2017, there were 13 laws passed that meet the criteria for the basic safety laws included in this report.
While there was other legislative activity throughout the states, for purposes of this report only those laws that meet the
optimal law criteria, as defined on pages 12 and 13 are considered.
Note: Laws that do not meet the optimal law criteria, including laws subject only to secondary enforcement, are not included in
the legislative activity summary.
LEGISLATIVE ACTIVITY IN 2017
Arkansas: Enacted open container law
Iowa: Upgraded all-driver text messaging restriction to primary enforcement
Mississippi: Enacted primary enforcement rear seat belt law
Nevada: Enacted ignition interlock device requirement for all-offenders
Oklahoma: Enacted ignition interlock device requirement for all-offenders
Texas: Enacted primary enforcement all-driver text messaging restriction
States are failing to close important safety gaps because they have not adopted the lifesaving safety laws listed below. While a number of highway safety laws have been enacted during the last few years, many laws considered to be fundamental to highway safety are still missing in many states.
Based on Advocates’ safety recommendations, states need to adopt 407 laws: 16 states need an optimal primary enforcement seat belt law for front seat passengers;
31 states need an optimal primary enforcement seat belt law for rear seat passengers;
31 states need an optimal all-rider motorcycle helmet law;
41 states and DC need a rear facing through age 2 law;
35 states and DC need an optimal booster seat law;
192 GDL laws need to be adopted to ensure the safety of novice drivers, no state meets all the criteria
recommended in this report;
32 critical impaired driving laws are needed in 30 states;
7 states need an optimal all-driver text messaging restriction; and,
19 states and DC need a GDL cell phone restriction.
New York: Enacted rear facing through age 2 law
Oregon: Enacted rear facing through age 2 law
Rhode Island: Enacted rear facing through age 2 law
South Carolina: Enacted rear facing through age 2 law
North Dakota: Upgraded booster seat law
Alabama: Upgraded GDL passenger restriction to primary enforcement
Connecticut: Enacted rear facing through age 2 law
EMBARGOED UNTIL
1/22/1
8

January 2018 Advocates for Highway and Auto Safety 10
The Report is Divided into Five Issue Sections:
The 16 state laws that are listed in the five sections are essential to save lives, prevent injuries, and reduce health
care and other costs. These 16 laws do not comprise the entire list of effective public policy interventions states
should take to reduce motor vehicle deaths and injuries. Background information about each law is provided in
the respective sections throughout the report. The statistical data on fatalities are based on 2016 Fatality Analysis
Reporting System (FARS) data, except as otherwise indicated.
At the time of publication, injury data for 2016 was not available.
Good—State is significantly advanced toward adopting all
of Advocates’ recommended optimal laws.
Caution—State needs improvement because of gaps in
Advocates’ recommended optimal laws.
Danger—State falls dangerously behind in adoption of
Advocates’ recommended optimal laws.
KEY THINGS TO KNOW ABOUT THIS REPORT
Occupant Protection: Primary Enforcement Seat Belt Law
Front Seat Occupants
Rear Seat Occupants
All-Rider Motorcycle Helmet Law
Child Passenger Safety: Rear Facing through Age 2 Law Booster Seat Law
Teen Driving (GDL): Minimum Age 16 for Learner’s Permit
6-Month Holding Period Provision
50 Hours of Supervised Driving Provision
Nighttime Driving Restriction Provision
Passenger Restriction Provision
Age 18 for Unrestricted License
Impaired Driving: Ignition Interlock Devices (IIDs) for All Offenders
Child Endangerment Law
Open Container Law
Distracted Driving: All-Driver Text Messaging Restriction
GDL Cell Phone Restriction
States are rated only on whether they have adopted a specific law, not on other aspects or measures of an
effective highway safety program.
A definition of each law as used by Advocates for purposes of this report can be found on pages 12-13.
Each issue section has a state law chart, in alphabetical order, with each state’s rating. The section
ratings result in an overall rating, and overall state ratings on pages 40-51 fall into three groupings:
Note: No state can receive the highest rating (Green) without having primary enforcement seat belt laws for both the front
and rear seats. Additionally, no state that has repealed its all-rider motorcycle helmet law within the previous ten years can
receive a green rating in this report.
EMBARGOED UNTIL
1/22/1
8

January 2018 Advocates for Highway and Auto Safety 11
Child Passenger Safety:
New Law: Rear Facing Through Age 2 Law -- Infants and toddlers should remain in a rear facing child restraint
system in the rear seat from birth through age two. After the child reaches the maximum weight and height
limit for the rear facing safety seat, the child may be placed forward facing in a harness-equipped child
restraint system. The child restraint system should be certified by the manufacturer to meet U.S. DOT safety
standards.
This law is consistent with research and recommendations for the placement of children in age-appropriate
child restraints. According to the American Academy of Pediatrics (AAP), children younger than two years old
are at an elevated risk of head and spine injuries in motor vehicle crashes because their heads are relatively
large and their necks smaller with weak musculature. By supporting the entire torso, neck, head and pelvis, a
rear facing car seat distributes crash forces over the entire body rather than focusing them only at belt contact
points. Further, studies have shown that the direction in which seats are facing plays a significant role in car
seat effectiveness. One such study from the University of Virginia found that children are 75% less likely to
suffer severe or fatal injuries in a crash if they are facing the rear.
Distracted Driving:
Section Change: GDL Cell Phone Restriction -- The GDL cell phone restriction has been moved from the Teen
Driving section to the Distracted Driving section. There have been no changes to the definition.
Teenagers are particularly susceptible to driving while distracted. This age group has the largest proportion of
drivers who were distracted. Crash risk increases dramatically – as much as four times higher – when a driver
is using a mobile phone, with no significant safety difference between hand-held and hands-free phones
observed in many studies. GDL cell phone restrictions are critically needed to better protect novice teen
drivers and those on the roads with them.
IMPORTANT CHANGES TO RATINGS IN THIS REPORT
EMBARGOED UNTIL
1/22/1
8

January 2018 Advocates for Highway and Auto Safety 12
Based on government and private research, crash data and state experience, Advocates has determined the traffic
safety laws listed below are critical to reducing motor vehicle deaths and injuries. For the purposes of this report,
states are only given credit if the state law meets the optimal safety provisions as defined below.
No credit is given for laws that fail to fully meet the criteria in this report. Also, no credit is given for laws that are
subject to secondary enforcement or for GDL laws that permit an exemption based on driver education programs.
Occupant Protection
Primary Enforcement Front Seat Belt Law - Allows law enforcement officers to stop and ticket the driver for a
violation of the seat belt law for front seat occupants. No other violation need occur first. (Ratings are based on
front seat occupants only.) A state that does not have this law, in addition to a primary enforcement rear seat belt
law, cannot receive a green overall rating.
Primary Enforcement Rear Seat Belt Law - Requires that all occupants in the rear seat of a vehicle wear seat belts
and allows law enforcement officers to stop and ticket the driver for a violation of the seat belt law. No other
violation need occur first. (Ratings are based on rear seat occupants only.) A state that does not have this law, in
addition to a primary enforcement front seat belt law, cannot receive a green overall rating.
All-Rider Motorcycle Helmet Law - Requires all motorcycle riders, regardless of age, to use a helmet that meets U.S.
DOT standards or face a violation. A state that has repealed an existing all-rider motorcycle helmet law in the
previous 10 years cannot achieve a green overall rating.
Child Passenger Safety
Rear Facing Through Age 2 Law - Infants and toddlers should remain in a rear facing child restraint system in the
rear seat from birth through age two. After the child reaches the maximum weight and height limit for the rear facing
safety seat, the child may be placed forward facing in a harness-equipped child restraint system. The child restraint
system should be certified by the manufacturer to meet U.S. DOT safety standards.
Booster Seat Law - Requires that children who have outgrown the height and weight limit of a forward facing safety
seat be placed in a booster seat that should be used until the child can properly use the vehicle’s seat belt when the
child reaches 57 inches in height and age eight. The booster seat should be certified by the manufacturer to meet
U.S. DOT safety standards.
Teen Driving
GDL programs allow teen drivers to learn to drive under lower risk conditions, and consist of a learner's stage, then an
intermediate stage, before being granted an unrestricted license. The learner’s stage requires teen drivers to complete
a minimum number of months of adult-supervised driving in order to move to the next phase and drive unsupervised.
The intermediate stage restricts teens from driving in high-risk situations for a specified period of time before receiving
an unrestricted license. Advocates recommends that the three-phase GDL program be no less than one year in duration,
though this is not considered in the ratings. Advocates rates state GDL laws on six key safety components identified in
research and data analysis:
Learner’s Stage: Minimum Age 16 for Learner’s Permit - A beginning teen driver is prohibited from obtaining a
learner’s permit until the age of 16. States have not been given credit if the law allows for a beginning driver to
obtain a learner’s permit before the age of 16.
Learner’s Stage: 6-Month Holding Period Provision - A beginning teen driver must be supervised by an adult licensed
driver at all times during the learner’s stage. If the learner remains citation-free for 6 months, he or she may
progress to the intermediate stage. States have not been given credit if the length of the holding period is less than
6 months, or if there is a reduction in the length of the holding period for drivers who take a driver education course.
DEFINITIONS OF THE 16 LIFESAVING LAWS
EMBARGOED UNTIL
1/22/1
8

January 2018 Advocates for Highway and Auto Safety 13
Teen Driving (cont’d)
Learner’s Stage: 50 Hours of Supervised Driving Provision - A beginning teen driver must receive at least 50 hours of
behind-the-wheel training, 10 of which must be at night, with an adult licensed driver during the learner’s stage.
States have not been given credit if the number of required supervised driving hours is less than 50, does not
require 10 hours of night driving, or if there is a reduction in the required number of hours of supervised driving (to
less than 50 hours) for drivers who take a driver education course.
Intermediate Stage: Nighttime Driving Restriction Provision - Unsupervised driving should be prohibited from at least
10 p.m. to 5 a.m. States have not been given credit if the nighttime driving restriction does not span the entire 10
p.m. to 5 a.m. minimum time range for all days of the week.
Intermediate Stage: Passenger Restriction Provision - This provision limits the number of passengers who may legally
ride with a teen driver without adult supervision. The optimal limit is no more than one non-familial passenger
younger than age 21.
Age 18 for Unrestricted License - A teen driver is prohibited from obtaining an unrestricted license until the age of
18, and either the nighttime or the passenger restrictions, or both, must last until age 18 and meet the definition for
an optimal law. States have not been given credit if teen drivers can obtain an unrestricted license before age 18.
Impaired Driving
Ignition Interlock Devices (IIDs) for All-Offenders - This law mandates the installation of IIDs on the vehicles of all
convicted drunk driving offenders. Without an optimal IID law, a state is deemed red for the impaired driving rating.
Child Endangerment Law - This law either creates a separate offense or enhances an existing penalty for an
impaired driving offender who endangers a minor. No credit is given if this law applies only to drivers who are under
21 years of age.
Open Container Law - This law prohibits open containers of alcohol in the passenger area of a motor vehicle. To
comply with federal requirements, the law must: prohibit both possession of any open alcoholic beverage container
and the consumption of alcohol from an open container; apply to the entire passenger area of any motor vehicle;
apply to all vehicle occupants except for passengers of buses, taxi cabs, limousines or persons in the living quarters
of motor homes; apply to vehicles on the shoulder of public highways; and, require primary enforcement of the law.
State laws are counted in this report only if they are in compliance with the federal law and regulation.
Distracted Driving
All-Driver Text Messaging Restriction - This law prohibits all drivers from sending, receiving, or reading a text
message from any handheld or electronic data communication device, except in an emergency.
GDL Cell Phone Restriction - This restriction prohibits all use of cellular devices (hand-held, hands-free and text
messaging) by beginning teen drivers, except in an emergency. States are only given credit if the provision lasts for
the entire duration of the GDL program (both learner’s and intermediate stages).
EMBARGOED UNTIL
1/22/1
8

January 2018 Advocates for Highway and Auto Safety 14
OCCUPANT PROTECTION
Primary Enforcement Front Seat Belt Law
Primary Enforcement Rear Seat Belt Law
All-Rider Motorcycle Helmet Law
State has all 3 laws, a primary enforcement front
seat belt law, primary enforcement rear seat belt
law and an all-rider motorcycle helmet law.
(5 states and DC)
State has 2 of the 3 laws.
(22 states)
State has 1 or none of the 3 laws.
(23 states)
NC
OH IN
AL TX
FL
GA MS
OK NM AZ
CA
NV UT
CO KS MO
AR
LA
TN
SC
KY VA
WV
IL
IA NE
WY
ID OR
SD WI MN
ND MT
WA
PA
NY
ME
NH
VT
MA CT NJ
DE
MD
RI MI
HI
AK
DC (green)
Note: No credit is given for laws that are subject to secondary enforcement. Please refer to page 12 for law definitions.
See “States at a Glance”, beginning on page 40 to determine which laws states lack. EMBARGOED UNTIL
1/22/1
8

January 2018 Advocates for Highway and Auto Safety 15
23,714 occupants of passenger vehicles were killed in motor vehicle crashes in 2016, an increase of nearly 5%
over 2015. Of the passenger vehicle occupant fatalities for which restraint use was known, 48% were not wearing
seat belts.
States with primary enforcement laws have higher seat belt use rates. Moreover, a study conducted by IIHS found
that when states strengthen their laws from secondary to primary enforcement, driver death rates decline by an
estimated 7%.
Needless deaths and injuries that result from non-use of seat belts cost society approximately $10 billion annually
in medical care, lost productivity and other costs, according to NHTSA.
Lives Saved in 2016 & Lives that Could Have Been Saved by 100% Seat Belt Use, By State, Age 5 and older (NHTSA, 2017) States in red have laws that are subject only to secondary enforcement; NH has no law.
Lives Saved
Could have been saved
Lives Saved
Could have been saved
Lives Saved
Could have been saved
Lives Saved
Could have been saved
AL 381 58 IL 475 52 MT 65 32 RI 16 4
AK 26 6 IN 354 45 NE 83 26 SC 355 39
AZ 261 57 IA 210 21 NV 88 16 SD 27 18
AR 234 96 KS 189 42 NH 29 22 TN 450 81
CA 1,476 74 KY 321 75 NJ 214 22 TX 1,688 222
CO 209 58 LA 301 60 NM 152 20 UT 108 23
CT 102 18 ME 75 17 NY 395 47 VT 32 8
DE 50 7 MD 181 26 NC 665 86 VA 246 94
DC 1 0 MA 115 45 ND 29 12 WA 232 19
FL 1,038 178 MI 518 42 OH 409 113 WV 109 25
GA 623 31 MN 204 20 OK 273 65 WI 277 50
HI 35 3 MS 294 114 OR 302 16 WY 32 13
ID 91 31 MO 301 109 PA 325 96 Total 14,668 2,456
This death toll has significant emotional and economic impacts on American families,
but there are solutions at hand to address this public health epidemic—
effective primary enforcement safety belt laws covering passengers in all seating positions.
PRIMARY ENFORCEMENT SEAT BELT LAWS
Seat belt use, most often achieved by effective safety belt laws, is a proven lifesaver.
In 2016, NHTSA data shows that nationwide seat belt use saved an estimated 14,668
lives of passengers age five and older.
An additional 2,456 lives (age five and older) could have been saved if all
passenger vehicle occupants had worn seat belts.
All states except New Hampshire have a seat belt law.
Only 34 states and DC allow primary enforcement of their front seat belt laws.
Among the states that have primary enforcement seat belt laws,
only 19 and DC cover occupants in all seating positions (front and rear).
Mississippi enacted a primary enforcement rear seat belt law in 2017.
Nearly 15,000 lives were saved by seat belt use and
nearly 2,500 more could have been saved with 100% belt use
EMBARGOED UNTIL
1/22/1
8

January 2018 Advocates for Highway and Auto Safety 16
In fatal crashes in 2016, 81% of passenger vehicle occupants who were fully ejected from the vehicle were
killed, according to NHTSA data. Further, only 1% of the occupants reported to have been using restraints were
fully ejected, compared with nearly 30% of the unrestrained occupants.
From 1975 to 2010, over 360,000 lives could have been saved and 5.8 million injuries could have been
prevented if all occupants had worn seat belts, according to a NHTSA report. Over this same time period, nearly
$1.1 trillion in economic costs have been needlessly incurred due to seat belt non-use.
In 2016, the proportion of unrestrained passenger vehicle occupants killed who were seated in the front seat
was 47%, compared to 57% of unrestrained passenger vehicle occupants killed who were seated in the rear
seat, according to NHTSA.
Rear seat passengers are three times more likely to die in a crash if they are unbelted.
Rear seat belt use was lower than front seat belt use in almost every state and was substantially lower in many
states.
According to IIHS, nearly 40% of people surveyed said they sometimes don’t buckle up in the rear seat because
there is no law requiring it. If there were such a law, 60% of respondents said it would convince them to do so.
The majority of passengers in the rear seats of vehicles are teens and children, and studies have shown that
seat belt use by teens is among the lowest of any segment of society.
If every state with a secondary seat belt law upgraded to primary enforcement, about 1,000 lives and $4 billion
in crash costs could be saved every year, according to NHTSA.
NHTSA reports that the average in-patient costs for crash victims who don’t use seat belts are 55% higher than
for those who do use them.
Seat belt use rates increase from 10 to 15 percentage points when primary laws are passed, as experienced in
a number of states.
Opponents often assert that highway safety laws violate personal choice and individual rights, overlooking the
impact on society. In response, the U.S. District Court of Massachusetts stated in a decision, affirmed by the
U.S. Supreme Court, that “from the moment of injury, society picks the person up off the highway; delivers him
to a municipal hospital and municipal doctors; provides him with unemployment compensation if, after
recovery, he cannot replace his lost job; and, if the injury causes disability, may assume the responsibility for
his and his family’s continued subsistence.”
According to a NHTSA study of the relationship between primary enforcement belt laws and minority ticketing,
the share of citations for Hispanics and African Americans changed very little after states adopted primary
enforcement belt laws. In fact, there were significant gains in seat belt use among all ethnic groups, none of
which were proportionately greater in any minority group.
Lap-shoulder belts, when used, reduce
the risk of fatal injury to front seat car
occupants by 45% and the risk of
moderate-to-critical injuries by 50%.
For light truck occupants, seat belts
reduce the risk of fatal injury by 60%
and moderate-to-critical injury by 65%.
PRIMARY ENFORCEMENT SEAT BELT LAWS
EMBARGOED UNTIL
1/22/1
8

January 2018 Advocates for Highway and Auto Safety 17
In 2016, where helmet use was known, 41% of all motorcyclists killed were not wearing a helmet. However, more
than half (58%) of the fatally injured motorcycle riders were not wearing a helmet in states without all-rider helmet
laws, compared to only 8% of fatally injured riders in states with an all-rider helmet law.
NHTSA estimates that helmets saved the lives of 1,859 motorcyclists in 2016 and that 802 more lives in all states
could have been saved if all motorcyclists had worn helmets.
When crashes occur, motorcyclists need adequate head protection to prevent one of the leading causes of crash
death and disability in America - head injuries. Studies have determined that helmets reduce head injuries without
increased occurrence of spinal injuries in motorcycle crashes. NHTSA data shows that helmets reduce the chance of
fatal injury by 37% for motorcycle operators and 41% for passengers.
80% of Americans favor state laws requiring all motorcyclists to wear helmets.
According to a 2012 GAO report, “laws requiring all motorcyclists to wear helmets are the only strategy
proved to be effective in reducing motorcyclist fatalities.”
ALL-RIDER MOTORCYCLE HELMET LAWS All-rider helmet laws increase motorcycle helmet use, decrease deaths and injuries,
and save taxpayer dollars.
According to NHTSA, motorcycles are the most
hazardous form of motor vehicle transportation.
5,286 motorcyclists were killed in 2016, an
increase of more than 5% from the previous year.
Additionally, 88,000 motorcyclists were injured in
2015, the latest year for which data is available.
The number of motorcycle crash fatalities has
more than doubled since a low of 2,116 in 1997.
Today, only 19 states and DC require all motorcycle riders to use a helmet. Twenty-eight states have laws that cover only some riders (i.e., up to age 18 or 21). These age-specific laws are
nearly impossible for police officers to enforce and result in much lower rates of helmet use.
Three states (IL, IA and NH) have no motorcycle helmet use law.
In 2017, there were attempts in 10 states to repeal existing all-rider helmet laws, all of which were unsuccessful.
EMBARGOED UNTIL
1/22/1
8

January 2018 Advocates for Highway and Auto Safety 18
According to NHTSA, in 2016, there were 12
times as many unhelmeted fatalities (1,923)
in states without a universal helmet law
compared to the number of fatalities (166) in
states with a universal helmet law. These
states were nearly equivalent with respect to
total resident populations.
In 2010, the economic cost of motorcycle
crashes was $12.9 billion and the total
amount of societal harm was $66 billion,
according to NHTSA. Additionally, helmets
save $2.7 billion in economic costs and
prevent $17 billion in societal harm annually.
Per vehicle mile traveled, motorcyclist
fatalities occurred almost 27 times more frequently than passenger car occupant fatalities in 2014.
Motorcyclists represented 14% of the total traffic fatalities, yet accounted for only 3% of all registered vehicles in
the United States in 2014, the latest year for which data is available.
The economic benefits of motorcycle helmet use are substantial, more than 3 and one-half times greater in states
with all-rider helmet laws. In states that have an all-rider helmet law, cost savings to society from helmet use was
$725 per registered motorcycle, compared to savings from helmet use of just $198 per registered motorcycle in
states without a mandatory helmet use law, according to the CDC. States without an all-rider motorcycle helmet
law realize some savings from voluntary helmet use and from partial laws that cover certain but not all riders.
According to the American Academy of Pediatrics, in states with only youth-specific helmet laws, helmet use has
decreased and youth mortality has increased. Serious traumatic brain injury among young riders was 38% higher
in states with only age-specific laws compared to states with all-rider helmet laws.
There is no scientific evidence that motorcycle rider training reduces crash risk and is an adequate substitute for
an all-rider helmet law. In fact, motorcycle fatalities continued to increase even after a motorcycle education and
training grant program included in federal legislation took effect in 2006.
ALL-RIDER MOTORCYCLE HELMET LAWS Motorcycle helmets reduce the risk of head injury by 69% and reduce the risk of death by 42%.
A study in the American Journal of
Surgery reported that after
Michigan repealed its all-rider
helmet law in 2012, the
percentage of non-helmeted
crash scene fatalities quadrupled.
Further, after the repeal, trauma
patients who were hospitalized
with a head injury rose 14%.
AK 1 ID 5 MN 14 RI 1
States Without
All-Rider
Motorcycle
Helmet Laws &
Lives that Could
Have Been Saved in
2016 by 100%
Helmet Use
(NHTSA, 2017)
AZ 34 IL 44 MT 4 SC 50
AR 22 IN 29 NH 3 SD 6
CO 31 IA 18 NM 8 TX 102
CT 14 KS 11 ND 4 UT 8
DE 2 KY 28 OH 55 WI 25
FL 109 ME 4 OK 24 WY 6
HI 6 MI 31 PA 38 Total 737
737 Lives that Could Have Been Saved by Helmet Use
EMBARGOED UNTIL
1/22/1
8

January 2018 Advocates for Highway and Auto Safety 19
STATUS OF STATE LAWS
16 states do not have primary enforcement
seat belt laws for passengers, regardless of
seating position.
No state adopted an all-rider
motorcycle helmet law in 2017.
There were unsuccessful attempts to
repeal all-rider motorcycle helmet laws in
10 states.
10 states have none of the three optimal
laws. (AZ, CO, ID, MT, NH, ND, OH, PA, SD
and WY).
13 states have only one of the three laws.
(AR, CT, FL, IA, KS, MA, MI, MO, NE, NV, OK,
VT and VA).
5 states and DC have all three laws (CA, LA,
MS, OR and WA).
In 2017, Utah made its optimal seat belt
law permanent, which was scheduled to
sunset.
OCCUPANT PROTECTION LAWS RATING CHART Primary Enforcement Front Seat Belt Law Primary Enforcement Rear Seat Belt Law All-Rider Motorcycle Helmet Law Number of new occupant protection laws since January 2017: One primary enforcement rear
seat belt law (MS).
= Optimal law = Good (3 optimal laws)
= Caution (2 optimal laws)
= Danger (1 or 0 optimal laws) (No credit is given for laws that are subject to secondary
enforcement)
Prim
ary E
nfo
rce
me
nt
Fro
nt S
ea
t Be
lt La
w
Prim
ary E
nfo
rce
me
nt
Re
ar S
ea
t Be
lt La
w
All-R
ide
r Mo
torc
ycle
He
lme
t La
w
Ra
ting
Prim
ary E
nfo
rce
me
nt
Fro
nt S
ea
t Be
lt La
w
Prim
ary E
nfo
rce
me
nt
Re
ar S
ea
t Be
lt La
w
All-R
ide
r Mo
torc
ycle
He
lme
t La
w
Ra
ting
AL MT
AK NE
AZ NV
AR NH
CA NJ
CO NM
CT NY
DE NC
DC ND
FL OH
GA OK
HI OR
ID PA
IL RI
IN SC
IA SD
KS TN
KY TX
LA UT
ME VT
MD VA
MA WA
MI WV
MN WI
MS WY
MO Total 34+
DC
19+
DC
19+
DC EMBARGOED U
NTIL 1/2
2/18

January 2018 Advocates for Highway and Auto Safety 20
CHILD PASSENGER SAFETY
Rear Facing Through Age 2 Law
Booster Seat Law
NC
OH IN
AL TX
FL
GA MS
OK NM AZ
CA
NV UT
CO KS MO
AR
LA
TN
SC
KY VA
WV
IL
IA
NE
WY
ID OR
SD WI MN
ND MT
WA
PA
NY
ME
NH
VT
MA CT NJ
DE
MD
RI MI
HI
AK
DC (red)
Note: No credit is given for laws that are subject to secondary enforcement. Please refer to page 12 for law definition.
See “States at a Glance”, beginning on page 40 to determine which laws the states lack.
State has both optimal child passenger safety laws.
(5 states)
State has neither of the laws.
(31 states and DC)
State has 1 of the 2 laws.
(14 states)
EMBARGOED UNTIL
1/22/1
8

January 2018 Advocates for Highway and Auto Safety 21
The best way to protect children from risks posed by the force of airbags is to place them in the back seat,
restrained by a child safety seat, booster seat or safety belt, as appropriate. An average of three children under age 14 were killed every day in motor vehicle crashes in the U.S. in 2016 --
amounting to a total of 1,233 fatalities. Further, there were 178,000 children under age 14 injured in crashes in
2015, the latest year for which data is available.
When children are properly restrained in a child safety seat, booster seat or safety belt, as appropriate for their age
and size, their chance of being killed or seriously injured in a car crash is greatly reduced. According to NHTSA,
when used properly, child safety seats reduce fatal injury by 71% for infants and 54% for toddlers in passenger
cars. More than 325 lives were saved in 2016 by restraining children four and younger in passenger vehicles.
Advocates recommends a three component child passenger safety law that includes the following laws to adequately protect younger children:
Rear Facing Through Age 2 Infants and toddlers should remain in a rear facing child
restraint system in the rear seat from birth through age two.
After the child reaches the maximum weight and height
limit for the rear facing safety seat, the child may be placed
forward facing in a harness-equipped child restraint system.
The child restraint system should be certified by the
manufacturer to meet U.S. DOT safety standards.
To date, only 9 states (CA, CT, NJ, NY, OK, OR, PA, RI and
SC) have enacted a rear facing through age 2 law.
Forward Facing Harness and Tether Seat After the child reaches the maximum weight and height
limit for their rear facing safety seat and is age two or older,
the child may be turned forward facing in a harness-
equipped child restraint. Children should remain in a
harness-equipped restraint, certified by the manufacturer
to meet U.S. DOT safety standards, until they meet the
height and weight limit of the child restraint.
To date, only NJ has enacted this law.
Note: This law is not rated in this Report.
Booster Seat Requires that children who have outgrown the height and weight
limit of a forward-facing safety seat be placed in a booster seat
that should be used until the child can properly use the vehicle’s
seat belt when the child reaches 57 inches in height and age
eight. The booster seat should be certified by the manufacturer
to meet U.S. DOT safety standards.
To date, only 15 states have enacted an optimal booster
seat law.
CHILD PASSENGER SAFETY LAWS Motor vehicle crashes are a leading cause of death for American children age five to 14.
EMBARGOED UNTIL
1/22/1
8

January 2018 Advocates for Highway and Auto Safety 22
Across all age groups, injury risk is lowest (less than 2%) when children are placed in an
age-appropriate restraint in the rear seat.
According to IIHS, expanded child restraint laws covering children through age seven were associated with: 5% reduction in the rate of children with injuries of any severity;
17% reduction in the rate of children with fatal and incapacitating injuries;
Children being three times as likely to be in appropriate restraints; and
6% increase in the number of booster-seat aged children seated in the
rear of the vehicle where children are better protected.
CHILD PASSENGER SAFETY LAWS
According to the American Academy of Pediatrics (AAP), children younger than two years
old are at an elevated risk of head and spine injuries in motor vehicle crashes because
their heads are relatively large and their necks smaller with weak musculature. By
supporting the entire torso, neck, head and pelvis, a rear facing car seat distributes
crash forces over the entire body rather than focusing them only at belt contact points.
When a child is placed in a rear facing car seat through age two or older, they are
provided with optimal support for their head and neck in the event of a crash.
After a child reaches age two, and the maximum height and weight limit for their rear
facing safety seat, the child may be turned forward facing in a harness-equipped child
restraint. Use of the top tether and LATCH system, when available, is preferred.
Children should remain in a forward facing harness and tether seat until they meet the
height and weight limit of the restraint.
Note: This law is not rated in this Report.
Booster seats are intended to provide a platform that lifts the child up off the vehicle
seat in order to improve the fit of the child in a three-point adult safety belt. The seat
should also position the lap belt portion of the adult safety belt across the child's hips
or pelvic area. An improper fit of an adult safety belt can cause the lap belt to ride up
over the stomach and the shoulder belt to cut across the neck, potentially exposing
the child to serious abdominal and neck injury.
Using a booster seat with a seat belt instead of a seat belt alone reduces a child's risk
of injury in a crash by 59%, according to Partners for Child Passenger Safety, a
project of Children’s Hospital of Philadelphia and State Farm Insurance.
84% Of Americans support all states
having booster seat laws protecting
children age four through seven EMBARGOED U
NTIL 1/2
2/18

January 2018 Advocates for Highway and Auto Safety 23
CHILD PASSENGER SAFETY LAWS RATING CHART Number of new child passenger safety laws since January 2017: Five rear facing through age 2
laws (CT, NY, OR, RI, SC); One optimal booster seat law (ND).
STATUS OF STATE LAWS
9 states have an optimal law requiring rear
facing through age 2.
15 states have an optimal booster seat law.
Re
ar F
acin
g T
hro
ugh
Age
2 L
aw
Bo
oste
r Se
at L
aw
Ra
ting
Re
ar F
acin
g T
hro
ugh
Age
2 L
aw
Bo
oste
r Se
at L
aw
Ra
ting
AL MT
AK NE
AZ NV
AR NH
CA NJ
CO NM
CT NY
DE NC
DC ND
FL OH
GA OK
HI OR
ID PA
IL RI
IN SC
IA SD
KS TN
KY TX
LA UT
ME VT
MD VA
MA WA
MI WV
MN WI
MS WY
MO Total 9 15
= Optimal law = Good (both laws) = Caution (one of the two laws)
= Danger (neither law) (No credit is given for laws that are subject to secondary
enforcement)
EMBARGOED UNTIL
1/22/1
8

January 2018 Advocates for Highway and Auto Safety 24
TEEN DRIVING: GRADUATED DRIVER LICENSING (GDL) PROGRAMS
Minimum Age 16 for Learner’s Permit
6-Month Holding Period Provision
50 Hours of Supervised Driving Provision
Nighttime Driving Restriction Provision
Passenger Restriction Provision
Age 18 for Unrestricted License
State has at least 5 of 6 optimal GDL provisions.
(2 states)
State has 2 to 4 of the 6 optimal GDL provisions.
(33 states and DC)
State has less than 2 of the 6 optimal GDL
provisions.
(15 states)
NC
OH IN
AL TX
FL
GA MS
OK NM AZ
CA
NV UT
CO KS MO
AR
LA
TN
SC
KY VA
WV
IL
IA NE
WY
ID OR
SD WI MN
ND MT
WA
PA
NY
ME
NH
VT
MA CT NJ
DE
MD
RI MI
HI
AK
DC (yellow)
Note: No credit is given for laws that are subject to secondary enforcement. Please refer to pages 12-13 for law
definitions. See “States at a Glance”, beginning on page 40 to determine which laws states lack. EMBARGOED UNTIL
1/22/1
8

January 2018 Advocates for Highway and Auto Safety 25
GDL programs, which introduce teens to the driving experience gradually by phasing in full driving privileges over
time and in lower risk settings, have been effective in reducing teen crash deaths. In this report, each of the six
optimal GDL provisions is counted separately in rating the state.
The map below shows the number of fatalities caused by motor vehicle crashes involving drivers age 15 to 20 over
the past decade (2007 to 2016).
DC
HI
171
493
86
330
NC
OH
IN
AL
TX
FL
GA
MS
OK
NM AZ
CA
NV
UT
CO
KS
MO
AR
LA
TN
SC
KY
VA
WV
IL
IA
NE
WY
ID
OR
SD WI
MN
ND
MT
WA
PA
NY
ME
NH
MA
CT
NJ
DE
MD
RI MI
VT
AK
757
496
4500
114
362
410
1163
310
438
183
735
520
214
193
431
681
1084
5265
644
1564
1450
814
1163
957
619
1271
1077
1505
1064 1499
3888
1908
1300
2066
1115 436
1753
2021
1514
87
213
790
682
172 18
1617
146
TEEN DRIVING LAWS Motor vehicle crashes are the number one killer of American teenagers.
No state has all of the optimal GDL provisions recommended in this report.
Teen drivers are far more likely than other drivers to be
involved in fatal crashes because they lack driving
experience and tend to take greater risks.
According to NHTSA, 4,853 people were killed in crashes
involving young drivers (age 15 - 20) in 2016.
1,908 were young drivers;
1,018 were passengers of young drivers; and,
1,927 victims were pedestrians, pedalcyclists, and the
occupants of the other vehicles involved in crashes with
young drivers.
$40.8 billion
Estimated annual economic cost of police-reported
crashes involving young drivers
EMBARGOED UNTIL
1/22/1
8

January 2018 Advocates for Highway and Auto Safety 26
The fatal crash rate per mile driven is nearly twice as high for 16- to 17-year-olds as it is for 18- to 19-year-olds.
Teenage motor vehicle crash deaths in 2013 occurred most frequently during the periods of 3 p.m. to 6 p.m.,
6 p.m. to 9 p.m., and 9 p.m. to midnight (17% each). The midnight to 3 a.m. is a close fourth accounting for
15% of teenage motor vehicle crash deaths. States with nighttime driving restrictions show crash reductions of
up to 60% during restricted hours.
Fatal crash rates are 21% lower for 15- to 17-year-old drivers when prohibited from having any teenage
passengers in their vehicles, compared to when two or more passengers were permitted.
For 16- and 17-year-old drivers, research has identified a 15% reduction in fatal crash rates was associated
with a limit of no more than one teen passenger for 6-months or longer, when compared to no limit on the
number of passengers.
Delaying the minimum age for obtaining a learner’s permit was associated with lower fatal crash rates for
15- to 17-year-olds combined; a 1-year delay (e.g., from age 15 to 16) reduced the fatal crash rate by 13%.
Research has found that a minimum holding period of at least five months reduces fatal crash rates. Extending
the holding period to 9 months to a year results in a 21% reduction in fatal crash rates.
A 2010 survey conducted by IIHS shows that parents favor GDL laws that are as strict or even stricter than
currently exist in any state. More than half think the minimum licensing age should be 17 or older.
Almost three-quarters (74%) of teens approve of a single, comprehensive law that incorporates the key
elements of GDL programs, according to a 2010 survey by the Allstate Foundation.
TEEN DRIVING LAWS
In states that have adopted GDL
systems, studies have found overall
crash reductions among teen drivers of
about 10 to 30%.
Older Novice Drivers: Studies have shown that GDL programs have
contributed to a decline in teen driver crashes over the past decade (2005
to 2014). However, older teen novice drivers are missing out on, yet still
very much need, the safety benefits of GDL programs. These older teen
drivers actually experience more crashes and near misses, though they are
overconfident and perceive themselves as safer, according to a 2017 study
by Liberty Mutual Insurance and SADD.
A recent study reported that the improvements are not as strong for 18- to
20-year-olds who have aged out of GDL. Research from Children’s Hospital
of Philadelphia Center for Injury Research and Prevention (CIRP) and AAA
shows that, “about one-third of all drivers are not licensed by age 18, and by
age 21, about 20% of all young adults still are not licensed.”
GDL programs that extend beyond the mid-teen years cover a broader
population and may experience additional safety benefits. EMBARGOED UNTIL
1/22/1
8

January 2018 Advocates for Highway and Auto Safety 27
Min
imu
m A
ge
16
for L
ea
rne
r’s P
erm
it
6-M
on
th H
old
ing P
erio
d P
rovis
ion
50
Ho
urs
of S
up
erv
ise
d D
rivin
g P
rovis
ion
Nig
httim
e D
rivin
g R
estric
tion
Pro
vis
ion
Pa
sse
nge
r Re
stric
tion
Pro
visio
n
Age
18
Un
restric
ted
Lic
en
se
Ra
ting
Min
imu
m A
ge
16
for L
ea
rne
r’s P
erm
it
6-M
on
th H
old
ing P
erio
d P
rovis
ion
50
Ho
urs
of S
up
erv
ise
d D
rivin
g P
rovis
ion
Nig
httim
e D
rivin
g R
estric
tion
Pro
vis
ion
Pa
sse
nge
r Re
stric
tion
Pro
visio
n
Age
18
Un
restric
ted
Lic
en
se
Ra
ting
AL MT
AK NE
AZ NV
AR NH
CA NJ
CO NM
CT NY
DE NC
DC ND
FL OH
GA OK
HI OR
ID PA
IL RI
IN SC
IA SD
KS TN
KY TX
LA UT
ME VT
MD VA
MA WA
MI WV
MN WI
MS WY
MO Total 8+
DC
46+
DC 26 11
18+
DC 2
TEEN DRIVING LAWS RATING CHART
Number of new teen driving laws since January 2017: One passenger restriction provision (AL).
= Optimal law = Good (At least 5 optimal provisions) = Caution (Between 2 and 4 optimal provisions) = Danger (Less than 2 optimal provisions)
(No credit is given for laws that are subject to secondary enforcement for any GDL provision that is exempted based on driver
education) EMBARGOED U
NTIL 1/2
2/18

January 2018 Advocates for Highway and Auto Safety 28
IMPAIRED DRIVING
Ignition Interlock Devices for All Offenders
Child Endangerment Law
Open Container Law
NC
OH IN
AL TX
FL
GA MS
OK NM AZ
CA
NV UT
CO KS MO
AR
LA
TN
SC
KY VA
WV
IL
IA
NE
WY
ID OR
SD WI MN
ND MT
WA
PA
NY
ME
NH
VT
MA CT NJ
DE
MD
RI MI
HI
AK
State has all 3 optimal impaired driving laws.
(20 states and DC)
State has optimal IID law in addition to one of either
child endangerment or open container laws.
(10 states)
State has 1 or 0 optimal impaired driving laws. Further,
any state without an optimal IID law is red, regardless
of the number of other laws.
(20 states)
DC (green)
Note: No credit is given for laws that are subject to secondary enforcement. Please refer to page 13 for law definitions.
See “States at a Glance”, beginning on page 40, to determine which laws states lack. EMBARGOED UNTIL
1/22/1
8

January 2018 Advocates for Highway and Auto Safety 29
According to NHTSA data from 2010, alcohol-involved crashes (where the highest BAC was over .08%) resulted in
$44 billion in economic costs and $201 billion in comprehensive costs to society. Clearly, more still needs to be
done to reduce the number of impaired drivers on our roads. A common misconception is that most people who are
convicted of their first drunk driving offense are social drinkers who made one mistake. However, data has shown
that the average first offender will have driven drunk 87 times before getting arrested for the first time.
According to the CDC, adult drivers drank too much and got behind the wheel approximately 121 million times in
2012, which equates to more than 300,000 incidents of drinking and driving each day. NHTSA reports that drivers
with a BAC of .08% or higher involved in fatal crashes were seven times more likely to have a prior conviction for
driving while intoxicated (DWI) than were drivers with no alcohol.
Impaired driving laws target a range of behavioral issues associated with alcohol consumption and
operation of a motor vehicle on public roads. Federal leadership in critical areas such as impaired driving
has resulted in the rapid adoption of lifesaving laws in states across the country. As a result of federal
laws enacted with strong sanctions, all 50 states and DC have adopted .08% BAC laws, a national
minimum drinking age of 21, and zero tolerance BAC laws for youth.
As states continue to legalize marijuana in some form, the issue of marijuana impaired driving raises
concerns. To address drivers’ use of marijuana and other drugs, at least 22 states have passed drugged
driving Per Se laws. While there is evidence that marijuana use impairs psychomotor and cognitive functions,
its role in contributing to the occurrence of crashes remains unclear. A recent study by IIHS which reviewed
data from Colorado, Oregon and Washington found that legalizing recreational marijuana use resulted in a 3%
higher collision claim frequency than would have been expected without legalization. Still, definitive research
linking impairment to specific blood levels of tetrahydrocannabinol (THC), the pharmacologically active
ingredient in marijuana, remains inconclusive.
IMPAIRED DRIVING LAWS
Impaired driving remains a substantial and
serious safety threat, accounting for nearly
a third of all traffic deaths in the U.S.
More than 10,000 people died in crashes
involving drunk drivers in 2016.
An average of one alcohol-impaired driving fatality
occurred every 50 minutes in 2016.
This means that each day in America, 28 people
are killed in drunk driving crashes on average.
EMBARGOED UNTIL
1/22/1
8

January 2018 Advocates for Highway and Auto Safety 30
A breath alcohol ignition interlock device (IID) is a mechanism similar to a breathalyzer which is linked to
a vehicle’s ignition system. Its purpose is to deter an individual who has a drunk driving conviction from
driving the vehicle with a BAC that exceeds a specified level set by the state IID law.
Before the vehicle can be started, the driver must breathe into the device, and if the result is over the specified
legal BAC limit, commonly .02% or .04%, the vehicle will not start. In addition, at random times after the engine has
been started, the IID will require another breath sample. This prevents cheating where another person breathes
into the device to bypass the system in order to enable an intoxicated person to get behind the wheel and drive. If
a breath sample is not provided, or the sample exceeds the IID's preset BAC, the device will log the event, warn the
driver and then set off an alarm (e.g., lights flashing, horn honking, etc.) until the ignition is turned off.
Nearly eight in ten Americans support requiring ignition interlocks for all convicted driving under the influence
(DUI) offenders, even if it is their first conviction, according to AAA.
According to Mothers Against Drunk Driving (MADD), nationally, current IID laws have stopped more than 1.77
million attempts to drive drunk.
A recent study from the University of Pennsylvania found that IIDs have reduced alcohol-involved crash deaths
by 15%, and notes that the findings likely underestimate the effect of all-offender IID laws. The study also
found that states with mandatory IID laws saw a decrease in deaths comparable to the estimated number of
lives saved by frontal airbags.
According to the CDC, when IIDs are installed, they are associated with a reduction in arrest rates for impaired
driving of approximately 70%.
NHTSA research shows that IIDs reduce recidivism among both first-time and repeat DWI offenders, with
reductions in subsequent DWI arrests ranging from 50% to 90% while the interlock is installed on the vehicle.
IGNITION INTERLOCK DEVICES FOR ALL OFFENDERS
82% Of offenders
themselves who believe the IID was
effective in preventing them
from driving after drinking.
Currently, IIDs are mandatory for all offenders, including first time offenders,
in 30 states and DC. Nevada and Oklahoma passed all-offender IID laws in 2017.
Credit is given only if a state’s IID law applies to all offenders. These state laws offer the most effective means for
denying drunk drivers the opportunity to get behind the wheel after having been convicted of a drunk driving
offense. As such, if a state does not have an optimal IID law, it receives a red rating for impaired driving. EMBARGOED UNTIL
1/22/1
8

January 2018 Advocates for Highway and Auto Safety 31
In 2016, 214 children age 14 and younger were killed in crashes involving an alcohol-impaired driver. It is estimated
that 46 million to 102 million drunk driving trips are made each year with children under the age of 15 in the vehicle,
according to a national telephone survey sponsored by NHTSA in 1999.
Child endangerment laws either create a separate offense or enhance existing DWI and DUI penalties for people who
drive under the influence of alcohol or drugs with a minor child in the vehicle. Drivers who engage in this conduct
create a hazardous situation for themselves and for others on the road. They also put a child, who rarely has a choice
as to who is driving, at risk of serious danger. Further, impaired drivers are less likely to ensure a child is properly
restrained. Data has shown that in fatal crashes, impaired drivers restrained children only 18% of the time.
Child endangerment laws are enacted to encourage people to consider the consequences for younger passengers
before they drive while impaired with a child in their vehicle. When properly defined and enforced, child endangerment
laws act as a strong deterrent to protect children.
Studies have shown that open container laws are effective at deterring excessive drinking by drivers getting behind
the wheel. States have also shown a significant decrease in hit-and-run crashes after adopting open container laws.
Federal legislation enacted in 1998 established a program to encourage states to adopt laws that ban the presence
of open containers of any kind of alcoholic beverage in the entire passenger area of motor vehicles. To comply with
the provisions in the law, a state open container law must:
Prohibit both possession of any open alcoholic beverage container and consumption of any alcoholic beverage in
a motor vehicle;
Cover the entire passenger area of any motor vehicle, including unlocked glove compartments and accessible
storage areas;
Apply to all alcoholic beverages including beer, wine, and spirits;
Apply to all vehicle occupants except for passengers of buses, taxi cabs, limousines or persons in the living
quarters of motor homes;
Apply to vehicles on the shoulder of public highways; and,
Require primary enforcement of the law.
In an effort to encourage states to comply with the federal law, states that are non-compliant have 2.5% of certain
federal highway construction funds diverted to highway safety programs that fund alcohol-impaired driving counter-
measures and law enforcement activities. This federal requirement is known as “redirection,” and provides that states
do not lose any funding, but some federal funds are diverted to other designated safety programs. Redirection has
been largely ineffective as an incentive for encouraging lagging states to enact strong open container laws.
CHILD ENDANGERMENT LAWS
Currently, 47 states and DC have enacted child endangerment laws
that create a separate offense or increase penalties for people who drive while impaired
with children in their vehicle.
OPEN CONTAINER LAWS
Currently, 41 states and DC have open container laws that meet federal requirements. Arkansas enacted a law to ban open containers of alcohol in 2017. EMBARGOED U
NTIL 1/2
2/18

January 2018 Advocates for Highway and Auto Safety 32
IMPAIRED DRIVING LAWS RATING CHART
Number of new impaired driving laws since January 2017: Two all-offender ignition interlock
laws (NV, OK); No child endangerment law; and, One open container law (AR).
= Optimal law = Good (3 optimal laws) = Caution (2 optimal laws)
= Danger (1 or 0 optimal laws; no IID)
(No credit is given for laws that are subject to secondary
enforcement)
All-O
ffen
de
r Ign
ition
Inte
rlock
s
Ch
ild E
nd
an
ge
rme
nt L
aw
Op
en
Co
nta
ine
r La
w
Ra
ting
All-O
ffen
de
r Ign
ition
Inte
rlock
s
Ch
ild E
nd
an
ge
rme
nt L
aw
Op
en
Co
nta
ine
r La
w
Ra
ting
AL MT
AK NE
AZ NV
AR NH
CA NJ
CO NM
CT NY
DE NC
DC ND
FL OH
GA OK
HI OR
ID PA
IL RI
IN SC
IA SD
KS TN
KY TX
LA UT
ME VT
MD VA
MA WA
MI WV
MN WI
MS WY
MO Total 30+
DC 47+
DC 41+
DC
STATUS OF STATE LAWS
30 states are missing one or more critical
impaired driving law.
30 states and DC have optimal IID laws; 20
states do not.
Safety Success in Utah
In 2017, Utah became the first state in the nation to
pass a law lowering the legal limit of alcohol-impaired
driving to .05% BAC. While this is not a law rated in
the Roadmap Report, Advocates commends Utah for
this significant safety victory. Lowering the legal BAC
limit is backed by scientific research, data and
outcomes from over 100 countries that have already
adopted this law and reduced impaired driving. EMBARGOED UNTIL
1/22/1
8

January 2018 Advocates for Highway and Auto Safety 33
DISTRACTED DRIVING
All-Driver Text Messaging Restriction
GDL Cell Phone Restriction
NC
OH IN
AL TX
FL
GA MS
OK NM AZ
CA
NV UT
CO KS MO
AR
LA
TN
SC
KY VA
WV
IL
IA NE
WY
ID OR
SD WI MN
ND MT
WA
PA
NY
ME
NH MA CT NJ
DE
MD
RI MI
VT
HI
AK
DC (yellow)
Note: No credit is given for laws that are subject to secondary enforcement. Please refer to page 13 for law definition.
See “States at a Glance”, beginning on page 40 to determine which laws states lack.
State has both distracted driving laws.
(30 states)
State has neither of the laws.
(6 states)
State has 1 of the 2 laws.
(14 states and DC)
EMBARGOED UNTIL
1/22/1
8

January 2018 Advocates for Highway and Auto Safety 34
According to NHTSA, in 2016 there were 3,450 people killed in crashes involving a distracted driver. There were
391,000 people injured in crashes involving a distracted driver in 2015, the latest year for which injury data is
available. Additionally, crashes in which at least one driver was identified as being distracted imposed an economic
cost of $40 billion in 2010. However, issues with underreporting crashes involving cell phones remain because of
gaps in police crash report coding, database limitations, and other challenges. It is clear from an increasing body of
research, studies and data that the use of electronic devices for telecommunications (such as mobile phones and
text messaging), telematics and entertainment can easily distract drivers from the driving task.
Crash risk increases dramatically – as much as four times higher – when a driver is using a mobile phone, with
no significant safety difference between hand-held and hands-free phones observed in many studies.
According to NHTSA data, almost 10% of fatal crashes in 2016 were reported as distraction-affected crashes;
however, as noted above, there are problems with underreporting due to police crash report coding and other
challenges.
The AAA Foundation reported in 2013 that more than one in three drivers admitted to reading an email or text
message while driving and one in four drivers admitted to typing or sending an email or text message.
In 2016, The Wireless Association reported that more than 2 trillion text and multimedia messages were sent
or received in the U.S.
According to a survey by Nationwide Insurance, four out of ten respondents claimed to have been hit or nearly
hit as a result of a distracted driver.
According to NHTSA, the percentage of drivers visibly manipulating hand-held devices while driving increased
by 250% between 2009 and 2016.
Ten percent of all drivers 15 to 19 years old involved in a fatal crash were reported as distracted at the time of
the crash, according to NHTSA. This age group has the largest proportion of drivers who were distracted.
More than 80% of teens said they use their smartphones while driving, according to a report by State Farm.
Nearly half (42%) of high school students who drove in the past 30 days reported sending a text or email while
driving, according to a 2015 survey.
DISTRACTED DRIVING LAWS
Research has shown that because of cognitive
distraction, the behavior of drivers using
mobile phones (whether hand-held or hands-
free) is equivalent to the behavior of drivers at
the threshold of the legal limit for alcohol.
Sending or receiving a text message causes the driver’s
eyes to be off the road for an average of 4.6 seconds.
When driving 55 miles per hour, this is the equivalent of
driving blind the entire length of a football field.
Currently, 43 states and DC ban text messaging for all drivers. Iowa and Texas enacted all-driver text messaging restrictions in 2017.
Given the broadening range of electronic communication platforms (apps, social media, gaming, etc.), Advocates will be
redefining the optimal all-driver text messaging restriction in coming Roadmap Reports. This change will reflect the growth of
platforms and concern about their use for communications while driving.
Today, 31 states have a GDL cell phone restriction.
EMBARGOED UNTIL
1/22/1
8

January 2018 Advocates for Highway and Auto Safety 35
DISTRACTED DRIVING LAWS RATING CHART
Number of new texting laws since January 2017: Two all-driver text messaging restrictions (IA,
TX); No GDL cell phone restrictions.
All-D
rive
r Te
xt
Me
ssa
gin
g R
estric
tion
Ra
ting
All-D
rive
r Te
xt
Me
ssa
gin
g R
estric
tion
Ra
ting
GD
L C
ell P
ho
ne
Re
stric
tion
GD
L C
ell P
ho
ne
Re
stric
tion
AL MT
AK NE
AZ NV
AR NH
CA NJ
CO NM
CT NY
DE NC
DC ND
FL OH
GA OK
HI OR
ID PA
IL RI
IN SC
IA SD
KS TN
KY TX
LA UT
ME VT
MD VA
MA WA
MI WV
MN WI
MS WY
MO Total
43+
DC 31
= Optimal law = Good (both laws) = Caution (one of the two laws)
= Danger (neither law) (No credit is given for laws that are subject to secondary
enforcement)
STATUS OF STATE LAWS
43 states and DC have an optimal all-driver
text messaging restriction.
3 states have yet to adopt an all-driver text
messaging restriction (AZ, MO and MT) and
4 states have laws that are only subject to
secondary enforcement (FL, NE, OH and SD).
31 states have an optimal GDL cell phone
restriction.
EMBARGOED UNTIL
1/22/1
8

January 2018 Advocates for Highway and Auto Safety 36
On the following pages, Advocates has given an overall rating to the states based on the number of laws in
each state that are recommended in this report.
Credit is given only when the law meets Advocates’ optimal law recommendations (see pages 12-13 for
law definitions). No credit is given for laws that are subject to secondary enforcement or have a driver
education exemption.
The overall rating takes into consideration whether a state has the recommended occupant protection
laws. No state without a primary enforcement seat belt law covering passengers in all seating positions
(front and rear), or that has repealed an existing all-rider motorcycle helmet law within the previous 10
years, is eligible for a green overall rating, no matter how many other laws it may have. This weighting is to
emphasize the significance of comprehensive primary enforcement seat belt laws and all-rider motorcycle
helmet laws in saving lives and reducing injuries.
OVERALL STATE RATINGS BASED ON NUMBER OF LAWS
EMBARGOED UNTIL
1/22/1
8

January 2018 Advocates for Highway and Auto Safety 37
NC
OH IN
AL TX
FL
GA MS
OK NM AZ
CA
NV UT
CO KS MO
AR
LA
TN
SC
KY VA
IL
IA NE
WY
ID OR
SD WI MN
ND MT
WA
PA
NY
ME
NH MA
CT NJ
DC (green) DE MD
RI MI
HI
AK
VT
WV
RATINGS CHART
Color Number of Laws Definition
11 to 16, with both (front and rear)
primary enforcement seat belt laws,
or 9 or more, with both (front and
rear) primary enforcement laws and
all-rider helmet law
State is significantly advanced
toward adopting all of Advocates’
recommended optimal laws
6 to 10, with both (front and rear)
primary enforcement seat belt laws,
or 7 and above, without both (front
and rear) primary enforcement seat
belt laws
State needs improvement because
of gaps in Advocates’ recommended
optimal laws
Fewer than 7, without both (front
and rear) primary enforcement seat
belt laws
State falls dangerously behind in
adoption of Advocates’
recommended optimal laws
(6 states and DC)
(31 states)
(13 states)
OVERALL STATE RATINGS BASED ON NUMBER OF LAWS
EMBARGOED UNTIL
1/22/1
8

January 2018 Advocates for Highway and Auto Safety 38
Occ. Protection CPS Teen Driving Laws Impaired Driving Distraction
Prim
ary E
nfo
rce
me
nt F
ron
t Se
at B
elt L
aw
Prim
ary E
nfo
rce
me
nt R
ea
r Se
at B
elt L
aw
All-R
ide
r Mo
torc
ycle
He
lme
t La
w
Re
ar F
acin
g T
hro
ugh
Age
2 L
aw
Bo
oste
r Se
at L
aw
Min
imu
m A
ge
16
for L
ea
rne
r’s P
erm
it
6 M
o. H
old
ing P
erio
d P
rovis
ion
50
Ho
urs
of S
up
erv
ise
d D
rivin
g P
rovis
ion
Nig
httim
e D
rivin
g R
estric
tion
Pro
vis
ion
Pa
sse
nge
r Re
stric
tion
Pro
vis
ion
Age
18
Un
restric
ted
Lic
en
se
All-O
ffen
de
r Ign
ition
Inte
rlock
s
Ch
ild E
nd
an
ge
rme
nt L
aw
Op
en
Co
nta
ine
r La
w
All-D
rive
r Te
xt Me
ssa
gin
g R
estric
tion
GD
L C
ell P
ho
ne
Re
stric
tion
To
tal N
um
be
r of L
aw
s 2
01
8
Ove
rall S
afe
ty Ra
ting 2
01
8
Alabama 8
Alaska 7
Arizona 4
Arkansas 8
California 10
Colorado 7
Connecticut 8
Delaware 11
District of Columbia 10
Florida 5
Georgia 8
Hawaii 9
Idaho 6
Illinois 9
Indiana 9
Iowa 6
Kansas 9
Kentucky 9
Louisiana 9
Maine 10
Maryland 10
Massachusetts 8
Michigan 10
Minnesota 8
Mississippi 7
Missouri 4
Montana 4
= Optimal law
OVERALL STATE RATINGS BASED ON NUMBER OF LAWS
EMBARGOED UNTIL
1/22/1
8

January 2018 Advocates for Highway and Auto Safety 39
Occ. Protection CPS Teen Driving Laws Impaired Driving Distraction
Prim
ary E
nfo
rce
me
nt F
ron
t Se
at B
elt L
aw
Prim
ary E
nfo
rce
me
nt R
ea
r Se
at B
elt L
aw
All-R
ide
r Mo
torc
ycle
He
lme
t La
w
Re
ar F
acin
g T
hro
ugh
Age
2 L
aw
Bo
oste
r Se
at L
aw
Min
imu
m A
ge
16
for L
ea
rne
r’s P
erm
it
6 M
o. H
old
ing P
erio
d P
rovis
ion
50
Ho
urs
of S
up
erv
ise
d D
rivin
g P
rovis
ion
Nig
httim
e D
rivin
g R
estric
tion
Pro
vis
ion
Pa
sse
nge
r Re
stric
tion
Pro
vis
ion
Age
18
Un
restric
ted
Lic
en
se
All-O
ffen
de
r Ign
ition
Inte
rlock
s
Ch
ild E
nd
an
ge
rme
nt L
aw
Op
en
Co
nta
ine
r La
w
All-D
rive
r Te
xt Me
ssa
gin
g R
estric
tion
GD
L C
ell P
ho
ne
Re
stric
tion
To
tal N
um
be
r of L
aw
s 2
01
8
Ove
rall S
afe
ty Ra
ting 2
01
8
Nebraska 5
Nevada 7
New Hampshire 6
New Jersey 12
New Mexico 9
New York 12
North Carolina 10
North Dakota 7
Ohio 6
Oklahoma 10
Oregon 11
Pennsylvania 7
Rhode Island 13
South Carolina 9
South Dakota 2
Tennessee 9
Texas 9
Utah 9
Vermont 6
Virginia 5
Washington 11
West Virginia 10
Wisconsin 8
Wyoming 3
Total Number with
Optimal Law
34+
DC
19+
DC
19+
DC
9 15 8+
DC
46+
DC
26 11 18+
DC
2
30+
DC
47+
DC
41+
DC
43+
DC
31
Total Number
Missing Optimal Law
16 31 31 41+
DC
35+
DC
42 4 24+
DC
39+
DC
32 48+
DC
20 3 9 7 19+
DC
= Optimal law
OVERALL STATE RATINGS BASED ON NUMBER OF LAWS
EMBARGOED UNTIL
1/22/1
8

January 2018 Advocates for Highway and Auto Safety 40
Each state and DC are graphically represented in alphabetical order with the following information:
• The number of people killed in motor vehicle crashes in each state for the year 2016, as reported by NHTSA;
• The total number of fatalities over the past 10 years, as reported by NHTSA;
• The annual economic cost of motor vehicle crashes to the state, as reported in The Economic and Societal
Impact of Motor Vehicle Crashes, 2010 (NHTSA), (See chart on page 8);
• The state’s background color represents its overall rating (Green, Yellow or Red) based on the chart on pages
38 and 39 of this Report; and,
• A list of the optimal lifesaving laws that the state has not enacted, based on Advocates’ definitions on pages 12
and 13 as discussed in this Report.
States are credited with having laws only if their laws
meet Advocates’ optimal criteria
(definitions on pages 12 and 13).
Only 6 states and DC (CA, DE, LA, OR, RI and WA) received a Green rating, showing
significant advancement toward adopting all of Advocates’ recommended optimal laws.
31 states (AL, AK, AR, CO, CT, GA, HI, IL, IN, KS, KY, ME, MD, MA, MI, MN, MS, NV, NJ,
NM, NY, NC, ND, OK, PA, SC, TN, TX, UT, WV and WI) received a Yellow rating, indicating
that improvement is needed because of gaps in Advocates’ recommended optimal laws.
13 states (AZ, FL, ID, IA, MO, MT, NE, NH, OH, SD, VT, VA and WY) received a Red rating,
indicating these states fall dangerously behind in adoption of Advocates’ recommended
optimal laws.
Abbreviation Key (Explanation for Laws Needed):
S = Highway Safety Law is Secondary Enforcement
(Advocates gives no credit for any law that is subject to secondary enforcement.)
DE = Driver Education exemption included in the GDL provision
(Advocates gives no credit for any GDL provision that is exempted based on driver education.)
Stronger = Indicates state has a law but it does not meet optimal criteria
Note: States without a primary enforcement seat belt law covering passengers in all seating positions (front and rear) or
that have repealed an existing all-rider motorcycle helmet law within the previous 10 years are not eligible for a green
rating, no matter how many other optimal laws they may have.
STATES AT A GLANCE
EMBARGOED UNTIL
1/22/1
8

January 2018 Advocates for Highway and Auto Safety 41
ALABAMA
2016 Fatalities: 1,038
10-Year Fatality Total: 9,105
Annual Economic Cost Due
to Motor Vehicle Crashes:
$4.473 Billion
Highway Safety Laws Needed in Alabama:
Primary Enforcement Seat Belt Law (Rear)
Rear Facing Through Age 2 Law
Booster Seat Law
GDL - Minimum Age 16 for Learner’s Permit
GDL - Stronger Supervised Driving Requirement
GDL - Stronger Nighttime Restriction
GDL - Age 18 for Unrestricted License
GDL Cell Phone Restriction
ALASKA
2016 Fatalities: 84
10-Year Fatality Total: 670
Annual Economic Cost Due
to Motor Vehicle Crashes:
$592 Million
Highway Safety Laws Needed in Alaska:
All-Rider Motorcycle Helmet Law
Rear Facing Through Age 2 Law
Booster Seat Law
GDL - Minimum Age 16 for Learner’s Permit
GDL - Stronger Supervised Driving Requirement
GDL - Stronger Nighttime Restriction
GDL - Age 18 for Unrestricted License
Open Container Law
GDL Cell Phone Restriction
ARIZONA
2016 Fatalities: 962
10-Year Fatality Total: 8,697
Annual Economic Cost Due
to Motor Vehicle Crashes:
$4.183 Billion
Highway Safety Laws Needed in Arizona:
Primary Enforcement Seat Belt Law (Front & Rear)
All-Rider Motorcycle Helmet Law
Rear Facing Through Age 2 Law
Booster Seat Law
GDL - Minimum Age 16 for Learner’s Permit
GDL - Stronger Supervised Driving Requirement
GDL - Nighttime Restriction
GDL - Passenger Restriction
GDL - Age 18 Unrestricted License
All-Driver Text Messaging Restriction
GDL Cell Phone Restriction
ARKANSAS
2016 Fatalities: 545
10-Year Fatality Total: 5,526
Annual Economic Cost Due
to Motor Vehicle Crashes:
$2.386 Billion
Highway Safety Laws Needed in Arkansas:
Primary Enforcement Seat Belt Law (Rear)
All-Rider Motorcycle Helmet Law
Rear Facing Through Age 2 Law
Booster Seat Law
GDL - Minimum Age 16 for Learner’s Permit
GDL - Supervised Driving Requirement
GDL - Stronger Nighttime Restriction
GDL Cell Phone Restriction (Without S)
S = Secondary Enforcement EMBARGOED UNTIL
1/22/1
8

January 2018 Advocates for Highway and Auto Safety 42
CALIFORNIA
2016 Fatalities: 3,623
10-Year Fatality Total: 31,750
Annual Economic Cost Due
to Motor Vehicle Crashes:
$19.998 Billion
Highway Safety Laws Needed in California:
GDL - Minimum Age 16 for Learner’s Permit
GDL - Stronger Nighttime Restriction
GDL - Stronger Passenger Restriction
GDL - Age 18 for Unrestricted License
Ignition Interlocks for All Offenders
GDL Cell Phone Restriction (Without S)
COLORADO
2016 Fatalities: 608
10-Year Fatality Total: 5,057
Annual Economic Cost Due
to Motor Vehicle Crashes:
$4.173 Billion
Highway Safety Laws Needed in Colorado:
Primary Enforcement Seat Belt Law (Front & Rear)
All-Rider Motorcycle Helmet Law
Rear Facing Through Age 2 Law
Booster Seat Law
GDL - Minimum Age 16 for Learner’s Permit
GDL - Stronger Nighttime Restriction
GDL - Stronger Passenger Restriction
GDL - Age 18 for Unrestricted License
CONNECTICUT
2016 Fatalities: 293
10-Year Fatality Total: 2,623
Annual Economic Cost Due
to Motor Vehicle Crashes:
$4.880 Billion
Highway Safety Laws Needed in Connecticut:
Primary Enforcement Seat Belt Law (Rear)
All-Rider Motorcycle Helmet Law
Booster Seat Law
GDL - 6-Month Holding Period
(Without DE Exemption)
GDL - Stronger Supervised Driving Requirement
GDL - Stronger Nighttime Restriction
GDL - Age 18 for Unrestricted License
Open Container Law
DELAWARE
2016 Fatalities: 119
10-Year Fatality Total: 1,133
Annual Economic Cost Due
to Motor Vehicle Crashes:
$684 Million
Highway Safety Laws Needed in Delaware: All-Rider Motorcycle Helmet Law
Rear Facing Through Age 2 Law
Booster Seat Law
GDL - Age 18 for Unrestricted License
Open Container Law
DISTRICT OF COLUMBIA
2016 Fatalities: 27
10-Year Fatality Total: 266
Annual Economic Cost Due
to Motor Vehicle Crashes:
$859 Million
Highway Safety Laws Needed in Washington, D.C.:
Rear Facing Through Age 2 Law
Booster Seat Law
GDL - Supervised Driving Requirement
GDL - Stronger Nighttime Restriction
GDL - Age 18 for Unrestricted License
GDL Cell Phone Restriction
S = Secondary Enforcement DE = Driver Education EMBARGOED UNTIL
1/22/1
8

January 2018 Advocates for Highway and Auto Safety 43
FLORIDA
2016 Fatalities: 3,174
10-Year Fatality Total: 27,033
Annual Economic Cost Due
to Motor Vehicle Crashes:
$10.750 Billion
Highway Safety Laws Needed in Florida:
Primary Enforcement Seat Belt Law (Rear)
All-Rider Motorcycle Helmet Law
Rear Facing Through Age 2 Law
Booster Seat Law
GDL - Minimum Age 16 for Learner’s Permit
GDL - Stronger Nighttime Restriction
GDL - Passenger Restriction
GDL - Age 18 for Unrestricted License
Ignition Interlocks for All Offenders
All-Driver Text Messaging Restriction (Without S)
GDL Cell Phone Restriction
GEORGIA
2016 Fatalities: 1,554
10-Year Fatality Total: 13,407
Annual Economic Cost Due
to Motor Vehicle Crashes:
$10.787 Billion
Highway Safety Laws Needed in Georgia:
Primary Enforcement Seat Belt Law (Rear)
Rear Facing Through Age 2 Law
GDL - Minimum Age 16 for Learner’s Permit
GDL - Stronger Supervised Driving Requirement
GDL - Stronger Nighttime Restriction
GDL - Stronger Passenger Restriction
GDL - Age 18 for Unrestricted License
Ignition Interlocks for All Offenders
HAWAII
2016 Fatalities: 120
10-Year Fatality Total: 1,104
Annual Economic Cost Due
to Motor Vehicle Crashes:
$577 Million
Highway Safety Laws Needed in Hawaii:
All-Rider Motorcycle Helmet Law
Rear Facing Through Age 2 Law
Booster Seat Law
GDL - Minimum Age 16 for Learner’s Permit
GDL - Stronger Nighttime Restriction
GDL - Stronger Passenger Restriction
GDL - Age 18 for Unrestricted License
IDAHO
2016 Fatalities: 253
10-Year Fatality Total: 2,139
Annual Economic Cost Due
to Motor Vehicle Crashes:
$886 Million
Highway Safety Laws Needed in Idaho:
Primary Enforcement Seat Belt Law (Front & Rear)
All-Rider Motorcycle Helmet Law
Rear Facing Through Age 2 Law
Booster Seat Law
GDL - Minimum Age 16 for Learner’s Permit
GDL - Stronger Passenger Restriction
GDL - Age 18 for Unrestricted License
Ignition Interlocks for All Offenders
GDL Cell Phone Restriction
ILLINOIS
2016 Fatalities: 1,082
10-Year Fatality Total: 9,999
Annual Economic Cost Due
to Motor Vehicle Crashes:
$10.885 Billion
Highway Safety Laws Needed in Illinois:
All-Rider Motorcycle Helmet Law
Rear Facing Through Age 2 Law
Booster Seat Law
GDL - Minimum Age 16 for Learner’s Permit
GDL - Stronger Nighttime Restriction
GDL - Stronger Passenger Restriction
GDL - Age 18 for Unrestricted License
S = Secondary Enforcement EMBARGOED UNTIL
1/22/1
8

January 2018 Advocates for Highway and Auto Safety 44
INDIANA
2016 Fatalities: 821
10-Year Fatality Total: 7,860
Annual Economic Cost Due
to Motor Vehicle Crashes:
$6.375 Billion
Highway Safety Laws Needed in Indiana:
All-Rider Motorcycle Helmet Law
Rear Facing Through Age 2 Law
Booster Seat Law
GDL - Minimum Age 16 for Learner’s Permit
GDL - Stronger Nighttime Restriction
GDL - Age 18 for Unrestricted License
Ignition Interlocks for All Offenders
IOWA
2016 Fatalities: 404
10-Year Fatality Total: 3,706
Annual Economic Cost Due
to Motor Vehicle Crashes:
$2.188 Billion
Highway Safety Laws Needed in Iowa:
Primary Enforcement Seat Belt Law (Rear)
All-Rider Motorcycle Helmet Law
Rear Facing Through Age 2 Law
Booster Seat Law
GDL - Minimum Age 16 for Learner’s Permit
GDL - Stronger Supervised Driving Requirement
GDL - Stronger Nighttime Restriction
GDL - Passenger Restriction
GDL - Age 18 for Unrestricted License
Ignition Interlocks for All Offenders
KANSAS
2016 Fatalities: 429
10-Year Fatality Total: 3,928
Annual Economic Cost Due
to Motor Vehicle Crashes:
$2.445 Billion
Highway Safety Laws Needed in Kansas:
Primary Enforcement Seat Belt Law (Rear)
All-Rider Motorcycle Helmet Law
Rear Facing Through Age 2 Law
Booster Seat Law
GDL - Minimum Age 16 for Learner’s Permit
GDL - Stronger Passenger Restriction
GDL - Age 18 for Unrestricted License
KENTUCKY
2016 Fatalities: 834
10-Year Fatality Total: 7,612
Annual Economic Cost Due
to Motor Vehicle Crashes:
$4.363 Billion
Highway Safety Laws Needed in Kentucky:
All-Rider Motorcycle Helmet Law
Rear Facing Through Age 2 Law
Booster Seat Law
GDL - Stronger Nighttime Restriction
GDL - Stronger Passenger Restriction
GDL - Age 18 for Unrestricted License
Ignition Interlocks for All Offenders
LOUISIANA
2016 Fatalities: 757
10-Year Fatality Total: 7,753
Annual Economic Cost Due
to Motor Vehicle Crashes:
$5.691 Billion
Highway Safety Laws Needed in Louisiana:
Rear Facing Through Age 2 Law
Booster Seat Law
GDL - Minimum Age 16 for Learner’s Permit
GDL - Stronger Nighttime Restriction
GDL - Stronger Passenger Restriction
GDL - Age 18 for Unrestricted License
Open Container Law
EMBARGOED UNTIL
1/22/1
8

January 2018 Advocates for Highway and Auto Safety 45
MAINE
2016 Fatalities: 161
10-Year Fatality Total: 1,551
Annual Economic Cost Due
to Motor Vehicle Crashes:
$1.303 Billion
Highway Safety Laws Needed in Maine:
All-Rider Motorcycle Helmet Law
Rear Facing Through Age 2 Law
Booster Seat Law
GDL - Minimum Age 16 for Learner’s Permit
GDL - Stronger Nighttime Restriction
GDL - Age 18 for Unrestricted License
MARYLAND
2016 Fatalities: 505
10-Year Fatality Total: 5,160
Annual Economic Cost Due
to Motor Vehicle Crashes:
$4.476 Billion
Highway Safety Laws Needed in Maryland:
Primary Enforcement Seat Belt Law (Rear)
Rear Facing Through Age 2 Law
GDL - Minimum Age 16 for Learner’s Permit
GDL - Stronger Nighttime Restriction
GDL - Stronger Passenger Restriction
GDL - Age 18 for Unrestricted License
MASSACHUSETTS
2016 Fatalities: 389
10-Year Fatality Total: 3,500
Annual Economic Cost Due
to Motor Vehicle Crashes:
$5.835 Billion
Highway Safety Laws Needed in Massachusetts:
Primary Enforcement Seat Belt Law (Front & Rear)
Rear Facing Through Age 2 Law
GDL - Stronger Supervised Driving Requirement
GDL - Stronger Nighttime Restriction
GDL - Stronger Passenger Restriction
GDL - Age 18 for Unrestricted License
Ignition Interlocks for All Offenders
MICHIGAN
2016 Fatalities: 1,064
10-Year Fatality Total: 9,583
Annual Economic Cost Due
to Motor Vehicle Crashes:
$9.599 Billion
Highway Safety Laws Needed in Michigan:
Primary Enforcement Seat Belt Law (Rear)
All-Rider Motorcycle Helmet Law
Rear Facing Through Age 2 Law
GDL - Minimum Age 16 for Learner’s Permit
GDL - Age 18 for Unrestricted License
Ignition Interlocks for All Offenders
MINNESOTA
2016 Fatalities: 392
10-Year Fatality Total: 4,106
Annual Economic Cost Due
to Motor Vehicle Crashes:
$3.057 Billion
Highway Safety Laws Needed in Minnesota:
All-Rider Motorcycle Helmet Law
Rear Facing Through Age 2 Law
GDL - Minimum Age 16 for Learner’s Permit
GDL - Stronger Supervised Driving Requirement
GDL - Stronger Nighttime Restriction
GDL - Stronger Passenger Restriction
GDL - Age 18 for Unrestricted License
Ignition Interlocks for All Offenders
EMBARGOED UNTIL
1/22/1
8

January 2018 Advocates for Highway and Auto Safety 46
MISSISSIPPI
2016 Fatalities: 690
10-Year Fatality Total: 6,807
Annual Economic Cost Due
to Motor Vehicle Crashes:
$2.718 Billion
Highway Safety Laws Needed in Mississippi:
Rear Facing Through Age 2 Law
Booster Seat Law
GDL - Minimum Age 16 for Learner’s Permit
GDL - Supervised Driving Requirement
GDL - Stronger Nighttime Restriction
GDL - Passenger Restriction
GDL - Age 18 for Unrestricted License
Open Container Law
GDL Cell Phone Restriction
MISSOURI
2016 Fatalities: 945
10-Year Fatality Total: 8,598
Annual Economic Cost Due
to Motor Vehicle Crashes:
$5.560 Billion
Highway Safety Laws Needed in Missouri:
Primary Enforcement Seat Belt Law (Front & Rear)
Rear Facing Through Age 2 Law
Booster Seat Law
GDL - Minimum Age 16 for Learner’s Permit
GDL - Stronger Supervised Driving Requirement
GDL - Stronger Nighttime Restriction
GDL - Stronger Passenger Restriction
GDL - Age 18 for Unrestricted License
Open Container Law
All-Driver Text Messaging Restriction
GDL Cell Phone Restriction
MONTANA
2016 Fatalities: 190
10-Year Fatality Total: 2,165
Annual Economic Cost Due
to Motor Vehicle Crashes:
$898 Million
Highway Safety Laws Needed in Montana:
Primary Enforcement Seat Belt Law (Front & Rear)
All-Rider Motorcycle Helmet Law
Rear Facing Through Age 2 Law
Booster Seat Law
GDL - Minimum Age 16 for Learner’s Permit
GDL - Stronger Nighttime Restriction
GDL - Stronger Passenger Restriction
GDL - Age 18 for Unrestricted License
Ignition Interlocks for All Offenders
All-Driver Text Messaging Restriction
GDL Cell Phone Restriction
NEBRASKA
2016 Fatalities: 218
10-Year Fatality Total: 2,170
Annual Economic Cost Due
to Motor Vehicle Crashes:
$1.295 Billion
Highway Safety Laws Needed in Nebraska:
Primary Enforcement Seat Belt Law (Front & Rear)
Rear Facing Through Age 2 Law
Booster Seat Law
GDL - Minimum Age 16 for Learner’s Permit
GDL - Supervised Driving Requirement
(Without DE Exemption)
GDL - Stronger Nighttime Restriction
GDL - Stronger Passenger Restriction
GDL - Age 18 for Unrestricted License
All-Driver Text Messaging Restriction (Without S)
GDL Cell Phone Restriction (Without S)
S = Secondary Enforcement DE = Driver Education EMBARGOED UNTIL
1/22/1
8

January 2018 Advocates for Highway and Auto Safety 47
S = Secondary Enforcement DE = Driver Education
NEVADA
2016 Fatalities: 328
10-Year Fatality Total: 2,906
Annual Economic Cost Due
to Motor Vehicle Crashes:
$1.978 Billion
Highway Safety Laws Needed in Nevada:
Primary Enforcement Seat Belt Law (Front & Rear)
Rear Facing Through Age 2 Law
Booster Seat Law
GDL - Minimum Age 16 for Learner’s Permit
GDL - Nighttime Restriction (Without S)
GDL - Stronger Passenger Restriction
GDL - Age 18 for Unrestricted License
GDL Cell Phone Restriction
NEW HAMPSHIRE
2016 Fatalities: 136
10-Year Fatality Total: 1,184
Annual Economic Cost Due
to Motor Vehicle Crashes:
$1.374 Billion
Highway Safety Laws Needed in
New Hampshire:
Primary Enforcement Seat Belt Law (Front & Rear)
All-Rider Motorcycle Helmet Law
Rear Facing Through Age 2 Law
Booster Seat Law
GDL - Minimum Age 16 for Learner’s Permit
GDL - 6-Month Holding Period
GDL - Stronger Supervised Driving Requirement
GDL - Stronger Nighttime Restriction
GDL - Age 18 for Unrestricted License
NEW JERSEY
2016 Fatalities: 601
10-Year Fatality Total: 5,930
Annual Economic Cost Due
to Motor Vehicle Crashes:
$12.813 Billion
Highway Safety Laws Needed in New Jersey:
Primary Enforcement Seat Belt Law (Rear)
GDL - Supervised Driving Requirement
GDL - Stronger Nighttime Restriction
Ignition Interlocks for All Offenders
NEW MEXICO
2016 Fatalities: 402
10-Year Fatality Total: 3,594
Annual Economic Cost Due
to Motor Vehicle Crashes:
$1.769 Billion
Highway Safety Laws Needed in New Mexico:
All-Rider Motorcycle Helmet Law
Rear Facing Through Age 2 Law
Booster Seat Law
GDL - Minimum Age 16 for Learner’s Permit
GDL - Stronger Nighttime Restriction
GDL - Age 18 for Unrestricted License
Child Endangerment Law
NEW YORK
2016 Fatalities: 1,025
10-Year Fatality Total: 11,643
Annual Economic Cost Due
to Motor Vehicle Crashes:
$15.246 Billion
Highway Safety Laws Needed in New York:
Primary Enforcement Seat Belt Law (Rear)
Booster Seat Law
GDL - Age 18 for Unrestricted License
(Without DE Exemption)
GDL Cell Phone Restriction
EMBARGOED UNTIL
1/22/1
8

January 2018 Advocates for Highway and Auto Safety 48
NORTH CAROLINA
2016 Fatalities: 1,450
10-Year Fatality Total: 13,665
Annual Economic Cost Due
to Motor Vehicle Crashes:
$7.909 Billion
Highway Safety Laws Needed in North Carolina:
Primary Enforcement Seat Belt Law (Rear)
Rear Facing Through Age 2 Law
Booster Seat Law
GDL - Minimum Age 16 for Learner’s Permit
GDL - Age 18 for Unrestricted License
Ignition Interlocks for All Offenders
NORTH DAKOTA
2016 Fatalities: 113
10-Year Fatality Total: 1,305
Annual Economic Cost
Due to Motor Vehicle
Crashes:
$706 Million
Highway Safety Laws Needed in North Dakota:
Primary Enforcement Seat Belt Law (Front & Rear)
All-Rider Motorcycle Helmet Law
Rear Facing Through Age 2 Law
GDL - Minimum Age 16 for Learner’s Permit
GDL - Supervised Driving Requirement
GDL - Passenger Restriction
GDL - Age 18 for Unrestricted License
Ignition Interlocks for All Offenders
OHIO
2016 Fatalities: 1,132
10-Year Fatality Total: 10,925
Annual Economic Cost Due
to Motor Vehicle Crashes:
$10.125 Billion
Highway Safety Laws Needed in Ohio:
Primary Enforcement Seat Belt Law (Front & Rear)
All-Rider Motorcycle Helmet Law
Rear Facing Through Age 2 Law
Booster Seat Law
GDL - Minimum Age 16 for Learner’s Permit
GDL - Stronger Nighttime Restriction
GDL - Age 18 for Unrestricted License
Ignition Interlocks for All Offenders
All-Driver Text Messaging Restriction (Without S)
OKLAHOMA
2016 Fatalities: 683
10-Year Fatality Total: 6,986
Annual Economic Cost Due
to Motor Vehicle Crashes:
$2.910 Billion
Highway Safety Laws Needed in Oklahoma:
Primary Enforcement Seat Belt (Rear)
All-Rider Motorcycle Helmet Law
Booster Seat Law
GDL - Minimum Age 16 for Learner’s Permit
GDL - Age 18 for Unrestricted License
GDL Cell Phone Restriction
S = Secondary Enforcement
OREGON
2016 Fatalities: 495
10-Year Fatality Total: 3,844
Annual Economic Cost Due
to Motor Vehicle Crashes:
$1.768 Billion
Highway Safety Laws Needed in Oregon:
GDL - Minimum Age 16 for Learner’s Permit
GDL - Stronger Supervised Driving Requirement
GDL - Stronger Nighttime Restriction
GDL - Stronger Passenger Restriction
GDL - Age 18 for Unrestricted License
EMBARGOED UNTIL
1/22/1
8

January 2018 Advocates for Highway and Auto Safety 49
PENNSYLVANIA
2016 Fatalities: 1,188
10-Year Fatality Total: 12,926
Annual Economic Cost Due
to Motor Vehicle Crashes:
$5.851 Billion
Highway Safety Laws Needed in Pennsylvania:
Primary Enforcement Seat Belt Law (Front & Rear)
All-Rider Motorcycle Helmet Law
Booster Seat Law
GDL - Stronger Nighttime Restriction
GDL - Stronger Passenger Restriction
GDL - Age 18 for Unrestricted License
Ignition Interlocks for All Offenders
GDL Cell Phone Restriction
RHODE ISLAND
2016 Fatalities: 51
10-Year Fatality Total: 626
Annual Economic Cost Due
to Motor Vehicle Crashes:
$1.599 Billion
Highway Safety Laws Needed in Rhode Island:
All-Rider Motorcycle Helmet Law
GDL - Stronger Nighttime Restriction
GDL - Age 18 for Unrestricted License
SOUTH CAROLINA
2016 Fatalities: 1,015
10-Year Fatality Total: 8,964
Annual Economic Cost Due
to Motor Vehicle Crashes:
$4.045 Billion
Highway Safety Laws Needed in South Carolina:
All-Rider Motorcycle Helmet Law
GDL - Minimum Age 16 for Learner’s Permit
GDL - Stronger Supervised Driving Requirement
GDL - Stronger Passenger Restriction
GDL - Age 18 for Unrestricted License
Ignition Interlocks for All Offenders
GDL Cell Phone Restriction
SOUTH DAKOTA
2016 Fatalities: 116
10-Year Fatality Total: 1,300
Annual Economic Cost Due
to Motor Vehicle Crashes:
$720 Million
Highway Safety Laws Needed in South Dakota:
Primary Enforcement Seat Belt Law (Front & Rear)
All-Rider Motorcycle Helmet Law
Rear Facing Through Age 2 Law
Booster Seat Law
GDL - Minimum Age 16 for Learner’s Permit
GDL - 6-Month Holding Period
(Without DE Exemption)
GDL - Supervised Driving Requirement
GDL - Passenger Restriction
GDL - Age 18 for Unrestricted License
Ignition Interlocks for All Offenders
Child Endangerment Law
All-Driver Text Messaging Restriction (Without S)
GDL Cell Phone Restriction (Without S)
S = Secondary Enforcement DE = Driver Education
EMBARGOED UNTIL
1/22/1
8
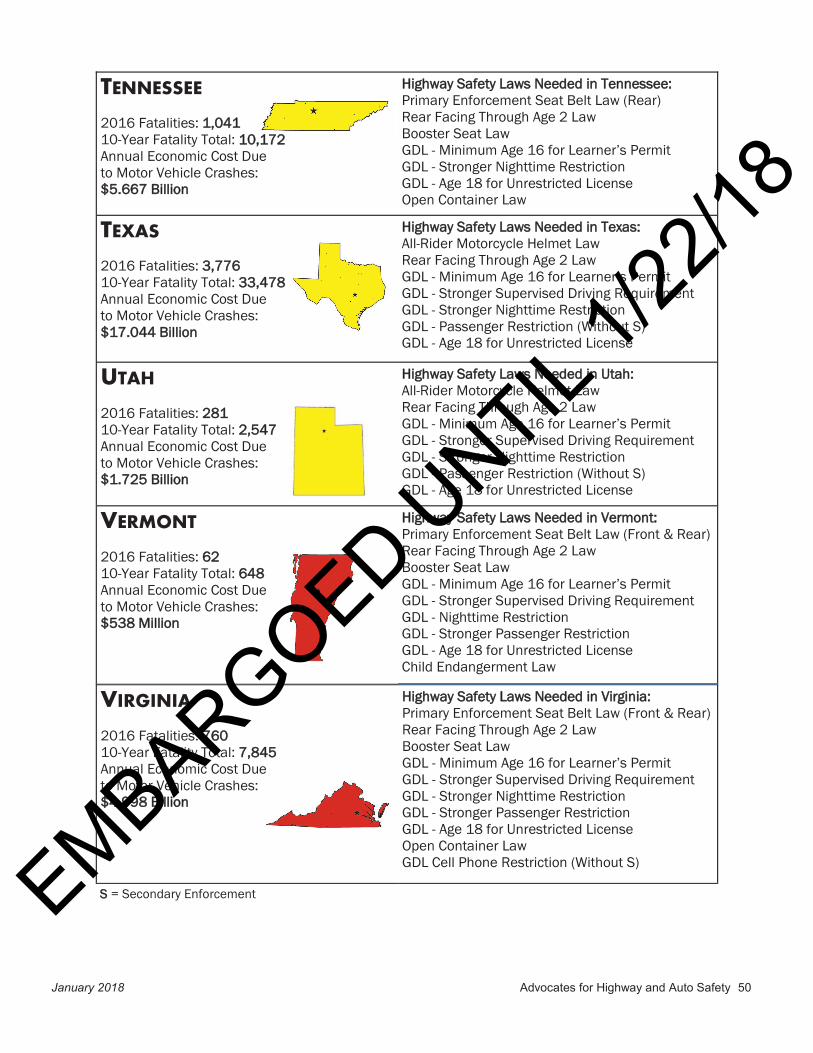
January 2018 Advocates for Highway and Auto Safety 50
TENNESSEE
2016 Fatalities: 1,041
10-Year Fatality Total: 10,172
Annual Economic Cost Due
to Motor Vehicle Crashes:
$5.667 Billion
Highway Safety Laws Needed in Tennessee:
Primary Enforcement Seat Belt Law (Rear)
Rear Facing Through Age 2 Law
Booster Seat Law
GDL - Minimum Age 16 for Learner’s Permit
GDL - Stronger Nighttime Restriction
GDL - Age 18 for Unrestricted License
Open Container Law
TEXAS
2016 Fatalities: 3,776
10-Year Fatality Total: 33,478
Annual Economic Cost Due
to Motor Vehicle Crashes:
$17.044 Billion
Highway Safety Laws Needed in Texas:
All-Rider Motorcycle Helmet Law
Rear Facing Through Age 2 Law
GDL - Minimum Age 16 for Learner’s Permit
GDL - Stronger Supervised Driving Requirement
GDL - Stronger Nighttime Restriction
GDL - Passenger Restriction (Without S)
GDL - Age 18 for Unrestricted License
UTAH
2016 Fatalities: 281
10-Year Fatality Total: 2,547
Annual Economic Cost Due
to Motor Vehicle Crashes:
$1.725 Billion
Highway Safety Laws Needed in Utah:
All-Rider Motorcycle Helmet Law
Rear Facing Through Age 2 Law
GDL - Minimum Age 16 for Learner’s Permit
GDL - Stronger Supervised Driving Requirement
GDL - Stronger Nighttime Restriction
GDL - Passenger Restriction (Without S)
GDL - Age 18 for Unrestricted License
VERMONT
2016 Fatalities: 62
10-Year Fatality Total: 648
Annual Economic Cost Due
to Motor Vehicle Crashes:
$538 Million
Highway Safety Laws Needed in Vermont:
Primary Enforcement Seat Belt Law (Front & Rear)
Rear Facing Through Age 2 Law
Booster Seat Law
GDL - Minimum Age 16 for Learner’s Permit
GDL - Stronger Supervised Driving Requirement
GDL - Nighttime Restriction
GDL - Stronger Passenger Restriction
GDL - Age 18 for Unrestricted License
Child Endangerment Law
S = Secondary Enforcement
VIRGINIA
2016 Fatalities: 760
10-Year Fatality Total: 7,845
Annual Economic Cost Due
to Motor Vehicle Crashes:
$4.998 Billion
Highway Safety Laws Needed in Virginia:
Primary Enforcement Seat Belt Law (Front & Rear)
Rear Facing Through Age 2 Law
Booster Seat Law
GDL - Minimum Age 16 for Learner’s Permit
GDL - Stronger Supervised Driving Requirement
GDL - Stronger Nighttime Restriction
GDL - Stronger Passenger Restriction
GDL - Age 18 for Unrestricted License
Open Container Law
GDL Cell Phone Restriction (Without S)
EMBARGOED UNTIL
1/22/1
8

January 2018 Advocates for Highway and Auto Safety 51
WASHINGTON
2016 Fatalities: 537
10-Year Fatality Total: 4,940
Annual Economic Cost Due
to Motor Vehicle Crashes:
$4.469 Billion
Highway Safety Laws Needed in Washington:
Rear Facing Through Age 2 Law
GDL - Minimum Age 16 for Learner’s Permit
GDL - Nighttime Restriction
GDL - Passenger Restriction
GDL - Age 18 for Unrestricted License
WEST VIRGINIA
2016 Fatalities: 269
10-Year Fatality Total: 3,300
Annual Economic Cost Due
to Motor Vehicle Crashes:
$1.482 Billion
Highway Safety Laws Needed in West Virginia:
Primary Enforcement Seat Belt Law (Rear)
Rear Facing Through Age 2 Law
GDL - Minimum Age 16 for Learner’s Permit
GDL - Supervised Driving Requirement
(Without DE Exemption)
GDL - Stronger Passenger Restriction
GDL - Age 18 for Unrestricted License
WISCONSIN
2016 Fatalities: 607
10-Year Fatality Total: 5,914
Annual Economic Cost Due
to Motor Vehicle Crashes:
$4.546 Billion
Highway Safety Laws Needed in Wisconsin:
All-Rider Motorcycle Helmet Law
Rear Facing Through Age 2 Law
Booster Seat Law
GDL - Minimum Age 16 for Learner’s Permit
GDL - Supervised Driving Requirement
GDL - Stronger Nighttime Restriction
GDL - Age 18 for Unrestricted License
Ignition Interlocks for All Offenders
WYOMING
2016 Fatalities: 112
10-Year Fatality Total: 1,350
Annual Economic Cost Due
to Motor Vehicle Crashes:
$788 Million
Highway Safety Laws Needed in Wyoming:
Primary Enforcement Seat Belt Law (Front & Rear)
All-Rider Motorcycle Helmet Law
Rear Facing Through Age 2 Law
Booster Seat Law
GDL - Minimum Age 16 for Learner’s Permit
GDL - 6-Month Holding Period
GDL - Stronger Nighttime Restriction
GDL - Stronger Passenger Restriction
GDL - Age 18 for Unrestricted License
Ignition Interlocks for All Offenders
Open Container Law
GDL Cell Phone Restriction
DE = Driver Education
EMBARGOED UNTIL
1/22/1
8

January 2018 Advocates for Highway and Auto Safety 52
In developing this report, Advocates relied upon numerous research studies, statistical analyses, fact sheets and other public
data. Additional information is available upon request.
American Automobile Association Foundation for Traffic Safety, “Timing of Driver’s License Acquisition and Reasons for Delay among Young
People in the United States, 2012” July 2013.
American Automobile Association, “Crashes vs. Congestion- What's the Cost to Society?,” November 2011.
American Automobile Association, “Caution Ahead: New Year’s Ranks as Deadliest Day on US Roads,” December 2012.
Allstate Foundation Teen Licensing Survey, “Unlikely Allies in Fight for Stronger Teen Driving Laws: Teens Themselves,” 2010.
American Journal of Surgery, Repeal of the Michigan helmet law: the evolving clinical impact, 2015
Arbogast, K.B., Jermakian, J.S., Kallan, M.J., & Durbin, D.R., “Effectiveness of Belt Positioning Booster Seats: An Updated Assessment,”
Pediatrics, October 2009.
Ascone, D., Lindsey, T., & Varghese, C., “An Examination of Driver Distraction in NHTSA Databases,” Data Reporting and Information Division,
National Center for Statistics and Analysis, NHTSA, September 2009.
Chen, Baker, Li, “Graduated Driver Licensing Programs and Fatal Crashes of 16-Year-Old Drivers: A National Evaluation” Pediatrics, July 2006.
Centers for Disease Control and Prevention, “10 Leading Causes of Injury Deaths by Age Group Highlighting Unintentional Injury Deaths,
United States,” 2014.
Centers for Disease Control and Prevention, “Helmet use among motorcyclists who died in crashes and economic cost savings associated
with state motorcycle helmet laws,” 2012.
Centers for Disease Control and Prevention, “Injury Prevention and Control: Motor Vehicle Safety, Get the Facts.”
Centers for Disease Control and Prevention, “Teen Driver: Fact Sheet,” 2012.
Centers for Disease Control and Prevention, “Vital Signs, Drinking and Driving, a Threat to Everyone,” October 2011.
Children’s Hospital of Philadelphia - Partners for Child Passenger Safety: Fact and Trend Report, September 2008.
Coronado, V.G., Xu, L, Basavaraju, S.V., McGuire, L.C., Wald, M.M., Faul, M.D., Guzman, B.R., Hemphill, J.D., “Surveillance for Traumatic Brain
Injury—Related Deaths—United States, 1997-2007,” 2011.
Durbin, D.R., Chen, I., Smith, R., Elliot, M.R., and Winston, F.K., “Effects of seating position and appropriate restraint use on the risk of injury to
children in motor vehicle crashes,” Pediatrics 115:e305, 2005.
Durbin, D.R., Elliot, M.R., and Winston, F.K., “Belt-positioning booster seats and reduction in risk of injury among children in vehicle crashes,”
Journal of the American Medical Association 289:2835-40, 2003.
Elvik, R., “The Power Model of the Relationship Between Speed and Road Safety: Update and New Analyses,” Report No. 1034/2009. Oslo,
Norway: Institute of Transport Economics, 2009.
Federal Highway Administration, “If you run a red light, you are betting more than you can afford to lose.” FHWA-SA-11-016
Ferguson et al., “Progress in Teenage Crash Risk During the Last Decade,” Journal of Safety Research, 2007.
Flannagan, Carol, “Analysis of Motorcycle Crashes: Comparison of 2012 to Previous Years,” 18th Michigan Safety Summit, 2013.
Government Accountability Office, “Motorcycle Safety: Increasing Federal Flexibility and Identifying Research Priorities Would Help Support
States’ Safety Efforts,” Report 13-42, 2012.
Governors Highway Safety Association, “Mission Not Accomplished: Teen Safe Driving the Next Chapter,” Oct. 2016
Harris, Lou and Peter Harris Research Group, “Survey of the Attitudes of the American People of Highway and Auto Safety,” June 2004.
Henary, B., Sherwood, CP, “Car safety seats for children: rear facing for best protection.” Inj. Prev. 13(6): 398:402, Dec. 2007.
Insurance Institute for Highway Safety, Status Report “Kids in Crashes Far Better If States Have Tough Restraint Laws,” 2011.
SOURCE INFORMATION
EMBARGOED UNTIL
1/22/1
8

January 2018 Advocates for Highway and Auto Safety 53
Insurance Institute for Highway Safety, Status Report “Kids in Crashes Far Better If States Have Tough Restraint Laws,” 2011.
Insurance Institute for Highway Safety, Status Report, “High Claims: Legalizing recreational marijuana is linked to increased crashes,” 2017.
Insurance Institute for Highway Safety, “Fatality Facts 2015,” Teenagers Website
Insurance Institute for Highway Safety, “Graduated Licensing Laws and Fatal Crashes of Teenage Drivers, A National Study,” June 2010.
Insurance Institute for Highway Safety, “Watch Your Head: Michigan’s Weakened Helmet Use Law Leads to Costlier Injury Claims,” 2013.
Intoxalock Legacy Ignition Interlock Device Website.
Kaufman, E.J., MD, Wiebe, D.J., PhD, Impact of State Ignition Interlock Laws on Alcohol-Involved
Crash Deaths in the United States. Available at http://bit.ly/1RrkuZQ.
Liberty Mutual Insurance Company, “Liberty Mutual and SADD Study Finds Texting While Driving by Teens Not Affected by Their Awareness of
the Dangers, Text Conversations with Mom and Dad on the Rise,” October 2011.
Lui, B.C., Ivers, R., Norton, R., Boufous, S., Blows, S, Lo, S.K., “Helmets for Preventing Injury in Motorcycle Riders (Review),” The Cochrane
Library, 2009.
Mayhew, D., “Reducing the Crash Risk for Young Drivers,” June 2006.
McCartt A.T., Hellinga L.A., Braitman K.A., “Cell Phones and Driving: Review of Research,” Traffic Injury Prevention, 7:89-106, 2006.
McCartt A.T., Mayhew D.R., Braitman K.A., Ferguson S.A., Simpson H.M.. “Effects of Age and Experience on Young Driver Crashes: Review of
Recent Literature,” Insurance Institute for Highway Safety, Arlington, VA, 2008.
McCartt, A.T., Teoh, E.R., Fields, M., Braitman, K.A. and Hellinga, L.A., “Graduated Licensing Laws and Fatal Crashes of Teenage Drivers: A
National Study,” Traffic Injury Prevention, 11:240-248, 2010.
McEvoy, S.P., et al, “Role of Mobile Phones in Motor Vehicle Crashes Resulting in Hospital Attendance: A Case-Crossover Study,” British
Medical Journal, 428-432, 2005.
Miller, T.R. & Zaloshnja, E., “On a Crash Course: The Dangers and Health Costs of Deficient Roadways,” Pacific Institute for Research and
Evaluation, commissioned by Transportation Construction Coalition, May 2009.
Minnesota Department of Public Safety, Minnesota Motor Vehicle Crash Facts 2008 and 2011.
Morgan, C., “Effectiveness of lap/shoulder belts in the back outboard seating positions,” NHTSA, DOT HS 808 945, 1999.
Morse, B.J., Elliot, D.S., “Hamilton County Drinking and Driving Study, 30 Month Report,” 1990.
Mothers Against Drunk Driving, 2016 Campaign to Eliminate Drunk Driving Report, February 2016.
Mothers Against Drunk Driving, “Fifth Anniversary Report to the Nation.” November 2011.
Mothers Against Drunk Driving, Statistics, accessed at www.madd.org/drunk-driving/about/drunk-driving-statistics.html.
National Governors Association and National Association of State Budget Officers. The Fiscal Survey of the States: An Update of State Fiscal
Conditions, Fall 2010.
Nationwide Mutual Insurance Company, “Driving While Distracted Research Results,” July 2010.
Naumann, R.B., Dellinger, A.M., Zaloshnja, E., Lawrence, B.A., Miller, T.R., “Incidence and Total Lifetime Costs of Motor Veh icle-Related Fatal
and Nonfatal Injury by Road User Type, United States, 2005,” Traffic Injury Prevention 11:4, 353-360, 2010.
New York Times, Technology Series: “Driven to Distraction.” Entire series can be found on this website:
http://topics.nytimes.com/top/news/technology/series/driven_to_distraction/index.html, 2009.
NHTSA, “Drinking and Driving Tips, Stops by the Police, and Arrests: Analyses of the 1995 Survey of Drinking and Driving Attitudes and
Behavior,” DOT HS 809 184, 2000.
NHTSA, “Ignition Interlocks—What You Need to Know: A Toolkit for Policymakers, Highway Safety Professionals, and Advocates,” DOT HS 811
246, November 2009.
SOURCE INFORMATION (CONT’D)
EMBARGOED UNTIL
1/22/1
8

January 2018 Advocates for Highway and Auto Safety 54
NHTSA, National Evaluation of Graduated Driver Licensing Programs, DOT HS 810 614, 2006,
NHTSA, Seat Belt Use in 2016 - Overall Results, DOT HS 812 351, November 2016.
NHTSA, The Economic Impact of Motor Vehicle Crashes, 2010 (Revised), DOT HS 812 013, May 2015.
NHTSA, The Nation’s Top Strategies to Stop Impaired Driving: Primary Seat Belt Laws, 2007.
NHTSA, Traffic Safety Facts, 2016 Fatal Motor Vehicle Crashes: Overview, DOT HS 812 456, October 2017.
NHTSA, Traffic Safety Facts, Alcohol Impaired Driving, DOT HS 812 450, October 2017.
NHTSA, Traffic Safety Facts, Children, DOT HS 812 271, May 2016.
NHTSA, Traffic Safety Facts, Lives Saved in 2016 by Restraint Use and Minimum Drinking Age Laws,” DOT HS 812 454, October 2017.
NHTSA, Traffic Safety Facts, Motorcycles, DOT HS 812 353, December 2016.
NHTSA, Traffic Safety Facts, Occupant Protection, DOT HS 812 262, April 2016.
NHTSA, Traffic Safety Facts Research Note, “2015 Motor Vehicle Crashes—Overview,” DOT HS 812 318, August 2016.
NHTSA, Traffic Safety Facts, Research Note, “Calculating Lives Saved by Motorcycle Helmets,” DOT HS 809 861 2005.
NHTSA, Traffic Safety Facts, Research Note, “Crash Outcome Data Evaluation System Project Seat Belt and Helmet Analysis,” 1996.
NHTSA, Traffic Safety Facts Research Note, “National Child Restraint Use Special Study”, DOT HS 811 679, 2012.
NHTSA, Traffic Safety Facts, Research Note, “Child Restraint Use in 2008—Overall Results,” DOT HS 811 135, 2009.
NHTSA, Traffic Safety Facts, Research Note, “Distracted Driving 2014,” DOT HS 812 260, April 2016.
NHTSA, Traffic Safety Facts, Research Note, “Driver Electronic Device Use in 2015,” DOT HS 812 326, September 2016.
NHTSA, Traffic Safety Facts: Traffic Tech—Technology Transfer Series, Number 323. Estimated Minimum
Savings to a State’s Medicaid Budget by Implementing A Primary Seat Belt Law: Arkansas, Colorado, Florida, and Missouri. March 2007.
NHTSA, Traffic Safety Facts: Traffic Tech—Technology Transfer Series, Number 406. Determining the Relationship of Primary Seat Belt Laws
to Minority Ticketing. September 2011.
NHTSA, Traffic Safety Facts: Young Drivers, DOT HS 812 278, May 2016.
ORC International for Liberty Mutual Insurance and SADD, “Older, Not Wiser: New Study Reveals Teens Becoming Riskier Drivers As They
Enter Senior Year,” August 2017.
Orsay, E.M.; Muelleman, R.L.; Peterson, T.D.; Jurisic, D.H.; Kosasih, J.B.; and Levy, P., “Motorcycle Helmets and Spinal Injuries: Dispelling
the Myth,” Annals of Emergency Medicine 23:802-06, 1994.
Preusser, D.F. & Tison, J., “GDL Then and Now,” Journal of Safety Research, 38(2), 159-163, 2007.
Quinlan, K., et al., “Characteristics of Child Passenger Deaths and Injuries Involving Drinking Drivers.”, Journal of the American Medical
Association,” 283 (17): 2249-52, 2000.
SOURCE INFORMATION (CONT’D)
EMBARGOED UNTIL
1/22/1
8

January 2018 Advocates for Highway and Auto Safety 55
Redelmeier D.A., Tibshirani R.J., “Association between Cellular-Telephone Calls and Motor Vehicle Collisions,” The New England Journal of
Medicine; 336(7):453-58, 1997.
Research and Innovative Technology Administration, Bureau of Transportation Statistics. State Transportation Statistics, 2009.
Shults, et al., The Children’s Hospital of Philadelphia, 2015.
Simon v. Sargent, D.C.Mass.1972, 346 F.Supp. 277, affirmed 39 S.Ct. 463, 409 U.S. 1020, 34 L.Ed.2d 312.
State Farm Mutual Automobile Insurance Company, “Teens, Smartphones and Distracted Driving,” July 2016.
Strayer D.L., Drews F.A., Crouch D.J., “A Comparison of the Cell Phone Driver and the Drunk Driver,” Human Factors; 48:381-391, 2006.
Sun, K., Bauer, M.J., Hardman, S., “Effects of Upgraded Child Restraint Law Designed to Increase Booster Seat Use in New York,” Pediatrics,
2010.
Vogel, S., “Teen Driver Menace: Text Messaging- Studies Show Texting While Driving Is Epidemic,” Parenting Teens, October 22, 2007.
Weber K., “Crash protection for child passengers. A review of best practice.” University of Michigan Transportation Research Institute
(UMTRI). 2000311-27.27), 2000.
Weiss, H., Ph.D., MPH, MS, Agimi, Y.l., MPH, and Steiner, C., MD, MPH, “Youth Motorcycle-Related Brain Injury by State Helmet Law Type:
United States 2005 2007,” Pediatrics, November 2010.
Williams, A.F., “Contribution of the Components of Graduated Licensing to Crash Reductions,” Journal of Safety Research, 38(2), 177-184,
2007.
Williams, A.F., Braitman, K.A., and McCartt, A.T., “Views of Parents of Teenagers about Licensing Policies: a National Survey,” 2010.
The Wireless Association, “Wireless Quick Facts, Year End Figures,” CTIA.
Wisconsin Department of Transportation, Mobility Accountability Preservation Safety Service Performance Improvement Report, 2013.
SOURCE INFORMATION (CONT’D)
EMBARGOED UNTIL
1/22/1
8

January 2018 Advocates for Highway and Auto Safety 56
Thanks to the many individuals and organizations whose websites and staff provided background and state law
information for the 2018 Roadmap of State Highway Safety Laws.
American Automobile Association (AAA) Foundation for Traffic Safety
www.aaafoundation.org
American Public Health Association (APHA)
www.apha.org
Brain Injury Association of America (BIA)
www.biausa.org
Federal Highway Administration (FHWA)
www.fhwa.dot.gov
Federal Motor Carrier Safety Administration (FMCSA)
www.fmcsa.dot.gov
Governors Highway Safety Association (GHSA)
www.ghsa.org
Insurance Institute for Highway Safety (IIHS)
www.iihs.org
Mothers Against Drunk Driving (MADD)
www.madd.org
National Conference of State Legislatures (NCSL)
www.ncsl.org
National Highway Traffic Safety Administration (NHTSA) and the National Center for Statistics and Analysis
www.nhtsa.dot.gov
National Safety Council (NSC)
www.nsc.org
National Transportation Safety Board (NTSB)
www.ntsb.gov
Students Against Destructive Decisions (SADD)
www.sadd.org
Traffic Injury Research Foundation (TIRF)
www.trafficinjuryresearch.com
U.S. Centers for Disease Control and Prevention (CDC)
www.cdc.gov
Virginia Tech Transportation Institute
www.vtti.vt.edu
West Virginia University Injury Control Research Center
www.hsc.wvu.edu/icrc
SOURCE INFORMATION (CONT’D)
EMBARGOED UNTIL
1/22/1
8

January 2018 Advocates for Highway and Auto Safety 57
Advocates for Highway and Auto Safety is an alliance of consumer, health
and safety groups and insurance companies and agents working together to
make America's roads safer.
Advocates encourages adoption of federal and state laws, policies and
programs that save lives and reduce injuries. By joining its resources with
others, Advocates helps build coalitions to increase participation of a wide
array of groups in policy initiatives which advance highway and auto safety..
For more information, please visit www.saferoads.org.
Advocates for Highway and Auto Safety
750 First Street, NE, Suite 1130
Washington, D.C. 20002
202-408-1711
Follow us on Twitter: @SafeRoadsNow
Advocates would like to recognize the dedication and commitment of our
Board of Directors. Their support and safety leadership have resulted in
adoption of laws, regulations and programs that are saving lives, preventing
injuries and containing costs resulting from motor vehicle crashes.
Advocates would like to thank Cathy Barzey, Lisa Drew, Tara Gill, Jackie Gillan,
Henry Jasny, Allison Kennedy, Shaun Kildare, Peter Kurdock and Eric Naing
for their contributions to the 2018 Roadmap of State Highway Safety Laws.
Also, special thanks to Jamie Douglas of DAYLIGHT for the cover design.
EMBARGOED UNTIL
1/22/1
8


![ADVOCATES ACT - Kenya Investment Authority...LAWS OF KENYA ADVOCATES ACT CHAPTER 16 Revised Edition 2012 [1989] Published by the National Council for Law Reporting with the Authority](https://static.fdocuments.net/doc/165x107/5eb7fca9b2ca0e470778bf15/advocates-act-kenya-investment-authority-laws-of-kenya-advocates-act-chapter.jpg)