Protozoan Grazing and Bacterial Production in Stratified Lake … · acid-base hydrolysis mayhave...
9
APPLIED AND ENVIRONMENTAL MICROBIOLOGY. JUlY 1989. P. 1787-1795 0099-2240/89/071787-09$02 .00/0 Copyright © 1989, American Society for Microbiology Protozoan Grazing and Bacterial Production in Stratified Lake Vechten Estimated with Fluorescently Labeled Bacteria and by Thymidine Incorporation JAAP BLOEM,t* FRANK M. ELLENBROEK, MARIE-JOSE B. BAR-GILISSEN, AND THOMAS E. CAPPENBERG Viji'erhoJ Labhoratorv, Lihnnologicbal Ilnstitite, 3631 AC Nieuiversliis, The Netlher-lIanlds Received 13 January 1989/Accepted 24 April 1989 In stratified Lake Vechten, The Netherlands, protozoan grazing was estimated on the basis of uptake of fluorescently labeled bacteria and compared with bacterial production estimated on the basis of thymidine incorporation. By using a grazer-free mixed bacterial population from the lake in continuous culture, an empirical relationship between cell production and thymidine incorporation was established. Thymidine incorporation into total cold-trichloroacetic-acid-insoluble macromolecules yielded a relatively constant empirical conversion factor of ca. 1018 (range, 0.38 x 10 1 to 1.42 x 10¹⁸) bacteria mol of thymidine-' at specific growth rates (,u) ranging from 0.007 to 0.116 h-'. Although thymidine incorporation has been assumed to measure DNA synthesis, thymidine incorporation appeared to underestimate the independently measured bacterial DNA synthesis by at least 1.5- to 13-fold, even if all incorporated label was assumed to be in DNA. However, incorporation into DNA was found to be insignificant as measured by conventional acid-base hydrolysis. Methodological problems of the thymidine technique are discussed. Like the cultures, Lake Vechten bacteria showed considerable thymidine incorporation into total macromolecules, but no significant incorpo- ration into DNA was found by acid-base hydrolysis. This applied not only to the low-oxygen hypo- and metalimnion but also to the aerobic epilimnion. Thus, the established empirical conversion factor for thymidine incorporation into total macromolecules was used to estimate bacterial production. Maximum production rates (141 x 106 bacteria liter-' h-'; ,u, 0.012 h-') were found in the metalimnion and were 1 order of magnitude higher than in the epi- and hypolimnion. In all three strata, the estimated bacterial production was roughly balanced by the estimated protozoan grazing. Heterotrophic nanoflagellates were the major consumers of the bacterial production and showed maximum numbers (up to 40 x 106 heterotrophic nanoflagellates liter-') in the microaerobic metalimnion. Protozoa, especially heterotrophic nanoflagellates (HNAN; diameter, 2 to 20 p.m), are recognized as major consumers of bacteria in aquatic ecosystems (3). Since most studies were performed in marine systems, relatively little is known about these protozoa in freshwater. In Lake Vechten, The Netherlands, maximum HNAN abundances of 40 x 106 HNAN liter-' were found in the microaerobic metalimnion in 1985 (5). Long-term grazing experiments with selectively filtered lake water suggested that HNAN have the potential to harvest all daily bacterial production. Production was estimated on the basis of thymidine incor- poration into total cold-trichloroacetic-acid (TCA)-insoluble macromolecules (11). However, in situ incubations with radioactive thymidine were not possible, and the samples had to be incubated after transport to the laboratory. More- over, an empirical incorporation-to-production conversion factor was not established, and therefore a literature-derived value of 2 x 10¹⁸ bacteria mol of thymidine'1 (21) was used. Recently, McDonough et al. (19) reported that the thymidine approach can lead to underestimates of bacterial production, especially in meta- and hypolimnetic samples with low oxygen concentrations. Such samples showed high thymi- dine incorporation into TCA-insoluble macromolecules, but only 33% (range, 12 to 57%) was found in DNA by acid-base * Corresponding author. t Present address: Institute for Soil Fertility. P.O. Box 30003. 9750 RA Haren. The Netherlands. hydrolysis. Thus, more research was needed on thymidine incorporation and bacterial production in Lake Vechten. Although the magnitude of protozoan bacterivory may be estimated on the basis of direct cell counts in long-term incubations (1, 5), short-term methods for in situ estimates are preferable, and recently Sherr et al. (29) introduced the use of fluorescently labeled bacteria (FLB) as tracers for in situ grazing experiments. In two-stage continuous cultures, protozoan ingestion rates appeared to be measured accu- rately by uptake of FLB (7) when 2% glutaraldehyde was used to fix HNAN. However, glutaraldehyde fixation has been found to cause egestion of FLB and severe underesti- mation of grazing, which was prevented by using van der Veer fixative, consisting of 2% acrolein, 2% glutaraldehyde, and 1% tannic acid (final concentrations after 1:1 dilution with fixative) (30). In the present study, thymidine incorporation into total cold-I'CA-insoluble macromolecules, as well as hot-NaOH and hot-TCA precipitates, was investigated in stratified Lake Vechten and in cultures. Methodological problems of the thymidine technique are discussed. From cultures an empir- ical conversion factor was obtained to estimate in situ bacterial production on the basis of thymidine incorporation into total macromolecules. The effect of glutaraldehyde and van der Veer fixative on FLB uptake was examined. On the basis of FLB uptake, in situ HNAN and ciliate grazing on bacteria was estimated and compared with the estimated bacterial production in the epi-, meta-, and hypolimnion of Lake Vechten. 1787 Vol. 55, No. 7 on March 7, 2020 by guest http://aem.asm.org/ Downloaded from
Transcript of Protozoan Grazing and Bacterial Production in Stratified Lake … · acid-base hydrolysis mayhave...

APPLIED AND ENVIRONMENTAL MICROBIOLOGY. JUlY 1989. P. 1787-17950099-2240/89/071787-09$02 .00/0Copyright © 1989, American Society for Microbiology
Protozoan Grazing and Bacterial Production in Stratified LakeVechten Estimated with Fluorescently Labeled Bacteria
and by Thymidine IncorporationJAAP BLOEM,t* FRANK M. ELLENBROEK, MARIE-JOSE B. BAR-GILISSEN, AND THOMAS E. CAPPENBERG
Viji'erhoJ Labhoratorv, Lihnnologicbal Ilnstitite, 3631 AC Nieuiversliis, The Netlher-lIanlds
Received 13 January 1989/Accepted 24 April 1989
In stratified Lake Vechten, The Netherlands, protozoan grazing was estimated on the basis of uptake offluorescently labeled bacteria and compared with bacterial production estimated on the basis of thymidineincorporation. By using a grazer-free mixed bacterial population from the lake in continuous culture, an
empirical relationship between cell production and thymidine incorporation was established. Thymidineincorporation into total cold-trichloroacetic-acid-insoluble macromolecules yielded a relatively constantempirical conversion factor of ca. 1018 (range, 0.38 x 10 1 to 1.42 x 10¹⁸) bacteria mol of thymidine-' atspecific growth rates (,u) ranging from 0.007 to 0.116 h-'. Although thymidine incorporation has been assumedto measure DNA synthesis, thymidine incorporation appeared to underestimate the independently measuredbacterial DNA synthesis by at least 1.5- to 13-fold, even if all incorporated label was assumed to be in DNA.However, incorporation into DNA was found to be insignificant as measured by conventional acid-basehydrolysis. Methodological problems of the thymidine technique are discussed. Like the cultures, Lake Vechtenbacteria showed considerable thymidine incorporation into total macromolecules, but no significant incorpo-ration into DNA was found by acid-base hydrolysis. This applied not only to the low-oxygen hypo- andmetalimnion but also to the aerobic epilimnion. Thus, the established empirical conversion factor for thymidineincorporation into total macromolecules was used to estimate bacterial production. Maximum production rates(141 x 106 bacteria liter-' h-'; ,u, 0.012 h-') were found in the metalimnion and were 1 order of magnitudehigher than in the epi- and hypolimnion. In all three strata, the estimated bacterial production was roughlybalanced by the estimated protozoan grazing. Heterotrophic nanoflagellates were the major consumers of thebacterial production and showed maximum numbers (up to 40 x 106 heterotrophic nanoflagellates liter-') inthe microaerobic metalimnion.
Protozoa, especially heterotrophic nanoflagellates(HNAN; diameter, 2 to 20 p.m), are recognized as majorconsumers of bacteria in aquatic ecosystems (3). Since moststudies were performed in marine systems, relatively little isknown about these protozoa in freshwater. In LakeVechten, The Netherlands, maximum HNAN abundances of40 x 106 HNAN liter-' were found in the microaerobicmetalimnion in 1985 (5). Long-term grazing experimentswith selectively filtered lake water suggested that HNANhave the potential to harvest all daily bacterial production.Production was estimated on the basis of thymidine incor-poration into total cold-trichloroacetic-acid (TCA)-insolublemacromolecules (11). However, in situ incubations withradioactive thymidine were not possible, and the sampleshad to be incubated after transport to the laboratory. More-over, an empirical incorporation-to-production conversionfactor was not established, and therefore a literature-derivedvalue of 2 x 10¹⁸ bacteria mol of thymidine'1 (21) was used.Recently, McDonough et al. (19) reported that the thymidineapproach can lead to underestimates of bacterial production,especially in meta- and hypolimnetic samples with lowoxygen concentrations. Such samples showed high thymi-dine incorporation into TCA-insoluble macromolecules, butonly 33% (range, 12 to 57%) was found in DNA by acid-base
* Corresponding author.t Present address: Institute for Soil Fertility. P.O. Box 30003.
9750 RA Haren. The Netherlands.
hydrolysis. Thus, more research was needed on thymidineincorporation and bacterial production in Lake Vechten.Although the magnitude of protozoan bacterivory may be
estimated on the basis of direct cell counts in long-termincubations (1, 5), short-term methods for in situ estimatesare preferable, and recently Sherr et al. (29) introduced theuse of fluorescently labeled bacteria (FLB) as tracers for insitu grazing experiments. In two-stage continuous cultures,protozoan ingestion rates appeared to be measured accu-
rately by uptake of FLB (7) when 2% glutaraldehyde was
used to fix HNAN. However, glutaraldehyde fixation hasbeen found to cause egestion of FLB and severe underesti-mation of grazing, which was prevented by using van derVeer fixative, consisting of 2% acrolein, 2% glutaraldehyde,and 1% tannic acid (final concentrations after 1:1 dilutionwith fixative) (30).
In the present study, thymidine incorporation into totalcold-I'CA-insoluble macromolecules, as well as hot-NaOHand hot-TCA precipitates, was investigated in stratified LakeVechten and in cultures. Methodological problems of thethymidine technique are discussed. From cultures an empir-ical conversion factor was obtained to estimate in situbacterial production on the basis of thymidine incorporationinto total macromolecules. The effect of glutaraldehyde andvan der Veer fixative on FLB uptake was examined. On thebasis of FLB uptake, in situ HNAN and ciliate grazing onbacteria was estimated and compared with the estimatedbacterial production in the epi-, meta-, and hypolimnion ofLake Vechten.
1787
Vol. 55, No. 7
on March 7, 2020 by guest
http://aem.asm
.org/D
ownloaded from

1788 BLOEM ET AL.
MATERIALS AND METHODS
Sampling. Lake Vechten is ca. 10 m deep, monomictic,and stratified from May until October, showing hypolimneticoxygen depletion (5, 33). Oxygen and temperature profileswere measured with oxygen indicator model 2607 (probe2112; Orbisphere, Geneva, Switzerland). Over the deepestarea between 9 and 10 a.m., samples were taken with aFriedinger sampler (capacity, 5 liters; length, 0.60 m) for cellcounts. For FLB uptake and thymidine incorporation mea-surements, a peristaltic pump was used to prevent aerationof low-oxygen samples (19). The incubation tubes wereflushed with sample water, filled, and closed under water (ina bucket) with a screw cap containing a rubber septum.Through the septum, FLB, thymidine, and fixative wereadded with a syringe, while a second empty syringe receivedthe excess water. The incubations started as soon as possibleafter sampling and were performed in dark (aluminum foil-wrapped) tubes at in situ temperatures in buckets with waterfrom the depths at which the samples were taken.
Counting. Samples were fixed immediately with 1% (finalconcentration) glutaraldehyde, and protozoa (HNAN andciliates) were stained with primulin and counted directly onpolycarbonate membrane filters (Nuclepore Corp., Pleasan-ton, Calif.) by epifluorescence microscopy (6). For bacteria,the DAPI technique (24) was used, and chroococcoid cya-nobacteria were counted by the autofluorescence of phyco-cyanin (5). For biovolume estimates, 100 organisms persample were measured by eyepiece micrometer (standarddeviation [SD] of duplicates, .20%), and volumes werecalculated on the basis of lengths and widths, assuming aspherical or cylindrical shape.Thymidine incorporation. It appeared necessary to sample
low-oxygen meta- and hypolimnion water with a peristalticpump and to perform thymidine incubations immediatelyafter sampling. Storage for 1 h at the in situ temperature oron ice caused 50% reduced thymidine incorporation. Asimilar reduction was found when low-oxygen samples wereaerated by using the Friedinger sampler.
In a field sample, thymidine incorporation was linear withtime for 5 h with 5 nM thymidine. Higher concentrations ofup to 30 nM did not increase incorporation. Thus, thethymidine concentration did not limit the incorporation rate(21). For cultures, 20 nM and occasionally also 200 nM wasused, because yeast extracts in the medium may containsome (unlabeled) thymidine.Two Formalin-killed blanks and five (or three) replicates
were incubated for 30 min with [methyl-3H]thymidine (3.3TBq mmol-1; Amersham Ltd., Amersham, United King-dom). A thymidine concentration of 20 nM was used for15-ml culture samples, and 5 nM was used for 40-ml fieldsamples. The samples were fixed with 2% (final concentra-tion) formaldehyde. Each replicate was split into threeportions which were (i) extracted with ice-cold 5% TCA for5 min, (ii) hydrolyzed at 60°C with 1 (or 0.5) N NaOH for 1h, or (iii) hydrolyzed at 100°C with 20% TCA for 30 min asdescribed by Riemann and S0ndergaard (26) to obtain (i)total (cold-TCA-insoluble) macromolecules, (ii) DNA plusproteins, and (iii) proteins, respectively. This conventionalacid-base hydrolysis may have serious shortcomings (27, 28)but facilitates comparison with most previous studies, whichoften reported a high fraction of label in DNA. The precip-itated macromolecular fractions were collected on 0.2-,um-pore-size cellulose nitrate filters (Schleicher & Schuell, Inc.,Keene, N.H.), which were dissolved in 1 ml of ethyl acetate.Then 10 ml of Instagel II (Packard Instrument Co., Inc.,
Rockville, Md.) was added, and radioactivity was assayed ina Packard Tricarb 4530 liquid scintillation counter. Countingefficiency was determined by automatic external standardi-zation. The fraction of label incorporated into DNA wascalculated on the basis of the difference between the hot-NaOH precipitate (ii) and the hot-TCA precipitate (iii) di-vided by the cold-TCA precipitate (i).
Conversion factor. On the basis of simultaneous measure-ments of production, determined from direct cell counts, andthymidine incorporation, an empirical conversion factor forcalculation of bacterial production on the basis of thymidineincorporation can be obtained (15, 17, 25). Empirical con-version factors were determined with a grazer-free (filteredwith a 1-pLm-pore-size Nuclepore filter), mixed bacterialpopulation from Lake Vechten. The absence of grazers waschecked microscopically. The bacteria were grown on0.001% (wt/vol) Knop solution (18) supplemented with 50 mgof yeast extract liter-' (final concentration; Oxoid Ltd.,London, United Kingdom) at 15°C in the dark in aeratedtwo-stage continuous cultures (7) and a batch culture.
Exponentially growing bacteria from the latter were di-luted 10-fold with sterile growth medium, and cell numbers(N) and incorporation rates (I) were monitored for 24 h. Ifbacterial growth and thymidine incorporation are closelycoupled, linear regressions of In N and In I versus time musthave equal slopes. The slope of either curve is then thespecific growth rate (p.). Furthermore, the computed yintercept (b) of the incorporation regression, which is anestimate of the initial incorporation rate, can be used tocalculate the conversion factor, C (8). According to Kirch-man et al. (15), C = [1.. N(O)]Ieh, where N(0) is the initialbacterial abundance.
In continuous cultures at steady state, bacterial produc-tion in stage 1 is p. N, where p. equals the dilution rate, D,and production can simply be divided by the thymidineincorporation rate to obtain C. Thus, C was determined atspecific growth rates of 0.007, 0.029, and 0.116 h-1. Inaddition, bacterial DNA contents were determined fluoro-metrically by using Hoechst 33258 (22), and the frequency ofdividing cells (FDC) of DAPI-stained bacteria was estimatedas described by Hagstrom et al. (12). At least 1,000 cells and100 fields per sample were counted.FLB uptake. Bacteria from stage 2 of the continuous
culture were concentrated by centrifugation (15 min; 22,000x g; MSE High Speed 18; Measuring and Scientific Equip-ment Ltd.) and stained with 200 mg of 5-(4,6-dichlorotriazin-2-yl) aminofluorescein (Sigma Chemical Co., St. Louis, Mo.)liter-' (final concentration) for 2 h at 60°C as described bySherr et al. (29). However, instead of sonication, a fewminutes of vibration with a test tube mixer (Genie; TheVortex Manufacturing Co., Cleveland, Ohio) was used todisperse any remaining bacterial clumps. Thus, a suspensionof 5.65 x 10⁸ FLB ml-1 was obtained, and 2-ml portionswere stored in a freezer. Before use, a portion was thawed,diluted to 15 ml with distilled water, and redispersed. On thelake, a 0.5-ml suspension containing 38 x 106 FLB wasadded per 14.5-ml tube with each field sample, resulting in afinal concentration of 2.7 x 10⁶ FLB ml-1, which was 8 to24% of the total bacterial abundance. Seven tubes persampling depth were incubated, and for 30 min a tube wasfixed every 5 min by injecting 1.5 ml of ice-cold 10%glutaraldehyde, resulting in a 1% final concentration, and puton ice. On the same day in the laboratory, the protozoa werecollected on 1-p.m-pore-size Nuclepore filters, stained withprimulin, mounted on slides with immersion oil, and storedat -30°C (6). The increase in the average number of FLB
APPL. ENVIRON. MICROBIOL.
on March 7, 2020 by guest
http://aem.asm
.org/D
ownloaded from
PROTOZOAN GRAZING AND BACTERIAL PRODUCTION
- 1000-r
e
z
2 100
z
I
CZ
0 10 20 30TIME (h)
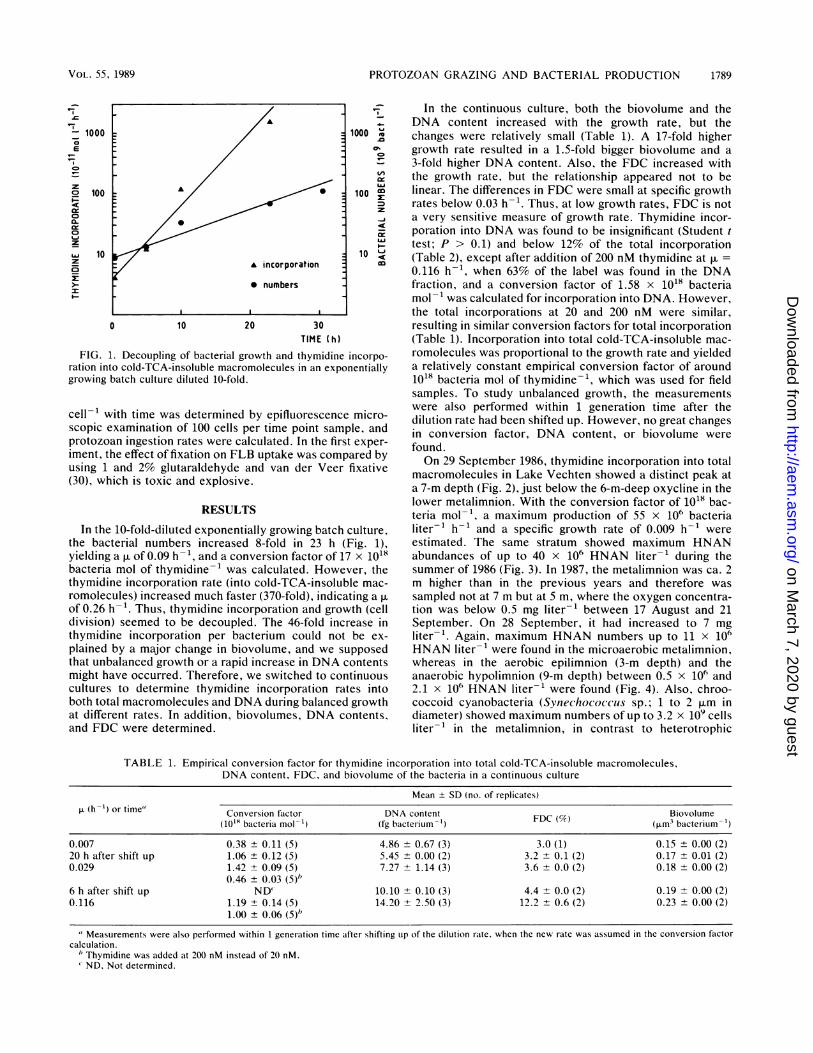
FIG. 1. Decoupling of bacterial growth and thymidine incorpo-
ration into cold-TCA-insoluble macromolecules in an exponentiallygrowing batch culture diluted 10-fold.
cell-' with time was determined by epifluorescence micro-scopic examination of 100 cells per time point sample, andprotozoan ingestion rates were calculated. In the first exper-iment, the effect of fixation on FLB uptake was compared byusing 1 and 2% glutaraldehyde and van der Veer fixative(30), which is toxic and explosive.
RESULTS
In the 10-fold-diluted exponentially growing batch culture,the bacterial numbers increased 8-fold in 23 h (Fig. 1),yielding a of 0.09 h-', and a conversion factor of 17 x 1018bacteria mol of thymidine-1 was calculated. However, thethymidine incorporation rate (into cold-TCA-insoluble mac-romolecules) increased much faster (370-fold), indicating a
of 0.26 h-1. Thus, thymidine incorporation and growth (celldivision) seemed to be decoupled. The 46-fold increase inthymidine incorporation per bacterium could not be ex-plained by a major change in biovolume, and we supposedthat unbalanced growth or a rapid increase in DNA contentsmight have occurred. Therefore, we switched to continuouscultures to determine thymidine incorporation rates intoboth total macromolecules and DNA during balanced growthat different rates. In addition, biovolumes, DNA contents,and FDC were determined.
In the continuous culture, both the biovolume and theDNA content increased with the growth rate, but thechanges were relatively small (Table 1). A 17-fold highergrowth rate resulted in a 1.5-fold bigger biovolume and a
3-fold higher DNA content. Also, the FDC increased withthe growth rate, but the relationship appeared not to belinear. The differences in FDC were small at specific growthrates below 0.03 h-'. Thus, at low growth rates, FDC is nota very sensitive measure of growth rate. Thymidine incor-poration into DNA was found to be insignificant (Student ttest; P > 0.1) and below 12% of the total incorporation(Table 2), except after addition of 200 nM thymidine at =
0.116 h-1, when 63% of the label was found in the DNAfraction, and a conversion factor of 1.58 x 10"8 bacteriamol--was calculated for incorporation into DNA. However,the total incorporations at 20 and 200 nM were similar,resulting in similar conversion factors for total incorporation(Table 1). Incorporation into total cold-TCA-insoluble mac-romolecules was proportional to the growth rate and yieldeda relatively constant empirical conversion factor of around1018 bacteria mol of thymidine-1, which was used for fieldsamples. To study unbalanced growth, the measurementswere also performed within 1 generation time after thedilution rate had been shifted up. However, no great changesin conversion factor, DNA content, or biovolume werefound.On 29 September 1986, thymidine incorporation into total
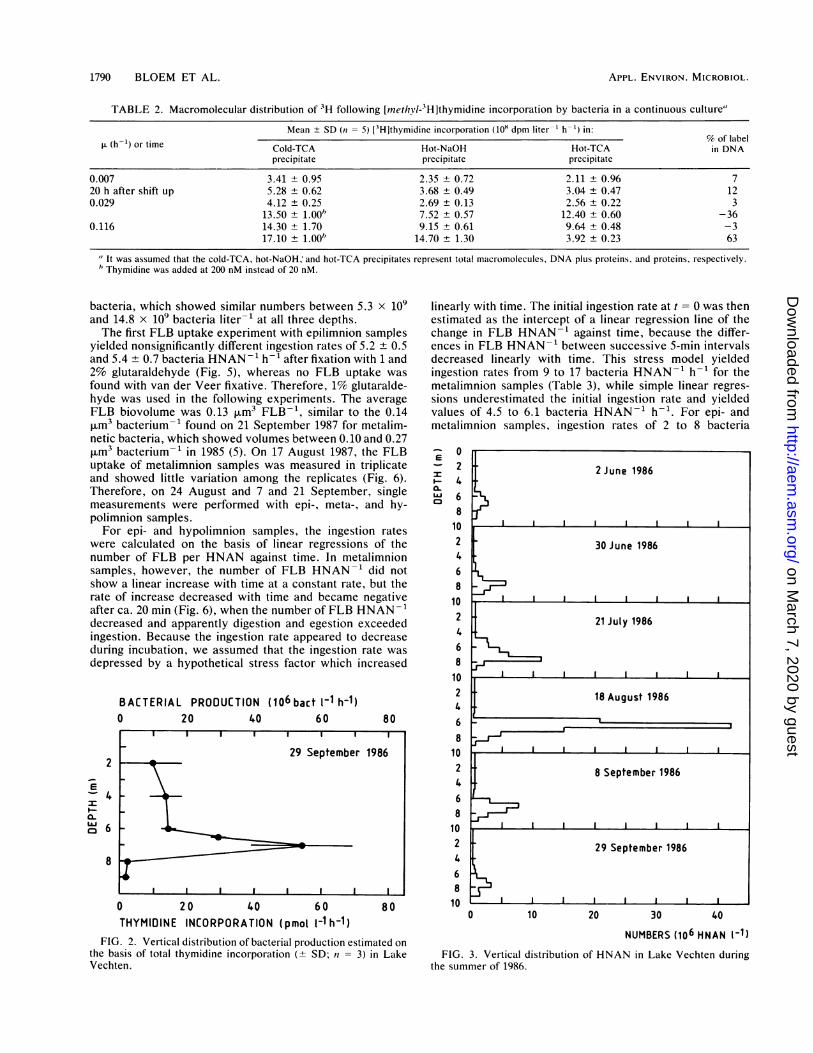
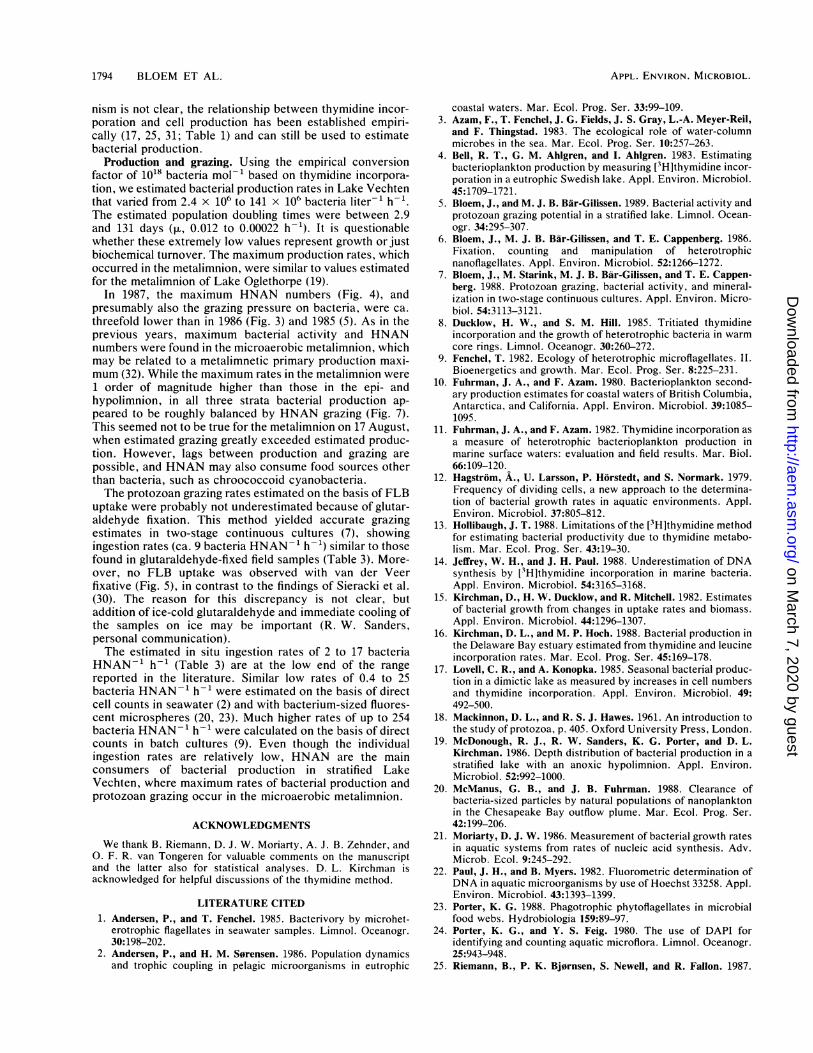
macromolecules in Lake Vechten showed a distinct peak ata 7-m depth (Fig. 2), just below the 6-m-deep oxycline in thelower metalimnion. With the conversion factor of 1018 bac-teria mol-1, a maximum production of 55 x 106 bacterialiter-1 h-' and a specific growth rate of 0.009 h-1 wereestimated. The same stratum showed maximum HNANabundances of up to 40 x 106 HNAN liter-' during thesummer of 1986 (Fig. 3). In 1987, the metalimnion was ca. 2m higher than in the previous years and therefore wassampled not at 7 m but at 5 m, where the oxygen concentra-tion was below 0.5 mg liter-' between 17 August and 21September. On 28 September, it had increased to 7 mgliter-'. Again, maximum HNAN numbers up to 11 x 106HNAN liter-1 were found in the microaerobic metalimnion,whereas in the aerobic epilimnion (3-m depth) and theanaerobic hypolimnion (9-m depth) between 0.5 x 10⁶ and2.1 x 106 HNAN liter-' were found (Fig. 4). Also, chroo-coccoid cyanobacteria (Synechococcus sp.; 1 to 2 pLm indiameter) showed maximum numbers of up to 3.2 x 10' cellsliter-1 in the metalimnion, in contrast to heterotrophic
TABLE 1. Empirical conversion factor for thymidine incorporation into total cold-TCA-insoluble macromolecules,DNA content, FDC, and biovolume of the bacteria in a continuous culture
Mean + SD (no. of replicates)p (h-') or time" Conversion factor DNA content Biovolume
(101X bacteria mol-1) (fg bacterium-') FDC () (,m3 bacterium-')
0.007 0.38 ± 0.11 (5) 4.86 ± 0.67 (3) 3.0 (1) 0.15 + 0.00 (2)20 h after shift up 1.06 ± 0.12 (5) 5.45 ± 0.00 (2) 3.2 ± 0.1 (2) 0.17 ± 0.01 (2)0.029 1.42 + 0.09 (5) 7.27 ± 1.14 (3) 3.6 ± 0.0 (2) 0.18 ± 0.00 (2)
0.46 ± 0.03 (5)"6 h after shift up ND' 10.10 ± 0.10 (3) 4.4 ± 0.0 (2) 0.19 ± 0.00 (2)0.116 1.19 ± 0.14 (5) 14.20 + 2.50 (3) 12.2 ± 0.6 (2) 0.23 ± 0.00 (2)
1.00 ± 0.06 (5)""Measurements were also performed within 1 generation time after shifting up of the dilution rate, when the new rate was assumed in the conversion factor
calculation.bThymidine was added at 200 nM instead of 20 nM.ND, Not determined.
VOL. 55, 1989 1789
on March 7, 2020 by guest
http://aem.asm
.org/D
ownloaded from
APPL. ENVIRON. MICROBIOL.
TABLE 2. Macromolecular distribution of 3H following [meth_l-33H]thymidine incorporation by bacteria in a continuous culture"
Mean ± SD (n = 5) [3Hlthymidine incorporation (108 dpm liter- h-') in:tL(h-')ortime % of label,u (h'l) or time Cold-TCA Hot-NaOH Hot-TCA in DNA
precipitate precipitate precipitate
0.007 3.41 ± 0.95 2.35 + 0.72 2.11 + 0.96 720 h after shift up 5.28 ± 0.62 3.68 + 0.49 3.04 + 0.47 120.029 4.12 ± 0.25 2.69 ± 0.13 2.56 + 0.22 3
13.50 ± 1.00" 7.52 ± 0.57 12.40 ± 0.60 -360.116 14.30 ± 1.70 9.15 ± 0.61 9.64 ± 0.48 -3
17.10 ± 1.00b 14.70 + 1.30 3.92 ± 0.23 63
"It was assumed that the cold-TCA, hot-NaOH, and hot-TCA precipitates represent total macromolecules, DNA plus proteins, and proteins, respectively." Thymidine was added at 200 nM instead of 20 nM.
bacteria, which showed similar numbers between 5.3 x 10⁹and 14.8 x 10⁹ bacteria liter-1 at all three depths.The first FLB uptake experiment with epilimnion samples
yielded nonsignificantly different ingestion rates of 5.2 0.5and 5.4 + 0.7 bacteria HNAN1 h-1 after fixation with 1 and2% glutaraldehyde (Fig. 5), whereas no FLB uptake was
found with van der Veer fixative. Therefore, 1% glutaralde-hyde was used in the following experiments. The averageFLB biovolume was 0.13 ,um3 FLB-1, similar to the 0.14pm3 bacterium-1 found on 21 September 1987 for metalim-netic bacteria, which showed volumes between 0.10 and 0.27pm3 bacterium-1 in 1985 (5). On 17 August 1987, the FLBuptake of metalimnion samples was measured in triplicateand showed little variation among the replicates (Fig. 6).Therefore, on 24 August and 7 and 21 September, singlemeasurements were performed with epi-, meta-, and hy-polimnion samples.
For epi- and hypolimnion samples, the ingestion rateswere calculated on the basis of linear regressions of thenumber of FLB per HNAN against time. In metalimnionsamples, however, the number of FLB HNAN-1 did notshow a linear increase with time at a constant rate, but therate of increase decreased with time and became negativeafter ca. 20 min (Fig. 6), when the number of FLB HNAN 1
decreased and apparently digestion and egestion exceededingestion. Because the ingestion rate appeared to decreaseduring incubation, we assumed that the ingestion rate wasdepressed by a hypothetical stress factor which increased
linearly with time. The initial ingestion rate at t = 0 was thenestimated as the intercept of a linear regression line of thechange in FLB HNAN-1 against time, because the differ-ences in FLB HNAN-' between successive 5-min intervalsdecreased linearly with time. This stress model yieldedingestion rates from 9 to 17 bacteria HNAN-' h-' for themetalimnion samples (Table 3), while simple linear regres-sions underestimated the initial ingestion rate and yieldedvalues of 4.5 to 6.1 bacteria HNAN-' h-'. For epi- andmetalimnion samples, ingestion rates of 2 to 8 bacteria
I-0.
LU
BACTERIAL PRODUCTION (106 bact t-1 h-1)
2
_4
I-
8
0 20 40 60
0 20 40 60THYMIDINE INCORPORATION (pmol lH h-1)
80
80
FIG. 2. Vertical distribution of bacterial production estimated on
the basis of total thymidine incorporation (+ SD; n = 3) in LakeVechten.
0
24
681024
68
1024
681024
68
1024
68
1024
6810
0 10 20 30 40
NUMBERS (106 HNAN 1-1)
FIG. 3. Vertical distribution of HNAN in Lake Vechten duringthe summer of 1986.
2 June 1986
~~~~~~~I
30 June 1986
( ~~~~~~21July 1986
[ ~~~~~18August 1986
8 September 1986
29 September 1986
1790 BLOEM ET AL.
on March 7, 2020 by guest
http://aem.asm
.org/D
ownloaded from

PROTOZOAN GRAZING AND BACTERIAL PRODUCTION
1-
z 10CD
15
10
15
10
5
1 7 24 31August
7 14 21 28September 1987
FIG. 4. Cell numbers of HNAN, bacteria, and chroococcoidcyanobacteria in the epi-, meta- and hypolimnion of Lake Vechtenfrom August to September of 1987. Samples were taken at 3-, 5-, and9-m depths.
HNAN-1 h-' were obtained. A similar ingestion rate wasfound for metalimnetic ciliates on 24 August (Table 3).However, since their numbers were 20-fold lower than thoseof the HNAN, their role in total protozoan bacterivory wasnegligible. In September, no FLB uptake by ciliates wasfound.
I
- 2.0
1.0
0
40.5% FLBv-
I * *,,,,-It
o
I0 10 20 30 40 50 60TIME (min)
FIG. 5. FLB uptake by HNAN fixed with 1% (0) or 2% (0)glutaraldehyde or van der Veer fixative (A).
LAKE VECHTEN E PILIMNION
1987 3m depth
Aug.17
METALIMNION HYPOLIMNION
5m depth 9 m depth
1.0
0.5
0
Aug.24 7
zIKJ
1.0
0.5
Sept. 7 10 13.0% FLB
0.5
Sept. 21 1.0 _ 7.8% FLB
05
00 10 20 30
10.0% FLB 10.7%FLB....8.3% FLB 8.7%FLB
30I,, 30I
0 10 20 30 0 10 20 30
TIME (min)
FIG. 6. FLB uptake by HNAN in stratified Lake Vechten fromAugust to September of 1987.
On the basis of ingestion rates (Table 3) and HNANnumbers (Fig. 4), total protozoan grazing on Lake Vechtenbacteria was estimated (Fig. 7). For dates when FLB uptakewas not measured, the value of the nearest date or theaverage of the two nearest dates was taken. Thymidineincorporation was measured on all of the dates. Like themixed bacterial population in the continuous culture, LakeVechten bacteria generally showed no significant (Student ttest; P > 0.05) thymidine incorporation into DNA at anysampling depth, although epilimnion samples showed amaximum of 17% incorporation into DNA on two dates(Table 4), as measured by acid-base hydrolysis. We used 1 NNaOH (26) to hydrolyze the so-called RNA fraction. Since0.5 N NaOH has also been used (11, 27), we compared thetwo concentrations on 7 September 1987 with metalimnionsamples. Both yielded no significant label in DNA. Thus,incorporation into total macromolecules had to be used toestimate production with the conversion factor establishedin the continuous culture. This purely empirical conversionfactor is based not on assumptions about DNA synthesis buton direct comparison of thymidine incorporation into cold-TCA-insoluble macromolecules and cell production. Theestimated bacterial production was of the same magnitude asthe estimated protozoan grazing in the epi- and hypolimnionas well as in the metalimnion, but the latter showed maxi-mum rates which were 1 order of magnitude higher thanthose in the other strata.
DISCUSSION
Decoupling of thymidine incorporation and growth. Thethymidine technique is based on the assumption that thymi-dine incorporation measures bacterial DNA synthesis and isdirectly proportional to bacterial production (10, 11). Previ-
VOL. 55, 1989 1791
on March 7, 2020 by guest
http://aem.asm
.org/D
ownloaded from

APPL. ENVIRON. MICROBIOL.
TABLE 3. Ingestion rates based on FLB uptake of HNAN and ciliates in the epi-, meta-, and hypolimnion of Lake Vechten fromAugust to September 1987
Mean ± SD ingestion rate"
Date Bacteria HNAN-i h'- in: Bacteria ciliate-' h-I
Epilimnion Metallimnion Hypolimnion in metalimnion
17 August ND 15.07 ± 4.38 ND ND24 August 2.65 ± 0.25 17.24 ± 5.46 2.27 ± 0.53 17.59 + 13.007 September 5.82 ± 0.47 11.90 + 4.32 2.27 + 0.16 021 September 8.04 ± 0.66 9.18 ± 4.27 4.37 ± 0.46 0
' Samples were taken at 3-, 5-, and 9-m depths. ND. Not determined.
ous incubation studies showed a close correspondence be-tween increases in thymidine incorporation rates and cellnumbers in marine as well as freshwater systems (4, 15, 17,25). However, in our batch culture, bacterial growth andthymidine incorporation seemed not to be coupled (Fig. 1).A similar decoupling was reported for oligotrophic oceanicbacteria by Ducklow and Hill (8). They concluded that thethymidine method is a useful tool but may involve someenticing mysteries associated with the biochemistry andphysiology of thymidine incorporation and bacterial growth.They considered several possibilities which might explainthe observed decoupling and suggested that oligotrophicbacteria may have the possibility to expand their DNA poolsrapidly. However, the bacteria in our continuous culturesshowed a relatively constant DNA content at different
EPILIMNION T15 _ _ 15
1 32.0ID.
% A S 1910
iniae15 150n )adpooongaig fle as nsrtfe
a3 5 50
5- 5
AugstSepemer 98
at3,5-, an 9idpts
growth rates (Table 1). Alternatively, increasing cell size,isotope dilution, or incorporation into macromolecules otherthan DNA might caiuse apparent decoupling of thymidineincorporation and growth. The first possibility is unlikely,since the biovolume did not increase much with the growthrate (Table 1).
Isotope dilution, hpwever, may have occurred in ourbatch culture, which showed a 46-fold increase in thymidineincorporation per bacterium in 23 h and a high initialconversion factor of 17 x 1018 bacteria mol-'. Kirchman andHoch (16) suggested that the most likely sause for high initialconversion factors and decoupling is extra- and intracellularisotope dilution. In our batch culture, exponentially growingbacteria were diluted 10-fold with fresh medium which mayhave contained unlabeled thymidine. This thymidine mayhave been assimilated by the growing bacteria, resulting in adecreasing concentration of unlabeled thymidine, decreasingisotope dilution, and increasing incorporation of labeledthymidine per bacterium. If such an artificial and decreasingisotope dilution caused the observed decoupling of thymi-dine incorporation and growth, the calculated high conver-sion factor is not ecologically relevant. Smits and Riemann(31) also found high conversion factors (average, 11.8 x 10¹⁸bacteria mol1) in diluted batch cultures of freshwaterbacteria at generation times below 20 h but not at longergeneration times, at which an average of 2.15 x 101' bacteriamol-1 was found. They hypothesized that in fast-growingbacteria, thymidine transport across the cell wall limitsthymidine incorporation, resulting in intracellular isotopedilution and a high conversion factor. Such a high conver-sion factor was not found in our continuous culture at theshortest generation time of 6 h (Table 1).
Incorporation into macromolecules other than DNA alsomay have caused decoupling, because in the batch culturesof Ducklow and Hill (8), as well as in our batch cultures, onlyincorporation into total macromolecules was measured. Inour continuous culture, usually no significant incorporationinto DNA was found (Table 2), although in a previous study(7) the same hydrolysis procedure yielded 39 to 45% incor-poration into DNA. Also, at all of the depths sampled inLake Vechten, thymidine seemed not to be significantlyincorporated into DNA (Table 4). Low (0 to 50%) incorpo-ration into DINA has been reported, especially for deeperwaters with low oxygen concentrations, whereas in aerobicsurface samples often most (80%) of the label appeared inDNA (17, 19, 27). Sometimes also in surface samples verylow (0%) incorporation into DNA has been found (13, 16).Robarts et al. (27) suggested that unbalanced growth maypromote nonspecific macromolecule labeling, whereas bal-anced growth may be indicated by a high fraction of the labelin DNA. This is not supported by our continuously cultured
1792 BLOEM ET AL.
on March 7, 2020 by guest
http://aem.asm
.org/D
ownloaded from

PROTOZOAN GRAZING AND BACTERIAL PRODUCTION
TABLE 4. Macromolecular distribution of 3H following [Iiedtli1l-3H]thymidine incorporation by bacteria in Lake Vechten"
Date (1987) and Mean + SD (ni 5) [3HHthymidine incorporation (105 dpm liter' h ')in: % of labelstratum Cold-TCA precipitate Hot-NatOH precipitate Hot-TCA precipitate in DNA
24 AugustEpilimnion 22.4 + 9.20 8.66 + 2.52 5.03 + 2.54 16Metalimnion 47.4 + 6.70 27.5 + 2.80 30.1 ± 3.40 -5Hypolimnion 25.6 + 3.20 6.11 + 0.61 7.21 + 0.49 -4
31 AugustEpilimnion 12.4 + 3.40 12.9 + 3.50 15.4 + 10.0 -20Metalimnion 54.8 + 4.70 24.3 ± 1.50 23.9 ± 10.0 1Hypolimnion 16.7 + 0.50 6.76 + 0.84 7.01 ± 2.26 -2
7 SeptemberEpilimnion 9.47 ± 1.21 6.96 + 0.79 5.34 ± 0.89 17Metalimnion 279 +46.0 233 50 225 27 3Hypolimnion 13.9 + 1.80 6.51 + 0.83 7.65 + 1.25 -8
' Samples were taken at 3-, 5-, and 9-m depths. It was assumed that the cold-TCA. hot-NaOH. and hot-TCA precipitates represent total macromolecules. DNAplus proteins, and proteins. respectively.
bacteria, which showed no significant DNA labeling duringbalanced growth at rates of 0.007 to 0.116 h-'.
Conversion factors. On the basis of theoretical consider-ations, a conversion factor of about 0.2 x 10"' to 1.3 x 10¹⁸bacteria mol' has been proposed for thymidine incorpora-tion into DNA (10). Fuhrman and Azam (11) found empiricalvalues of around 2 x 10¹⁸ bacteria mol1 based on incorpo-ration into DNA determined by acid-base hydrolysis. Al-though it is often recognized that thymidine incorporationinto DNA should be measured (27), this is rather timeconsuming and usually only incorporation into total macro-molecules has been determined. On the basis of incorpora-tion into total macromolecules, empirical conversion factorsof 1 x 10¹⁸ to 2 x 10¹⁸ bacteria mol-1 are generally found(17, 25, 31).The empirical conversion factors found in the continuous
culture for incorporation into macromolecules other thanDNA (Table 1) are surprisingly close to the proposed valuesfor incorporation into DNA (10). Since values between 0.38x 101' and 1.42 x 10's bacteria mol' were found at growthrates ranging from 0.007 to 0.116 h-V, a value of 1018 may beused to estimate the true growth rate within a factor of 2 or3. Also, since the bacterial DNA content varied by a factorof 3, no more accuracy could be expected if all bacterialDNA synthesis could be measured by thymidine incorpora-tion into purified DNA. However, measurement of onlyincorporation into DNA by conventional acid-base hydroly-sis may seriously underestimate the real production ofgrowing populations which seem to incorporate little or notritiated thymidine into DNA, like Lake Vechten bacteria atall sampling depths. In meta- and hypolimnetic samples fromLake Oglethorpe, McDonough et al. (19) also found highthymidine incorporation into macromolecules but only a lowfraction in DNA. In those samples, not incorporation intoDNA but incorporation into total macromolecules yieldedthe most realistic production estimates compared with leu-cine incorporation and FDC.
Using conventional acid-base hydrolysis, we and some-times others (13, 16, 27) found no significant incorporation of[methyl-3H]thymidine into DNA. Still, we found reasonable(10, 25, 31) empirical conversion factors for incorporationinto total macromolecules. A possible explanation may bethat the measured incorporation into tQtal cold-TCA-in-soluble macromolecules really represents incorporation intoDNA but that acid-base hydrolysis produces serious arti-
facts. The hot NaOH and hot TCA precipitates were as-sumed to represent DNA plus proteins and proteins, respec-tively, and the difference would yield the fraction of label inDNA (11). Servais et al. (28) found that this procedure is notspecific enough. They showed that about 50%S of labeledDNA was not hydrolyzed by hot-TCA extraction for 30 min,while 30% of a labeled protein was hydrolyzed. This sug-gests that the so-called protein fraction contains labeledDNA. This hot-TCA precipitate contained 61 ± 22% (± SD;n = 6) of the label in the continuous culture (Table 2) and 57± 31% (n = 9) in the field samples (Table 4). Alternatively,if acid-base hydrolysis yields reliable fractionation of mac-romolecules, incorporation into macromolecules other thanDNA would be proportional to cell production (Table 1).However, it is not immediately clear how thymidine incor-poration into other macromolecules can yield a conversionfactor of 1018 bacteria mol-1, because isotope dilution maybe expected to cause a much higher conversion factor.The bacterial DNA contents of 5 to 14 fg cell-' measured
in the continuous culture equal the values measured forenvironmental bacteria by Jeffrey and Paul (14). On the basisof the measured DNA content (Table 1) and assuming 50%A T base pair composition and an average molecular massfor a base pair of 624 g mol -1 (14) for our continuous culture,theoretical conversion factors of 0.09 x 10¹⁸ to 0.26 x 10¹⁸bacteria mol-' can be calculated. These values are 1.5- to13-fold lower than the empirical conversion factors obtained,with the greatest difference at the highest growth rate. Thus,even if the measured thymidine incorporation into totalcold-TCA-insoluble macromolecules would represent DNAsynthesis only, the actual DNA synthesis would be signifi-cantly underestimated. Also, Jeffrey and Paul (14) reportedthat thymidine incorporation consistently underestimatedDNA synthesis by a factor of 6 to 8. This indicates significantintracellular isotope dilution, which cannot be accounted forby standard isotope dilution assays and which may beexpected if thymidine transport across the cell wall wouldlimit incorporation into DNA (31). It may- be hypothesizedthat not primarily thymidine incorporation into DNA butenergy-dependent (21) thymidine uptake across the cell wallis more or less proportional to the growth rate. Therefore,the question of whether DNAs or other macromolecules arelabeled may be of secondary importance. Thus, more re-search is needed on the biochemical and physiological basesof the thymidine method. Although the dnderlying mecha-
VOL 55 , 1989 1793
on March 7, 2020 by guest
http://aem.asm
.org/D
ownloaded from
APPL. ENVIRON. MICROBIOL.
nism is not clear, the relationship between thymidine incor-poration and cell production has been established empiri-cally (17, 25, 31; Table 1) and can still be used to estimatebacterial production.
Production and grazing. Using the empirical conversionfactor of 1018 bacteria mol-1 based on thymidine incorpora-tion, we estimated bacterial production rates in Lake Vechtenthat varied from 2.4 x 10⁶ to 141 x 106 bacteria liter-' h-1.The estimated population doubling times were between 2.9and 131 days (ri, 0.012 to 0.00022 h-1). It is questionablewhether these extremely low values represent growth or justbiochemical turnover. The maximum production rates, whichoccurred in the metalimnion, were similar to values estimatedfor the metalimnion of Lake Oglethorpe (19).
In 1987, the maximum HNAN numbers (Fig. 4), andpresumably also the grazing pressure on bacteria, were ca.threefold lower than in 1986 (Fig. 3) and 1985 (5). As in theprevious years, maximum bacterial activity and HNANnumbers were found in the microaerobic metalimnion, whichmay be related to a metalimnetic primary production maxi-mum (32). While the maximum rates in the metalimnion were1 order of magnitude higher than those in the epi- andhypolimnion, in all three strata bacterial production ap-peared to be roughly balanced by HNAN grazing (Fig. 7).This seemed not to be true for the metalimnion on 17 August,when estimated grazing greatly exceeded estimated produc-tion. However, lags between production and grazing arepossible, and HNAN may also consume food sources otherthan bacteria, such as chroococcoid cyanobacteria.The protozoan grazing rates estimated on the basis of FLB
uptake were probably not underestimated because of glutar-aldehyde fixation. This method yielded accurate grazingestimates in two-stage continuous cultures (7), showingingestion rates (ca. 9 bacteria HNAN-' h-') similar to thosefound in glutaraldehyde-fixed field samples (Table 3). More-over, no FLB uptake was observed with van der Veerfixative (Fig. 5), in contrast to the findings of Sieracki et al.(30). The reason for this discrepancy is not clear, butaddition of ice-cold glutaraldehyde and immediate cooling ofthe samples on ice may be important (R. W. Sanders,personal communication).The estimated in situ ingestion rates of 2 to 17 bacteria
HNAN-1 h-1 (Table 3) are at the low end of the rangereported in the literature. Similar low rates of 0.4 to 25bacteria HNAN-1 h-1 were estimated on the basis of directcell counts in seawater (2) and with bacterium-sized fluores-cent microspheres (20, 23). Much higher rates of up to 254bacteria HNAN-1 h-1 were calculated on the basis of directcounts in batch cultures (9). Even though the individualingestion rates are relatively low, HNAN are the mainconsumers of bacterial production in stratified LakeVechten, where maximum rates of bacterial production andprotozoan grazing occur in the microaerobic metalimnion.
ACKNOWLEDGMENTS
We thank B. Riemann, D. J. W. Moriarty, A. J. B. Zehnder, and0. F. R. van Tongeren for valuable comments on the manuscriptand the latter also for statistical analyses. D. L. Kirchman isacknowledged for helpful discussions of the thymidine method.
LITERATURE CITED1. Andersen, P., and T. Fenchel. 1985. Bacterivory by microhet-
erotrophic flagellates in seawater samples. Limnol. Oceanogr.30:198-202.
2. Andersen, P., and H. M. S0rensen. 1986. Population dynamicsand trophic coupling in pelagic microorganisms in eutrophic
coastal waters. Mar. Ecol. Prog. Ser. 33:99-109.3. Azam, F., T. Fenchel, J. G. Fields, J. S. Gray, L.-A. Meyer-Reil,
and F. Thingstad. 1983. The ecological role of water-columnmicrobes in the sea. Mar. Ecol. Prog. Ser. 10:257-263.
4. Bell, R. T., G. M. Ahlgren, and I. Ahlgren. 1983. Estimatingbacterioplankton production by measuring [3H]thymidine incor-poration in a eutrophic Swedish lake. Appl. Environ. Microbiol.45:1709-1721.
5. Bloem, J., and M. J. B. Bar-Gilissen. 1989. Bacterial activity andprotozoan grazing potential in a stratified lake. Limnol. Ocean-ogr. 34:295-307.
6. Bloem, J., M. J. B. B§r-Gilissen, and T. E. Cappenberg. 1986.Fixation, counting and manipulation of heterotrophicnanoflagellates. Appl. Environ. Microbiol. 52:1266-1272.
7. Bloem, J., M. Starink, M. J. B. Bar-Gilissen, and T. E. Cappen-berg. 1988. Protozoan grazing, bacterial activity, and mineral-ization in two-stage continuous cultures. Appl. Environ. Micro-biol. 54:3113-3121.
8. Ducklow, H. W., and S. M. Hill. 1985. Tritiated thymidineincorporation and the growth of heterotrophic bacteria in warmcore rings. Limnol. Oceanogr. 30:260-272.
9. Fenchel, T. 1982. Ecology of heterotrophic microflagellates. II.Bioenergetics and growth. Mar. Ecol. Prog. Ser. 8:225-231.
10. Fuhrman, J. A., and F. Azam. 1980. Bacterioplankton second-ary production estimates for coastal waters of British Columbia,Antarctica, and California. Appl. Environ. Microbiol. 39:1085-1095.
11. Fuhrman, J. A., and F. Azam. 1982. Thymidine incorporation asa measure of heterotrophic bacterioplankton production inmarine surface waters: evaluation and field results. Mar. Biol.66:109-120.
12. Hagstrom, A., U. Larsson, P. Horstedt, and S. Normark. 1979.Frequency of dividing cells, a new approach to the determina-tion of bacterial growth rates in aquatic environments. Appl.Environ. Microbiol. 37:805-812.
13. Hollibaugh, J. T. 1988. Limitations of the [3H]thymidine methodfor estimating bacterial productivity due to thymidine metabo-lism. Mar. Ecol. Prog. Ser. 43:19-30.
14. Jeffrey, W. H., and J. H. Paul. 1988. Underestimation of DNAsynthesis by [3H]thymidine incorporation in marine bacteria.AppI. Environ. Microbiol. 54:3165-3168.
15. Kirchman, D., H. W. Ducklow, and R. Mitchell. 1982. Estimatesof bacterial growth from changes in uptake rates and biomass.Appl. Environ. Microbiol. 44:1296-1307.
16. Kirchman, D. L., and M. P. Hoch. 1988. Bacterial production inthe Delaware Bay estuary estimated from thymidine and leucineincorporation rates. Mar. Ecol. Prog. Ser. 45:169-178.
17. Lovell, C. R., and A. Konopka. 1985. Seasonal bacterial produc-tion in a dimictic lake as measured by increases in cell numbersand thymidine incorporation. Appl. Environ. Microbiol. 49:492-500.
18. Mackinnon, D. L., and R. S. J. Hawes. 1961. An introduction tothe study of protozoa, p. 405. Oxford University Press, London.
19. McDonough, R. J., R. W. Sanders, K. G. Porter, and D. L.Kirchman. 1986. Depth distribution of bacterial production in astratified lake with an anoxic hypolimnion. Appl. Environ.Microbiol. 52:992-1000.
20. McManus, G. B., and J. B. Fuhrman. 1988. Clearance ofbacteria-sized particles by natural populations of nanoplanktonin the Chesapeake Bay outflow plume. Mar. Ecol. Prog. Ser.42:199-206.
21. Moriarty, D. J. W. 1986. Measurement of bacterial growth ratesin aquatic systems from rates of nucleic acid synthesis. Adv.Microb. Ecol. 9:245-292.
22. Paul, J. H., and B. Myers. 1982. Fluorometric determination ofDNA in aquatic microorganisms by use of Hoechst 33258. Appl.Environ. Microbiol. 43:1393-1399.
23. Porter, K. G. 1988. Phagotrophic phytoflagellates in microbialfood webs. Hydrobiologia 159:89-97.
24. Porter, K. G., and Y. S. Feig. 1980. The use of DAPI foridentifying and counting aquatic microflora. Limnol. Oceanogr.25:943-948.
25. Riemann, B., P. K. Bj0rnsen, S. Newell, and R. Fallon. 1987.
1794 BLOEM ET AL.
on March 7, 2020 by guest
http://aem.asm
.org/D
ownloaded from
PROTOZOAN GRAZING AND BACTERIAL PRODUCTION
Calculation of cell production of coastal marine bacteria basedon measured incorporation of [VHlthymidine. Limnol. Ocean-ogr. 32:471-476.
26. Riemann, B., and M. S0ndergaard. 1984. Measurement of dielrates of bacterial production in aquatic environments. AppI.Environ. Microbiol. 47:632-638.
27. Robarts, R. D., R. J. Wicks, and L. M. Sephton. 1986. Spatialand temporal variations in bacterial macromolecule labelingwith [sinetlil-3H]thymidine in a hypertrophic lake. Appl. Envi-ron. Microbiol. 52:1368-1373.
28. Servais, P., J. Martinez, G. Billen, and J. Vives-Rego. 1987.Determining 13H]thymidine incorporation into bacterioplanktonDNA: improvement of the method by DNase treatment. Appl.Environ. Microbiol. 53:1977-1979.
29. Sherr, B. F., E. B. Sherr, and R. D. Fallon. 1987. Use ofmonodispersed, fluorescently labeled bacteria to estimate in situ
protozoan grazing. Appl. Environ. Microbiol. 53:958-965.30. Sieracki, M. E., L. W. Haas, D. A. Caron, and E. J. Lessard.
1987. Effect of fixation on particle retention by microflagellates:underestimation of grazing rates. Mar. Ecol. Prog. Ser. 38:251-258.
31. Smits, J. D., and B. Riemann. 1988. Calculation of cell produc-tion from [3H]thymidine incorporation with freshwater bacteria.Appl. Environ. Microbiol. 54:2213-2219.
32. Steenbergen, C. L. M., and H. J. Korthals. 1982. Distribution ofphototrophic microorganisms in the anaerobic and microaero-philic strata of Lake Vechten (The Netherlands). Pigmentanalysis and role in primary production. Limnol. Oceanogr.27:883-895.
33. Steenbergen, C. L. M., and H. Verdouw. 1982. Lake Vechten:aspects of its morphometry, climate, hydrology and physico-chemical characteristics. Hydrobiologia 95:11-23.
VOL. 55, 1989 1795
on March 7, 2020 by guest
http://aem.asm
.org/D
ownloaded from