protocols for validation of observations - ECMWF · •Protocols for Validation in QA4ECV...
50
Page 1 Version: 02.07.2015 [email protected] Protocols for assessing quality of observational datasets Copernicus Climate Observations Requirements Workshop, ECMWF, 29 June - 2 July 2015 Jan -Peter Muller, UCL-Mullard Space Science Laboratory Thanks to contributions from T. Scanlon, J. Nightingale (NPL), J. Schultz (EUMETSAT), M. Van Roozendael & J-C Lambert (BIRA), N. Gobron (JRC), S. Kharbouche (UCL)
Transcript of protocols for validation of observations - ECMWF · •Protocols for Validation in QA4ECV...
Pag
e1
Ve
rsio
n: 0
2.0
7.2
01
5j.
mu
ller@
ucl
.ac.
uk
Protocols for assessing quality of observational datasets
Copernicus Climate Observations Requirements Workshop, ECMWF, 29 June - 2 July 2015
Jan-Peter Muller,
UCL-Mullard Space Science LaboratoryThanks to contributions from T. Scanlon, J. Nightingale (NPL), J. Schultz (EUMETSAT),
M. Van Roozendael & J-C Lambert (BIRA), N. Gobron (JRC), S. Kharbouche (UCL)
Pag
e2
Ve
rsio
n: 0
2.0
7.2
01
5j.
mu
ller@
ucl
.ac.
uk
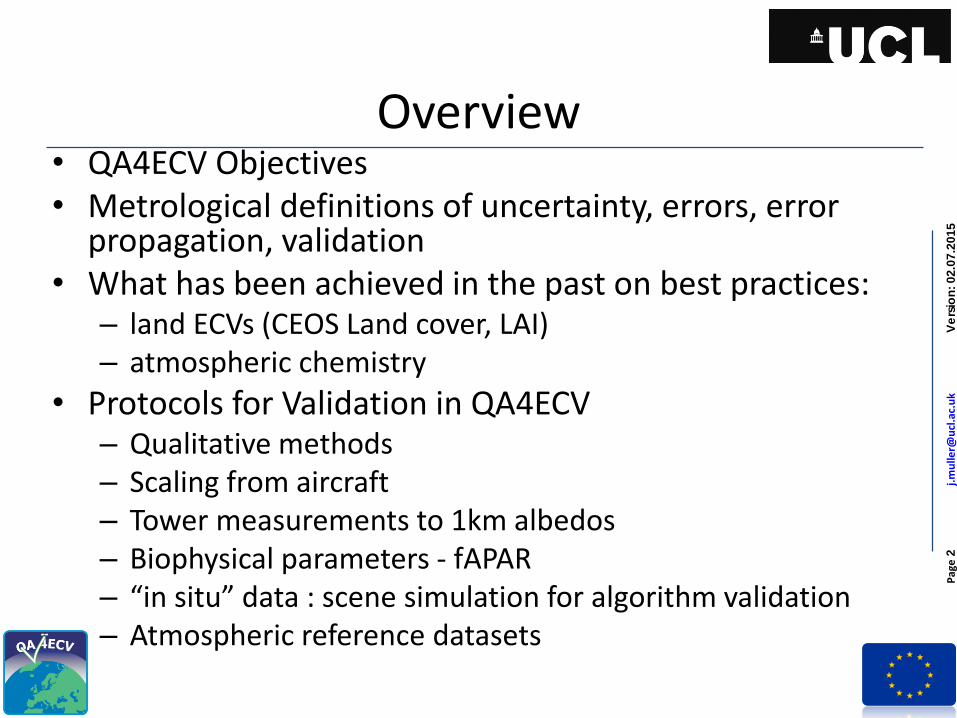
Overview• QA4ECV Objectives• Metrological definitions of uncertainty, errors, error
propagation, validation• What has been achieved in the past on best practices:
– land ECVs (CEOS Land cover, LAI)– atmospheric chemistry
• Protocols for Validation in QA4ECV– Qualitative methods– Scaling from aircraft– Tower measurements to 1km albedos– Biophysical parameters - fAPAR– “in situ” data : scene simulation for algorithm validation– Atmospheric reference datasets
Pag
e3
Ve
rsio
n: 0
2.0
7.2
01
5j.
mu
ller@
ucl
.ac.
uk
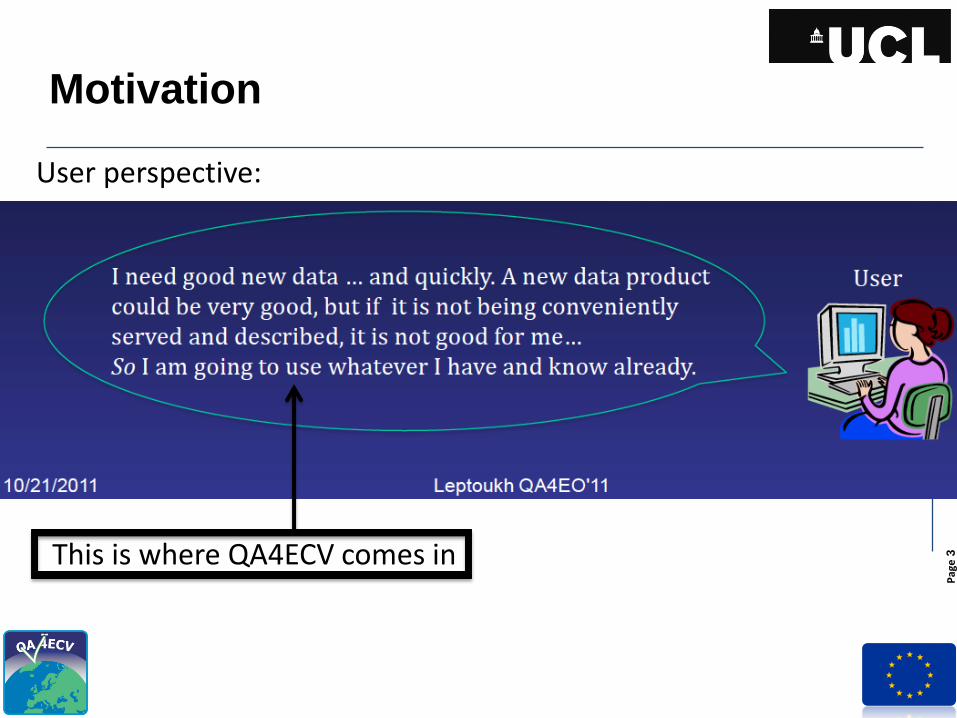
Motivation
User perspective:
This is where QA4ECV comes in

09- 07- 12 20:56www.esa- cci.org
Pagina 1 van 1http:/ / www.esa- cci.org/
CCI
Navigation
Home
About CCI
Project plan
Resources
Support
Related programs
ESA CCI Aerosol Cloud CMUG Fire GHG Glaciers Ice Sheets Land Cover Ocean Colour Ozone Sea Ice Sea Level SST
ESA Climate Change Initiative
Wed, 2010-09-01 11:03Climate change is arguably the greatest challenge facing mankind in the twenty-first century. Its importance has been recognised in recentreports from the IPCC and from UNFCCC, and the overwhelming economic consequences are set out in the Stern Report.
Read more »
Over 30 years of global soil moisture observations for climate
Wed, 2012-06-20 12:31The CCI Soil Moisture project, together with ESA's WACMOS project, has publically released an Essential Climate Variable soil moisturedataset that has been put together by the two projects. The dataset of changes in global soil moisture was generated using active andpassive microwave spaceborne-instruments and covers the 32 year period from 1978 to 2010.
Read more »
Remote Sensing of Environment: Special issue on the Sentinels
Thu, 2012-06-14 13:12ESA is developing five new missions called Sentinels specifically for the operational needs of the Global Monitoring for Environment andSecurity (GMES) programme. The series of Sentinel constellations, with the launch of the first Sentinels in 2013, will provide data continuityof ERS, Envisat, and SPOT-like observations.
Read more »
CCI Guidelines for Data Producers
Fri, 2012-04-27 15:56
The CCI programme aims to make its datasets as widely useable as possible, in user communities outside the existing ones. Usingcommon data formats and a number of agreed and consistent metadata conventions will facilitate this.
Therefore guidelines have been drawn up for data producers in the CCI, to ensure consistency between the output products - CCIGuidelines for Data Producers. This is an evolving document that will be revised as the programme progresses.
Read more »
Mission statement QA4ECV• QA4ECV will show how trustable assessments of satellite data quality
can facilitate users in judging fitness-for-purpose of the ECV Climate
Data Record.
• QA4ECV will provide quality assured long-term Climate Data Records
of several ECVs relevant for policy and climate change assessments.

Pag
e5
Ve
rsio
n: 0
2.0
7.2
01
5j.
mu
ller@
ucl
.ac.
uk
Climate is difficult to measure.EO and Climate Data
Records Ideal Harmonisation for Climate Records
Over Decades
Requires data that is:
Stable over time – so data can be compared across decades meaningfully
Insensitive to the method of measurement– so data from different sensors (and techniques) can be combined
Uniform ‘worldwide’– so data from different space agencies can be combined
Based on references that can improve
– methods will improve over time as new technologies are available– harmonisation should not be at the expense of improvements
Pag
e6
Ve
rsio
n: 0
2.0
7.2
01
5j.
mu
ller@
ucl
.ac.
uk
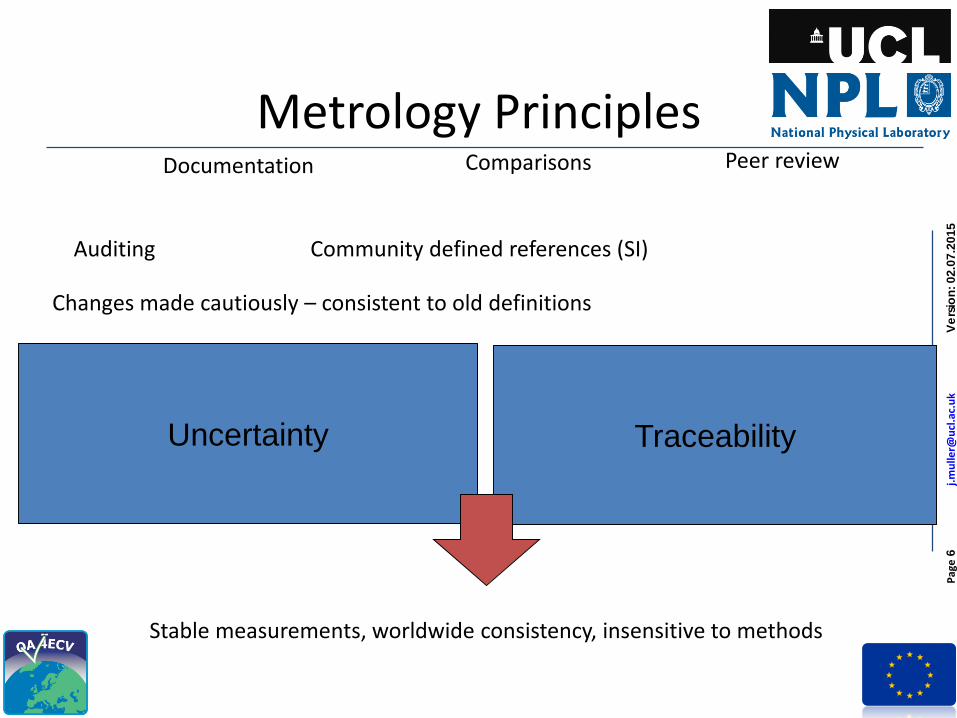
Metrology Principles
Uncertainty Traceability
Auditing
Documentation Peer reviewComparisons
Community defined references (SI)
Changes made cautiously – consistent to old definitions
Stable measurements, worldwide consistency, insensitive to methods
Pag
e7
Ve
rsio
n: 0
2.0
7.2
01
5j.
mu
ller@
ucl
.ac.
uk
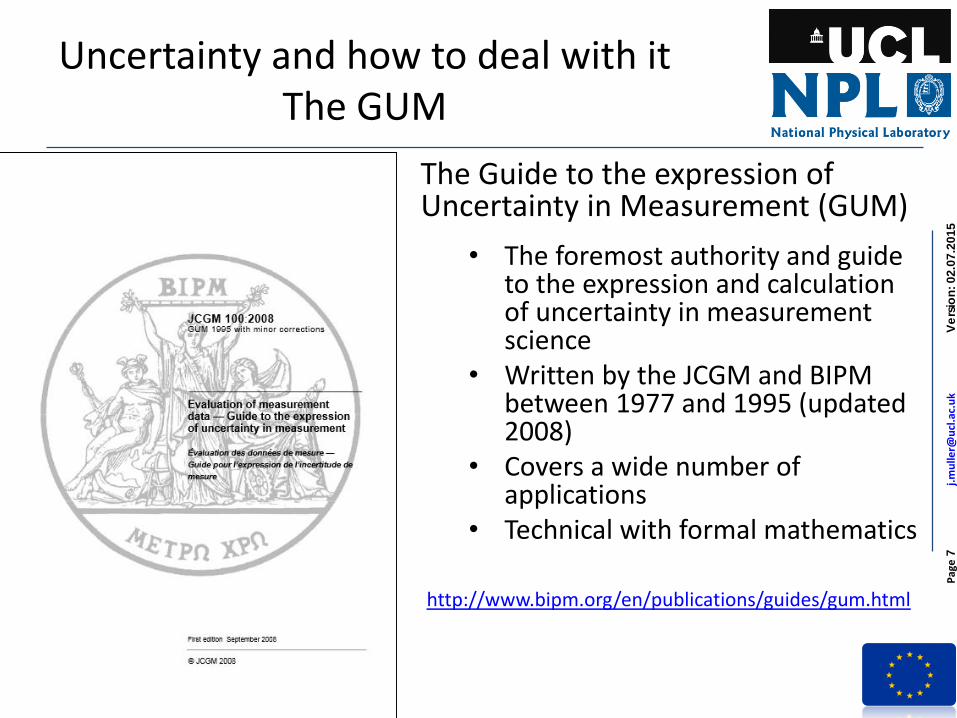
Uncertainty and how to deal with itThe GUM
The Guide to the expression of Uncertainty in Measurement (GUM)
• The foremost authority and guide to the expression and calculation of uncertainty in measurement science
• Written by the JCGM and BIPM between 1977 and 1995 (updated 2008)
• Covers a wide number of applications
• Technical with formal mathematics
http://www.bipm.org/en/publications/guides/gum.html
Pag
e8
Ve
rsio
n: 0
2.0
7.2
01
5j.
mu
ller@
ucl
.ac.
uk
Traceability“Property of a measurement result relating theresult to a stated metrological reference (freedefinition and not necessarily SI) through anunbroken chain of calibrations of a measuringsystem or comparisons, each contributing to thestated measurement uncertainty”
Committee on Earth Observation Satellites(CEOS)
Pag
e9
Ve
rsio
n: 0
2.0
7.2
01
5j.
mu
ller@
ucl
.ac.
uk
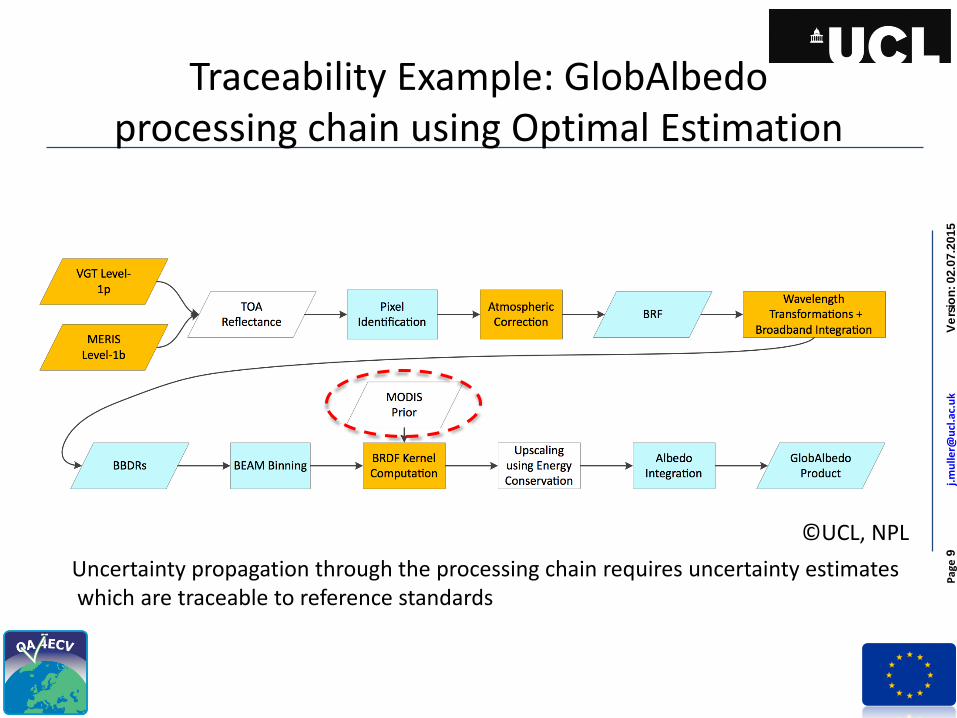
Traceability Example: GlobAlbedo processing chain using Optimal Estimation
©UCL, NPL
Uncertainty propagation through the processing chain requires uncertainty estimateswhich are traceable to reference standards
Pag
e1
0V
ers
ion
: 0
2.0
7.2
01
5j.
mu
ller@
ucl
.ac.
uk
Error
is NOT the same as
Uncertainty

Pag
e1
1V
ers
ion
: 0
2.0
7.2
01
5j.
mu
ller@
ucl
.ac.
uk
Uncertainty vs. errorUncertainty:
• Describes the spread of a probability distribution i.e. standard deviation
– Uncertainty is the doubt you have on the value
Error:
• Difference from truth
– Result of measurement imperfections
– From random and systematic effects
Correction
• Where an error is known, it can be corrected by applying a correction
– There will always be an unknown residual error which adds to the uncertainty
Consistency in terminology is important!
Pag
e1
2V
ers
ion
: 0
2.0
7.2
01
5j.
mu
ller@
ucl
.ac.
uk
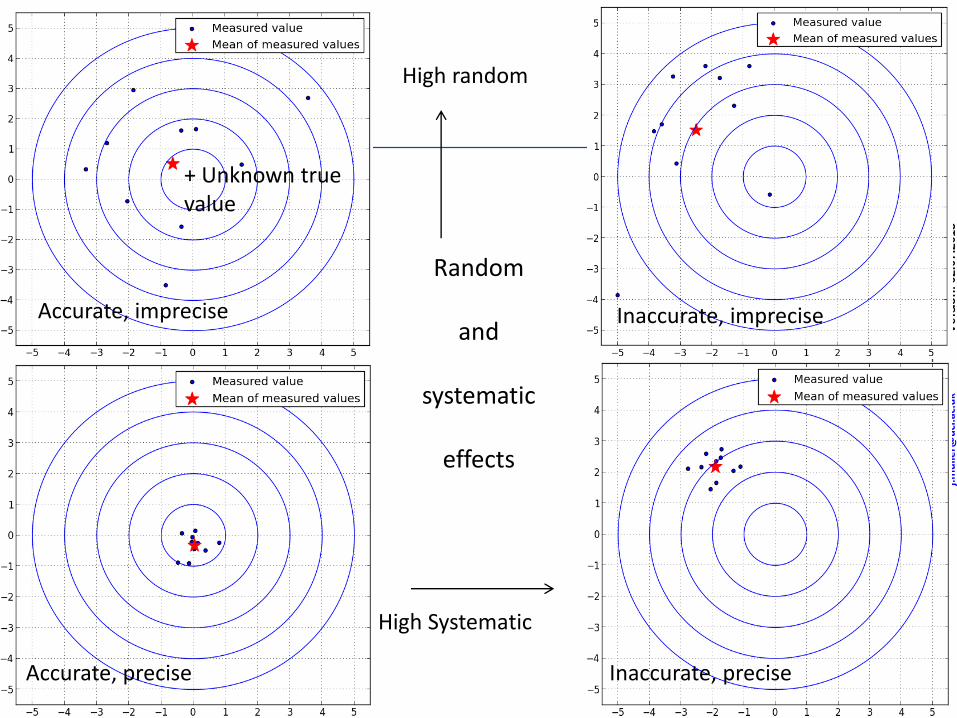
Random
and
systematic
effects
Accurate, imprecise Inaccurate, imprecise
Accurate, precise Inaccurate, precise
High random
High Systematic
+ Unknown true value

Pag
e1
3V
ers
ion
: 0
2.0
7.2
01
5j.
mu
ller@
ucl
.ac.
uk
Random Effects• Random effects
– Different error for every measurement (different random number)
– Cannot be corrected for even if the measurement is dully understood
– Can have same associated uncertainty(drawn from same probability distribution)
• e.g. Detector noise etc.
Note: don’t use the incorrect phrase “random uncertainties” – “uncertainty” describes the probability distribution. Strictly: “uncertainties associated with random effects”
Pag
e1
4V
ers
ion
: 0
2.0
7.2
01
5j.
mu
ller@
ucl
.ac.
uk
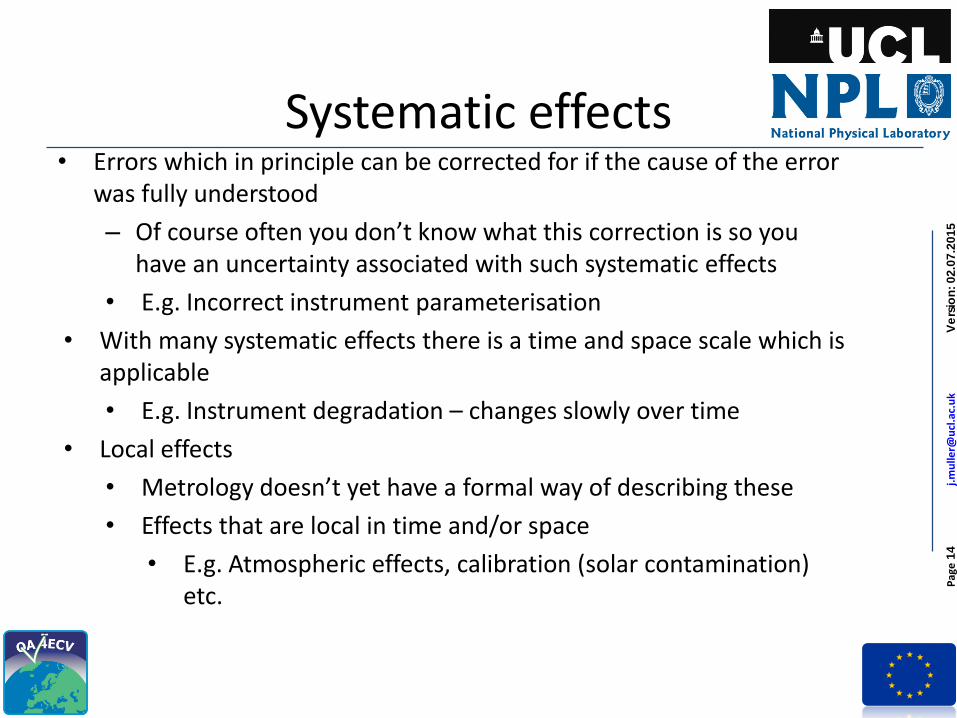
Systematic effects• Errors which in principle can be corrected for if the cause of the error
was fully understood
– Of course often you don’t know what this correction is so you have an uncertainty associated with such systematic effects
• E.g. Incorrect instrument parameterisation
• With many systematic effects there is a time and space scale which is applicable
• E.g. Instrument degradation – changes slowly over time
• Local effects
• Metrology doesn’t yet have a formal way of describing these
• Effects that are local in time and/or space
• E.g. Atmospheric effects, calibration (solar contamination) etc.
Pag
e1
5V
ers
ion
: 0
2.0
7.2
01
5j.
mu
ller@
ucl
.ac.
uk
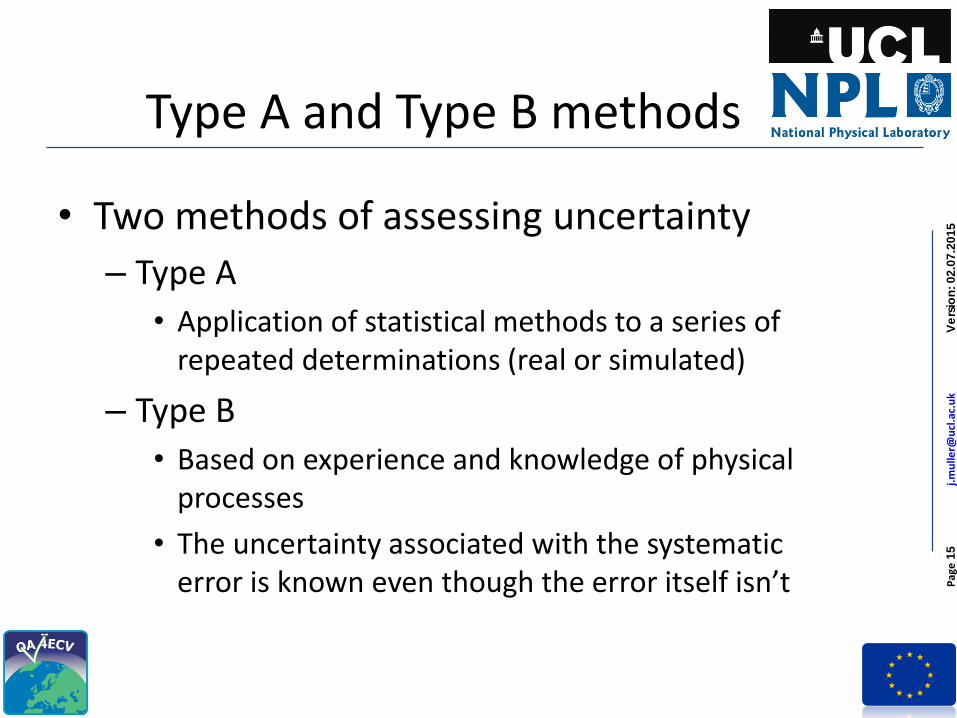
Type A and Type B methods
• Two methods of assessing uncertainty
– Type A
• Application of statistical methods to a series of repeated determinations (real or simulated)
– Type B
• Based on experience and knowledge of physical processes
• The uncertainty associated with the systematic error is known even though the error itself isn’t
Pag
e1
6V
ers
ion
: 0
2.0
7.2
01
5j.
mu
ller@
ucl
.ac.
uk
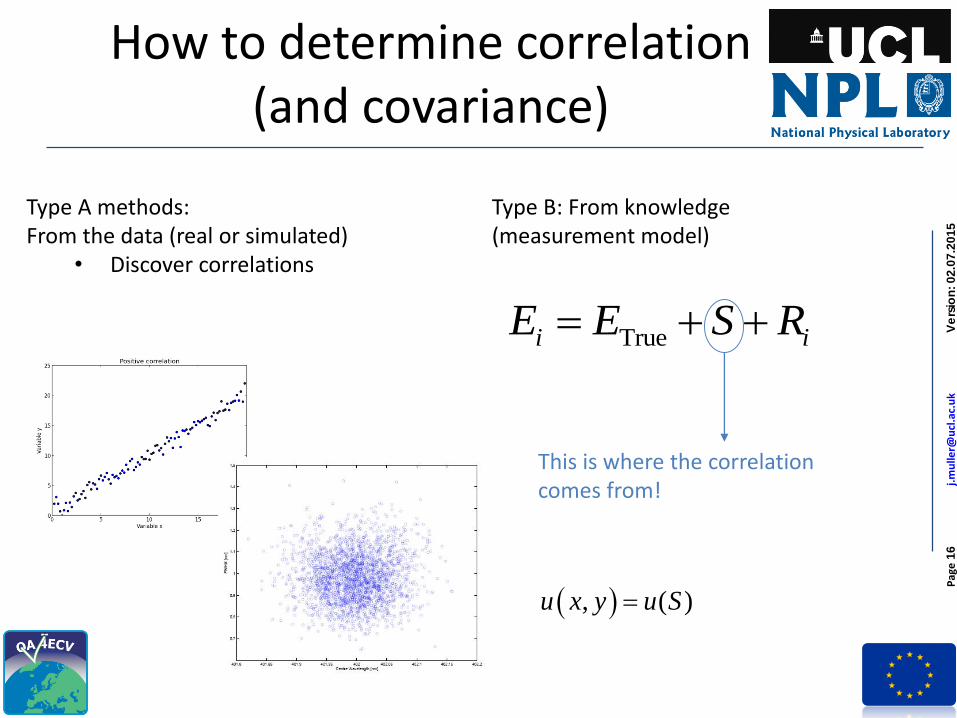
How to determine correlation(and covariance)
Truei iE E S R
Type A methods: From the data (real or simulated)
• Discover correlations
Type B: From knowledge (measurement model)
This is where the correlation comes from!
, ( )u x y u S
Pag
e1
7V
ers
ion
: 0
2.0
7.2
01
5j.
mu
ller@
ucl
.ac.
uk
Validation
‘The process of assessing, by independent means, the quality of the data products derived from the
system outputs’
(Justice, et al., 2000, p. 3383)
Pag
e1
8V
ers
ion
: 0
2.0
7.2
01
5j.
mu
ller@
ucl
.ac.
uk
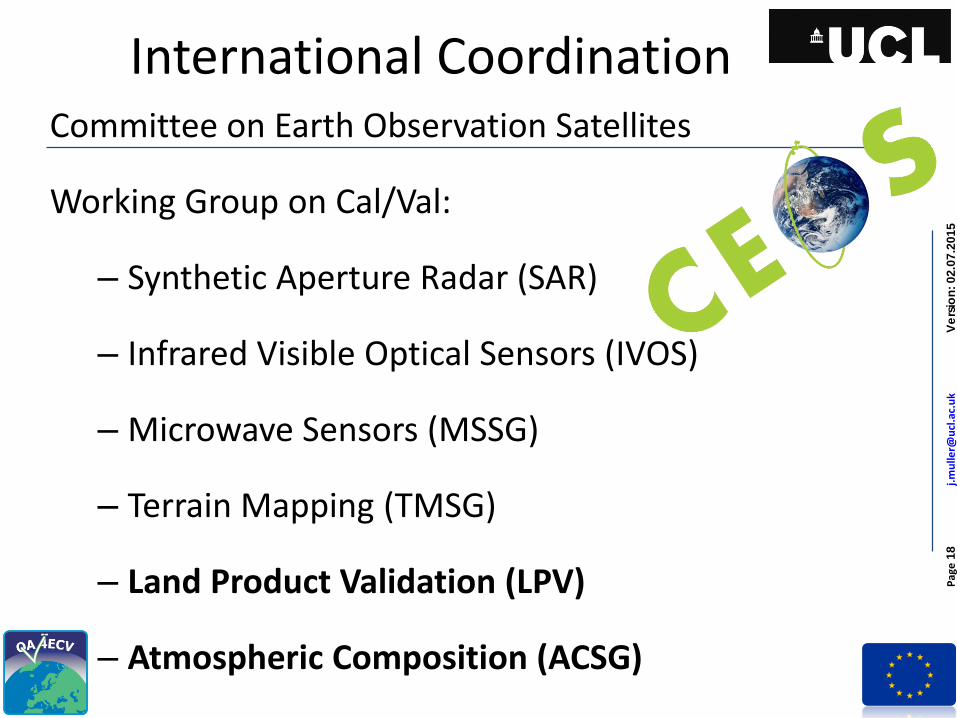
International CoordinationCommittee on Earth Observation Satellites
Working Group on Cal/Val:
– Synthetic Aperture Radar (SAR)
– Infrared Visible Optical Sensors (IVOS)
– Microwave Sensors (MSSG)
– Terrain Mapping (TMSG)
– Land Product Validation (LPV)
– Atmospheric Composition (ACSG)
Pag
e1
9V
ers
ion
: 0
2.0
7.2
01
5j.
mu
ller@
ucl
.ac.
uk
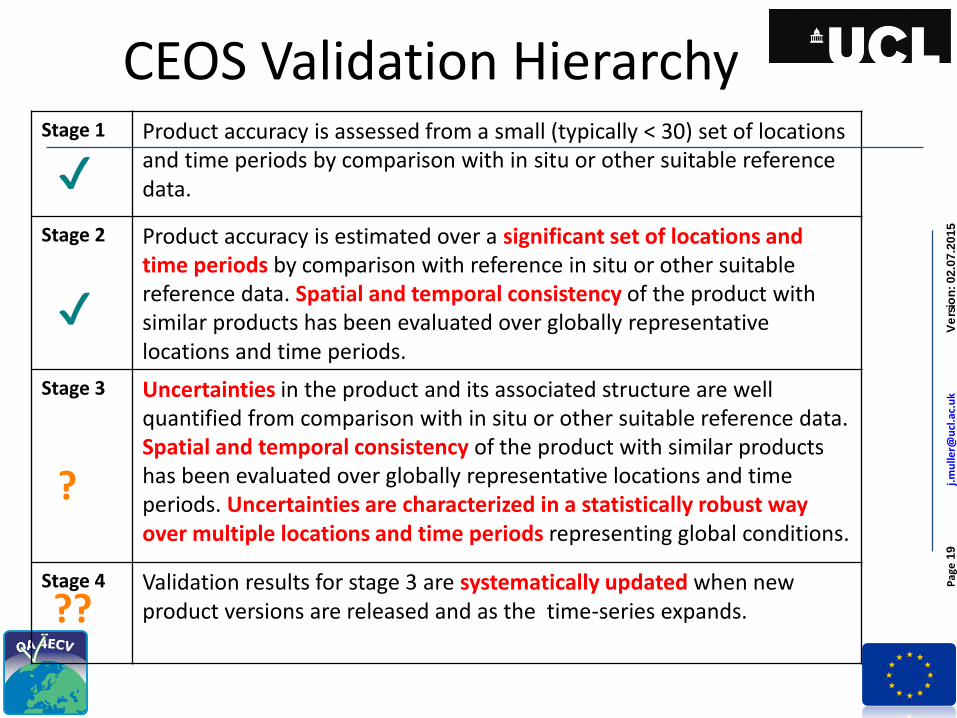
CEOS Validation HierarchyStage 1 Product accuracy is assessed from a small (typically < 30) set of locations
and time periods by comparison with in situ or other suitable reference data.
Stage 2 Product accuracy is estimated over a significant set of locations and time periods by comparison with reference in situ or other suitable reference data. Spatial and temporal consistency of the product with similar products has been evaluated over globally representative locations and time periods.
Stage 3 Uncertainties in the product and its associated structure are well quantified from comparison with in situ or other suitable reference data. Spatial and temporal consistency of the product with similar products has been evaluated over globally representative locations and time periods. Uncertainties are characterized in a statistically robust way over multiple locations and time periods representing global conditions.
Stage 4 Validation results for stage 3 are systematically updated when new product versions are released and as the time-series expands.
✔
✔
?
??
Pag
e2
0V
ers
ion
: 0
2.0
7.2
01
5j.
mu
ller@
ucl
.ac.
uk
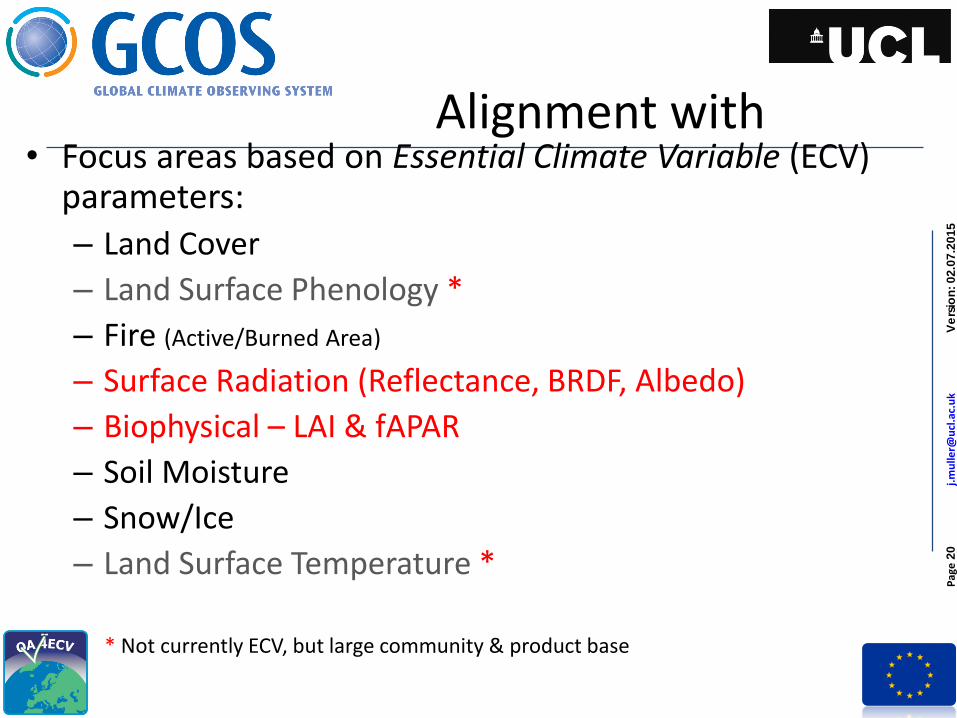
Alignment with• Focus areas based on Essential Climate Variable (ECV)
parameters:– Land Cover
– Land Surface Phenology *
– Fire (Active/Burned Area)
– Surface Radiation (Reflectance, BRDF, Albedo)
– Biophysical – LAI & fAPAR
– Soil Moisture
– Snow/Ice
– Land Surface Temperature *
* Not currently ECV, but large community & product base

Pag
e2
1V
ers
ion
: 0
2.0
7.2
01
5j.
mu
ller@
ucl
.ac.
uk
Good Practice Documents
2006
2014
Pag
e2
2V
ers
ion
: 0
2.0
7.2
01
5j.
mu
ller@
ucl
.ac.
uk
Validation Methods for EO products
• Look at the data using browse products
• From leaf to tower to EO pixel: how to scale
• Uncertainties vs Error
• Assessment of global consistency (e.g. Hovmöller plots)
• Inter-comparison of global EO products using triple collocation
• Reference datasets
Pag
e2
3V
ers
ion
: 0
2.0
7.2
01
5j.
mu
ller@
ucl
.ac.
uk
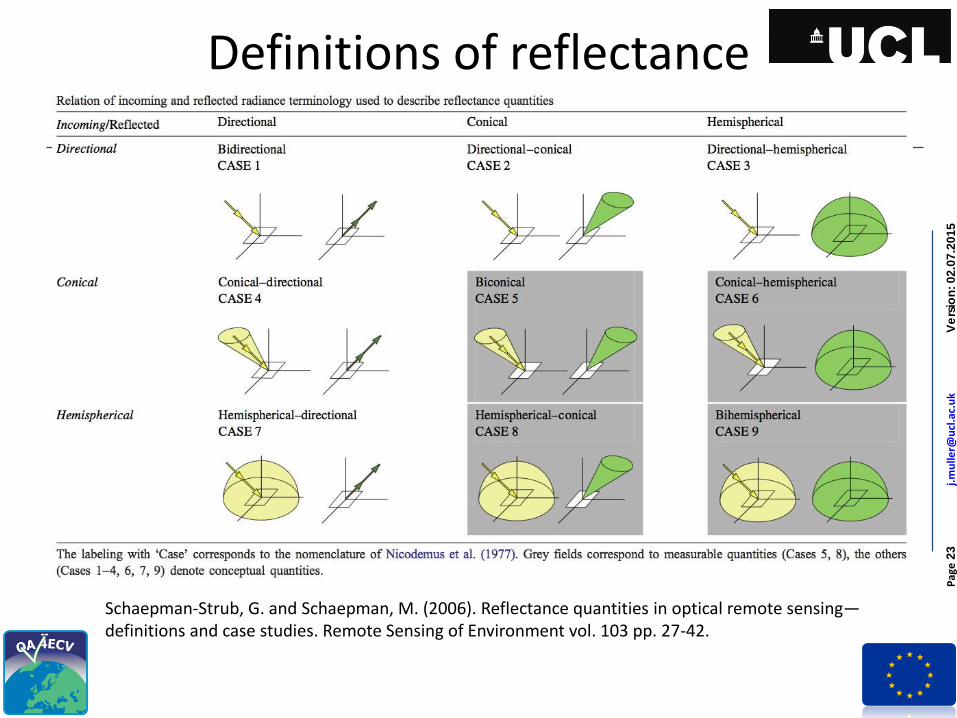
Definitions of reflectance
Schaepman-Strub, G. and Schaepman, M. (2006). Reflectance quantities in optical remote sensing—definitions and case studies. Remote Sensing of Environment vol. 103 pp. 27-42.
Pag
e2
4V
ers
ion
: 0
2.0
7.2
01
5j.
mu
ller@
ucl
.ac.
uk
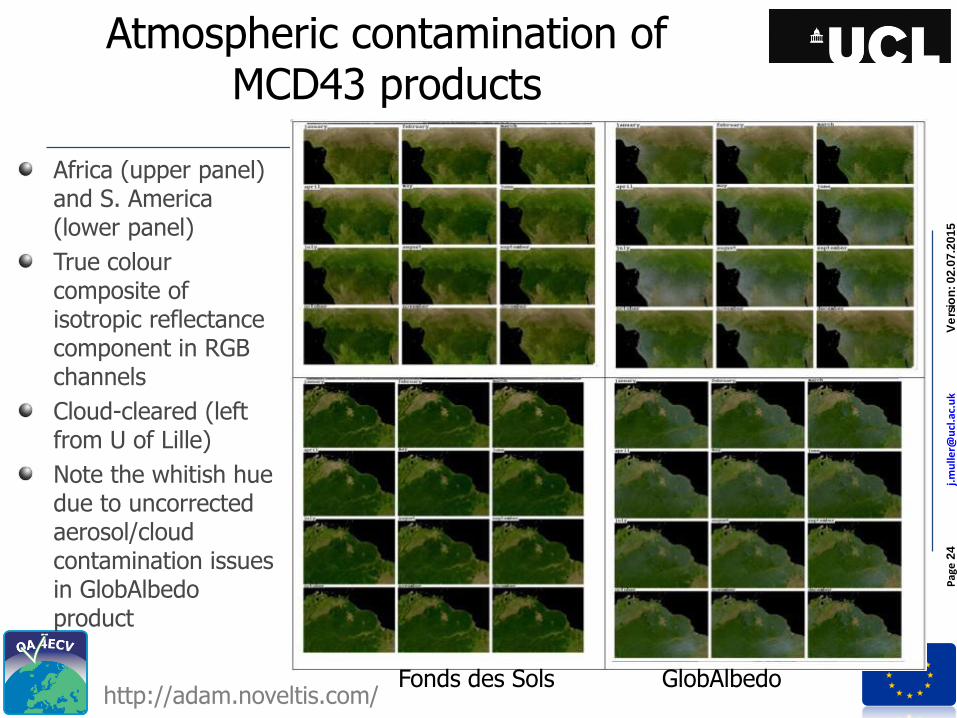
Atmospheric contamination of MCD43 products
http://adam.noveltis.com/
Africa (upper panel) and S. America (lower panel)
True colour composite of isotropic reflectance component in RGB channels
Cloud-cleared (left from U of Lille)
Note the whitish hue due to uncorrected aerosol/cloud contamination issues in GlobAlbedo product
Fonds des Sols GlobAlbedo
Pa
ge
25
Ve
rsio
n: 0
2.0
7.2
01
5j.
mu
lle
r@u
cl.
ac
.uk
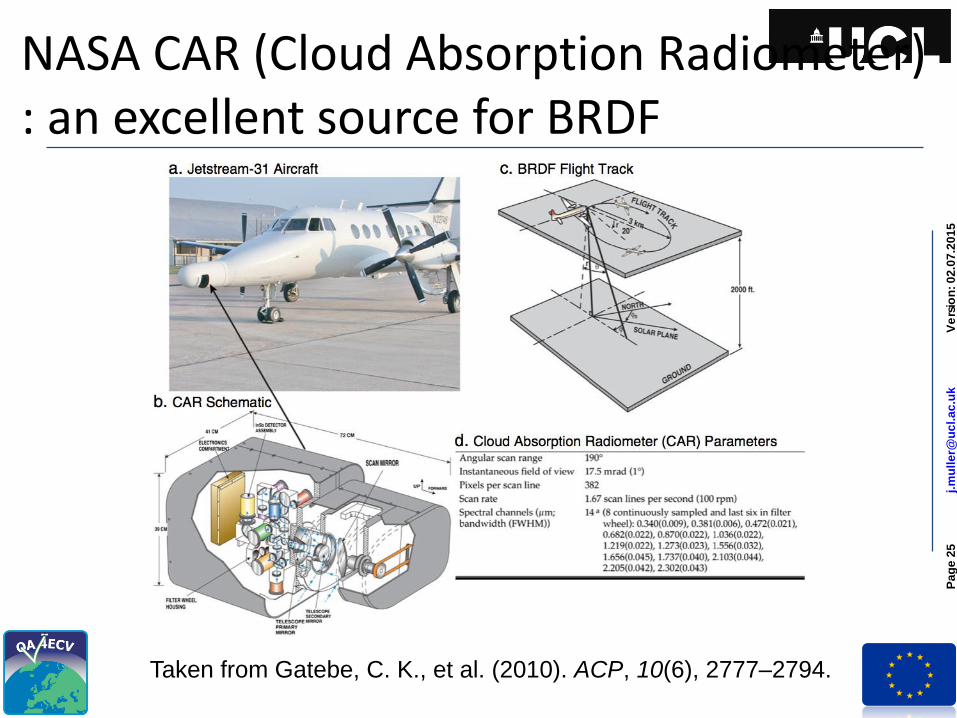
NASA CAR (Cloud Absorption Radiometer) : an excellent source for BRDF
Taken from Gatebe, C. K., et al. (2010). ACP, 10(6), 2777–2794.

Pa
ge
26
Ve
rsio
n: 0
2.0
7.2
01
5j.
mu
lle
r@u
cl.
ac
.uk
NASA CAR sampling and common location
Roman et al. (2011)
Pa
ge
27
Ve
rsio
n: 0
2.0
7.2
01
5j.
mu
lle
r@u
cl.
ac
.uk
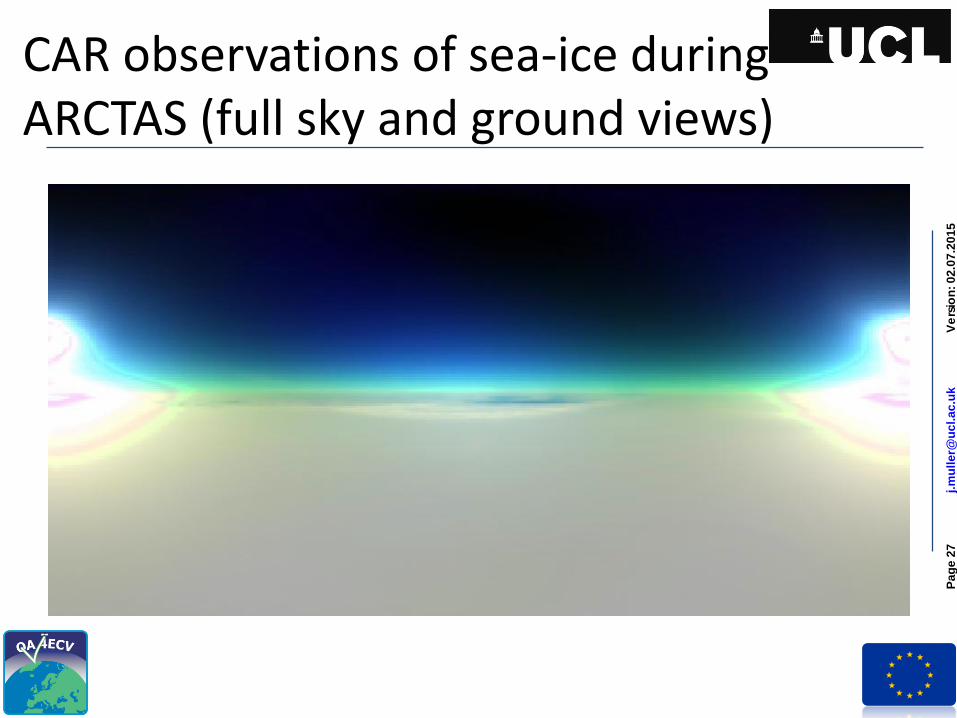
CAR observations of sea-ice during ARCTAS (full sky and ground views)
Pa
ge
28
Ve
rsio
n: 0
2.0
7.2
01
5j.
mu
lle
r@u
cl.
ac
.uk
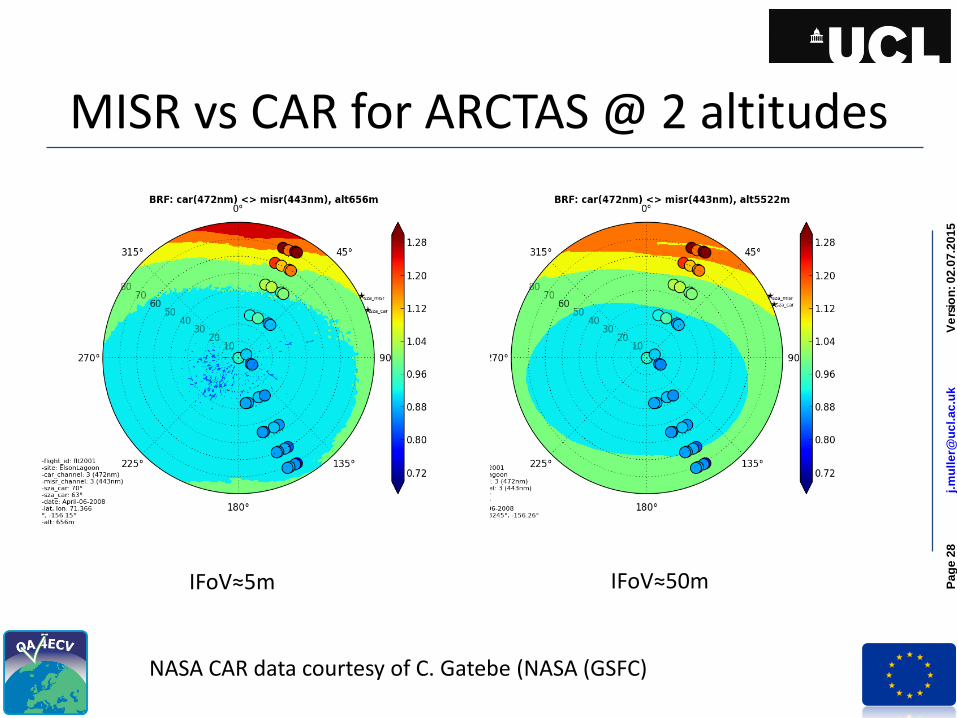
MISR vs CAR for ARCTAS @ 2 altitudes
IFoV≈5m IFoV≈50m
NASA CAR data courtesy of C. Gatebe (NASA (GSFC)
Pa
ge
29
Ve
rsio
n: 0
2.0
7.2
01
5j.
mu
lle
r@u
cl.
ac
.uk
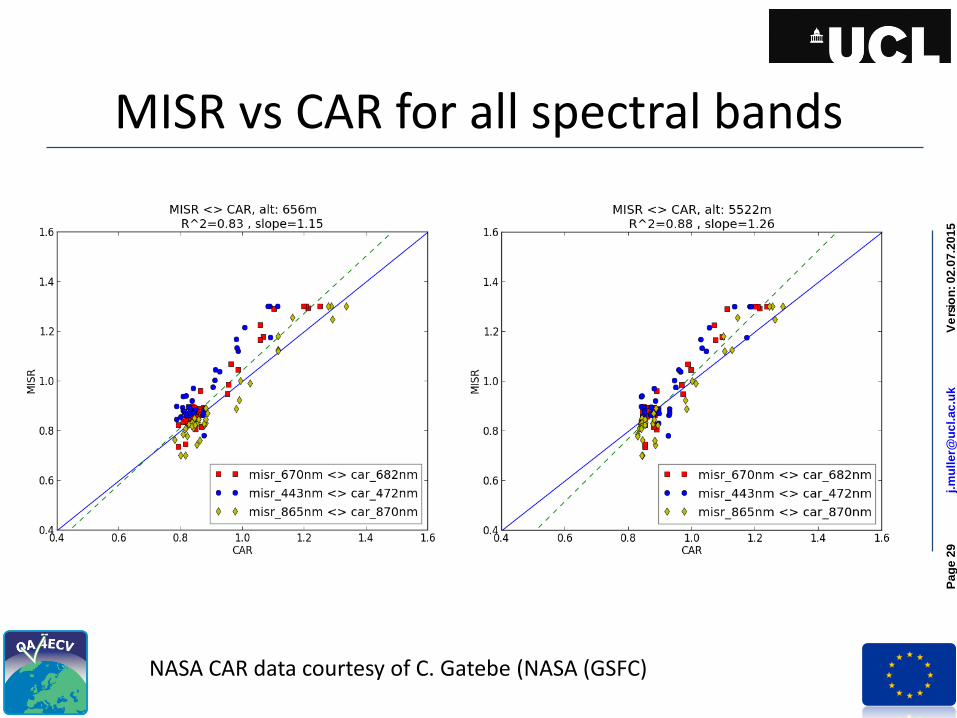
MISR vs CAR for all spectral bands
NASA CAR data courtesy of C. Gatebe (NASA (GSFC)
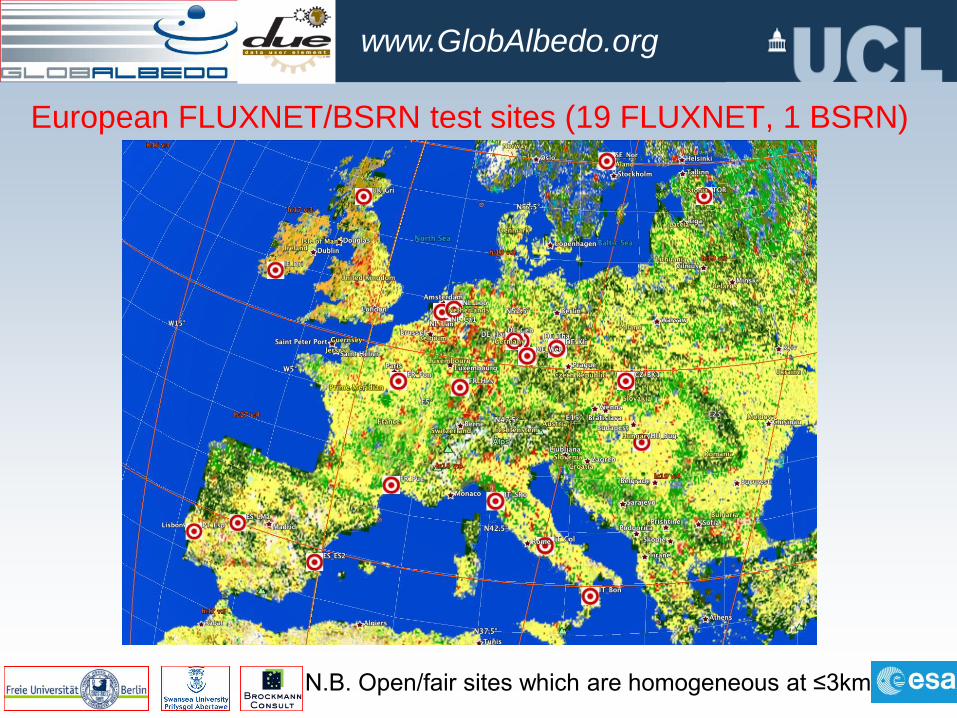
www.GlobAlbedo.org
European FLUXNET/BSRN test sites (19 FLUXNET, 1 BSRN)
N.B. Open/fair sites which are homogeneous at ≤3km
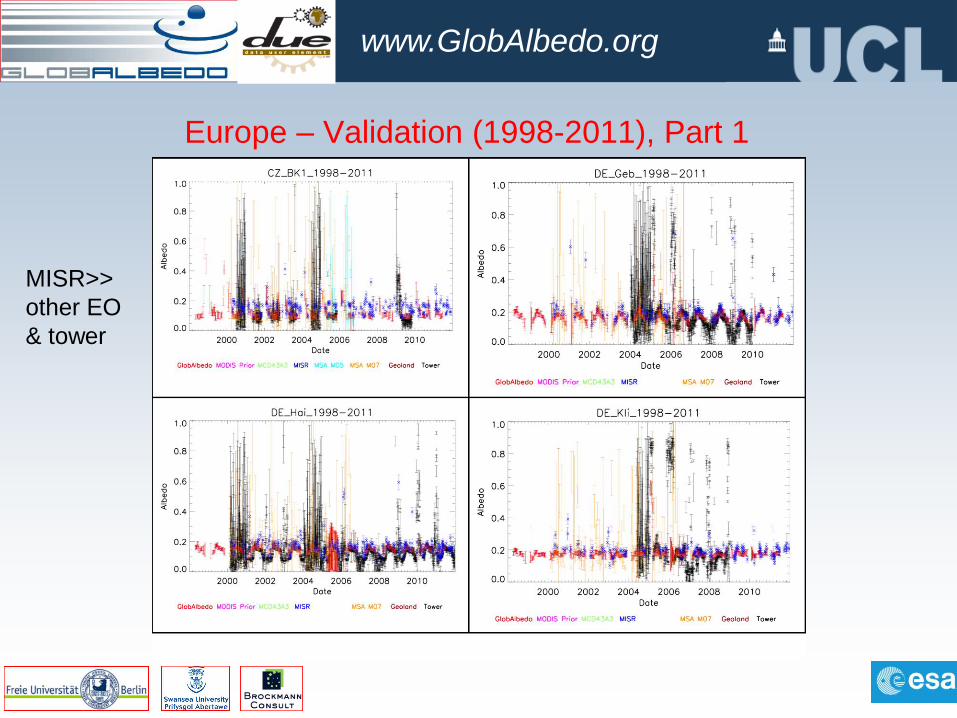
www.GlobAlbedo.org
Europe – Validation (1998-2011), Part 1
MISR>>
other EO
& tower
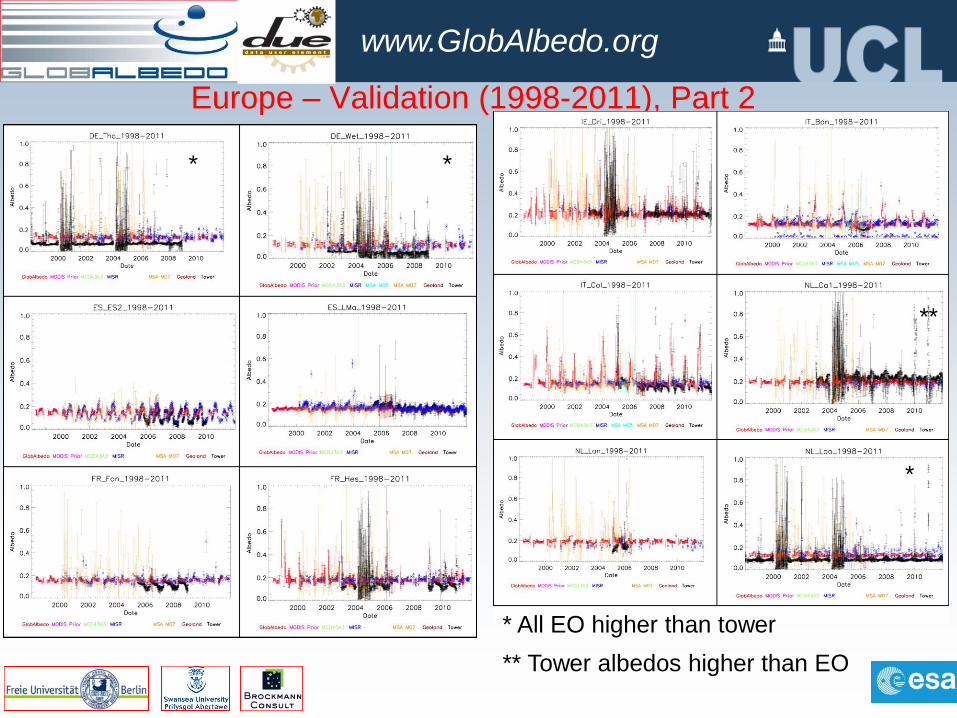
www.GlobAlbedo.org
Europe – Validation (1998-2011), Part 2
* *
*
**
* All EO higher than tower
** Tower albedos higher than EO
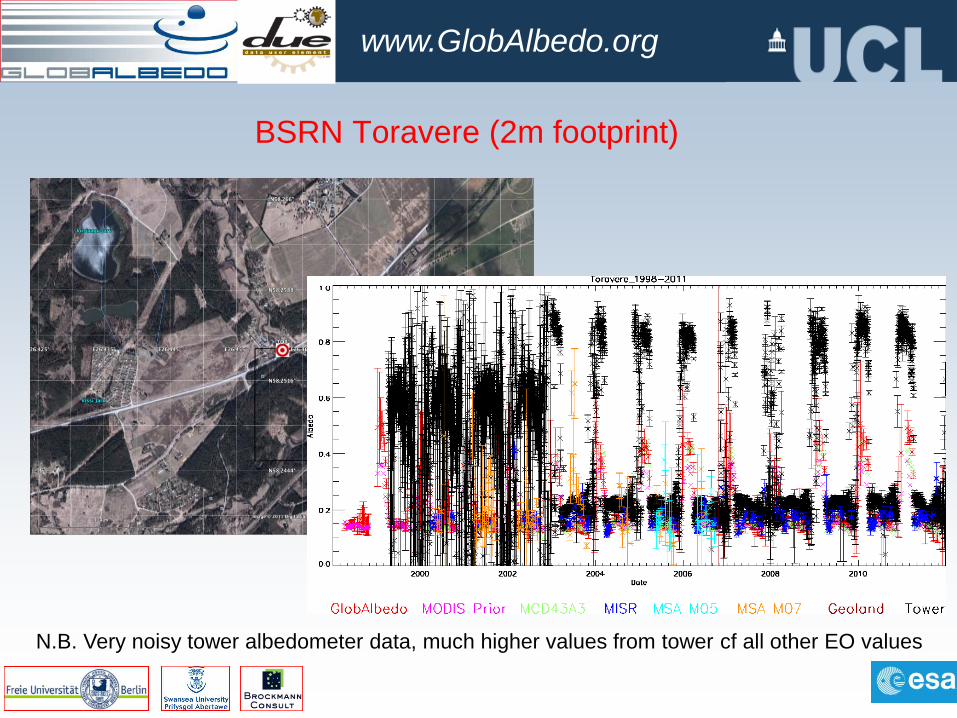
www.GlobAlbedo.org
BSRN Toravere (2m footprint)
N.B. Very noisy tower albedometer data, much higher values from tower cf all other EO values

www.GlobAlbedo.org
GlobAlbedo & MISR uncertainties vs Standard Deviations
with Tower Blue-Sky albedo measurements
GlobAlbedo MISR
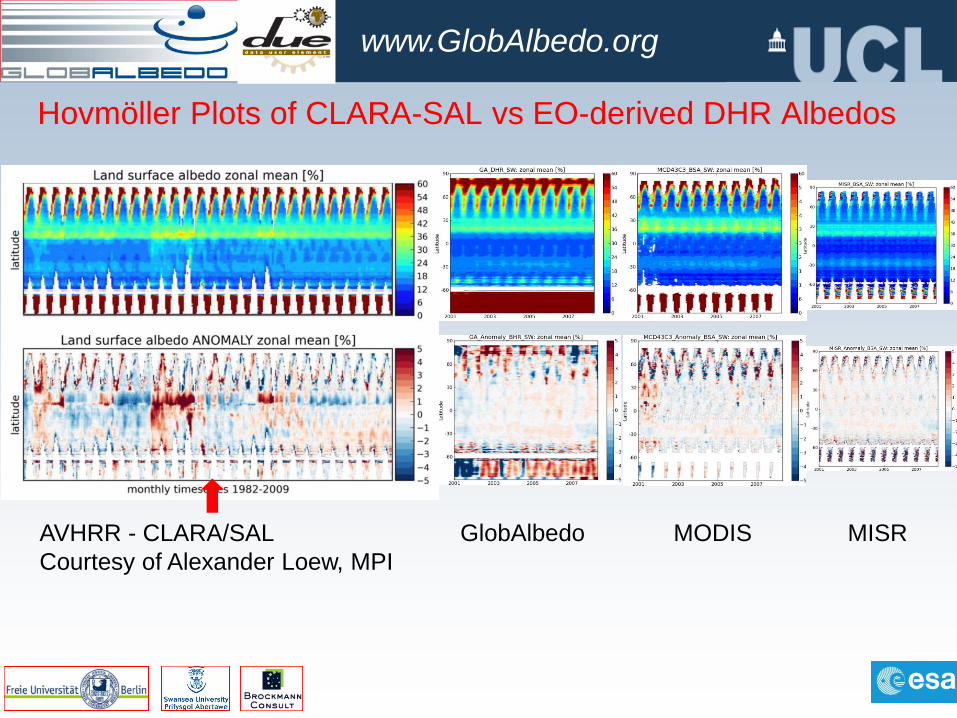
www.GlobAlbedo.org
Hovmöller Plots of CLARA-SAL vs EO-derived DHR Albedos
AVHRR - CLARA/SAL
Courtesy of Alexander Loew, MPI
GlobAlbedo MODIS MISR

www.GlobAlbedo.org
Triple Collocation Variance maps
GlobAlbedo variance with MISR and MODIS
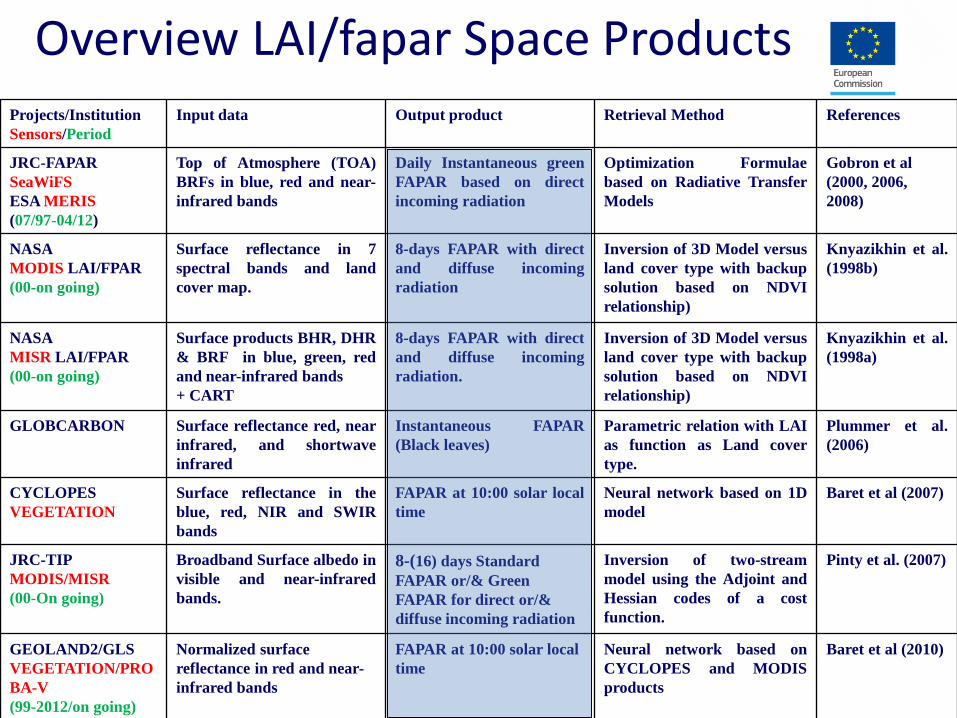
Overview LAI/fapar Space ProductsProjects/Institution
Sensors/Period
Input data Output product Retrieval Method References
JRC-FAPAR
SeaWiFS
ESA MERIS
(07/97-04/12)
Top of Atmosphere (TOA)
BRFs in blue, red and near-
infrared bands
Daily Instantaneous green
FAPAR based on direct
incoming radiation
Optimization Formulae
based on Radiative Transfer
Models
Gobron et al
(2000, 2006,
2008)
NASA
MODIS LAI/FPAR
(00-on going)
Surface reflectance in 7
spectral bands and land
cover map.
8-days FAPAR with direct
and diffuse incoming
radiation
Inversion of 3D Model versus
land cover type with backup
solution based on NDVI
relationship)
Knyazikhin et al.
(1998b)
NASA
MISR LAI/FPAR
(00-on going)
Surface products BHR, DHR
& BRF in blue, green, red
and near-infrared bands
+ CART
8-days FAPAR with direct
and diffuse incoming
radiation.
Inversion of 3D Model versus
land cover type with backup
solution based on NDVI
relationship)
Knyazikhin et al.
(1998a)
GLOBCARBON Surface reflectance red, near
infrared, and shortwave
infrared
Instantaneous FAPAR
(Black leaves)
Parametric relation with LAI
as function as Land cover
type.
Plummer et al.
(2006)
CYCLOPES
VEGETATION
Surface reflectance in the
blue, red, NIR and SWIR
bands
FAPAR at 10:00 solar local
time
Neural network based on 1D
model
Baret et al (2007)
JRC-TIP
MODIS/MISR
(00-On going)
Broadband Surface albedo in
visible and near-infrared
bands.
8-(16) days Standard
FAPAR or/& Green
FAPAR for direct or/&
diffuse incoming radiation
Inversion of two-stream
model using the Adjoint and
Hessian codes of a cost
function.
Pinty et al. (2007)
GEOLAND2/GLS
VEGETATION/PRO
BA-V
(99-2012/on going)
Normalized surface
reflectance in red and near-
infrared bands
FAPAR at 10:00 solar local
time
Neural network based on
CYCLOPES and MODIS
products
Baret et al (2010)

TIP fapar/LAI Processing chain
from http://www.qa4ecv.eu/ecv/laifapar/main
FastOpt
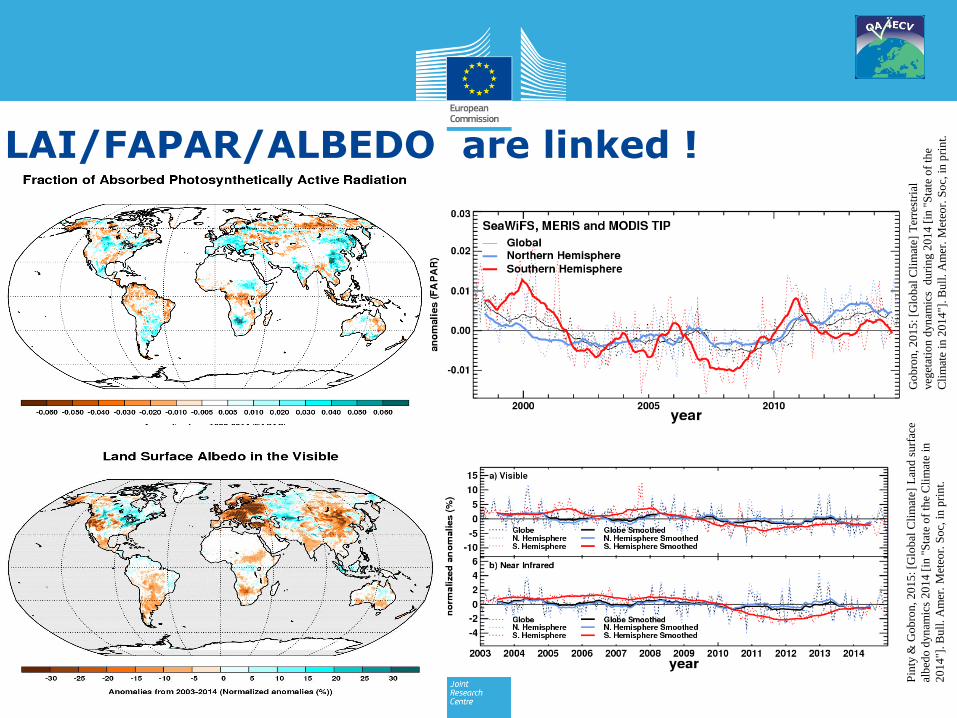
Go
bro
n, 2
01
5: [G
lob
al C
lim
ate]
Ter
rest
rial
veg
etat
ion
dyn
amic
s d
uri
ng 2
01
4[i
n "
Sta
te o
f th
e
Cli
mat
e in
20
14
"]. B
ull
. A
mer
. M
eteo
r. S
oc,
in
pri
nt.
Pin
ty&
Go
bro
n, 2
01
5: [G
lob
al C
lim
ate]
Lan
d s
urf
ace
alb
edo
dyn
amic
s 2
01
4[i
n "
Sta
te o
f th
e C
lim
ate
in
20
14
"]. B
ull
. A
mer
. M
eteo
r. S
oc,
in
pri
nt.
LAI/FAPAR/ALBEDO are linked !
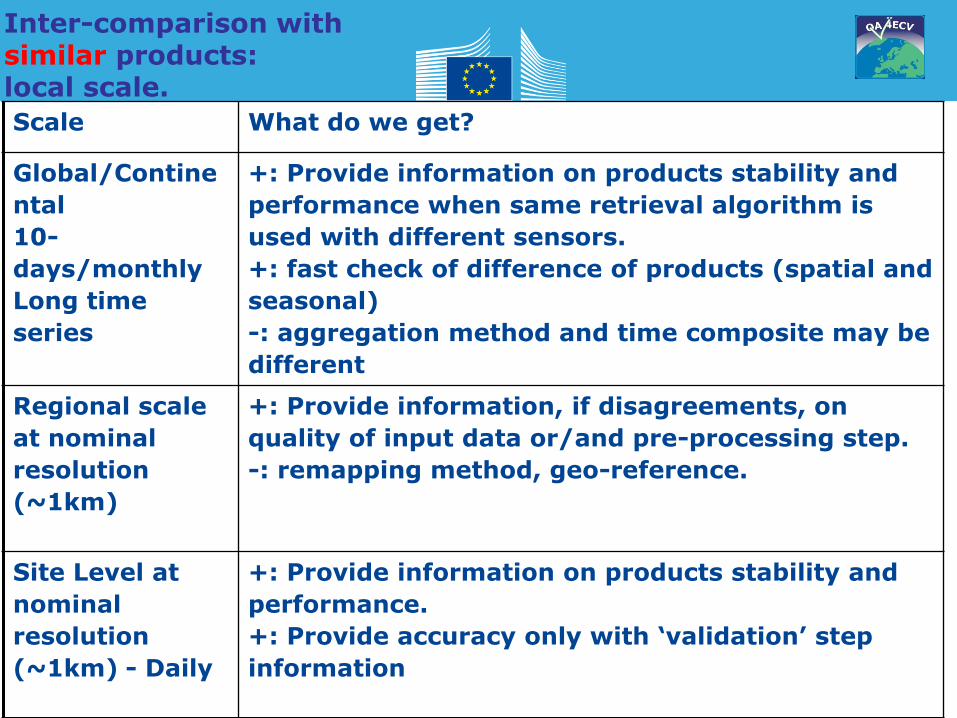
Scale What do we get?
Global/Contine
ntal
10-
days/monthly
Long time
series
+: Provide information on products stability and
performance when same retrieval algorithm is
used with different sensors.
+: fast check of difference of products (spatial and
seasonal)
-: aggregation method and time composite may be
different
Regional scale
at nominal
resolution
(~1km)
+: Provide information, if disagreements, on
quality of input data or/and pre-processing step.
-: remapping method, geo-reference.
Site Level at
nominal
resolution
(~1km) - Daily
+: Provide information on products stability and
performance.
+: Provide accuracy only with ‘validation’ step
information
Inter-comparison with similar products: local scale.
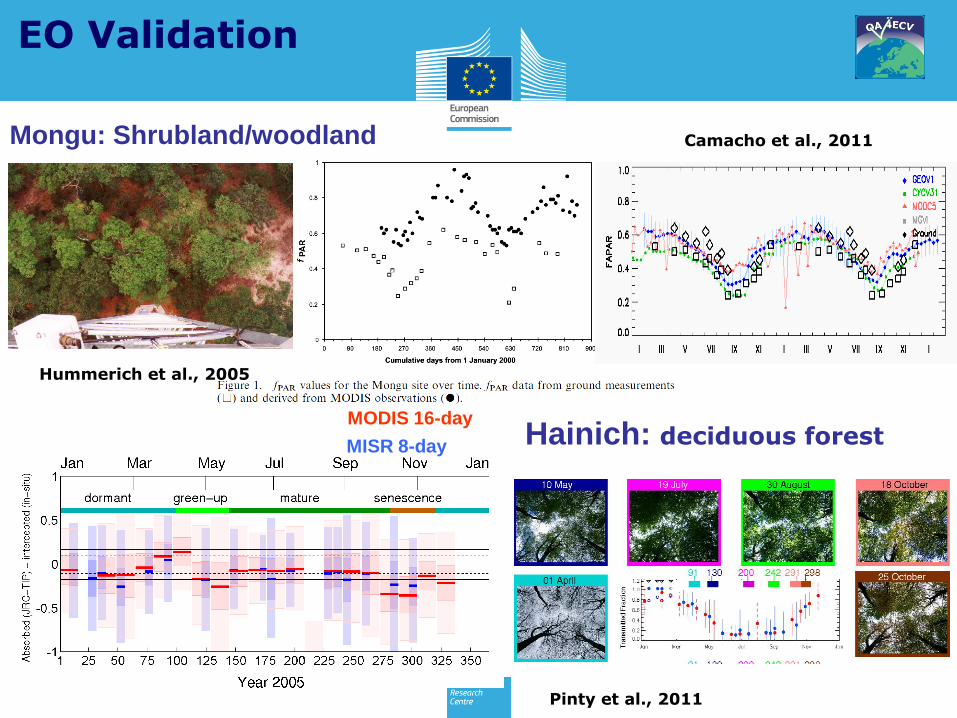
Hummerich et al., 2005
EO Validation
Camacho et al., 2011Mongu: Shrubland/woodland
MODIS 16-day
MISR 8-day
Pinty et al., 2011
Hainich: deciduous forest
controlled architectural,
spectral and illumination
related setup conditions
Elementary Sampling Unit (ESU)
transmission transect
distance along transect
transm
issi
on
thresholded fisheye
image
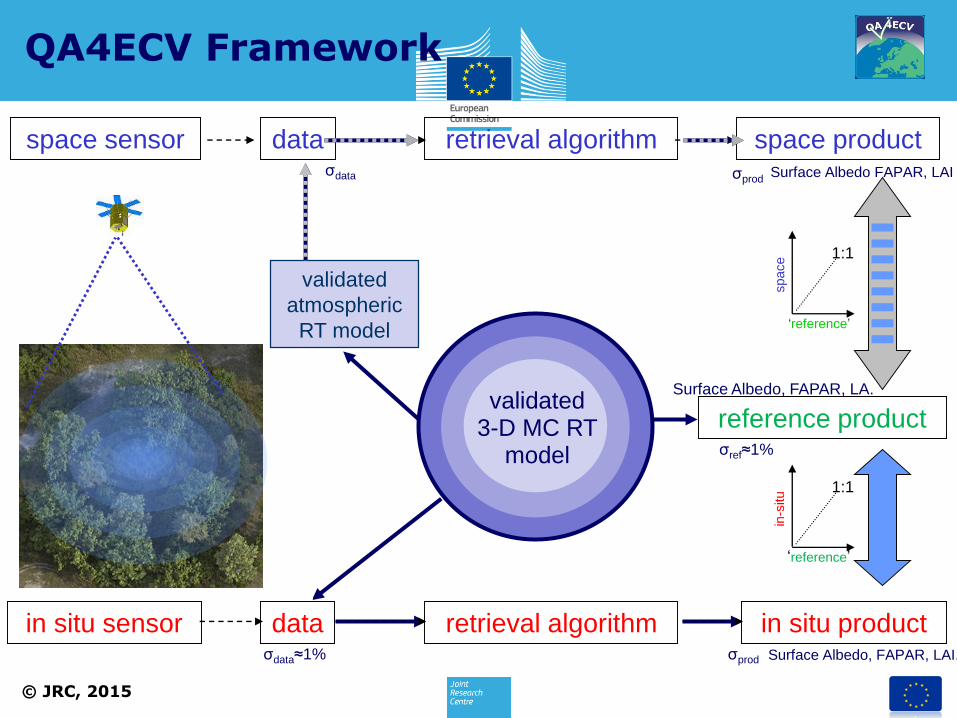
QA4ECV Framework
Surface Albedo, FAPAR, LAI.
validated
atmospheric
RT model
space
‘reference’
1:1
σdata≈1%
reference product
in-s
itu
‘reference’
1:1
Surface Albedo, FAPAR, LA.
σref≈1%
σprod
retrieval algorithmspace sensor data space productSurface Albedo FAPAR, LAIσdata σprod
validated 3-D MC RT
model
in situ productdatain situ sensor retrieval algorithm
© JRC, 2015
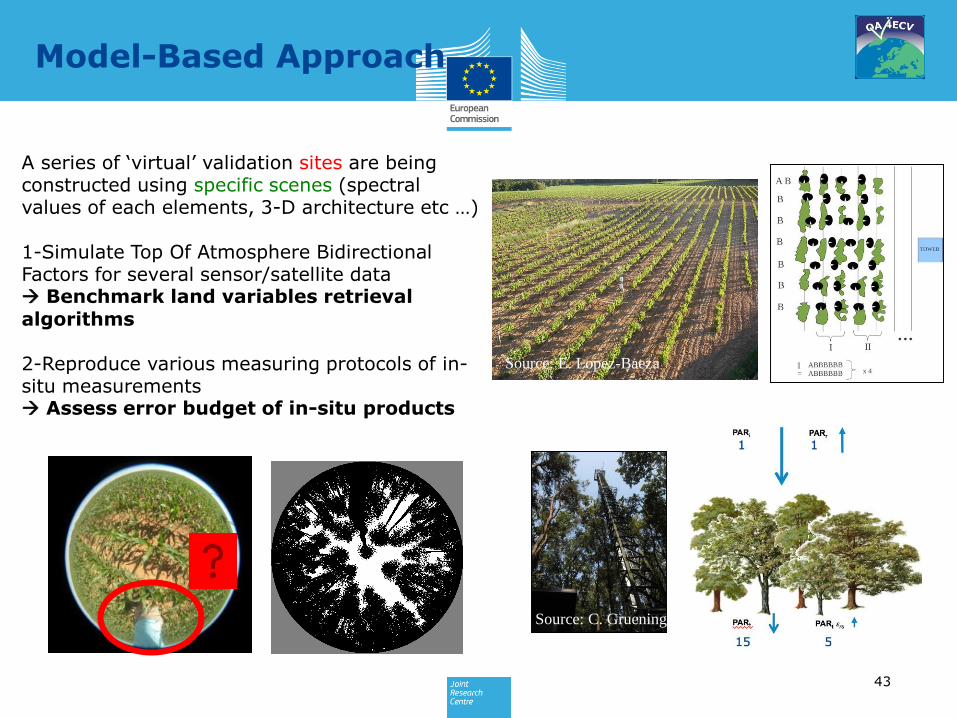
Model-Based Approach
43
A series of ‘virtual’ validation sites are being constructed using specific scenes (spectral values of each elements, 3-D architecture etc …)
1-Simulate Top Of Atmosphere Bidirectional Factors for several sensor/satellite data Benchmark land variables retrieval algorithms
2-Reproduce various measuring protocols of in-situ measurements Assess error budget of in-situ products
Source: E. Lopez-Baeza
Source: C. Gruening
Pag
e4
4V
ers
ion
: 0
2.0
7.2
01
5j.
mu
ller@
ucl
.ac.
uk
Pag
e4
5V
ers
ion
: 0
2.0
7.2
01
5j.
mu
ller@
ucl
.ac.
uk
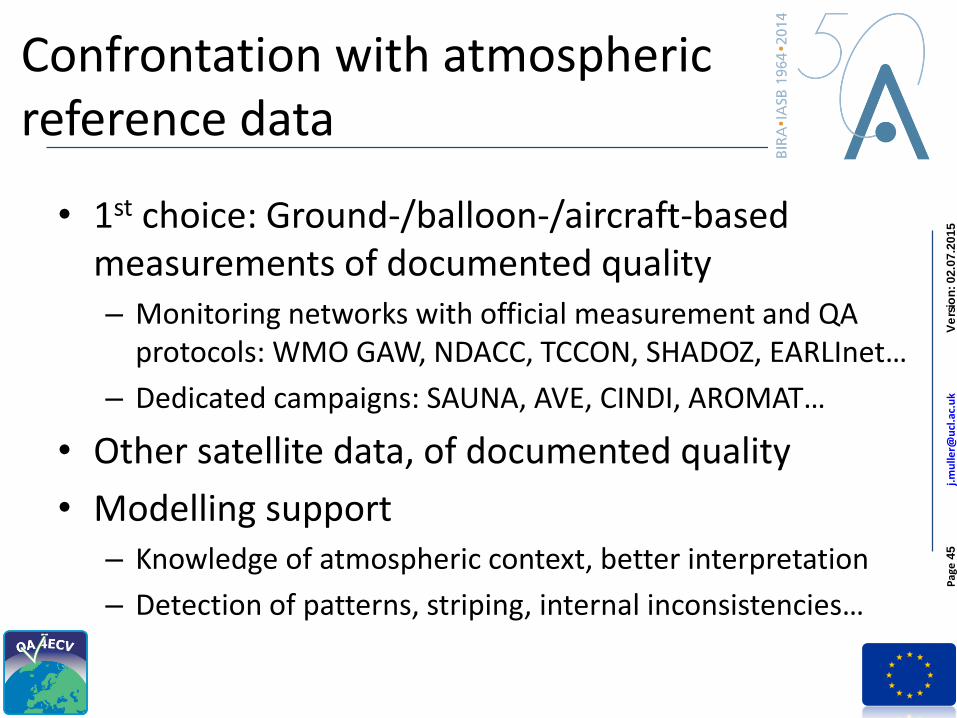
Confrontation with atmospheric reference data
• 1st choice: Ground-/balloon-/aircraft-based measurements of documented quality– Monitoring networks with official measurement and QA
protocols: WMO GAW, NDACC, TCCON, SHADOZ, EARLInet…
– Dedicated campaigns: SAUNA, AVE, CINDI, AROMAT…
• Other satellite data, of documented quality
• Modelling support– Knowledge of atmospheric context, better interpretation
– Detection of patterns, striping, internal inconsistencies…
Pag
e4
6V
ers
ion
: 0
2.0
7.2
01
5j.
mu
ller@
ucl
.ac.
uk
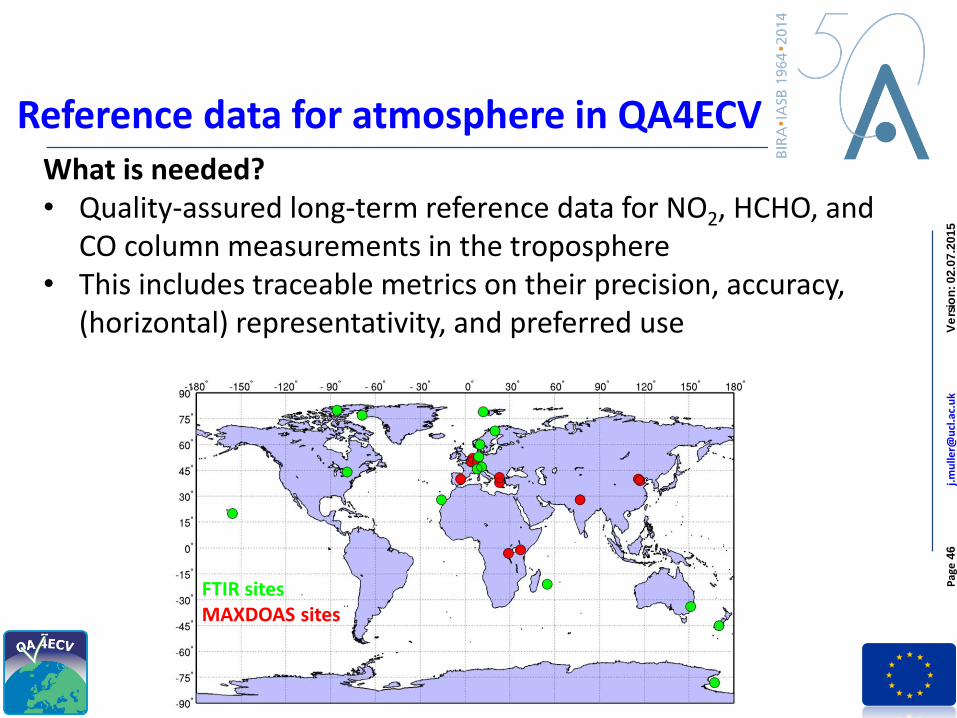
Reference data for atmosphere in QA4ECVWhat is needed?• Quality-assured long-term reference data for NO2, HCHO, and
CO column measurements in the troposphere• This includes traceable metrics on their precision, accuracy,
(horizontal) representativity, and preferred use
FTIR sitesMAXDOAS sites
Pag
e4
7V
ers
ion
: 0
2.0
7.2
01
5j.
mu
ller@
ucl
.ac.
uk
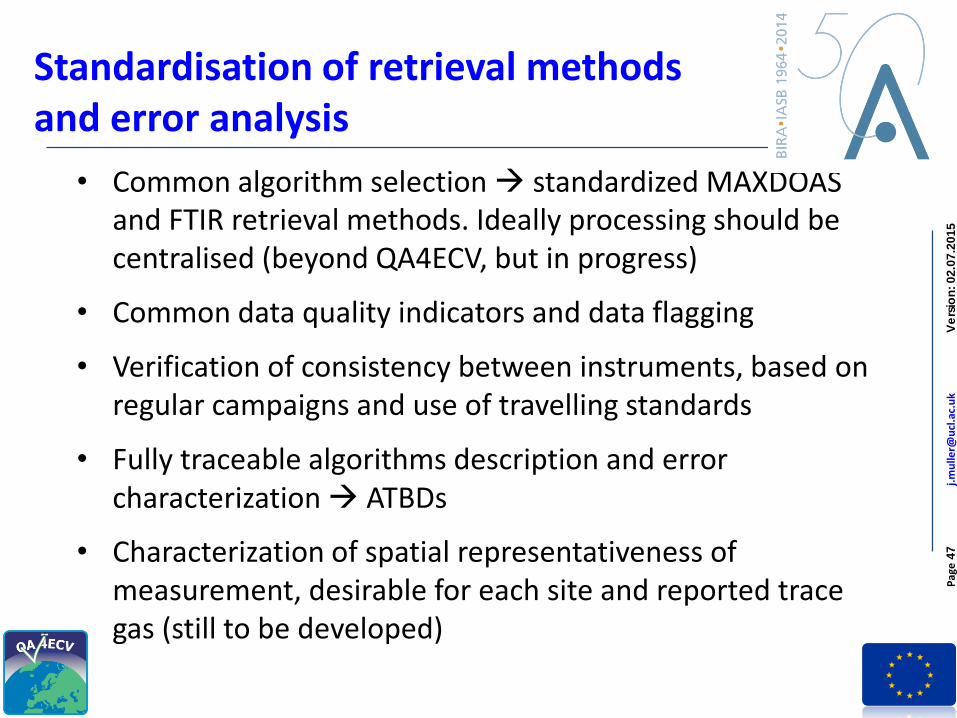
Standardisation of retrieval methods and error analysis
• Common algorithm selection standardized MAXDOAS and FTIR retrieval methods. Ideally processing should be centralised (beyond QA4ECV, but in progress)
• Common data quality indicators and data flagging
• Verification of consistency between instruments, based on regular campaigns and use of travelling standards
• Fully traceable algorithms description and error characterization ATBDs
• Characterization of spatial representativeness of measurement, desirable for each site and reported trace gas (still to be developed)
Pag
e4
8V
ers
ion
: 0
2.0
7.2
01
5j.
mu
ller@
ucl
.ac.
uk
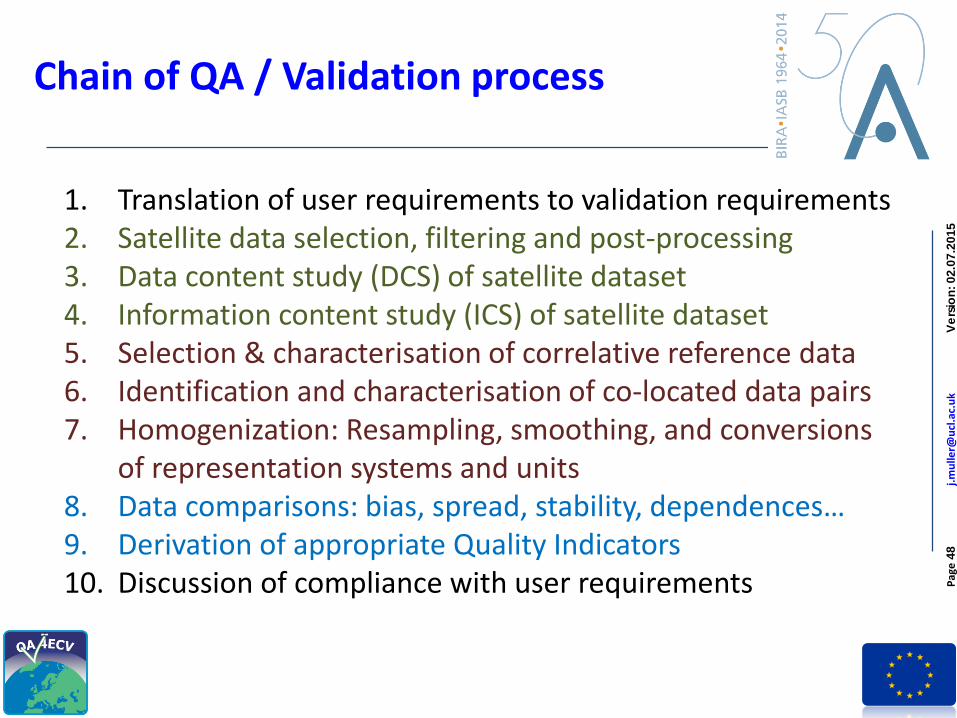
Chain of QA / Validation process
1. Translation of user requirements to validation requirements2. Satellite data selection, filtering and post-processing3. Data content study (DCS) of satellite dataset4. Information content study (ICS) of satellite dataset5. Selection & characterisation of correlative reference data6. Identification and characterisation of co-located data pairs7. Homogenization: Resampling, smoothing, and conversions
of representation systems and units8. Data comparisons: bias, spread, stability, dependences…9. Derivation of appropriate Quality Indicators10. Discussion of compliance with user requirements
Pag
e4
9V
ers
ion
: 0
2.0
7.2
01
5j.
mu
ller@
ucl
.ac.
uk
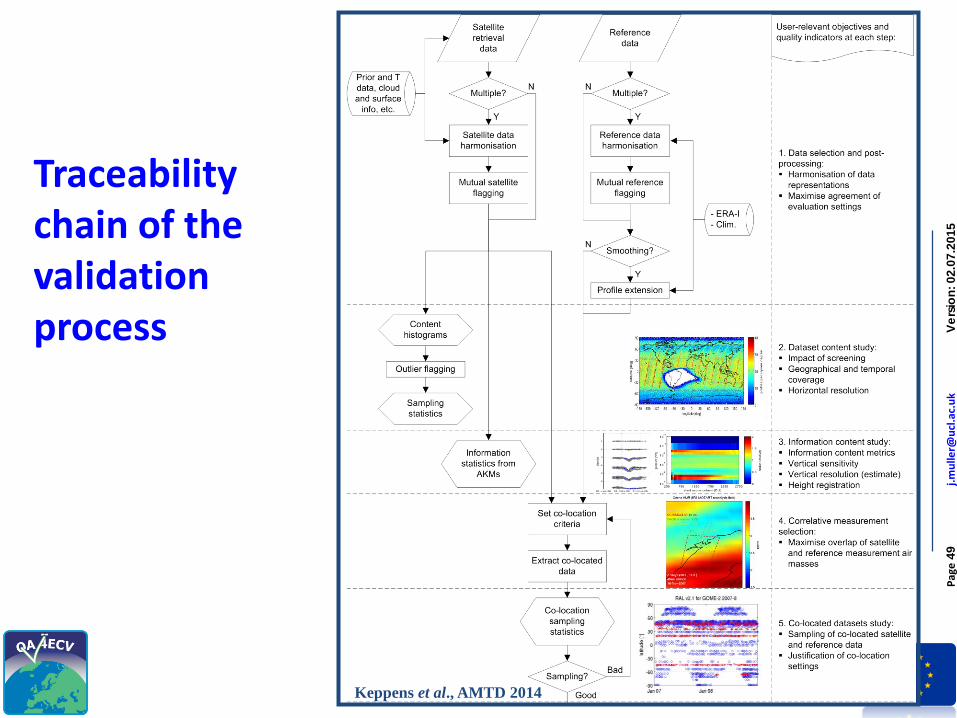
Traceability chain of the validation process
49Keppens et al., AMTD 2014
Pag
e5
0V
ers
ion
: 0
2.0
7.2
01
5j.
mu
ller@
ucl
.ac.
uk
Conclusions & Future Work
• Conclusions:– Protocols are being developed by CEOS-WGCV for land
and atmospheric EO observational product validation– QA4ECV is developing new paradigms for validation of
“in situ”, airborne and EO derived ECVs including validation of algorithms as well as products
• Future Work:– Develop protocols for validation of all 6 ECVs in QA4ECV– Assess the potential of these validation methods for
other ECVs– Assess the use of triple collocation and Hovmoeller
decompositions to hunt for systematic errors