Evaluation of microbial health risks associated with the reuse - DiVA
BEACHWATCH PROGRAMS
PROTOCOL FOR ASSESSMENT AND MANAGEMENT OF MICROBIAL RISKS IN RECREATIONAL WATERS
Implementing Chapter Five of the National Health and Medical Research Council Guidelines for Managing Risks in Recreational Waters
For technical information about this report contact:
Beachwatch, Office of Environment and Heritage NSW 59–61 Goulburn Street, Sydney PO Box A290, Sydney South NSW 1232
Phone: (02) 9995 5344 Fax: (02) 9995 5913
Email: [email protected] Web: www.environment.nsw.gov.au/beach
Published by:
Office of Environment and Heritage NSW 59 Goulburn Street, Sydney PO Box A290, Sydney South NSW 1232
Phone: (02) 9995 5000 (switchboard) Phone: 131 555 (information and publications requests) Fax: (02) 9995 5999 TTY: (02) 9211 4723
Email: [email protected] Website: www.environment.nsw.gov.au
The Office of Environment and Heritage NSW is pleased to allow this material to be reproduced in whole or part, provided the meaning is unchanged and its source, publisher and authorship are acknowledged.
OEH 2011/0865
November 2011 Printed on 100 per cent recycled paper

Table of Contents
Introduction 1 Risk management framework 2 Implementing the microbial guidelines 7
Understanding the microbial quality guidelines 9 Health risks from microbial contamination 9 Microbial quality assessment 13
Selecting sites for assessment l7 Step 1: Identify swimming locations 18 Step 2: Identify pollution sources 18 Step 3: Assess likelihood of pollution from all sources 19 Step 4: Assess consequence of pollution 22 Step 5: Grade beaches using priority rating matrix 23
Sanitary inspection 27 The steps 27 Resources 27 Step 1: Define the swimming area and catchment 28 Step 2: Identify pollution sources and gather information 29 Step 3: Assess likelihood for identified pollution sources 31 Step 4: Assess Sanitary Inspection Category 43 Step 5: Workshop the findings 44
Microbial water quality monitoring 45 Sampling design 45
Indicator bacteria 46 Documentation 47 Sampling procedure 47 Occupational health and safety 49 Laboratory analysis 51 Resource and planning issues 53
Microbial assessment and beach classification Microbial Assessment Categories 55 Determination of Beach Suitability Grades 56 Data analysis 58
Reporting 59 Annual classifications 59 Daily bulletins 60 Star ratings 63 Press release 64 The Communication Plan 64
Management 67 Management actions 67 Triggers for Management Actions 69 Development of Incident Response Plans 70
References 73
Appendix A: Sanitary inspection paperbase Al Appendix B: Field manual Bl Appendix C: Instructions for Enterotester Cl

Overview
Overview
Managing risks in recreational water
Introduction
Coastal environments are rich in natural and cultural resources and are the focus of economic, social, tourist and recreational activities. However, these environments can also pose threats to human health and safety through the presence of physical hazards, dangerous aquatic organisms and pollution.
In 2008, the National Health and Medical Research Council (NHMRC) endorsed Guidelines for Managing Risks in Recreational Water (NHMRC 2008). The 2008 guidelines supersede the Australian Guidelines for Use of Recreational Water (NHMRC 1990) and replace some sections of the Australian Water Quality Guidelines for Fresh and Marine Waters (ANZECC 2000).
The NHMRC 2008 guidelines are based on the World Health Organisation (WHO) Guidelines for Safe Recreational Water Environments (WHO 2003) and combine international best-practice with an understanding of Australian waters to provide guidance relevant to local conditions.
The primary aim of the 2008 guidelines is to protect human health. Unlike the earlier guidelines, which focused on water quality compliance, the new guidelines advocate a preventative, risk management approach with focus on assessing, managing and reducing risks.
This document
This document replaces the Information Package and Field Manual developed in 2004 as part of the Beachwatch Partnership Pilot Program (DEC 2004).
It was developed to promote and support implementation of a key component of the NHMRC 2008 guidelines: Chapter 5 - Microbial Quality of Recreational Water. It provides water resource managers in New South Wales with the practical information necessary to design and implement programs for assessing risk from microbial contamination in recreational waters and to devise effective management solutions.
Page 1
Overview
This document has three key objectives:
• To raise awareness and understanding of the risks associated with microbial contamination of recreational waters
• To facilitate the adoption and consistent implementation of the NHMRC 2008 guidelines
• To increase community access to information on recreational water quality.
This overview outlines the risk management framework used by the new guidelines, defines the uses and users of recreational waters and describes how to use this protocol.
Risk management framework
Identify hazards
A hazard is a chemical, biological or physical agent that has the potential to cause harm, such as death, illness or injury (NHMRC/NRMMC 2004). There are many potential hazards in recreational waters, and the 2008 guidelines cover the following (Table 1):
• Physical hazards, such as drowning, near-drowning and spinal injuries
• Sun, heat and cold and water temperature
• Microbial contamination
• Toxic algae and cyanobacteria in fresh and marine waters
• Chemical contamination, pH and dissolved oxygen
• Dangerous or venomous aquatic organisms
• Aesthetic aspects
Assess risk
Risk is the likelihood that a hazard or hazardous event will occur and the consequences if it does.
Hazards pose greatly differing risks. Risk increases with the probability of hazardous event occurring and the magnitude of the consequences (Figure 1).
A hazard which occurs infrequently and has little impact on human health will be assessed as low risk. In contrast, a hazard which is known to occur with some regularity and leads to serious injury will be assessed as high risk.
Page 2
Overview
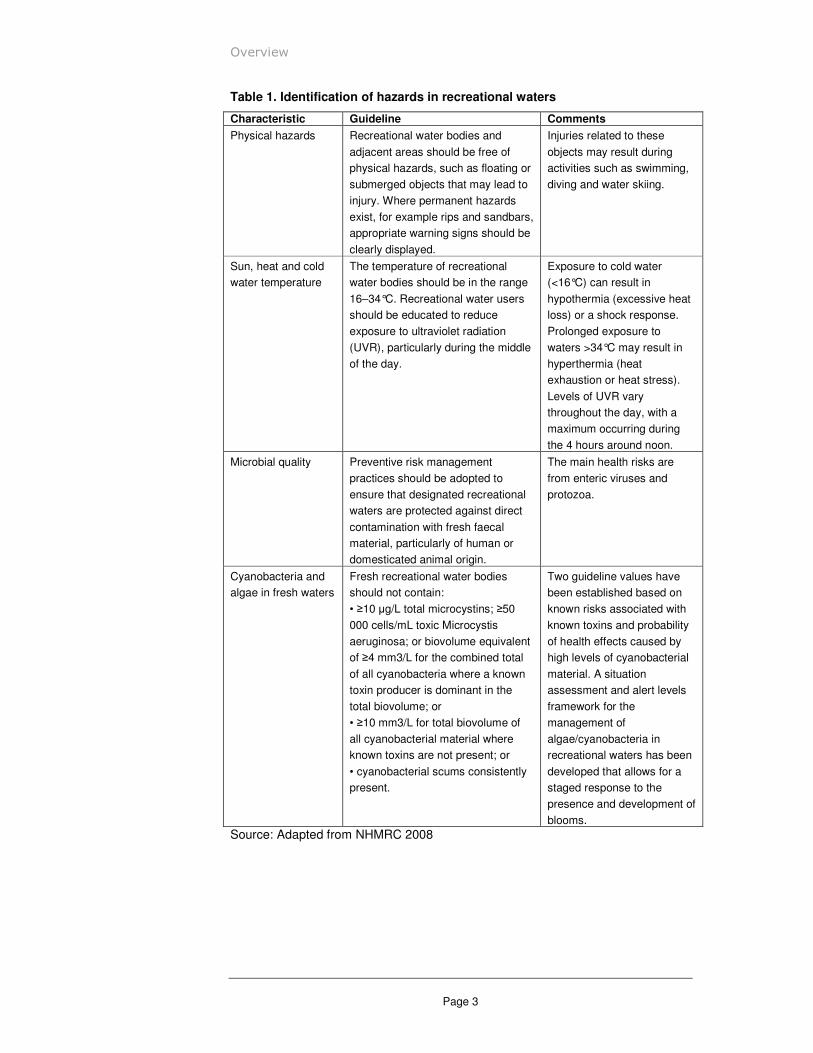
Table 1. Identification of hazards in recreational waters
Characteristic Guideline Comments
Physical hazards Recreational water bodies and
adjacent areas should be free of
physical hazards, such as floating or
submerged objects that may lead to
injury. Where permanent hazards
exist, for example rips and sandbars,
appropriate warning signs should be
clearly displayed.
Injuries related to these
objects may result during
activities such as swimming,
diving and water skiing.
Sun, heat and cold The temperature of recreational Exposure to cold water
water temperature water bodies should be in the range
16–34°C. Recreational water users
should be educated to reduce
exposure to ultraviolet radiation
(UVR), particularly during the middle
of the day.
(<16°C) can result in
hypothermia (excessive heat
loss) or a shock response.
Prolonged exposure to
waters >34°C may result in
hyperthermia (heat
exhaustion or heat stress).
Levels of UVR vary
throughout the day, with a
maximum occurring during
the 4 hours around noon.
Microbial quality Preventive risk management
practices should be adopted to
ensure that designated recreational
waters are protected against direct
contamination with fresh faecal
material, particularly of human or
domesticated animal origin.
The main health risks are
from enteric viruses and
protozoa.
Cyanobacteria and Fresh recreational water bodies Two guideline values have
algae in fresh waters should not contain:
• ;10 1g/L total microcystins; ;50
000 cells/mL toxic Microcystis
aeruginosa; or biovolume equivalent
of ;4 mm3/L for the combined total
of all cyanobacteria where a known
toxin producer is dominant in the
total biovolume; or
• ;10 mm3/L for total biovolume of
all cyanobacterial material where
known toxins are not present; or
• cyanobacterial scums consistently
present.
been established based on
known risks associated with
known toxins and probability
of health effects caused by
high levels of cyanobacterial
material. A situation
assessment and alert levels
framework for the
management of
algae/cyanobacteria in
recreational waters has been
developed that allows for a
staged response to the
presence and development of
blooms.
Source: Adapted from NHMRC 2008
Page 3
Overview
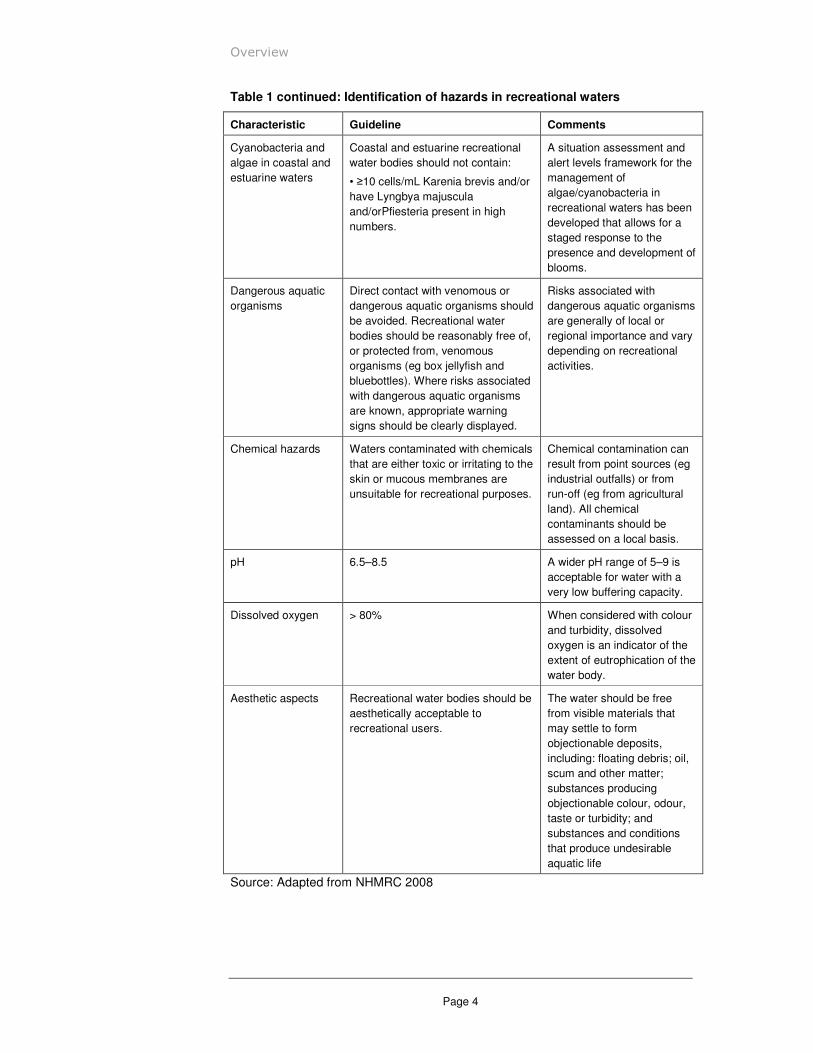
Table 1 continued: Identification of hazards in recreational waters
Characteristic Guideline Comments
Cyanobacteria and Coastal and estuarine recreational A situation assessment and
algae in coastal and water bodies should not contain: alert levels framework for the
estuarine waters • ;10 cells/mL Karenia brevis and/or
have Lyngbya majuscula
and/orPfiesteria present in high
numbers.
management of
algae/cyanobacteria in
recreational waters has been
developed that allows for a
staged response to the
presence and development of
blooms.
Dangerous aquatic Direct contact with venomous or Risks associated with
organisms dangerous aquatic organisms should
be avoided. Recreational water
bodies should be reasonably free of,
or protected from, venomous
organisms (eg box jellyfish and
bluebottles). Where risks associated
with dangerous aquatic organisms
are known, appropriate warning
signs should be clearly displayed.
dangerous aquatic organisms
are generally of local or
regional importance and vary
depending on recreational
activities.
Chemical hazards Waters contaminated with chemicals
that are either toxic or irritating to the
skin or mucous membranes are
unsuitable for recreational purposes.
Chemical contamination can
result from point sources (eg
industrial outfalls) or from
run-off (eg from agricultural
land). All chemical
contaminants should be
assessed on a local basis.
pH 6.5–8.5 A wider pH range of 5–9 is
acceptable for water with a
very low buffering capacity.
Dissolved oxygen > 80% When considered with colour
and turbidity, dissolved
oxygen is an indicator of the
extent of eutrophication of the
water body.
Aesthetic aspects Recreational water bodies should be
aesthetically acceptable to
recreational users.
The water should be free
from visible materials that
may settle to form
objectionable deposits,
including: floating debris; oil,
scum and other matter;
substances producing
objectionable colour, odour,
taste or turbidity; and
substances and conditions
that produce undesirable
aquatic life
Source: Adapted from NHMRC 2008
Page 4

Overview
Figure 1. Schematic of risk assessment based on probability (likelihood) and consequence (source: WHO 2003)
Manage risk
Attention and resources should be focused on the level of risk rather than the existence of a hazard.
For healthy adults, recreational waters which conform to the guidelines presented in Table 1 will pose only minimal risks. The risks may be greater for susceptible groups such as small children or the elderly. While it is not possible to completely eliminate risk, it should be reduced to tolerable levels through management actions, such as those listed in Table 2.
Uses and users of recreational water
The 2008 guidelines can be applied to a wide range of recreational water environments, such as any coastal, estuarine or freshwater area used by the community for recreation.
Recreation covers a range of activities and is classified as follows (from NHMRC 2008):
• Whole body contact (primary contact) - an activity where the whole body, face or trunk are frequently immersed, or the face is frequently wet by spray and where it is likely that water will be swallowed or come into contact with the ears, eyes, nasal passages or cuts in the skin. Examples are swimming, diving, surfing and whitewater canoeing.
• Incidental contact (secondary contact) - an activity where only the limbs are regularly wet and greater contact, including swallowing water, is unusual, includes activities where occasional and inadvertent immersion through slipping or wave action. Examples are boating, fishing and wading.
• No contact (aesthetic use) - an activity where there is normally no contact with the water or where water is incidental to the activity. Examples include angling from the shore and sunbathing.
Users of recreational waters include the general public as well as tourists and special interest groups such as sportspeople. Some user groups,
Page 5
Overview
such as children, the elderly, people with compromised immune systems, tourists and people from culturally or linguistically diverse backgrounds are most susceptible to exposure to hazards.
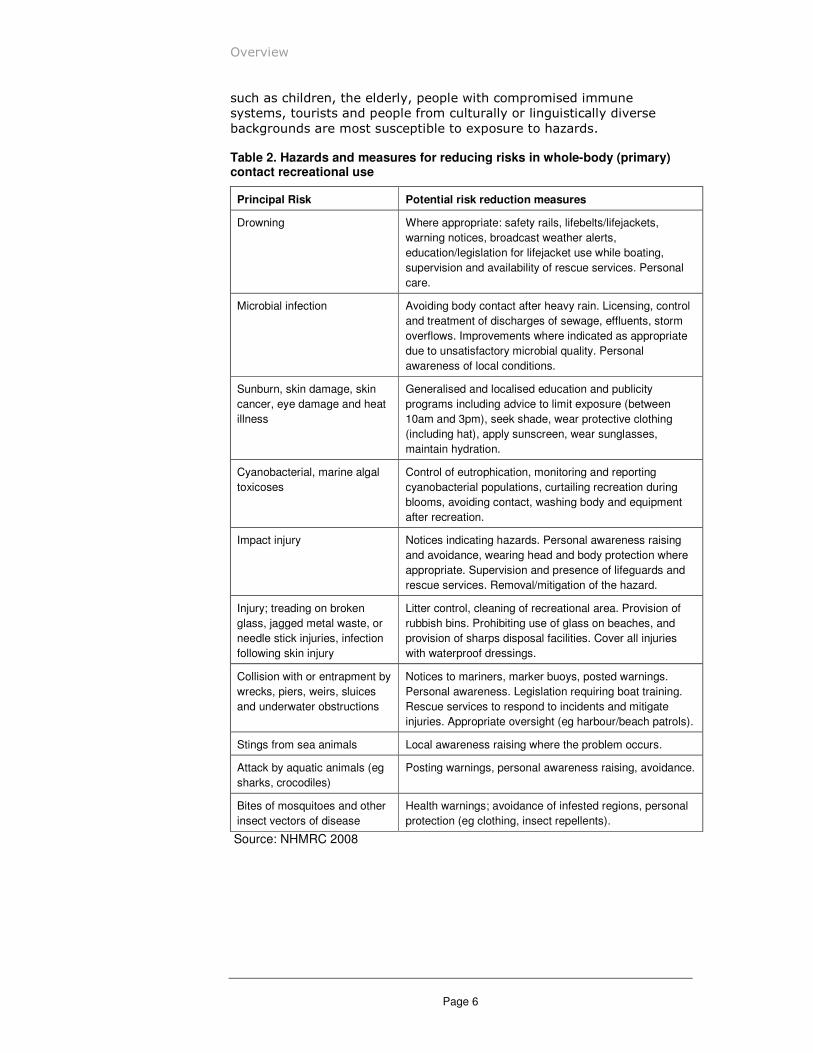
Table 2. Hazards and measures for reducing risks in whole-body (primary) contact recreational use
Principal Risk Potential risk reduction measures
Drowning Where appropriate: safety rails, lifebelts/lifejackets,
warning notices, broadcast weather alerts,
education/legislation for lifejacket use while boating,
supervision and availability of rescue services. Personal
care.
Microbial infection Avoiding body contact after heavy rain. Licensing, control
and treatment of discharges of sewage, effluents, storm
overflows. Improvements where indicated as appropriate
due to unsatisfactory microbial quality. Personal
awareness of local conditions.
Sunburn, skin damage, skin
cancer, eye damage and heat
illness
Generalised and localised education and publicity
programs including advice to limit exposure (between
10am and 3pm), seek shade, wear protective clothing
(including hat), apply sunscreen, wear sunglasses,
maintain hydration.
Cyanobacterial, marine algal
toxicoses
Control of eutrophication, monitoring and reporting
cyanobacterial populations, curtailing recreation during
blooms, avoiding contact, washing body and equipment
after recreation.
Impact injury Notices indicating hazards. Personal awareness raising
and avoidance, wearing head and body protection where
appropriate. Supervision and presence of lifeguards and
rescue services. Removal/mitigation of the hazard.
Injury; treading on broken
glass, jagged metal waste, or
needle stick injuries, infection
following skin injury
Litter control, cleaning of recreational area. Provision of
rubbish bins. Prohibiting use of glass on beaches, and
provision of sharps disposal facilities. Cover all injuries
with waterproof dressings.
Collision with or entrapment by
wrecks, piers, weirs, sluices
and underwater obstructions
Notices to mariners, marker buoys, posted warnings.
Personal awareness. Legislation requiring boat training.
Rescue services to respond to incidents and mitigate
injuries. Appropriate oversight (eg harbour/beach patrols).
Stings from sea animals Local awareness raising where the problem occurs.
Attack by aquatic animals (eg
sharks, crocodiles)
Posting warnings, personal awareness raising, avoidance.
Bites of mosquitoes and other
insect vectors of disease
Health warnings; avoidance of infested regions, personal
protection (eg clothing, insect repellents).
Source: NHMRC 2008
Page 6
Overview
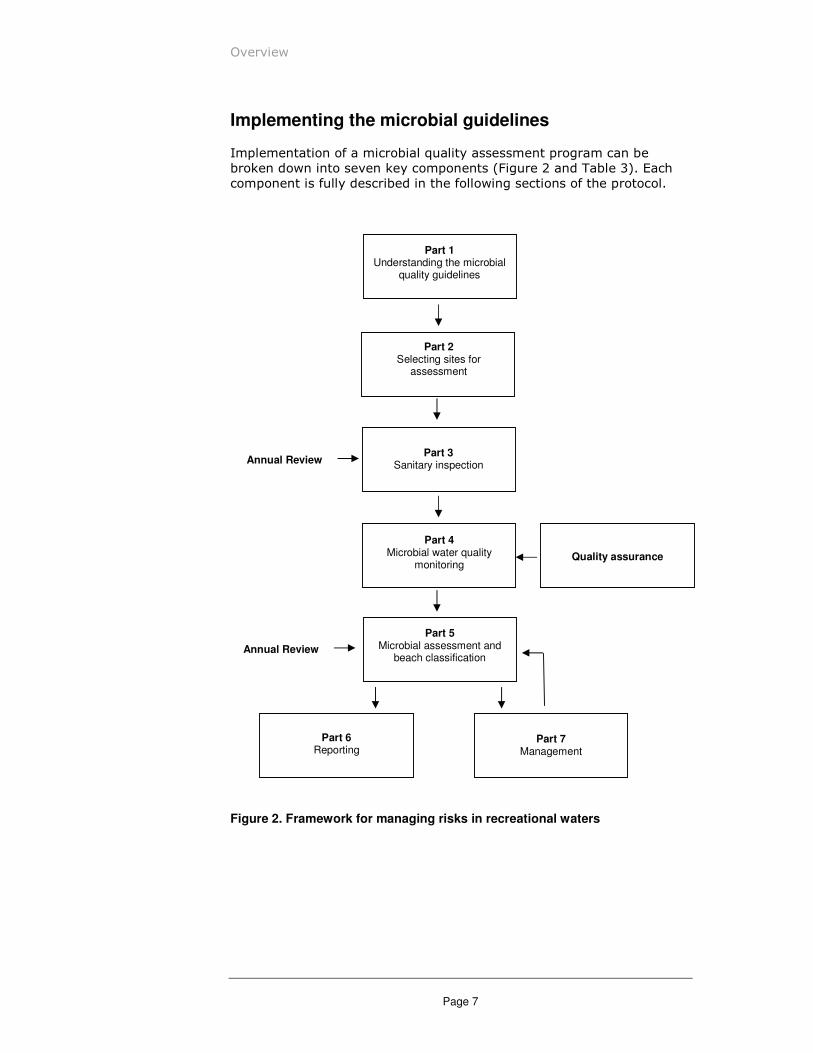
Implementing the microbial guidelines
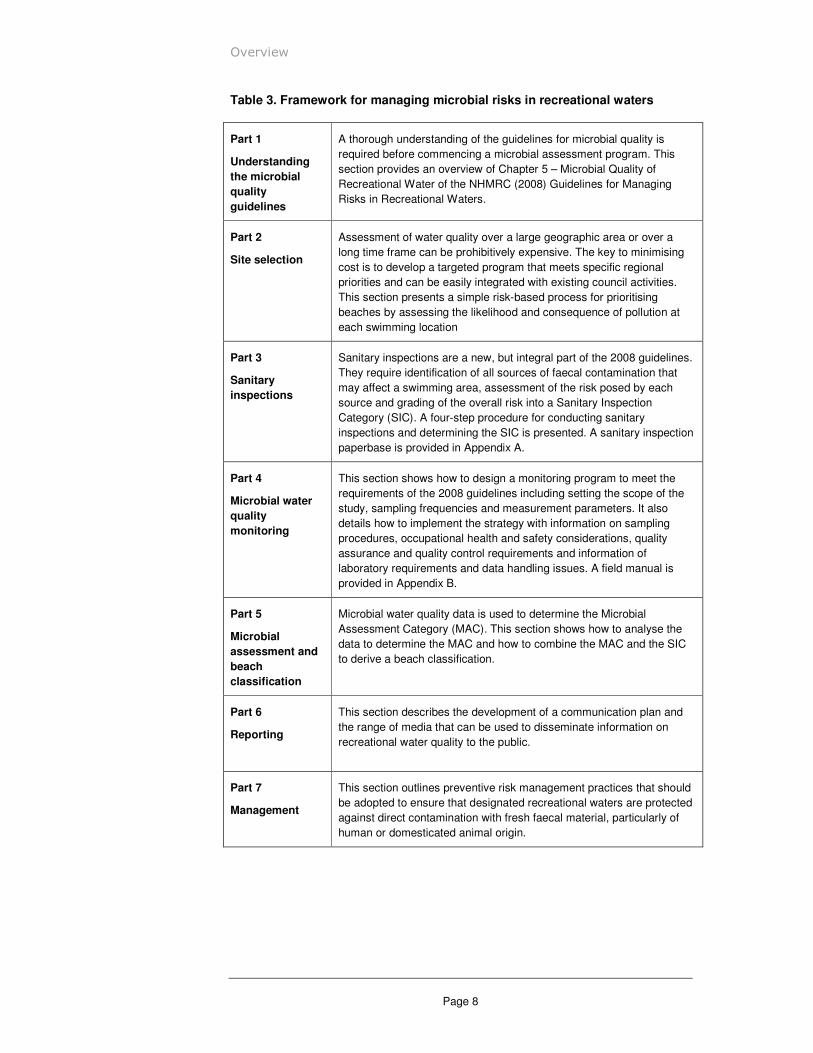
Implementation of a microbial quality assessment program can be broken down into seven key components (Figure 2 and Table 3). Each component is fully described in the following sections of the protocol.
Part 1 Understanding the microbial
quality guidelines
Part 2 Selecting sites for
assessment
Part 3 Annual Review Sanitary inspection
Part 5 Microbial assessment and
beach classification
Part 4 Microbial water quality
monitoring Quality assurance
Annual Review
Part 6 Part 7 Reporting Management
Figure 2. Framework for managing risks in recreational waters
Page 7
Overview
Table 3. Framework for managing microbial risks in recreational waters
Part 1 A thorough understanding of the guidelines for microbial quality is
Understanding
the microbial
quality
guidelines
required before commencing a microbial assessment program. This
section provides an overview of Chapter 5 – Microbial Quality of
Recreational Water of the NHMRC (2008) Guidelines for Managing
Risks in Recreational Waters.
Part 2
Site selection
Assessment of water quality over a large geographic area or over a
long time frame can be prohibitively expensive. The key to minimising
cost is to develop a targeted program that meets specific regional
priorities and can be easily integrated with existing council activities.
This section presents a simple risk-based process for prioritising
beaches by assessing the likelihood and consequence of pollution at
each swimming location
Part 3
Sanitary
inspections
Sanitary inspections are a new, but integral part of the 2008 guidelines.
They require identification of all sources of faecal contamination that
may affect a swimming area, assessment of the risk posed by each
source and grading of the overall risk into a Sanitary Inspection
Category (SIC). A four-step procedure for conducting sanitary
inspections and determining the SIC is presented. A sanitary inspection
paperbase is provided in Appendix A.
Part 4
Microbial water
quality
monitoring
This section shows how to design a monitoring program to meet the
requirements of the 2008 guidelines including setting the scope of the
study, sampling frequencies and measurement parameters. It also
details how to implement the strategy with information on sampling
procedures, occupational health and safety considerations, quality
assurance and quality control requirements and information of
laboratory requirements and data handling issues. A field manual is
provided in Appendix B.
Part 5
Microbial
assessment and
beach
classification
Microbial water quality data is used to determine the Microbial
Assessment Category (MAC). This section shows how to analyse the
data to determine the MAC and how to combine the MAC and the SIC
to derive a beach classification.
Part 6 This section describes the development of a communication plan and
the range of media that can be used to disseminate information on Reporting
recreational water quality to the public.
Part 7
Management
This section outlines preventive risk management practices that should
be adopted to ensure that designated recreational waters are protected
against direct contamination with fresh faecal material, particularly of
human or domesticated animal origin.
Page 8
Understanding the microbial water quality guidelines
Part
1 Understanding the microbial quality guidelines
Health risks from microbial contamination
Contamination of recreational waters with faecal material from animal and human sources can pose significant health problems to beach users due to the presence of pathogens, or disease causing micro-organisms, in the faecal material. The most common groups of pathogens found in recreational waters are bacteria, protozoans and viruses.
Bacteria
There are many thousands of species of these simple single-celled organisms. The vast majority of bacteria are harmless and perform a variety of essential roles, including the breakdown of organic material, fermentation and nitrogen fixing. Enteric bacteria live in the intestinal tracts of warm-blooded animals and help with digestion. Several groups of bacteria are pathogenic: these include Salmonella, which can cause typhoid fever, and Vibrio, which can cause cholera.
Protozoans
These single-celled organisms live as parasites in humans and animals. In the environment, they exist as dormant cysts, enabling them to survive harsh conditions such as high temperatures and salinity. When swallowed by a host, the protozoans multiply and are spread through excretion of faeces. At the height of an infection, there may be between two and ten million cysts in every gram of faeces excreted. Approximately 30% of the 35,000 known species of protozoans are pathogenic. Giardia lamblia and Cryptosporidium parvum are two of the best known pathogenic protozoans.
Viruses
These consist of nucleic acid (RNA or DNA) surrounded by a protein shell. Viruses are not able to take in food, get rid of waste or reproduce by themselves. Viral infection does not always lead to disease. In some cases the host will have no symptoms; in others the host will become very ill. Person-to-person contact is the most common transmission
Page 9
Understanding the microbial water quality guidelines
route. Viruses found in water include hepatitis A and E, norovirus, coxsackie, rotavirus and adenovirus.
Exposure
Exposure to waterborne human pathogens when at the beach can occur through direct contact with polluted water while swimming, by accidental ingestion of contaminated water or by inhalation of small water droplets in the air.
Primary contact with contaminated water can cause a variety of diseases of the gastrointestinal tract, collectively known as gastroenteritis. Symptoms of gastroenteritis include vomiting, diarrhoea, stomach-ache, nausea, headache and fever.
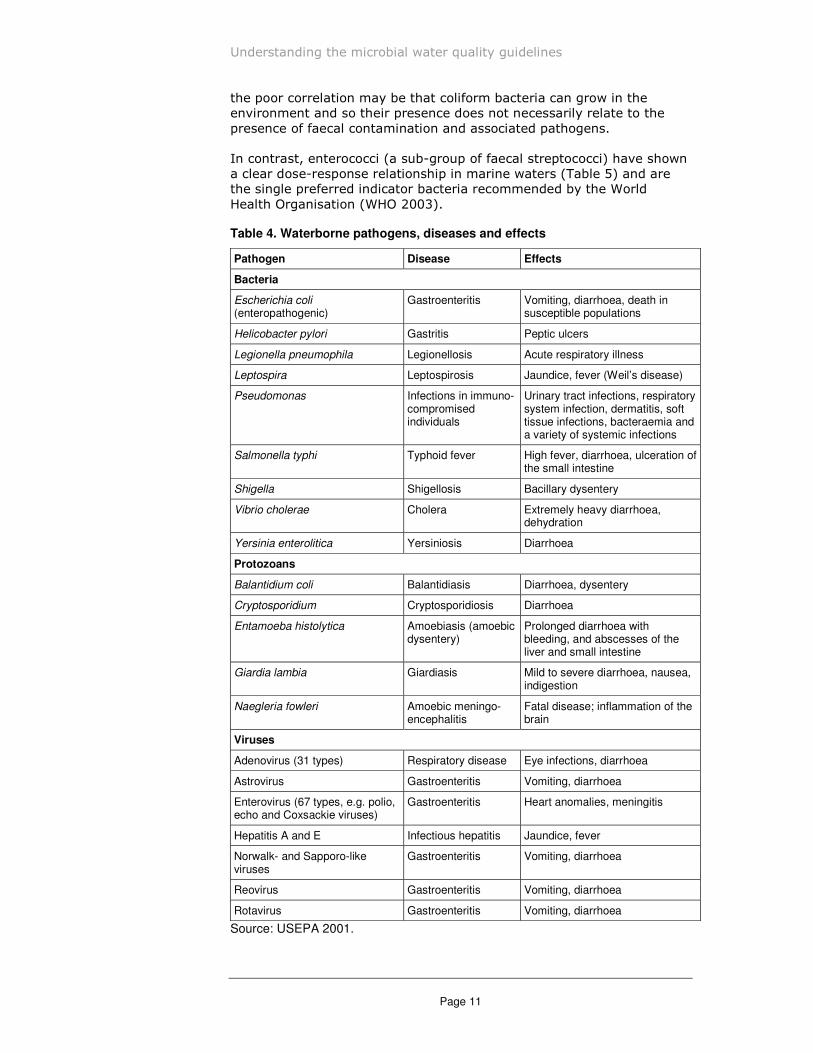
Diseases and conditions that affect the eyes, ears, skin and upper respiratory tract can also be contracted when pathogens come into contact with small breaks and tears in the skin or ruptures of the delicate membranes in the ear or nose. Some waterborne pathogens, the diseases they cause and their effects are listed in Table 4.
Epidemiological studies
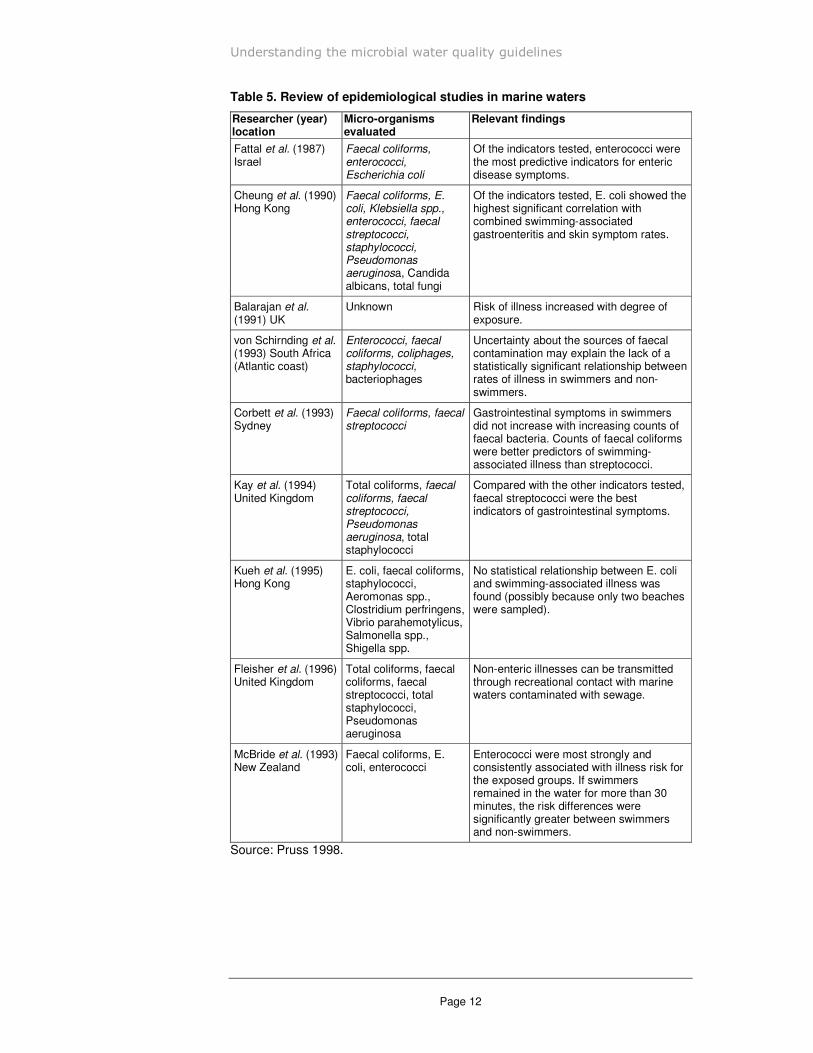
People who contract diseases as a result of swimming in contaminated water do not always associate their illness symptoms with this contact. As a result, disease outbreaks are often inconsistently reported. As the incidence of disease among swimmers is difficult to determine, numerous studies have been conducted in an attempt to establish a link between illness and the level of faecal contamination. A review of these studies by Pruss (1998) drew two conclusions:
• The relative risk of swimming in contaminated water ranged from one to three times above the risk associated with swimming in uncontaminated water.
• Symptom rates were higher in individuals with compromised immune systems.
Table 5 contains a summary of the epidemiological studies reviewed by Pruss, with references provided for further reading.
Certain groups of users may be more exposed to the threat of microbial infection than others. Children, the elderly, people with compromised immune systems, tourists and people from culturally and linguistically diverse backgrounds are generally most at risk.
Indicator organisms
NHMRC 2008 advocates the use of enterococci as the indicator organism for assessing risks from microbial contamination in recreational waters.
Thermotolerant coliforms (also known as faecal coliforms) have traditionally been used to assess levels of faecal contamination in recreational waters. However, epidemiological studies have found no clear relationship between levels of these bacteria and disease rates in swimmers (also called the dose-response relationship). One reason for
Page 10
Understanding the microbial water quality guidelines
the poor correlation may be that coliform bacteria can grow in the environment and so their presence does not necessarily relate to the presence of faecal contamination and associated pathogens.
In contrast, enterococci (a sub-group of faecal streptococci) have shown a clear dose-response relationship in marine waters (Table 5) and are the single preferred indicator bacteria recommended by the World Health Organisation (WHO 2003).
Table 4. Waterborne pathogens, diseases and effects
Pathogen Disease Effects
Bacteria
Escherichia coli (enteropathogenic)
Gastroenteritis Vomiting, diarrhoea, death in susceptible populations
Helicobacter pylori Gastritis Peptic ulcers
Legionella pneumophila Legionellosis Acute respiratory illness
Leptospira Leptospirosis Jaundice, fever (Weil’s disease)
Pseudomonas Infections in immunocompromised individuals
Urinary tract infections, respiratory system infection, dermatitis, soft tissue infections, bacteraemia and a variety of systemic infections
Salmonella typhi Typhoid fever High fever, diarrhoea, ulceration of the small intestine
Shigella Shigellosis Bacillary dysentery
Vibrio cholerae Cholera Extremely heavy diarrhoea, dehydration
Yersinia enterolitica Yersiniosis Diarrhoea
Protozoans
Balantidium coli Balantidiasis Diarrhoea, dysentery
Cryptosporidium Cryptosporidiosis Diarrhoea
Entamoeba histolytica Amoebiasis (amoebic dysentery)
Prolonged diarrhoea with bleeding, and abscesses of the liver and small intestine
Giardia lambia Giardiasis Mild to severe diarrhoea, nausea, indigestion
Naegleria fowleri Amoebic meningoencephalitis
Fatal disease; inflammation of the brain
Viruses
Adenovirus (31 types) Respiratory disease Eye infections, diarrhoea
Astrovirus Gastroenteritis Vomiting, diarrhoea
Enterovirus (67 types, e.g. polio, echo and Coxsackie viruses)
Gastroenteritis Heart anomalies, meningitis
Hepatitis A and E Infectious hepatitis Jaundice, fever
Norwalk- and Sapporo-like viruses
Gastroenteritis Vomiting, diarrhoea
Reovirus Gastroenteritis Vomiting, diarrhoea
Rotavirus Gastroenteritis Vomiting, diarrhoea
Source: USEPA 2001.
Page 11
Understanding the microbial water quality guidelines
Table 5. Review of epidemiological studies in marine waters
Researcher (year) location
Micro-organisms evaluated
Relevant findings
Fattal et al. (1987) Israel
Faecal coliforms, enterococci, Escherichia coli
Of the indicators tested, enterococci were the most predictive indicators for enteric disease symptoms.
Cheung et al. (1990) Hong Kong
Faecal coliforms, E. coli, Klebsiella spp., enterococci, faecal streptococci, staphylococci, Pseudomonas aeruginosa, Candida albicans, total fungi
Of the indicators tested, E. coli showed the highest significant correlation with combined swimming-associated gastroenteritis and skin symptom rates.
Balarajan et al. (1991) UK
Unknown Risk of illness increased with degree of exposure.
von Schirnding et al. Enterococci, faecal Uncertainty about the sources of faecal (1993) South Africa coliforms, coliphages, contamination may explain the lack of a (Atlantic coast) staphylococci,
bacteriophages statistically significant relationship between rates of illness in swimmers and non-swimmers.
Corbett et al. (1993) Sydney
Faecal coliforms, faecal streptococci
Gastrointestinal symptoms in swimmers did not increase with increasing counts of faecal bacteria. Counts of faecal coliforms were better predictors of swimming-associated illness than streptococci.
Kay et al. (1994) Total coliforms, faecal Compared with the other indicators tested, United Kingdom coliforms, faecal
streptococci, Pseudomonas aeruginosa, total staphylococci
faecal streptococci were the best indicators of gastrointestinal symptoms.
Kueh et al. (1995) Hong Kong
E. coli, faecal coliforms, staphylococci, Aeromonas spp., Clostridium perfringens, Vibrio parahemotylicus, Salmonella spp., Shigella spp.
No statistical relationship between E. coli and swimming-associated illness was found (possibly because only two beaches were sampled).
Fleisher et al. (1996) Total coliforms, faecal Non-enteric illnesses can be transmitted United Kingdom coliforms, faecal
streptococci, total staphylococci, Pseudomonas aeruginosa
through recreational contact with marine waters contaminated with sewage.
McBride et al. (1993) New Zealand
Faecal coliforms, E. coli, enterococci
Enterococci were most strongly and consistently associated with illness risk for the exposed groups. If swimmers remained in the water for more than 30 minutes, the risk differences were significantly greater between swimmers and non-swimmers.
Source: Pruss 1998.
Page 12
Understanding the microbial water quality guidelines
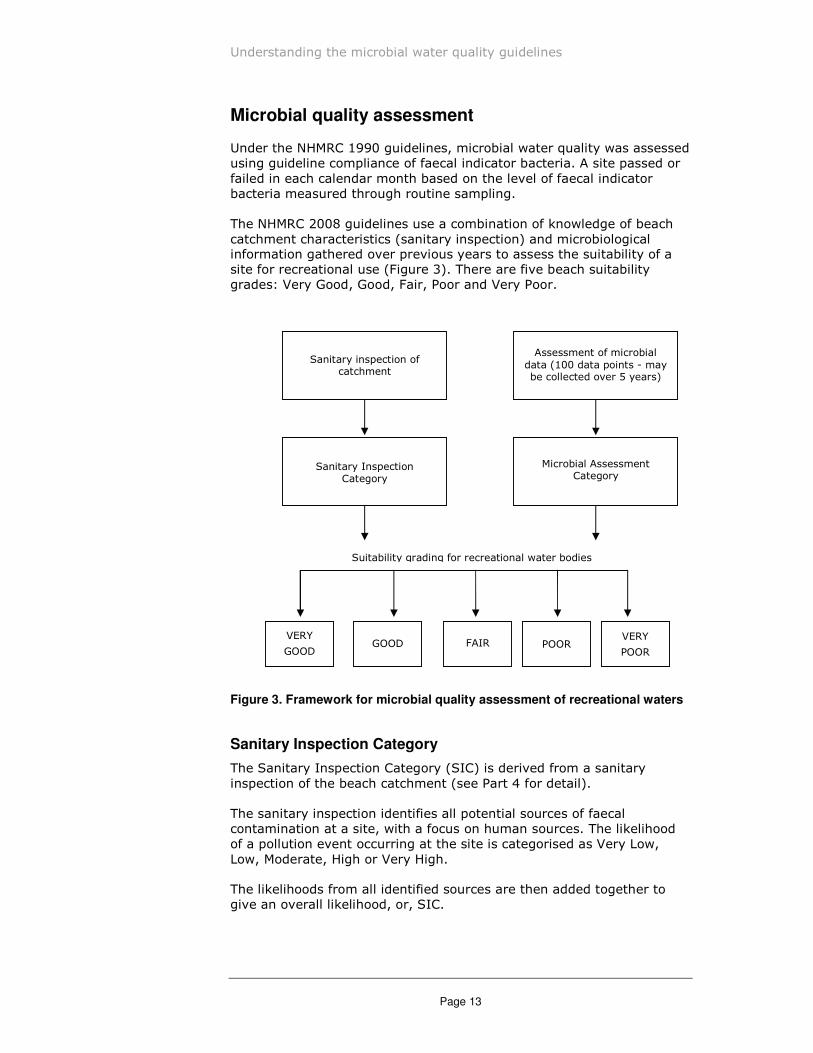
Microbial quality assessment
Under the NHMRC 1990 guidelines, microbial water quality was assessed using guideline compliance of faecal indicator bacteria. A site passed or failed in each calendar month based on the level of faecal indicator bacteria measured through routine sampling.
The NHMRC 2008 guidelines use a combination of knowledge of beach catchment characteristics (sanitary inspection) and microbiological information gathered over previous years to assess the suitability of a site for recreational use (Figure 3). There are five beach suitability grades: Very Good, Good, Fair, Poor and Very Poor.
Sanitary inspection of catchment
Sanitary Inspection Category
Assessment of microbial data (100 data points - may be collected over 5 years)
Microbial Assessment Category
Suitability grading for recreational water bodies
VERB
GOOD
VERB
POOR FAIR GOOD POOR
Figure 3. Framework for microbial quality assessment of recreational waters
Sanitary Inspection Category
The Sanitary Inspection Category (SIC) is derived from a sanitary inspection of the beach catchment (see Part 4 for detail).
The sanitary inspection identifies all potential sources of faecal contamination at a site, with a focus on human sources. The likelihood of a pollution event occurring at the site is categorised as Very Low, Low, Moderate, High or Very High.
The likelihoods from all identified sources are then added together to give an overall likelihood, or, SIC.
Page 13

Understanding the microbial water quality guidelines
Microbial Assessment Category
The Microbial Assessment Category (MAC) is determined from the 95th percentile of the last 100 enterococci data points collected at the swimming site (see Part 6 for details).
The category levels, A, B, C or D, relate to risk of illness determined from key epidemiological studies. The MAC provides an indication of the microbial quality at the site based on long term water quality monitoring.
Beach Suitability Grades
The beach suitability grade, or classification, is determined by combining a Sanitary Inspection Category and a Microbial Assessment Category according to the matrix in Table 6.
Table 6. Beach classification matrix
BEACH CLASSIFICATION MATRIX
Microbial assessment category (MAC)
A
(= 40)
B
(41 - 200)
C
(201 - 500)
D
(> 500)
Sanitary inspection category
(SIC)
Very low Very good Very good Follow up Follow up
Low Very good Good Follow up Follow up
Moderate Good Good Poor Poor
High Good Fair Poor Very poor
Very high Follow up Fair Poor Very poor
The five suitability grades are defined below.
Very Good Site has generally excellent microbial water quality and very few potential sources of faecal pollution. Water is considered suitable for swimming for almost all of the time.
Good Location has generally good microbial water quality and water is considered suitable for swimming for most of the time. Swimming should be avoided during and up to one day following heavy rain at ocean beaches and for up to three days at estuarine sites.
Fair Microbial water quality is generally suitable for swimming, but because of the presence of significant sources of faecal contamination, extra care should be taken to avoid swimming during and for up to three days following rainfall or if there are signs of pollution such as discoloured water, odour or debris in the water.
Poor Location is susceptible to faecal pollution and microbial water quality is not always suitable for swimming. During dry weather conditions ensure that the
Page 14

Understanding the microbial water quality guidelines
swimming location is free of signs of pollution, such as discoloured water, odour or debris in the water, and avoid swimming at all times during and for up to three days following rainfall.
Very Poor Location is very susceptible to faecal pollution and microbial water quality may often be unsuitable for swimming. It is generally recommended to avoid swimming at these sites.
The beach suitability grades support informed personal choice and provide guidance to the community on the relative safety of the water. Classifications can be compared to determine which sites are the most suitable for recreation.
The beach suitability grades also provide a basis for regulatory requirements and an assessment of compliance with such requirements. Improvements as a result of regulatory actions can be measured as a change in beach classification.
Page 15


Selecting sites for assessment
Part
2 Selecting sites for assessment
The resources needed for comprehensive microbial quality assessment may not always be available. This does not mean the assessment should be neglected altogether. Programs can be tailored to meet specific local needs and available resources. The key to achieving this is to identify and prioritise swimming locations on the basis of their use, importance to the local community, and the potential for pollution to affect the site.
This section describes a priority evaluation and classification system that can assist water resource managers determine their assessment needs. The approach is based on a qualitative risk assessment that uses readily available information on pollution sources and beach use. Swimming locations can then be graded according to priority (i.e. high, medium or low).
Prioritising beaches provides a basis for determining resource allocation. High priority swimming locations should attract more monitoring and reporting resources to ensure that the greatest benefit is obtained.
As the priority evaluation is qualitative and subjective, beach classifications may not be comparable between council areas. If councils or organisations wish to pool resources and collaborate on a monitoring and reporting program, they should go through the priority evaluation process together.
The information generated in this process provides a starting point for Part 3, assigning sanitary inspection categories to the beaches included assessment program.
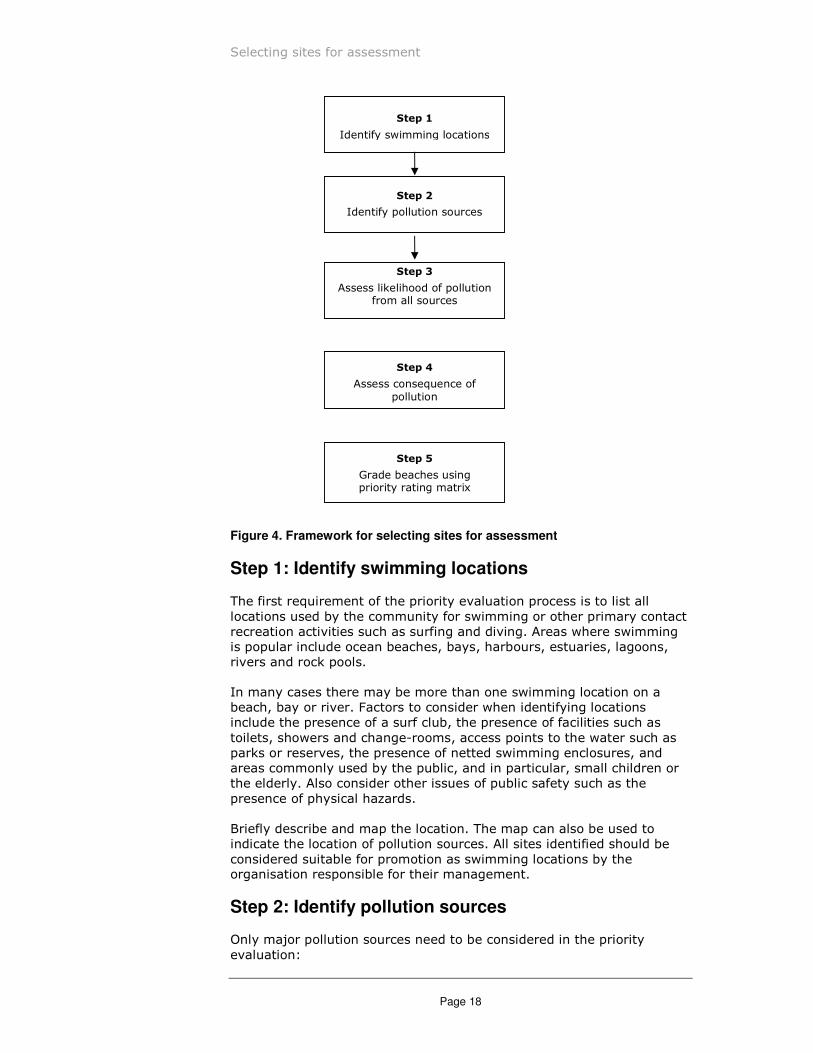
The steps to prioritise sites are shown in Figure 4 and described in detail below.
Page 17
Selecting sites for assessment
Step l
Identify swimming locations
Step 2
Identify pollution sources
Step 3
Assess likelihood of pollution from all sources
Step 4
Assess consequence of pollution
Step 5
Grade beaches using priority rating matrix
Figure 4. Framework for selecting sites for assessment
Step 1: Identify swimming locations
The first requirement of the priority evaluation process is to list all locations used by the community for swimming or other primary contact recreation activities such as surfing and diving. Areas where swimming is popular include ocean beaches, bays, harbours, estuaries, lagoons, rivers and rock pools.
In many cases there may be more than one swimming location on a beach, bay or river. Factors to consider when identifying locations include the presence of a surf club, the presence of facilities such as toilets, showers and change-rooms, access points to the water such as parks or reserves, the presence of netted swimming enclosures, and areas commonly used by the public, and in particular, small children or the elderly. Also consider other issues of public safety such as the presence of physical hazards.
Briefly describe and map the location. The map can also be used to indicate the location of pollution sources. All sites identified should be considered suitable for promotion as swimming locations by the organisation responsible for their management.
Step 2: Identify pollution sources
Only major pollution sources need to be considered in the priority evaluation:
Page 18
Selecting sites for assessment
• sewage treatment plants
• stormwater drains, creeks, rivers and lagoons (including overflows from sewerage system infrastructure)
Discharges from boats and domestic and wild animals need only be considered when in large numbers.
Where commercial oyster growing is undertaken in the vicinity of the swimming site, information on pollution sources can be sourced from the Sanitary Survey undertaken for the oyster harvest area.
Step 3: Assess likelihood of pollution from all sources
The likelihood of contamination is determined as Rare, Possible or Likely according to the following definitions (adapted from AS/NZS Standard for Risk Management (1999)):
Rare May occur only in exceptional circumstances.
Possible Might occur at some time; some opportunity, reason or means to occur.
Likely Expected to occur in most circumstances; considerable opportunity, reason and means to occur; regular reported incidents
Assessing likelihood is a qualitative procedure. It is generally based on knowledge of a local area rather than hard data. Where data exist, they should be used to verify any assumptions made.
The methodology for assessing the likelihood of contamination from each source is outlined below.
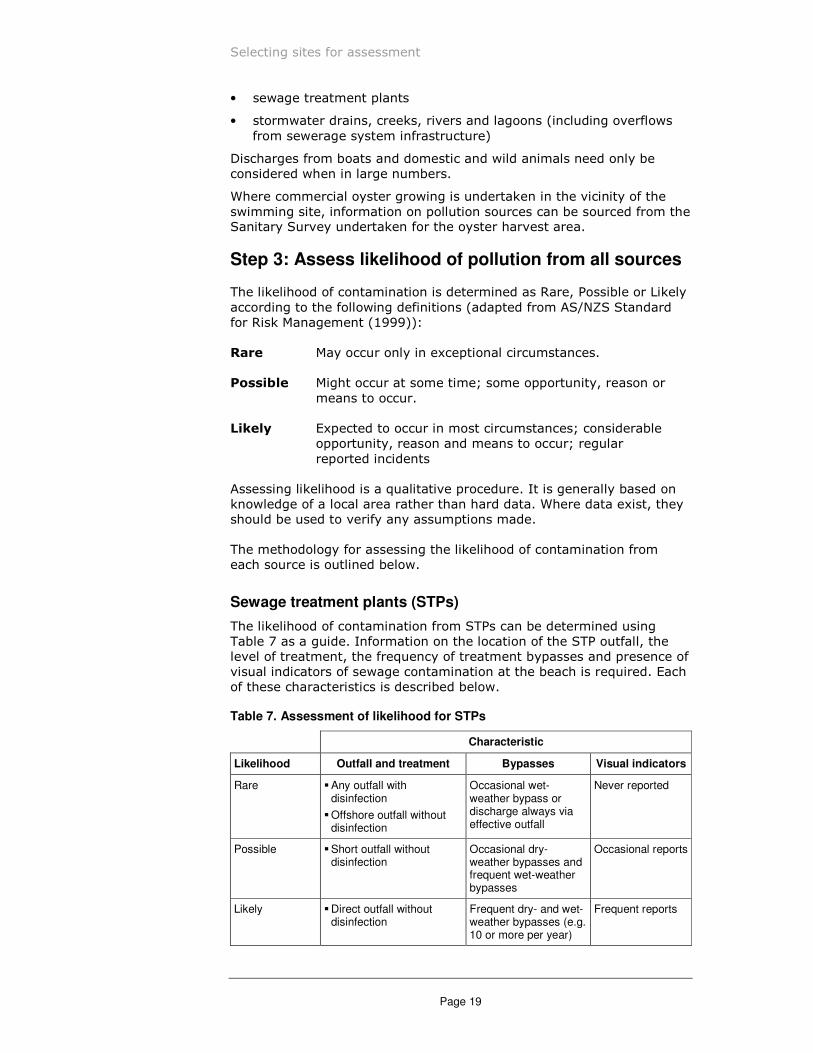
Sewage treatment plants (STPs)
The likelihood of contamination from STPs can be determined using Table 7 as a guide. Information on the location of the STP outfall, the level of treatment, the frequency of treatment bypasses and presence of visual indicators of sewage contamination at the beach is required. Each of these characteristics is described below.
Table 7. Assessment of likelihood for STPs
Characteristic
Likelihood Outfall and treatment Bypasses Visual indicators
Rare • Any outfall with disinfection
• Offshore outfall without disinfection
Occasional wet-weather bypass or discharge always via effective outfall
Never reported
Possible • Short outfall without disinfection
Occasional dry-weather bypasses and frequent wet-weather bypasses
Occasional reports
Likely • Direct outfall without disinfection
Frequent dry- and wet-weather bypasses (e.g. 10 or more per year)
Frequent reports
Page 19

Selecting sites for assessment
The combination of outfall type and level of treatment will have the greatest impact on the overall likelihood for this source. Where bypasses occur and there is visual evidence of sewage pollution at the beach, the likelihood should be increased to the appropriate category.
As an example, an STP that discharges disinfected effluent via a short outfall may initially be given a likelihood of 'rare'. Frequent wet-weather bypasses and occasional reports of visual indicators of sewage on the beach could increase the likelihood to 'possible'.
Location of the outfall
Locations of STP outfalls can be classified as direct, short or offshore.
Direct Outfalls which discharge to the shoreline or directly to a beach
Short Outfalls which discharge within the intertidal zone, with significant probability that the sewage plume will reach the beach.
Offshore Outfalls which are of sufficient length and depth to ensure that there is a low probability of the sewage plume reaching the beach.
Level of sewage treatment
Primary, secondary and tertiary treatment processes remove only a small proportion of pathogens in wastewater. Greater reductions in pathogen numbers can be obtained where a disinfection step is included in the treatment process.
History of sewage treatment bypasses
The frequency of STP bypasses and the cause of the bypasses should be noted. The likelihood of contamination may need to be increased where bypasses occur frequently, especially when discharged close to shore (bypassing effective outfalls).
Visible signs of sewage pollution at beach
As part of the evaluation, consider any history of visible signs of sewage pollution on the beach. Visible signs of sewage pollution include grease particles or balls, cotton buds, and sewage-derived litter and plastics. Where these have been frequently recorded by council lifeguards or reported by the community, the likelihood of contamination should be increased accordingly.
Discharges from stormwater drains, creeks, rivers and lagoons
Discharges from stormwater drains, creeks, rivers and lagoons may be a significant source of faecal contamination during, and for several days following, wet weather. These discharges may also contain faecal contamination from sewage overflows and overflows from sewage pumping stations.
Note the locations of all discharge points near the swimming area. The likelihood of contamination from these sources can be determined using Table 8 as a guide. Information on catchment development, volume of
Page 20

Selecting sites for assessment
discharge, existing water quality and the presence of visual indicators is required. Each of these characteristics is described below.
Table 8. Assessment of likelihood for discharges into receiving waters
Characteristic
Likelihood Development and discharge volume
Visual indicators
Rare • Bushland, any volume Minor or only after large or extended wet-weather events
Possible • Rural, low volume
• Urban, low volume
• Sewage pumping stations present, but rarely overflow
Significant after moderate rainfall
Likely • Rural, medium or high volume
• Urban, medium or high volume
• Sewage overflows occur
Significant and apparent after most wet-weather events
Development within catchment
Note the extent and type of development within the catchment. Discharges from urban catchments may contain faecal contamination from leaks in the sewerage system, illegal sewer connections to stormwater, sewage overflows, leaking septic tanks and domestic animals. Unless there is evidence to the contrary from comprehensive water quality records, discharges from most urban catchments should be given a rating of 'likely'.
Discharges from rural catchments may contain faecal contamination if the catchments are used for grazing or intensive animal production. Although most human viruses are unlikely to be found in rural runoff, pathogenic protozoans such as Cryptosporidium and Giardia may be found in large numbers. Abattoirs are likely to be major sources of faecal contamination and should be considered if present. Discharges from bushland catchments are unlikely to contain significant numbers of indicator organisms or pathogens.
Volume of discharge
Estimate the discharge volumes in wet and dry weather in quantitative terms. The size and number of discharge points will need to be considered as part of this process, along with the frequency of discharge. Low-volume discharge may be defined as one or two small creeks or small drains that discharge in wet weather only. Medium-
volume discharge may be defined as two or more creeks or drains of varying sizes, some of which discharge in dry weather. Large-volume discharges would include the presence of a large stormwater drain, large creek, river or lagoon that discharges in dry and wet weather.
Existing water quality data
Where stormwater, creek, river or lagoon discharges have been analysed for bacterial indicators, this information can be used in the assessment. Consider the conditions when samples were collected, including wet or dry weather flows, the quality of the data and the level of variability within the data.
Page 21
Selecting sites for assessment
Visible signs of stormwater pollution
Visible signs of stormwater pollution include discoloured water and leaves, and twigs and street litter in the water and at the high tide mark. These visual indicators can provide valuable information on the frequency, extent and duration of stormwater impacts. Where possible, relate the extent of the impact to the level of rainfall received (e.g. minor impact after 5 mm of rainfall, extensive impact after 20 mm of rainfall).
Other sources
Other sources of faecal contamination that may need to be included in the assessment of likelihood are described below.
Boats
These should be considered when large numbers are present in the vicinity of the site for extended periods. Where there is no requirement for vessels to be fitted with effluent-holding tanks, sewage may be released directly into the waterway. If boats are moored or anchored near a swimming location, these discharges may be a source of faecal contamination. Factors to consider when determining a risk rating for this source should include how close the boats are to the swimming location, the number of boats, the type of boats (e.g. houseboats will pose a greater risk than a recreational fishing boat) and for how long they are present.
Domestic and wild animals
These need only be considered when they are present at the site in large numbers. Where dogs are allowed on beaches or near other swimming locations, note the presence of their faeces on the beach. Similarly, note the type and approximate number of birds that frequent the area.
Overall likelihood
The overall likelihood of contamination is determined by considering the overall impact of all identified pollution sources. This can be done by weighting each source (as a percentage) on the basis of the estimated contribution of each source. All weighted likelihoods can then be considered together to determine an overall likelihood of pollution. Give particular importance to STP discharges and runoff from urban areas (whether via stormwater drains, creeks, rivers or lagoons).
Examples of likelihood assessments for two hypothetical beaches are provided in Figure 5 and 6. These examples demonstrate how the likelihood from various pollution sources can be weighted to determine an overall risk rating.
Step 4: Assess the consequence of pollution
The health risk posed by a swimming location will depend on its level of use. The consequences of pollution are likely to be greater at a very popular beach where more people are likely to come into contact with pathogens, or at tourist beaches where reports of poor water quality may affect the local economy.
Page 22
Selecting sites for assessment
The consequences may also be greater at beaches used by people with weaker immune systems, such as small children or the elderly.
Consequences are rated as minor, moderate or major in accordance with the qualitative definitions below. As with likelihood, consequence is qualitative. The goal of the exercise is to select the category that best suits the importance of the swimming location to the local community.
Minor Location rarely used on weekdays; Location occasionally used on weekends or holidays; Few beach users enter the water; Location not popular with children or the elderly; Of little importance to local economy
Moderate Location occasionally used on weekdays; location frequently used on weekends or holidays; most beach users enter the water; location often used by children or the elderly; location of some importance to the local economy.
Major Location frequently used on weekdays, weekends and holidays; most beach users enter the water; location very popular with children or the elderly; location of great importance to the local economy.
Step 5: Grade beaches using priority rating matrix
Each site should be graded as high, medium or low priority using the priority rating matrix in Table 9. This matrix uses the overall likelihood of pollution and consequence.
Table 9. Priority rating matrix for beach monitoring
Overall Likelihood
Consequence Rare Possible Likely
Minor Low priority Low priority Medium priority
Moderate Low priority Medium priority High priority
Major Medium priority High priority High priority
Source: Adapted from AS/NZS Standard for Risk Management (1999)
The priority rating provides a valuable insight into the assessment needs of a swimming site. A beach which has been classified as high priority is either of high importance to the community or there is likely to be faecal contamination present, or both. In any case, the high priority rating indicates that resources should be focused on the site.
The need for microbial assessment at beaches that have been classified as medium or low priority is less than for those classified as high priority. Where resources are available after the needs of high priority beaches have been met, the needs of medium and then low priority beaches can be addressed.
Page 23
Selecting sites for assessment
Swimming location: Big Basin Beach
Description: About 300 metres long, with a surf club and main swimming area located at centre of the beach. Located near the town centre with a small caravan park at the southern end.
Likelihood of contamination
Potential source Characteristic Likelihood
Sewage treatment plant discharges
15% contribution
Present
Tertiary treatment with disinfection
Effective outfall
Average 1 bypass per 5 years in dry weather
Average 2 bypasses per year in wet weather
No visible sewage pollution recorded
Rare (possible in wet weather)
Stormwater drains
30% contribution
5 drains discharge directly to beach (see map)
Discharge during wet weather only
No monitoring data
Urban catchment
Unknown frequency of sewage overflows
Visible stormwater pollution for at least 24 hours after rain
Likely in wet weather
Lagoon discharges
50% contribution
At northern end of beach (see map)
Discharge during wet weather only
Monitoring data indicate poor quality lagoon water
Discharges result in water discolouration
Likely in wet weather
Overall likelihood of contamination (select highest) LIKELY
Consequence of contamination
Item Characteristic Consequence
Season October to April
Use (lifeguard estimates)
500–1000 people per day (weekend)
100–1000 people per weekday (holiday period)
20–50 people per weekday (non-holiday period)
MODERATE
Importance to economy
Medium MODERATE
Overall consequence (select highest) MODERATE
Risk rating: HIGH
Figure 5: Example priority evaluation sheet 1
Page 24
Selecting sites for assessment
Swimming location: Little Basin Beach
Description: Small, sheltered embayment about 100 metres long. Access by boat (mainly) or through private property (rare).
Likelihood of contamination
Potential source Characteristic Likelihood
Sewage treatment plant discharges
50% contribution
Present
Tertiary treatment (no disinfection)
Short outfall
Average 2 bypass per year in dry weather
Average 5 bypasses per year in wet weather
Visible sewage pollution occasionally recorded
Possible (likely in wet weather)
Creek discharges
40% contribution
Southern end of beach
Flows constantly
No monitoring data
Bush catchment, no development
No sewage overflows
No visible stormwater impacts after rain events
Rare
Boats
10% contribution
Approx. 50 boats just offshore
Weekends only
Possible
Overall likelihood of contamination (select highest) POSSIBLE
Consequence of contamination
Item Characteristic Consequence
Season October to April
Use (lifeguard estimates)
~50 people per day (weekend)
~50 people per weekday (holiday period)
< 5 people per weekday (non-holiday period)
MINOR
Importance to economy
Low MINOR
Overall consequence (select highest) MINOR
Risk rating: LOW
Figure 6: Example priority evaluation sheet 2
Page 25

Sanitary inspection
Part
3 Sanitary inspection
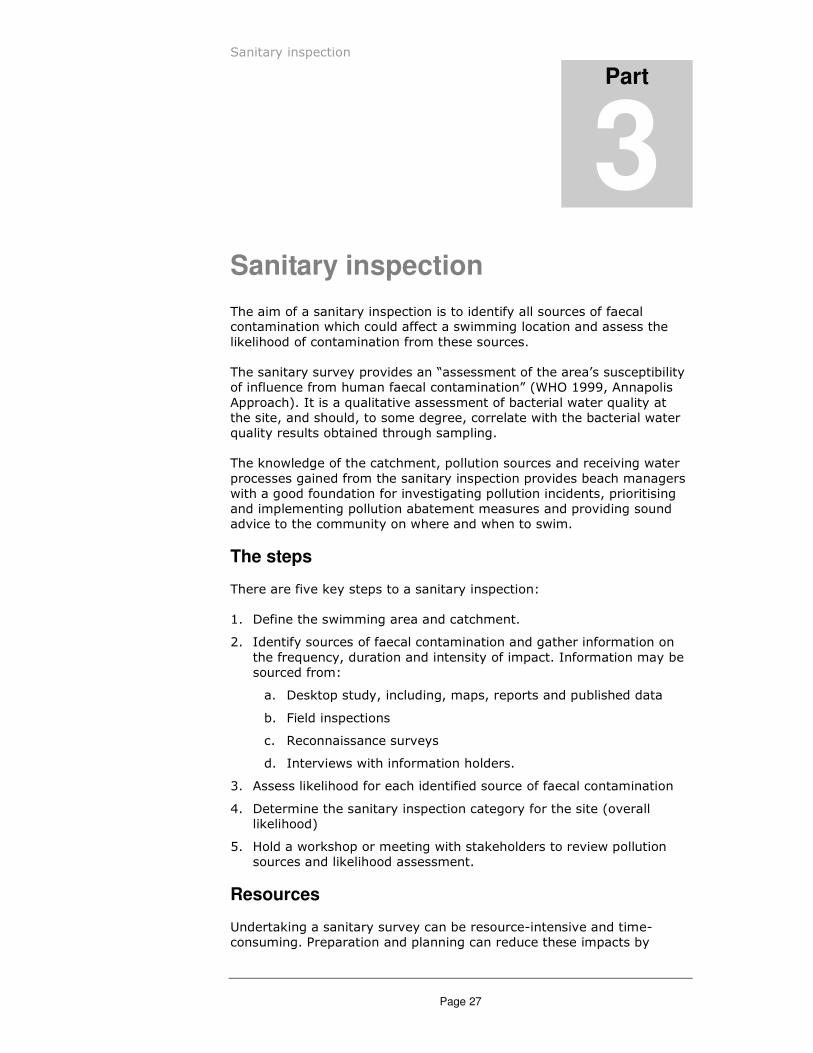
The aim of a sanitary inspection is to identify all sources of faecal contamination which could affect a swimming location and assess the likelihood of contamination from these sources.
The sanitary survey provides an "assessment of the area's susceptibility of influence from human faecal contamination" (WHO 1999, Annapolis Approach). It is a qualitative assessment of bacterial water quality at the site, and should, to some degree, correlate with the bacterial water quality results obtained through sampling.
The knowledge of the catchment, pollution sources and receiving water processes gained from the sanitary inspection provides beach managers with a good foundation for investigating pollution incidents, prioritising and implementing pollution abatement measures and providing sound advice to the community on where and when to swim.
The steps
There are five key steps to a sanitary inspection:
1. Define the swimming area and catchment.
2. Identify sources of faecal contamination and gather information on the frequency, duration and intensity of impact. Information may be sourced from:
a. Desktop study, including, maps, reports and published data
b. Field inspections
c. Reconnaissance surveys
d. Interviews with information holders.
3. Assess likelihood for each identified source of faecal contamination
4. Determine the sanitary inspection category for the site (overall likelihood)
5. Hold a workshop or meeting with stakeholders to review pollution sources and likelihood assessment.
Resources
Undertaking a sanitary survey can be resource-intensive and time-
consuming. Preparation and planning can reduce these impacts by
Page 27

Sanitary inspection
keeping the survey focussed, ensuring that only accurate and relevant information is collected and minimising the need for repeat inspections or interviews.
A sanitary inspection paperbase (a paper based template) has been developed to assist with and standardise the risk classification process. The template is based on those developed by Bree Abbott of Western Australia Department of Health, with some modifications to the risk assessment framework and to reflect conditions in New South Wales.
The paperbase provides a framework for the sanitary inspection and includes sections for:
• site information - type, description, location , map and responsible authority;
• site use - activities, number and types of users, lifeguard services and facilities;
• inventory of pollution sources and risk assessment of each;
• management actions;
• total risk calculation.
A copy of the sanitary inspection paperbase is located in Appendix A, along with worked examples of two Sydney swimming sites (Queenscliff Beach and Clontarf Pool).
A Sanitary Inspection database has been developed to collate and electronically store initial sanitary inspection reports and annual reviews for all swimming sites monitored as part of the Beachwatch, Harbourwatch and Partnership Programs in New South Wales. The database is a Microsoft Access database.
Step 1: Define the swimming area and catchment
Defining the extent of the swimming area and the catchment provides a focus for data collection (WSAA 2003). A swimming area defined as the area between the flags might only have a subset of the pollution sources which affect the entire beach.
The following information should be collated:
• name of site
• unique site reference number
• site type: ocean, estuarine, freshwater, other
• dimensions of swimming site: length and width
• catchment area and catchment landuse
• responsible authority including contact person and contact details
• site address
• GPS coordinates and projection
• site description
• level of tidal flushing
Page 28
Sanitary inspection
• rainfall impacts
• activities at location: swimming, surfing, water/jet skiing, canoeing/kayaking, fishing, sailing, boating, other
• groups using location: children, elderly, families, tourists
• number of users on weekends, non-holiday weekdays and holiday periods
• off-street car parking
• lifeguard services
• conditions that deter use of the site
• history of illness at site
This information required can be sourced from maps, historical water quality data, lifeguards, user groups, community representatives, government agencies and reports.
Step 2: Identify pollution sources and gather information
Identify pollution sources
While a sanitary inspection should investigate all sources of faecal pollution affecting a swimming site, emphasis should be given to human sources as these pose the greatest risk to human health (NHMRC 2008, WSAA 2003).
Animal sources of faecal contamination, such as runoff from animal pastures or the presence of aquatic birds, may result in elevated levels of faecal bacteria at a swimming site, but because of the 'species barrier', many of the associated pathogens do not affect human health. However, animal sources should not be ignored as some human pathogens, such as Cryptosporidium parvum, Campylobacter spp. and E. coli are found in animal faeces (WHO 2003).
The main sources of faecal pollution affecting recreational waters are described in Step 3. While this list is extensive, where other, unlisted sources are present at a swimming site these must also be included in the sanitary inspection.
Gather information
A template has been developed to standardise the information gathering process (see Appendix A). The template provides a framework for the sanitary inspection and defines the information required for the assessment of each pollution source.
Sourcing the information to complete the templates can be a considerable challenge. While some information will be readily available, other information will need to be researched. Identifying information sources and holders can be one of the most difficult aspects of the sanitary inspection. Where information does not exist, it will need to be generated.
Page 29
Sanitary inspection
Desktop study, field inspections, reconnaissance surveys and interviews are the four main sources of information for the sanitary inspection and these are outlined below.
Desktop study
Maps of the catchment area can be very useful starting point for the sanitary inspection. Maps can show landuse, catchment size, presence of creeks, rivers and lagoons, and the location of infrastructure such as sewage/wastewater treatment plants and boating facilities.
Water quality reports can provide information on the impact of rainfall, the frequency and extent of faecal pollution events, bacterial density or load from sources such as stormwater discharges or sewage overflows and the extent of tidal flushing.
Reports on the performance of sewage/wastewater infrastructure may contain information on discharge volumes, treatment levels, the frequency of bypasses, sewage overflows and chokes, and effluent quality.
Field inspections
Field inspections are an important component of sanitary inspections. They are required to:
• verify or ground-truth information obtained through desk-top study
• collect a range of unpublished or unavailable information such as number of toilets and showers, GPS coordinates of the site, location and size of stormwater drains, presence of aquatic or native animals, location and number of boats, size of car parks etc.
Field inspections can be time-consuming and require careful planning to ensure that data is obtained in a systematic way.
Reconnaissance surveys
Sampling programs designed to assess the impact of sources of faecal pollution may be required in some instances. These reconnaissance surveys involve collection of water samples upstream and downstream of source input locations, and where possible, sampling of the source itself. In some cases, the source of faecal contamination may be unknown and chemical biomarkers and microbial source tracking parameters can be employed to assist source identification (NHMRC 2008).
Interviews
Information for the sanitary inspection can also be sourced from individuals or organisations with responsibilities or interest in the swimming location. For example:
• lifeguards may hold information on site use including number of visitors and user groups, pollution sources which affect the site and general conditions at the site
Page 30
Sanitary inspection
• sewage/wastewater system operators or regulators may have information on the sewer system and treatment system, including location and frequency of overflows
• council planners may hold information on the stormwater drainage system, landuse, presence of on-site sewage treatment systems, animal exercise areas, location of wastewater re-use areas and a record of complaints or illnesses
• Local residents or user groups may also be important sources of information.
As with field inspections, gathering information through interviews can be time-consuming and must be carefully planned. A list of interview questions should be drawn up in advance and reviewed to ensure completeness.
Step 3: Assess likelihood for identified pollution sources
For each identified pollution source, the likelihood of a public health event occurring must be determined. A public health event can be conservatively defined as an occasion when a pollution source could cause enterococci levels in excess of 200 cfu/100mL at a swimming site.
The likelihood categories are defined as follows:
Very Low Event occurs only in exceptional circumstances; about once every ten bathing seasons
Low Event occurs infrequently; once every five bathing seasons
Moderate Event occurs occasionally; once or twice each bathing season
High Event occurs with some regularity; three or four times each bathing season
Very High Event occurs frequently; several times each month
An overview of the major sources of faecal contamination and some guidance on assessing likelihood is provided on the following pages and in Appendix A.
The likelihood matrices are not intended to be prescriptive and should be used as a guide only.
Bather shedding
A number of studies have found that bathers themselves can be a source of faecal contamination in recreational waters (NHMRC 2008). The effect is greatest at sites where:
• dilution and tidal flushing are low, for example in shallow coastal lakes
• bather density is high (>0.2 people per square metre)
Page 31

Sanitary inspection
• small children swim or wade at the site, and
• there are no toilet facilities.
Likelihood estimation
The likelihood of contamination from bathers can be estimated from the matrix in Table 10.
Table 10. Likelihood matrix for bather shedding
TOILETS = YES TOILETS = NO
Flushing
Low Bather Density
High Bather Density
Low Bather Density
High Bather Density
Low Low Moderate Low Moderate
Medium Very Low Low Low Moderate
High Very Low Low Low Moderate
Bather density can be calculated as:
Bather density = Typical number of bathers Area of swimming site in square metres
Bather density is LOW if less than 0.2 people per square metre.
Bather density is HIGH if greater than 0.2 people per square metre.
A more accurate estimation of the likelihood of bather shedding may be obtained from existing water quality data. For example, if bacterial levels measured at a site during periods of high use are consistently low, this would indicate that bather shedding is not impacting water quality.
Alternatively, if elevated bacterial levels (>200 cfu/100mL) are measured during periods of high use when other pollution sources are unlikely to be impacting water quality, then the likelihood of bather shedding may be High or Very High. This effect should be confirmed by comparing bacterial levels from a control site (outside of the bathing area) with results from within the bathing area.
Toilet facilities
Leaks from toilet facilities are most likely to be a source of microbial contamination when:
• they are located in very close proximity to the swimming area (<50 metres)
• they are not connected to the sewer, but rely on on-site treatment
• there has been a history of discharges, leaks or odours
• they are very old and require upgrading
• there are a large number of toilets and showers (high flow)
• they are located at a very popular beach (high use).
Page 32
Sanitary inspection
Likelihood estimation
The likelihood of contamination from toilet facilities can be estimated from the matrix in Table 11.
Table 11. Likelihood matrix for toilet facilities
DISTANT PROXIMITY CLOSE PROXIMITY
Facility condition
Low Use/Flow
High Use/Flow
Low Use/Flow
High Use/Flow
Poor Low Moderate Moderate High
Good Very Low Low Low Moderate
Close proximity is generally within 50 metres of the swimming site, but also consider the drainage line. Facilities located further away, but in direct line with the swimming site might also be classified as close.
Distant proximity is greater than 50 metres away from the swimming site.
Use/Flow may vary between weather conditions in accordance with beach use figures.
Facility condition should be described as good where there is no history of leaks, discharges or odours, the facilities are new or have been upgraded.
Facility condition should be described as poor if they have been identified as requiring upgrade or if there has been a history of leaks, discharges or odours.
There may be instances where it is appropriate to classify the likelihood of contamination from toilet facilities as Very High.
Sewage/Wastewater treatment plant discharges
Discharges from sewage/wastewater treatment plants will have the greatest impact when:
• the outfall is located close to the swimming area,
• the level of dilution and dispersion available in the receiving water is low
• the level of treatment at the plant is low
• the volume of effluent discharged is high.
In cases where the effluent is not treated to a high level (secondary or lower), the level of dilution in receiving waters is particularly important when assessing potential impact. The volume of effluent discharged, tidal movement, currents and depth of the receiving water should all be considered.
Likelihood estimation
The likelihood of contamination from sewage/wastewater treatment plant discharges can be estimated from the matrix in Table 12.
Page 33
Sanitary inspection
Table 12. Likelihood matrix for sewage/wastewater treatment plant outfalls
OUTFALL TYPE
TREATMENT LEVEL Direct Short Long
None Very High High Low
Preliminary Very High High Low
Primary Very High High Low
Secondary High High Low
Secondary + disinfection
Moderate Moderate Very Low
Tertiary Moderate Moderate Very Low
Tertiary + disinfection Low Low Very Low
Lagoons High High Low
Source: NHMRC 2008.
Treatment levels:
None no treatment - raw sewage discharged
Preliminary screen filtration to remove large solid material
Primary physical sedimentation
Secondary primary treatment with trickling filter/activated sludge
Secondary + secondary treatment with disinfection
disinfection
Tertiary secondary treatment with coagulation-sand filtration
Tertiary + tertiary treatment with disinfection
disinfection
Lagoons low-rate biological treatment
Outfall types:
Direct outfall discharges directly or adjacent to the swimming area
Short outfall discharges within the inter-tidal zone with a significant probability that the sewage plume will reach the recreational water body
Long outfall discharges several kilometres offshore at sufficient length and depth to ensure low probability of the sewage plume reaching the recreational water body
Water quality data from the swimming location or near the ocean outfall may be used to modify the estimated likelihood.
Bypasses from sewage/wastewater treatment plants
On occasion, sewage entering a sewage/wastewater treatment plant may not receive full treatment before discharge due to human error, mechanical malfunction or electrical malfunction. As a result, partially
Page 34

Sanitary inspection
treated effluent will be discharged to the receiving water. Sewage treatment bypasses will have the greatest impact on recreational waters where the treatment plant:
• bypasses frequently because it is operating close to operational-
capacity, has no storage capacity and/or is subject to large peaks in flow during wet-weather,
• uses older technology without backup or warning systems
• is unable to disinfect bypassed effluent.
Again, the level of dilution in receiving waters is particularly important when assessing potential impact. The volume of effluent discharged, tidal movement, currents and depth of the receiving water should all be considered.
Likelihood estimation
The likelihood of contamination from sewage/wastewater treatment plant bypasses can be estimated from Table 13 for disinfected effluent or Table 14 for non-disinfected effluent.
Table 13. Likelihood matrix for bypasses of disinfected effluent
Bypass frequency (total events per 10 years)
Dilution 1 2 10 30 120
High Very Low Very Low Low Low Moderate
Low Very Low Low Moderate Moderate High
Table 14. Likelihood matrix for bypasses of non-disinfected effluent
Bypass frequency (total events per 10 years)
Dilution 1 2 10 30 120
High Very Low Very Low Low Moderate High
Low Very Low Low Moderate High Very High
Dilution is high for long outfalls and this classification may also be appropriate for short outfalls where bypass volume is low and flushing is high.
Dilution is low for short and direct outfalls.
Sewage overflows
Discharges from the sewerage system can occur through designated overflow points and sewage pumping stations. Sewage overflows from these structures can flow directly into recreational waters or enter the stormwater system and then flow to recreational waters.
Sewage overflows generally occur more frequently during wet weather when the flow in the sewer has increased due to rainfall infiltration.
Sewage overflows will have the greatest impact on recreational waters when:
• they are located in close proximity to the swimming location
Page 35

.
Sanitary inspection
• the sewer is old or poorly maintained, with cracks allowing rainwater to enter the pipes and increase flow beyond the design capacity
• the sewer is operating at close to capacity due to increases in serviced population
• the sewer serves a large population.
Likelihood estimation
The likelihood of contamination from sewage overflows can be estimated from Table 15.
Table 15. Likelihood matrix for sewage overflows
Overflow frequency
Dilution May occur only in
exceptional circumstance s e.g. 1 in 10
years
Unlikely to occur but
could occur at least once
within a 5 year period
Might occur at least once or twice per
bathing season
Will probably occur at least
3 – 4 times per bathing
season
Will occur on a regular basis e.g.
once a week
High Very Low Very Low Low Moderate High
Low Very Low Low Moderate High Very High
High dilution occurs when the sewage overflow enters the waterway distant from the swimming location and the water body is well-flushed or well-mixed.
Low dilution occurs when then sewage overflow enters the waterway close to the swimming location and the water body is poorly flushed or mixed.
Sewer chokes and leaks
Discharges from the sewerage system can occur during dry weather conditions as a result of blockages in the sewer from tree roots or construction debris. These discharges are called chokes. Sewers may also leak sewage through cracks in the pipes or areas where the pipe has been damaged.
Sewer chokes and leaks will have the greatest impact on recreational waters when:
• they are located in close proximity to the swimming location
• the sewer is operating at close to capacity due to increases in serviced population
Likelihood estimation
The likelihood of contamination from sewer chokes can be estimated from Table 16.
Page 36
.
Sanitary inspection
Table 16. Likelihood matrix for sewer chokes
Choke frequency
Dilution May occur only in
exceptional circumstance s e.g. 1 in 10
years
Unlikely to occur but
could occur at least once
within a 5 year period
Might occur at least once or twice per
bathing season
Will probably occur at least
3 – 4 times per bathing
season
Will occur on a regular basis e.g.
once a week
High Very Low Very Low Low Moderate High
Low Very Low Low Moderate High Very High
High dilution occurs when the sewage enters the waterway distant from the swimming location and the water body is well-flushed or well-mixed.
Low dilution occurs when then sewage enters the waterway close to the swimming location and the water body is poorly flushed or mixed.
On-site sewage treatment systems
On-site systems, such as septic tanks, will have the greatest impact on recreational waters when:
• they are incorrectly designed or located,
• they are not maintained and/or there are reports of leaks or odours
• there are a large number of systems in the catchment
• the systems are located in close proximity to the swimming area, particularly if soils are sandy and porous.
Likelihood estimation
The likelihood of contamination from on-site sewage treatment systems can be estimated from Table 17.
Table 17. Likelihood matrix for on-site sewage treatment systems
DISTANT PROXIMITY CLOSE PROXIMITY
Condition
<50 systems >50 systems <50 systems >50 systems
Good – no complaints
Very Low Very Low Low Low
Poor – history of odours and discharges
Low Moderate Moderate High
Close proximity is generally within 100 metres of the swimming site. Distant proximity is greater than 100 metres from the swimming site.
Note that the number of systems relates to household systems, commonly used by 3-4 people. Where a system services a large number of people, such as at a caravan park or public facilities, this should not be considered as a single system, but graded up accordingly.
Page 37

Sanitary inspection
Wastewater re-use
Wastewater re-use, such as irrigation of treated sewage effluent on grazing land or parks or outside use in residential areas where a dual reticulation system is provided, can be a source of faecal contamination in recreational waters, particularly when:
• wastewater is not treated to a high level before re-use
• the re-use area is located in close proximity to the swimming site and soils are porous or sandy
• a large volume of effluent is re-used.
Likelihood estimation
The likelihood of contamination from wastewater re-use can be estimated from Table 18.
Table 18. Likelihood matrix for wastewater re-use
DISTANT PROXIMITY CLOSE PROXIMITY
Treatment Level
Low Volume High Volume
Low Volume
High Volume
High – disinfected Very Low Very Low Low Low
Low – not disinfected Low Moderate Moderate High
Close proximity is generally within 100 metres of the swimming site. Distant proximity is greater than 100 metres from the swimming site.
A likelihood classification of Very High may be appropriate in certain instances.
Stormwater
Stormwater drains will have the greatest impact on recreational waters when:
• discharge volume from the drain is large because the catchment is large and/or the area receives high rainfall
• the catchment is densely populated
• the sewerage system is old and/or poorly maintained
• the drain discharges in close proximity to swimming area.
Likelihood estimation
The likelihood of contamination from stormwater drains can be estimated in two ways. It is recommended that the likelihood matrix in Table 19 be employed initially and if adequate water quality data is available, this finding be revised in line with the data analysis results.
Page 38
Sanitary inspection
Likelihood matrix
Table 19. Likelihood matrix for stormwater
Discharge Area
Landuse Dune Beach, offshore or direct >50m
Direct <50m
High density urban Low Moderate High
Low density urban Very Low Low Moderate
Rural – grazing Very Low Low Moderate
Rural – cropping Very Low Low Low
Bushland/reserve Very Low Low Low
Discharge types:
discharges into dune area behind beach and Dune discharge
infiltrates to groundwater
discharges onto beach and flows over sand with Beach Discharge
some filtration before entering water
Offshore pipe runs offshore to deep water
Discharge
Direct Discharge discharges directly to swimming area but more than �5� m 50 metres from the swimming site
Direct Discharge discharges directly to swimming area within 50 �5� m metres from the swimming site
A likelihood classification of Very High may be appropriate in certain instances.
�ater quality data analysis
The likelihood matrix (Table 19) is based on significant assumptions about the quality of stormwater from different catchment types. Where stormwater quality is significantly better or worse, the likelihood of contamination can be significantly over or under estimated.
To test the assumptions in the likelihood matrix, the impact of rainfall on measured water quality at the swimming site should be assessed. It is recommended that at least five years of data is used in the analysis to ensure that the less frequent, larger rainfall events are represented in the dataset.
The first step is to determine rainfall in the previous 24 hours for each water quality data point. The water quality data is then be classified in accordance with the following rainfall categories: 0 mm, 0.1-4.9 mm, 5-
9.9 mm, 10-19.9 mm and 20� mm. The 95th percentile for each rainfall category can then be determined (Table 20).
Page 39

Sanitary inspection
Table 20. Rainfall and enterococci measurements at an example site
Raw Data (cfu/100mL) 95th
%ile
Rainfall category 0 mm
Enterococci 0 2 2 2 2 2 2 0 0 2 2
Rainfall category 0.1–4.9 mm
Enterococci 0 4 2 20 8 2 12 0 10 2 16
Rainfall category 5–9.9 mm
Enterococci 16 12 8 40 24 14 60 2 97 12 80
Rainfall category 10–19.9 mm
Enterococci 220 89 420 152 120 75 180 140 10 125 330
Rainfall category 20+ mm
Enterococci 422 386 186 220 164 200 98 226 200 210 406
The calculated enterococci 95th percentile for each rainfall category is then compared with the threshold limit of 200 cfu/100mL (the upper limit of Microbial Assessment Category B). In the example in Table 20, the enterococci 95th percentile exceeds the threshold of 200 cfu/100mL when rainfall exceeds 10 mm in a 24-hour period.
Rainfall events have an average recurrence interval, with larger rainfall events occurring less frequently than smaller rainfall events. The likelihood of stormwater impacts can be determined by assuming:
• 0 mm category = Very High likelihood
• 0-4.99 mm category = High likelihood
• 5-9.9 mm category = Moderate likelihood
• 10-19.9 mm category = Low likelihood
• 20� mm category = Very Low likelihood.
While the recurrence intervals do not exactly mirror the likelihood frequencies in Table 19, the use of the 95th percentile enterococci data provides a conservative estimate of frequency.
Note that this assessment may be confounded if there are additional, significant sources of contamination during wet weather such as large sewage overflows. If this is the case, consider which source you will attribute the impact to and avoid doubling-up the likelihoods.
River discharges
Discharges from the rivers can be a significant source of faecal contamination to recreational waters, particularly when:
• the volume of river discharge is high because the river catchment is large and/or the region receives high rainfall
• there are many sources of faecal contamination in the catchment and the level of faecal contamination in the river water is high
• the river discharges in close proximity to the swimming site.
Page 40
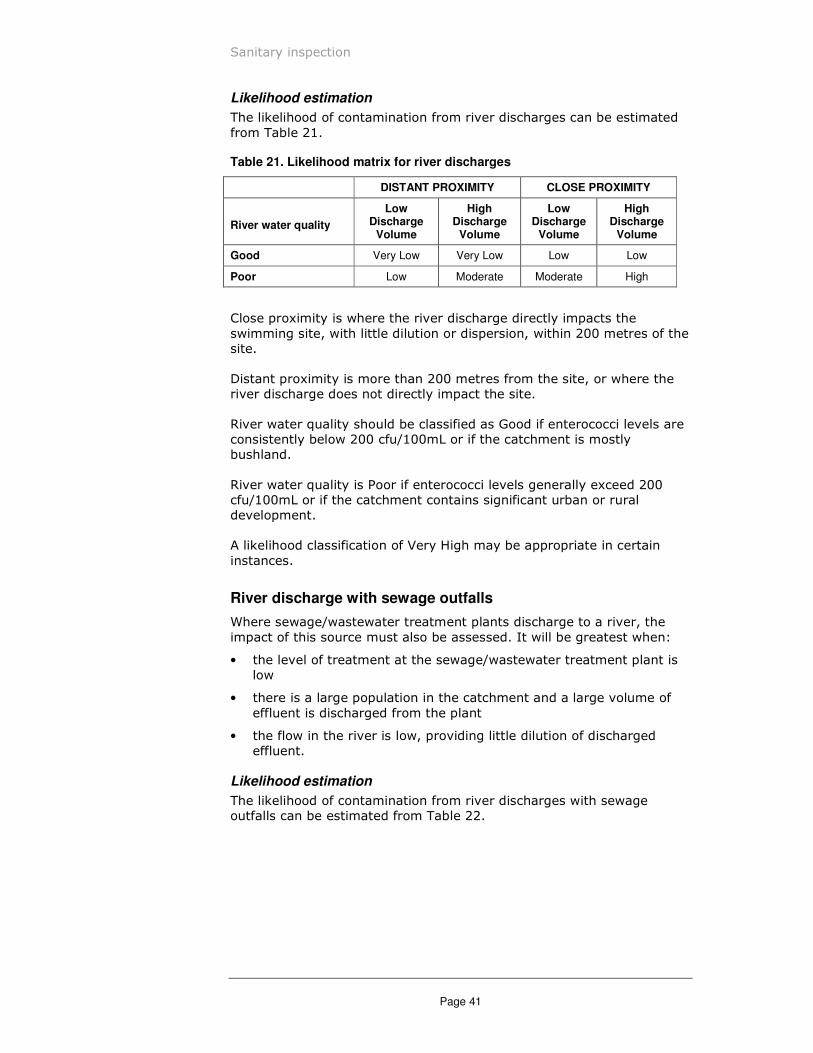
Sanitary inspection
Likelihood estimation
The likelihood of contamination from river discharges can be estimated from Table 21.
Table 21. Likelihood matrix for river discharges
DISTANT PROXIMITY CLOSE PROXIMITY
River water quality
Low Discharge
Volume
High Discharge
Volume
Low Discharge
Volume
High Discharge
Volume
Good Very Low Very Low Low Low
Poor Low Moderate Moderate High
Close proximity is where the river discharge directly impacts the swimming site, with little dilution or dispersion, within 200 metres of the site.
Distant proximity is more than 200 metres from the site, or where the river discharge does not directly impact the site.
River water quality should be classified as Good if enterococci levels are consistently below 200 cfu/100mL or if the catchment is mostly bushland.
River water quality is Poor if enterococci levels generally exceed 200 cfu/100mL or if the catchment contains significant urban or rural development.
A likelihood classification of Very High may be appropriate in certain instances.
River discharge with sewage outfalls
Where sewage/wastewater treatment plants discharge to a river, the impact of this source must also be assessed. It will be greatest when:
• the level of treatment at the sewage/wastewater treatment plant is low
• there is a large population in the catchment and a large volume of effluent is discharged from the plant
• the flow in the river is low, providing little dilution of discharged effluent.
Likelihood estimation
The likelihood of contamination from river discharges with sewage outfalls can be estimated from Table 22.
Page 41
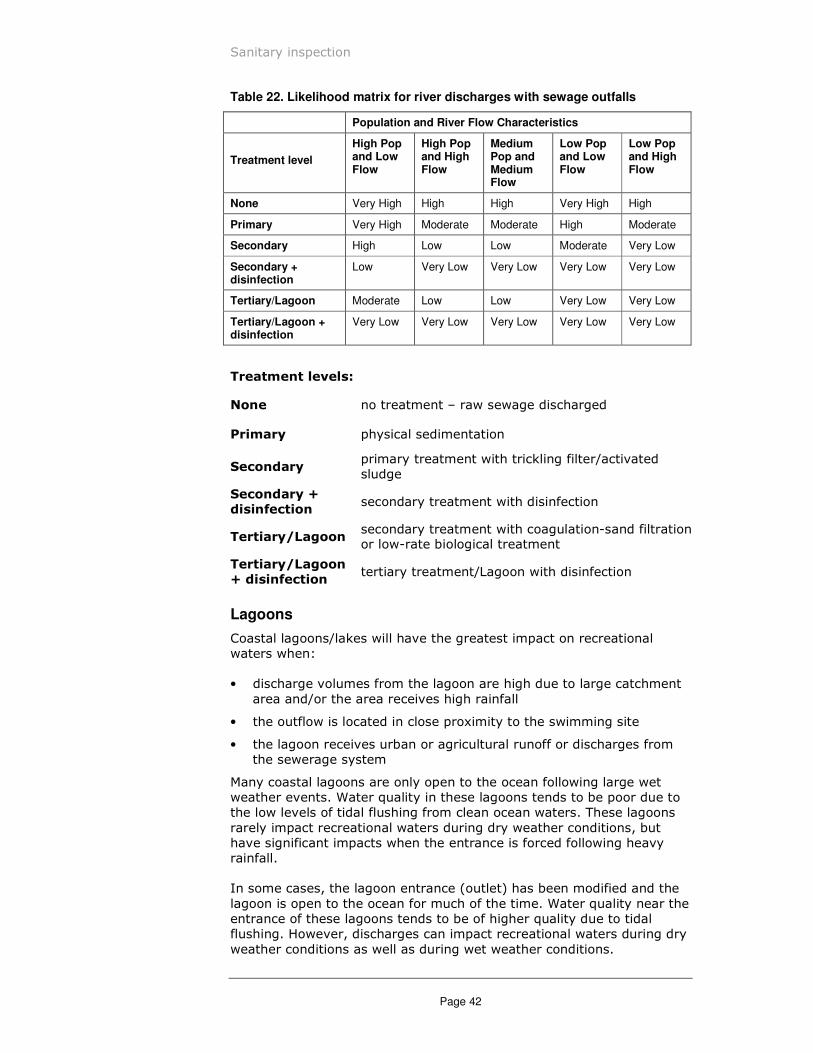
Sanitary inspection
Table 22. Likelihood matrix for river discharges with sewage outfalls
Population and River Flow Characteristics
Treatment level
High Pop and Low Flow
High Pop and High Flow
Medium Pop and Medium Flow
Low Pop and Low Flow
Low Pop and High Flow
None Very High High High Very High High
Primary Very High Moderate Moderate High Moderate
Secondary High Low Low Moderate Very Low
Secondary + disinfection
Low Very Low Very Low Very Low Very Low
Tertiary/Lagoon Moderate Low Low Very Low Very Low
Tertiary/Lagoon + disinfection
Very Low Very Low Very Low Very Low Very Low
Treatment levels:
None no treatment - raw sewage discharged
Primary physical sedimentation
primary treatment with trickling filter/activated Secondary
sludge
Secondary + secondary treatment with disinfection
disinfection
secondary treatment with coagulation-sand filtration Tertiary�Lagoon
or low-rate biological treatment
Tertiary�Lagoon tertiary treatment/Lagoon with disinfection
+ disinfection
Lagoons
Coastal lagoons/lakes will have the greatest impact on recreational waters when:
• discharge volumes from the lagoon are high due to large catchment area and/or the area receives high rainfall
• the outflow is located in close proximity to the swimming site
• the lagoon receives urban or agricultural runoff or discharges from the sewerage system
Many coastal lagoons are only open to the ocean following large wet weather events. Water quality in these lagoons tends to be poor due to the low levels of tidal flushing from clean ocean waters. These lagoons rarely impact recreational waters during dry weather conditions, but have significant impacts when the entrance is forced following heavy rainfall.
In some cases, the lagoon entrance (outlet) has been modified and the lagoon is open to the ocean for much of the time. Water quality near the entrance of these lagoons tends to be of higher quality due to tidal flushing. However, discharges can impact recreational waters during dry weather conditions as well as during wet weather conditions.
Page 42
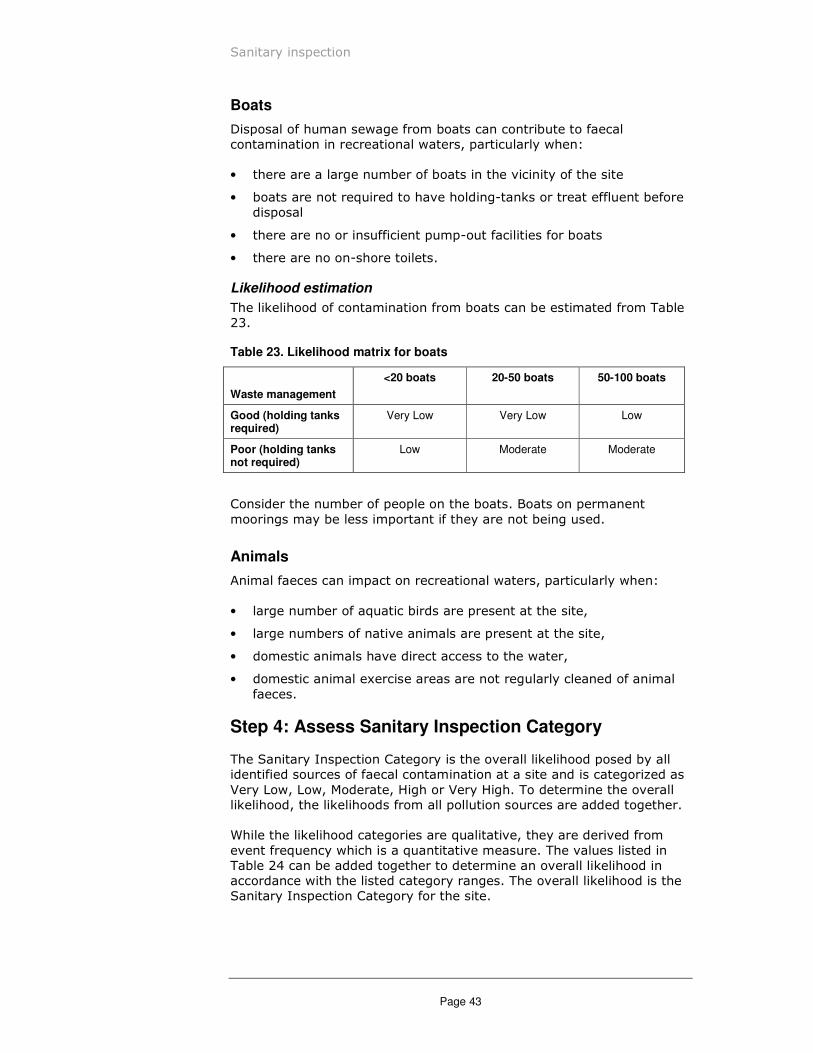
Sanitary inspection
Boats
Disposal of human sewage from boats can contribute to faecal contamination in recreational waters, particularly when:
• there are a large number of boats in the vicinity of the site
• boats are not required to have holding-tanks or treat effluent before disposal
• there are no or insufficient pump-out facilities for boats
• there are no on-shore toilets.
Likelihood estimation
The likelihood of contamination from boats can be estimated from Table 23.
Table 23. Likelihood matrix for boats
Waste management
<20 boats 20-50 boats 50-100 boats
Good (holding tanks required)
Very Low Very Low Low
Poor (holding tanks not required)
Low Moderate Moderate
Consider the number of people on the boats. Boats on permanent moorings may be less important if they are not being used.
Animals
Animal faeces can impact on recreational waters, particularly when:
• large number of aquatic birds are present at the site,
• large numbers of native animals are present at the site,
• domestic animals have direct access to the water,
• domestic animal exercise areas are not regularly cleaned of animal faeces.
Step 4: Assess Sanitary Inspection Category
The Sanitary Inspection Category is the overall likelihood posed by all identified sources of faecal contamination at a site and is categorized as Very Low, Low, Moderate, High or Very High. To determine the overall likelihood, the likelihoods from all pollution sources are added together.
While the likelihood categories are qualitative, they are derived from event frequency which is a quantitative measure. The values listed in Table 24 can be added together to determine an overall likelihood in accordance with the listed category ranges. The overall likelihood is the Sanitary Inspection Category for the site.
Page 43
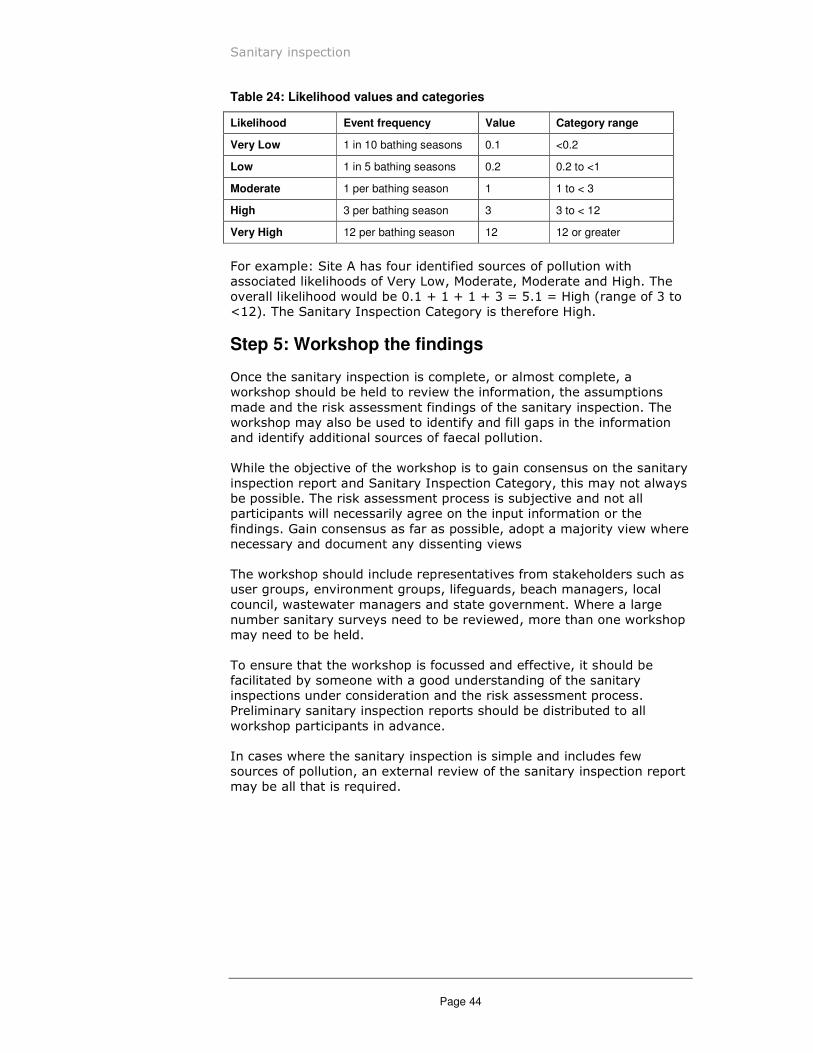
Sanitary inspection
Table 24: Likelihood values and categories
Likelihood Event frequency Value Category range
Very Low 1 in 10 bathing seasons 0.1 <0.2
Low 1 in 5 bathing seasons 0.2 0.2 to <1
Moderate 1 per bathing season 1 1 to < 3
High 3 per bathing season 3 3 to < 12
Very High 12 per bathing season 12 12 or greater
For example: Site A has four identified sources of pollution with associated likelihoods of Very Low, Moderate, Moderate and High. The overall likelihood would be 0.1 � 1 � 1 � 3 = 5.1 = High (range of 3 to <12). The Sanitary Inspection Category is therefore High.
Step 5: Workshop the findings
Once the sanitary inspection is complete, or almost complete, a workshop should be held to review the information, the assumptions made and the risk assessment findings of the sanitary inspection. The workshop may also be used to identify and fill gaps in the information and identify additional sources of faecal pollution.
While the objective of the workshop is to gain consensus on the sanitary inspection report and Sanitary Inspection Category, this may not always be possible. The risk assessment process is subjective and not all participants will necessarily agree on the input information or the findings. Gain consensus as far as possible, adopt a majority view where necessary and document any dissenting views
The workshop should include representatives from stakeholders such as user groups, environment groups, lifeguards, beach managers, local council, wastewater managers and state government. Where a large number sanitary surveys need to be reviewed, more than one workshop may need to be held.
To ensure that the workshop is focussed and effective, it should be facilitated by someone with a good understanding of the sanitary inspections under consideration and the risk assessment process. Preliminary sanitary inspection reports should be distributed to all workshop participants in advance.
In cases where the sanitary inspection is simple and includes few sources of pollution, an external review of the sanitary inspection report may be all that is required.
Page 44
Microbial water quality monitoring
Part
4 Microbial water quality monitoring
Microbial water quality monitoring collects information on levels of faecal contamination over time. This data is used to calculate the Microbial Assessment Category (MAC) which, in conjunction with the Sanitary Inspection Category, is used to determine the suitability of a swimming site for recreation.
This section outlines the strategy for monitoring recreational water quality and should be implemented until sufficient water quality data have been collected to adequately assess site performance. In most cases this may be for at least three swimming seasons or 100 samples.
Sampling design
Sampling location
Samples for microbial water quality assessment should be collected at locations where swimming occurs. At patrolled beaches, this is likely to be between the flags, so the actual sampling location may move from day to day according to surf conditions.
For unpatrolled beaches and other waterways, select the location where the majority of people swim. Access points to the water and the presence of facilities may provide a good indication of areas most commonly used. Identify areas which might be used by small children such as shallow, calm waters with minimal flushing or areas of ponded stormwater which could contain high levels of faecal contamination.
Samples should be collected at knee depth within the 'swash zone' (the area of low waves near the shore). This has two distinct advantages. First, this is the area used by small children. Secondly, sampling near the shore reduces the risk to field samplers, who may have to sample on days when the beach or swimming location is closed because of dangerous conditions.
Sampling frequency
Samples should be collected during the bathing season, or the period the water body is used for swimming. In the Sydney region, the season begins on 1 October and ends on 30 April.
The time of day when samples are collected should also be considered. Factors such as tides, winds, waves, pollution inputs and the number of
Page 45

Microbial water quality monitoring
swimmers present can all affect bacterial levels. There is also reported evidence that diurnal UV exposure affects bacterial levels. Where possible, the time of sampling should coincide with the time of highest risk. For example, if a pollution source operates only in the morning, then take samples in the morning; if afternoon winds are likely to drive pollution onshore, collect samples in the afternoon.
Where there is unlikely to be a daily pattern in bacterial levels, sampling times should be randomised. This can be achieved by commencing sampling at different times of the day or by varying the order in which locations are sampled.
Sampling on a six-day roster is recommended (although this is not mandatory) as this ensures that all days of the week are sampled. The popularity of sites on weekends, the additional cost of weekend sampling, and the availability of laboratories for weekend sample analysis are also important factors to be considered.
To collect the 100 data points needed to calculate the microbial assessment category, samples should initially be collected as frequently as possible over the range of conditions when the site is in use.
Once the 100 data points have been collected and sanitary inspections show no change over several years, the recommended monitoring schedule in Table 25 can be adopted.
Table 25: Recommended monitoring schedule
Sanitary inspection category
Monitoring schedule Frequency of review of sanitary inspection
Very Low or Low
Minimum of five samples per year during swimming season
Annual
Moderate or High
20 samples at regular intervals during the swimming season
Additional sampling if abnormal results are found
Annual
Very High Minimum of five samples per year, but nil if the site is closed to use
Annual
Indicator bacteria
Indicator organisms are used as fundamental monitoring tools for assessing the potential presence of pathogenic organisms. An indicator organism should:
• be easily detectable by using simple laboratory tests
• generally not be present in unpolluted waters
• appear in concentrations that can be correlated with the extent of the contamination
• survive under similar conditions as the pathogens of concern.
NHMRC (2008) advocates the use of enterococci as the single preferred faecal indicator in marine waters. These bacteria are excreted in faeces
Page 46
Microbial water quality monitoring
and are rarely present in unpolluted waters. Enterococci have shown a clear dose-response relationship to disease outcomes in marine waters in the northern hemisphere; however because of the lack of epidemiological information, it is not known if the same relationship exists under Australian conditions.
Direct detection of pathogens in recreational waters is generally not undertaken due to the difficulty of this analysis. Where reliable laboratory methods exist they generally require the collection of large volumes of water; analysis is costly, and it can take a week or more to obtain a result. In addition, decisions about how many and which specific pathogens to test for need to be made.
Documentation
Field manual
Comprehensive and accurate documentation of sampling protocols is an essential component of the monitoring program. A field manual should document the procedures used for collecting, labelling, transporting and storing samples; taking field measurements; taking field notes; and the types and numbers of quality control procedures used. The field manual should also contain detailed information on site location, access issues, Occupational Health and Safety (OH�S) considerations, contact numbers for the office, laboratory and any other relevant personnel, and copies of field sheets.
An example of a field manual is provided in Appendix B. It can be modified to meet the individual requirements of monitoring programs.
Chain of custody
It is important to be able to track all samples from collection through to the laboratory. Chain-of-custody documentation serves this purpose and is recommended. An example of a chain-of-custody form is included in the field manual in Appendix B.
Sampling procedure
Sampling containers
The sample bottles used to collect water samples for bacterial analyses must be sterile. Reusable bottles can be used and re-sterilised. These bottles must be able to withstand the high-temperature sterilising conditions. Wide-mouthed glass bottles with screw caps are frequently used, but they can break, causing loss of samples and injury to sampler. Heat-resistant polycarbonate bottles are a practical substitute, although care must be taken when sterilising these.
Sample bottles should have a capacity of at least 250 mL. Consult the laboratory doing the analyses to determine their exact requirements.
Sample collection, storage and transport
At each site, the location, time of sample collection, condition of the water body and weather conditions should be noted on the field sheet.
Page 47
Microbial water quality monitoring
An example of a field sheet is provided in the Field Manual in Appendix B.
The sample container should be labelled with a waterproof, non-
smearing label indicating the location and date of sample collection.
Samples for bacterial analysis must be collected using aseptic sampling technique:
• remove the lid from the bottle immediately before taking the sample, no sooner
• avoid contact with the inside of the bottle, the neck of the bottle and inside of the lid
• fill bottle by plunging it into water, mouth downward, to a depth of 30 cm below surface. If there is a current, position mouth of bottle into the current. If the water is still, sweep bottle horizontally through the water.
• Remove bottle and tip out a small portion of sample to allow an air space of 1 to 2 cm.
• Immediately replace lid tightly.
• Place the sample in an esky on ice and position so that it cannot fall or roll around. The sample should be stored or refrigerated at 1�C to 4°C and delivered to the laboratory as soon as possible.
If there is any doubt about the integrity of a sample, discard it and collect another sample in a new container.
For more detail on sampling procedure, storage and transport refer to the Field Manual in Appendix B.
Quality assurance and quality control
Microbial water quality programs should include a number of quality control procedures to ensure a high level of reliability and accuracy in the data. The definitions for quality control and quality assurance are:
�uality devising and implementing of safeguards to minimise control corruption of data. These safeguards are required at
every step of the process to ensure that the data collected are valid
�uality Testing the effectiveness of these safeguards assurance
Points at which data may be corrupted during the monitoring phase include equipment preparation, sample collection, field notes and storage and transport. Safeguards for each step are detailed in the Table 26.
Page 48

Microbial water quality monitoring
Table 26. Control assurance and quality control procedures
Step Quality Control Quality assurance
Equipment Make sure that sampling Collect a container blank for one in preparation containers are cleaned in
accordance with laboratory and standard procedures. Discard any sample container that is cracked, discoloured or damaged in any way, and store sample containers in a clean, dry environment.
every 10 containers. Containers are randomly selected and filled with sterilised water. Analysis of this water detects contamination from the container.
Sample Provide training in sampling Collect a field blank for one in collection techniques. Provide a field manual
that clearly marks site locations and sampling procedures.
every 10 samples collected. A field blank is prepared in the field. Sterilised water is taken into the field and the container is filled, handled and stored as if it were a real sample. A field blank will detect contamination by the sampler. Field sampling procedures should also be audited regularly.
Field notes Include a signoff point on each field sheet to promote double-checking of completeness and accuracy
Do a regular audit of field sampling procedures.
Storage and Include methods of sample Collect a trip blank on each transport preservation in the field manual.
Ensure that samples stored on ice are not immersed in water. Samples generally need to be kept at 4C after collection, but sample storage temperature requirements may vary, depending on what you are analysing the sample for.
Transport samples to the laboratory for analysis within 24 hours, and preferably within 6 hours.
sampling run. A trip blank can be used to assess cross-contamination of samples during storage and transport. Containers are filled with sterilised water, taken into the field, and stored and transported as if they were real samples.
Occupational Health and Safety
Occupational Health and Safety (OH�S) is a major issue that needs to be carefully considered when you are implementing any water quality monitoring program.
All employers should consult with their employees on health, safety and welfare matters. The following information is a guide to some of the hazards that may be encountered while sampling and some of the ways in which risk can be controlled.
Identifying hazards
A hazard is a source of potential harm or a situation with potential to cause loss or injury. Hazards or risks involved with field sampling should be assessed by the field staff and their managers and fully documented. Hazards that may be encountered in a program for monitoring
Page 49
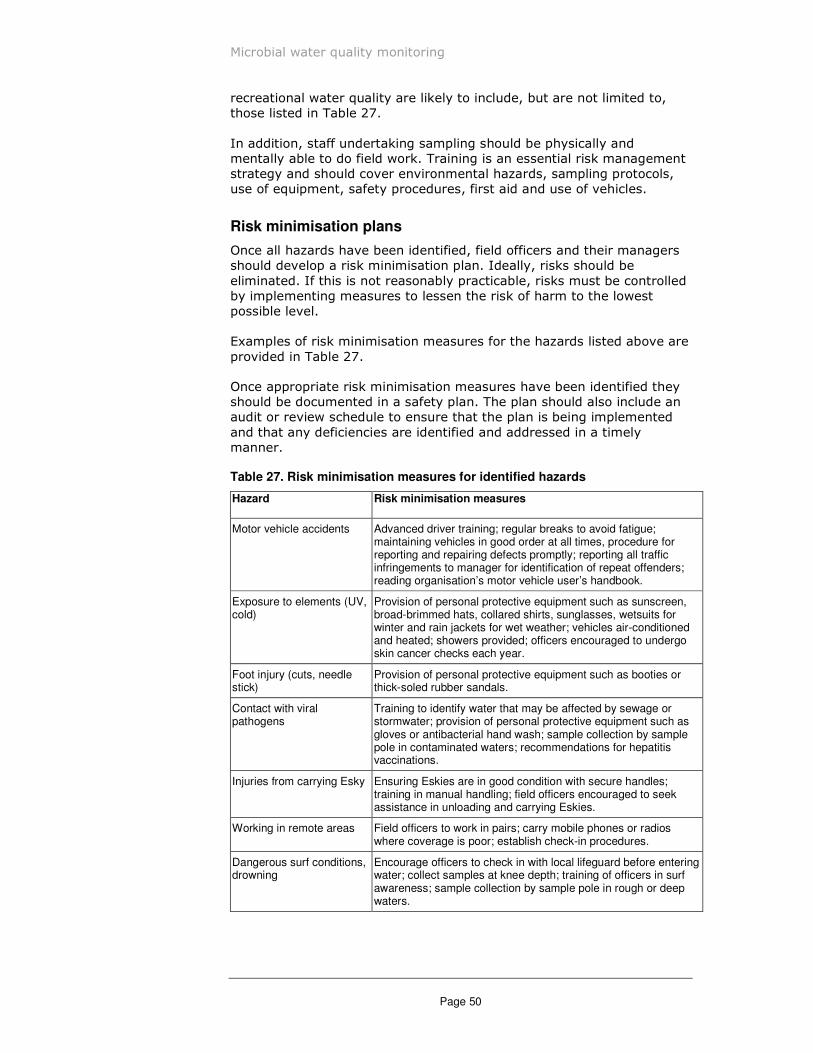
Microbial water quality monitoring
recreational water quality are likely to include, but are not limited to, those listed in Table 27.
In addition, staff undertaking sampling should be physically and mentally able to do field work. Training is an essential risk management strategy and should cover environmental hazards, sampling protocols, use of equipment, safety procedures, first aid and use of vehicles.
Risk minimisation plans
Once all hazards have been identified, field officers and their managers should develop a risk minimisation plan. Ideally, risks should be eliminated. If this is not reasonably practicable, risks must be controlled by implementing measures to lessen the risk of harm to the lowest possible level.
Examples of risk minimisation measures for the hazards listed above are provided in Table 27.
Once appropriate risk minimisation measures have been identified they should be documented in a safety plan. The plan should also include an audit or review schedule to ensure that the plan is being implemented and that any deficiencies are identified and addressed in a timely manner.
Table 27. Risk minimisation measures for identified hazards
Hazard Risk minimisation measures
Motor vehicle accidents Advanced driver training; regular breaks to avoid fatigue; maintaining vehicles in good order at all times, procedure for reporting and repairing defects promptly; reporting all traffic infringements to manager for identification of repeat offenders; reading organisation’s motor vehicle user’s handbook.
Exposure to elements (UV, cold)
Provision of personal protective equipment such as sunscreen, broad-brimmed hats, collared shirts, sunglasses, wetsuits for winter and rain jackets for wet weather; vehicles air-conditioned and heated; showers provided; officers encouraged to undergo skin cancer checks each year.
Foot injury (cuts, needle stick)
Provision of personal protective equipment such as booties or thick-soled rubber sandals.
Contact with viral pathogens
Training to identify water that may be affected by sewage or stormwater; provision of personal protective equipment such as gloves or antibacterial hand wash; sample collection by sample pole in contaminated waters; recommendations for hepatitis vaccinations.
Injuries from carrying Esky Ensuring Eskies are in good condition with secure handles; training in manual handling; field officers encouraged to seek assistance in unloading and carrying Eskies.
Working in remote areas Field officers to work in pairs; carry mobile phones or radios where coverage is poor; establish check-in procedures.
Dangerous surf conditions, drowning
Encourage officers to check in with local lifeguard before entering water; collect samples at knee depth; training of officers in surf awareness; sample collection by sample pole in rough or deep waters.
Page 50

Microbial water quality monitoring
Laboratory Analysis
The Laboratory
Laboratory accreditation
The analytical laboratory must be of a suitable standard. A good indication whether a laboratory has met a suitable minimum standard is its compliance with Australian Standards 3901, 3902, 3903, 3904, ISO 9000 accreditation or NATA (National Association of Testing Authorities) accreditation for the relevant analyses performed. Such laboratories have proved their performance to independent assessors and can ensure quality performance for their clients. Carefully assess any variation from recognised standard analysis procedures.
Other considerations
For analyses that must be undertaken within a short timeframe, such as analysis of enterococci, the location of the laboratory is an important factor in the selection process. Ideally, the laboratory should be within two hours' drive of the last sample collection point. If the laboratory is outside this range, consider employing a courier to deliver samples to prevent driver fatigue in samplers.
The working hours of the laboratory must also be considered. As bacterial samples must be processed immediately, many laboratories will require delivery of samples by 4 pm or earlier. This may not be practical if there are a large number of sites to be sampled or if the distance from the study area to the laboratory is great. Where later sample delivery times are required, these will need to be negotiated with the laboratory and may incur additional cost.
The laboratory's opening days will affect not only whether samples can be collected and submitted on the weekend, but also whether they can be collected later in the week. As the process for bacterial analysis takes several days, analysis of samples collected on Thursday or Friday will need to be completed on the weekend. If a laboratory is closed on weekends, sampling is usually restricted to Monday, Tuesday or Wednesday.
Methods
Enterococci density should be analysed by using membrane filtration method in accordance with Australian/New Zealand Standards (AS/NZS 4276.9:2007). This method does not require a confirmation step (unless the plate is crowded) and results are available within 26 hours. Where the standard method is modified or another standard used, then evidence is needed that similar results can be obtained.
The detection limits for samples submitted for bacterial analysis will vary, and appropriate limits will need to be decided on. As a guide, the OEH's Beachwatch program requires that original analyses are able to detect between 1 and 10,000 cfu/100 mL, and that retest analyses are able to detect between 1 and 1,000,000 cfu/100 mL.
Page 51
Microbial water quality monitoring
Laboratory Quality Assurance
Errors in analysis
The objective of quality assurance and quality control in a laboratory is to minimise errors that may occur during analysis and reporting and thus ensure that data are accurate and reliable.
A system of tracing results is part of good laboratory practice and an essential requirement for accreditation. For each analysis, the laboratory should keep records of the samples analysed, the person doing the analysis, the equipment used, original data and calculations, any manual data transfers, and standards preparation.
Quality assurance of laboratory results can be achieved through a range of measures. For bacterial analyses, laboratories commonly use interlaboratory comparisons and duplicate samples.
Interlaboratory comparisons
Interlaboratory comparisons are a form of proficiency testing. Replicate samples are sent to the regularly used laboratory and to two or more additional laboratories. The results from all laboratories are combined to generate a consensus mean. The results from the regularly used laboratory are then compared against this value to determine the accuracy of its results. Although the consensus mean is not necessarily the true value, the more laboratories that are included in the program, the less the consensus mean will be affected by outlying values.
Duplicate samples
Duplicate samples are used for assessing precision. At least 5% of samples should be analysed in duplicate. Duplicate samples are obtained by collecting a sample in a sterilised one-litre container, shaking vigorously for 1 minute to homogenise the sample, and then decanting this into two sterile sampling containers. The analysis of duplicate samples is standard procedure in laboratories.
Data handling
Laboratory reports
Reports from the laboratory should include the name and address of the laboratory, tabulated samples and analysis data, identification of analytical methods used, date of analysis, name of the technician, and a quality assurance statement.
When you receive the laboratory report, check it and identify any anomalous data - such as unexpectedly high or low results. Cross-check the field sheets to identify any reason for the result: for example, discharges to the beach or pollution evident in the water. If the result cannot be explained, ask for a retest of the sample.
So that retests can be done, the laboratory should store residual sample waters at 4�C for seven days after results have been provided. For bacterial analyses, test membranes and plates should also be stored at 4�C for one or two days after the results have been issued.
Data management
Page 52
Microbial water quality monitoring
Develop clear and detailed written procedures for managing data. The procedures should include electronic file locations, location of stored hard-copy reports, step-by-step instructions for data screening, importing and archiving, and the mandatory quality assurance checks. Develop procedures for dealing with data that are below the detection limit or are considered not to be of high quality.
Regularly review the quality assurance results to quickly identify and rectify problems. Store these results in a database.
Resource and planning issues
Experience shows that resource requirements are often underestimated. When planning the monitoring program, consider how long the sampling run will take to complete; the frequency, number and type of samples collected; as well as time and resources needed for data entry, data analysis and reporting.
Page 53

Microbial assessment and beach classification
Part
5 Microbial assessment and beach classification
Beach Suitability Grades provide the primary means to assess suitability of a swimming location for recreation over time and are based on a combination of sanitary inspection (identification and rating of potential pollution sources at a beach) and water quality measurements gathered over previous years. This section describes how to calculate the Microbial Assessment Category, assign a Beach Suitability Grade and provides information on interpretation of the grades.
Microbial Assessment Categories
The Microbial Assessment Category is determined from the 95th percentile of a dataset of at least 100 data points. The four categories (A to D) relate to levels of risk of illness determined from key epidemiological studies (Table 28).
NHMRC recommend Microbial Assessment Categories be calculated from a rolling five year dataset, with at least 20 samples collected each year.
A consideration in determining the Microbial Assessment Category is that the threshold enterococci levels for each of the four categories were determined by the World Health Organisation from a dose-response relationship applied to enterococci data collected at swimming locations across Europe. These threshold levels will represent different levels of illness if the distribution of enterococci data from swimming locations in NSW differs from the European distribution.
In recognition of this problem Dr Richard Lugg (WA Department Health) has developed Enterotester, a Microsoft Excel� tool for calculating a modified 95th percentile which takes into account differences in distribution of the data in Australian conditions. The Enterotester template is packaged together with 'Simple Step by Step Instructions' that have been developed to assist the user to work through this template and is available for download from WA Health website at http://www.public.health.wa.gov.au/3/662/2/bacterial�water�quality.p m. Guidance notes for using this tool are also provided in Appendix C.
Page 55
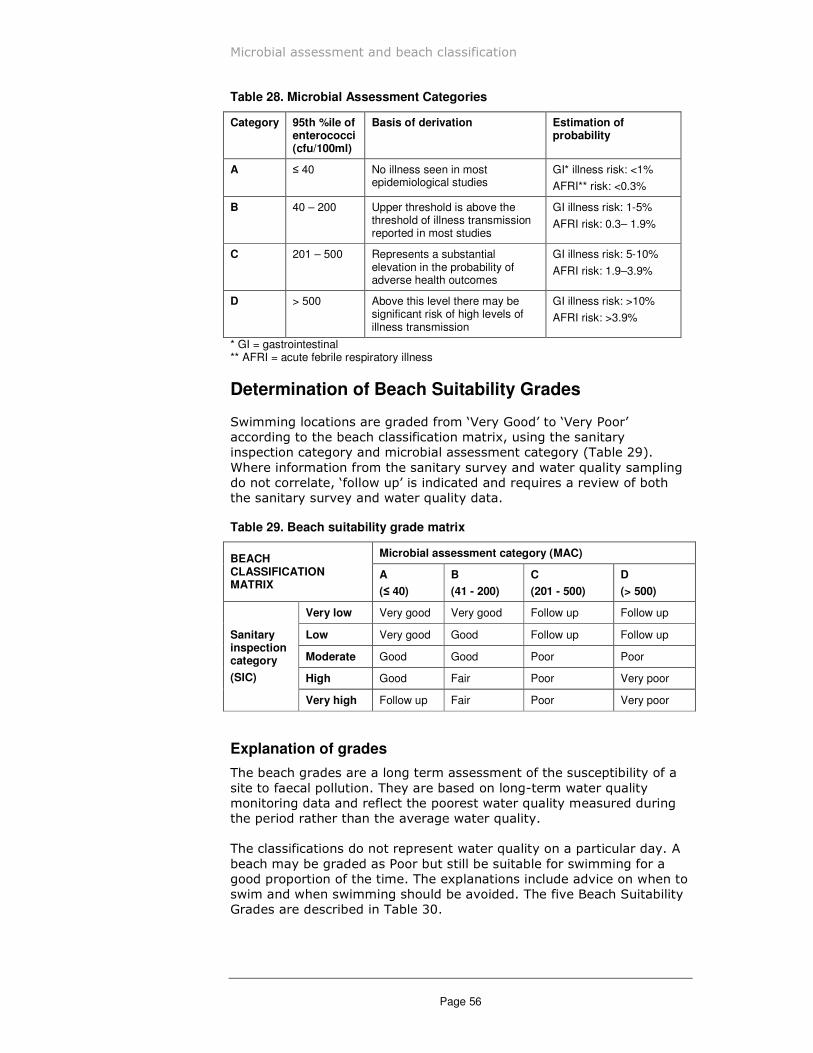
Microbial assessment and beach classification
Table 28. Microbial Assessment Categories
Category 95th %ile of enterococci (cfu/100ml)
Basis of derivation Estimation of probability
A = 40 No illness seen in most epidemiological studies
GI* illness risk: <1%
AFRI** risk: <0.3%
B 40 – 200 Upper threshold is above the threshold of illness transmission reported in most studies
GI illness risk: 1-5%
AFRI risk: 0.3– 1.9%
C 201 – 500 Represents a substantial elevation in the probability of adverse health outcomes
GI illness risk: 5-10%
AFRI risk: 1.9–3.9%
D > 500 Above this level there may be significant risk of high levels of illness transmission
GI illness risk: >10%
AFRI risk: >3.9%
* GI = gastrointestinal ** AFRI = acute febrile respiratory illness
Determination of Beach Suitability Grades
Swimming locations are graded from 'Very Good' to 'Very Poor' according to the beach classification matrix, using the sanitary inspection category and microbial assessment category (Table 29). Where information from the sanitary survey and water quality sampling do not correlate, 'follow up' is indicated and requires a review of both the sanitary survey and water quality data.
Table 29. Beach suitability grade matrix
BEACH Microbial assessment category (MAC)
CLASSIFICATION MATRIX
A
(S 40)
B
(41 - 200)
C
(201 - 500)
D
(> 500)
Sanitary inspection category
(SIC)
Very low Very good Very good Follow up Follow up
Low Very good Good Follow up Follow up
Moderate Good Good Poor Poor
High Good Fair Poor Very poor
Very high Follow up Fair Poor Very poor
Explanation of grades
The beach grades are a long term assessment of the susceptibility of a site to faecal pollution. They are based on long-term water quality monitoring data and reflect the poorest water quality measured during the period rather than the average water quality.
The classifications do not represent water quality on a particular day. A beach may be graded as Poor but still be suitable for swimming for a good proportion of the time. The explanations include advice on when to swim and when swimming should be avoided. The five Beach Suitability Grades are described in Table 30.
Page 56
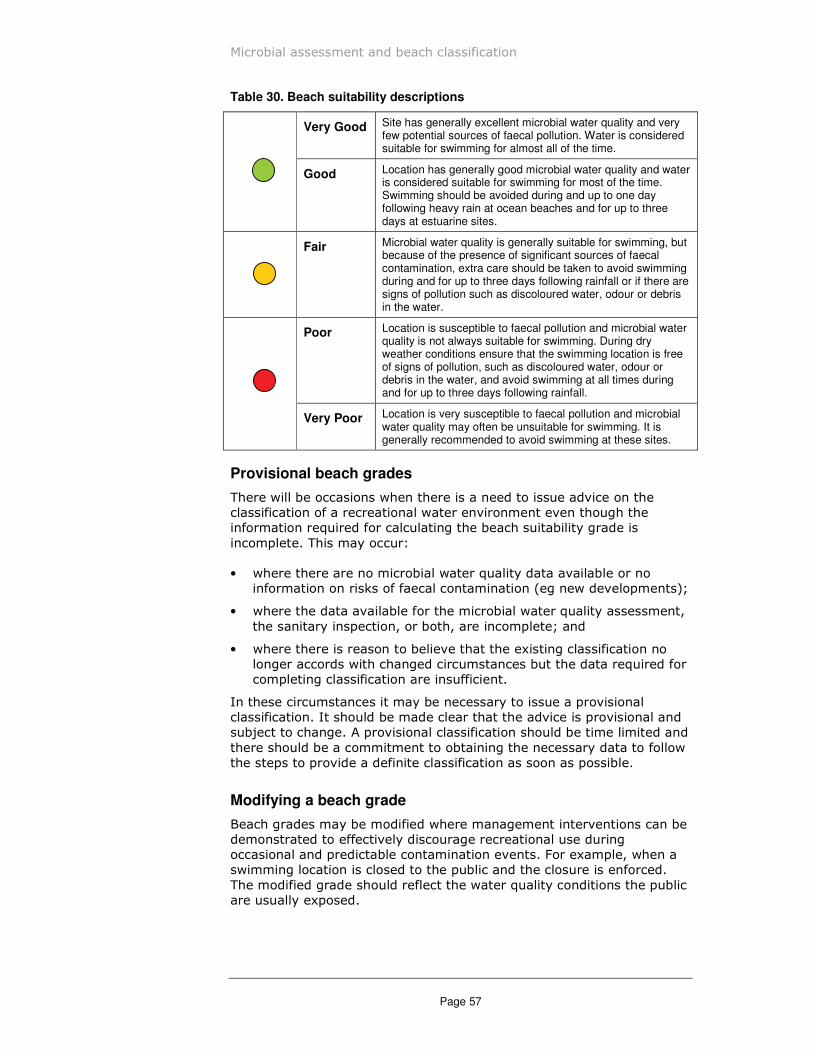
Microbial assessment and beach classification
Table 30. Beach suitability descriptions
Very Good Site has generally excellent microbial water quality and very few potential sources of faecal pollution. Water is considered suitable for swimming for almost all of the time.
Good Location has generally good microbial water quality and water is considered suitable for swimming for most of the time. Swimming should be avoided during and up to one day following heavy rain at ocean beaches and for up to three days at estuarine sites.
Fair Microbial water quality is generally suitable for swimming, but because of the presence of significant sources of faecal contamination, extra care should be taken to avoid swimming during and for up to three days following rainfall or if there are signs of pollution such as discoloured water, odour or debris in the water.
Poor Location is susceptible to faecal pollution and microbial water quality is not always suitable for swimming. During dry weather conditions ensure that the swimming location is free of signs of pollution, such as discoloured water, odour or debris in the water, and avoid swimming at all times during and for up to three days following rainfall.
Very Poor Location is very susceptible to faecal pollution and microbial water quality may often be unsuitable for swimming. It is generally recommended to avoid swimming at these sites.
Provisional beach grades
There will be occasions when there is a need to issue advice on the classification of a recreational water environment even though the information required for calculating the beach suitability grade is incomplete. This may occur:
• where there are no microbial water quality data available or no information on risks of faecal contamination (eg new developments);
• where the data available for the microbial water quality assessment, the sanitary inspection, or both, are incomplete; and
• where there is reason to believe that the existing classification no longer accords with changed circumstances but the data required for completing classification are insufficient.
In these circumstances it may be necessary to issue a provisional classification. It should be made clear that the advice is provisional and subject to change. A provisional classification should be time limited and there should be a commitment to obtaining the necessary data to follow the steps to provide a definite classification as soon as possible.
Modifying a beach grade
Beach grades may be modified where management interventions can be demonstrated to effectively discourage recreational use during occasional and predictable contamination events. For example, when a swimming location is closed to the public and the closure is enforced. The modified grade should reflect the water quality conditions the public are usually exposed.
Page 57
Microbial assessment and beach classification
Data analysis
Weekly assessment
Weekly assessment of microbial water quality is useful as an early indication of when and where further investigation may be required. Unexpected, elevated results can be used to trigger appropriate management actions to reduce risk to public health. Further information on trigger levels is provided in Part 7.
Weekly assessment of enterococci results also allows for regular reporting to the community. The information can be reported as a star rating on websites or in local papers which are easily accessed by the community. Beaches can be graded from one star to four stars on a weekly basis using the most recent microbial result. Methods for calculating star ratings are provided in Part 6.
A limitation of weekly assessments is the small number of data (single data point for each location) available for interpretation.
Annual assessment
The Beach Suitability Grade is determined annually. To do this, the sanitary inspection must be reviewed and Sanitary Inspection Category updated to reflect any changes in pollution sources or their likelihood and the Microbial Assessment Category recalculated from the most recent 100 enterococci data points.
Page 58
Reporting
Part
6 Reporting
Reporting and information dissemination are important tools for managing risks in recreational waters. They are essential for raising community awareness and increasing the understanding of the potential pollution sources and health risks associated with recreational water use.
Beach managers should aim to provide beach users with general advice on beach water quality, in conjunction with annual classifications. This information enables informed decisions about where and when to swim to be made and greatly reduces risks to public health.
Daily predictions and weekly star ratings can also be developed to provide the community with more immediate indications of beach water quality. While these are not mandatory, they are effective tools to support general advice and beach classification.
Reports on microbial water quality should be kept as simple as possible and results presented in clear and easy-to-interpret formats. Care should be exercised when interpreting data and clearly state whether the NHMRC (2008) guidelines on recreational water quality were followed.
This section outlines ways to report recreational water quality and how to develop a communication plan.
Annual classifications
The minimum level of reporting required by the NHMRC 2008 guidelines is an annual Beach Suitability Grade (see Part 5).
For councils participating in the Beachwatch Partnership Program, this information is reported in the State of the Beaches report issued after 1 October each year. This information could also be released as a press release at the start of the following swimming season or holiday period.
Beach Suitability Grades can also be displayed on signs at the beach, on websites or in a flyer with rates notices.
General advice
The beach classifications include general information which can assist the general public to determine when it is safe to swim (Table 31) and
Page 59

Reporting
this information should also be included when reporting the beach classifications to the community.
Table 31. General advice for each beach classification
Classification Advice
Very good Water is considered safe for swimming at all times
Good Avoid swimming during heavy rainfall
Fair Avoid swimming during and following heavy rainfall for one day at ocean beaches and up to three days at estuarine swimming sites
Poor Avoid swimming during and for up to three days after rainfall or if there are signs of pollution such as discoloured water, fast flowing or strong smelling drains or street litter floating in the water or on the tide line
Very poor Avoid swimming at all times
General advice can also relate to certain situations which may increase the likelihood of pollution at the swimming site:
• Avoid swimming if the lagoon is open.
• Avoid swimming if there is discoloured water, fast flowing or strong smelling drains or street litter floating in the water or on the tide line.
Daily bulletins
A major limitation with the use of bacterial indicators is that results are not available for up to 48 hours after sampling. During this time, bathers may be exposed to pathogens. To reduce the risk to public health, beach users need to be notified when pathogens may be present in recreational waters and tools which provide a quick, reliable and conservative estimate of the level of faecal contamination are required.
An advisory, such as a daily bulletin, based on the results of predictive modelling can be used to support the beach classification and general advice.
One of the most commonly used predictive models is a rainfall-based alert curve. The model uses the statistical relationship between rainfall in the catchment and the bacterial levels at a specific swimming location. A wide range of other models are also available (USEPA 1999). Although predictive models are effective tools for supplementing actual sampling, it is important to remember that models do not provide perfect predictions of actual conditions, only estimates of current conditions.
Rainfall-based predictive models
Rainfall affects the level of flow in the sewerage and stormwater systems. Each beach has a different response depending on the catchment area, the extent and stage of development, and the condition of the sewerage system. In general, faecal contamination increases with increasing rainfall, but some beaches appear to reach a rainfall threshold above which faecal contamination rises rapidly, whereas others exhibit
Page 60
Reporting
an apparent log-linear response. Others appear to be largely unaffected by rainfall.
A rainfall-based model is derived from a statistical relationship between the amount of rainfall at representative rainfall gauges in a catchment and the bacterial levels measured at a swimming location. Although the model does not specifically account for pollution sources, the fate of pollutants or transport processes, these factors are indirectly included within the statistical relationship.
The objective of the model is to establish a relationship between rainfall and bacterial levels. The relationship then serves as a management tool for developing advisory warnings or beach closure procedures based on rainfall levels that might result in unacceptable levels of faecal contamination.
The model does, however, need to be updated in response to changes in pollution sources. For example, where remediation actions have reduced the level of faecal contamination contributed by several large stormwater drains, the relationship between rainfall and bacterial levels is likely to be altered.
There are three phases in the development of a rainfall-based predictive model: data collection, data analysis, and the development of operational or advisory rules.
Data collection
Rainfall-based models are site-specific, and their development can require relatively large amounts of rainfall and water quality data.
Collate rainfall data from one or more gauges within the catchment or near the location. Water quality data can be collected from the swimming site specifically for the development of the model, and can be supplemented with data from historical monitoring, if available.
Data analysis
Rainfall models can be developed by analysing the frequency of exceedences. An exceedence is defined as any time the measured level of indicator bacteria exceeds a pre-determined level. Although the NHMRC (2008) guidelines do not indicate unacceptable bacterial levels for a single sample, the 95th percentile values in the microbial assessment categories can be used as the threshold levels.
The objective of the method is to determine the minimum amount of rainfall that causes bacterial levels to exceed the threshold levels. This is determined by dividing up the daily rainfall record into categories that range from zero rainfall to the maximum rainfall. For each rainfall category, the observed bacterial level or the 95th percentile of multiple samples is compared with the threshold level.
Operational or advisory rules
Operational or advisory rules should be implemented once rainfall thresholds and acceptable levels of risk are exceeded.
Page 61
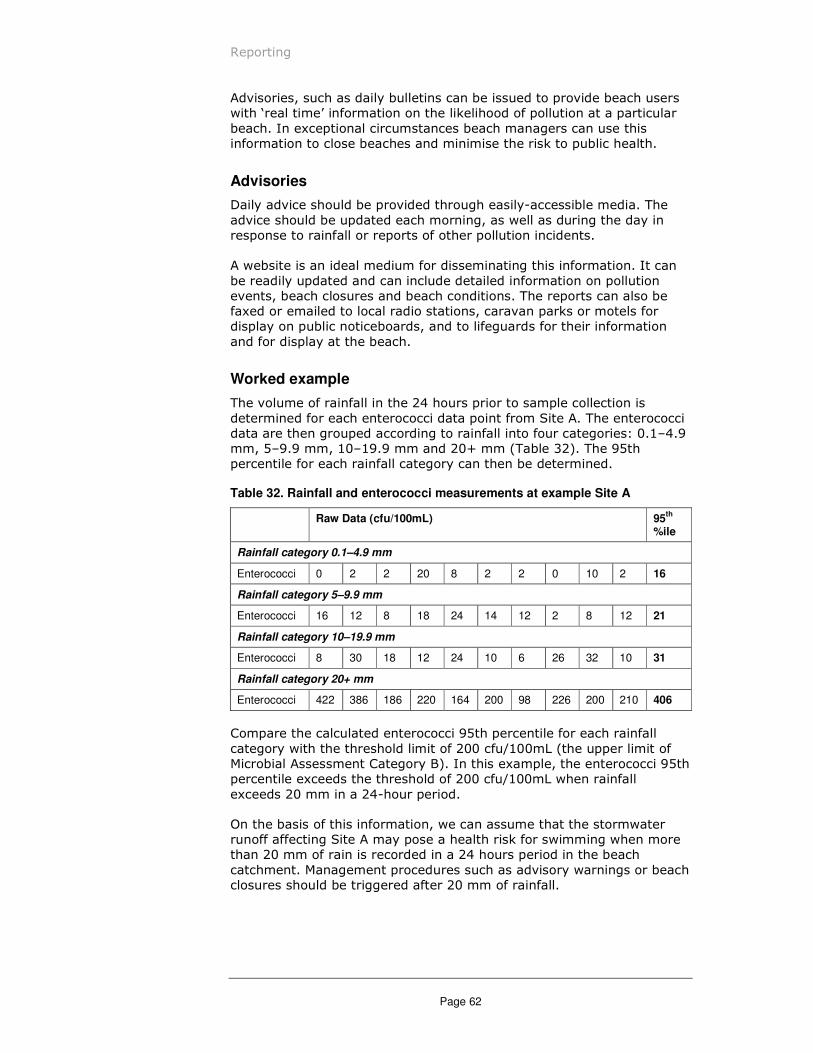
Reporting
Advisories, such as daily bulletins can be issued to provide beach users with 'real time' information on the likelihood of pollution at a particular beach. In exceptional circumstances beach managers can use this information to close beaches and minimise the risk to public health.
Advisories
Daily advice should be provided through easily-accessible media. The advice should be updated each morning, as well as during the day in response to rainfall or reports of other pollution incidents.
A website is an ideal medium for disseminating this information. It can be readily updated and can include detailed information on pollution events, beach closures and beach conditions. The reports can also be faxed or emailed to local radio stations, caravan parks or motels for display on public noticeboards, and to lifeguards for their information and for display at the beach.
Worked example
The volume of rainfall in the 24 hours prior to sample collection is determined for each enterococci data point from Site A. The enterococci data are then grouped according to rainfall into four categories: 0.1-4.9 mm, 5-9.9 mm, 10-19.9 mm and 20� mm (Table 32). The 95th percentile for each rainfall category can then be determined.
Table 32. Rainfall and enterococci measurements at example Site A
Raw Data (cfu/100mL) 95th
%ile
Rainfall category 0.1–4.9 mm
Enterococci 0 2 2 20 8 2 2 0 10 2 16
Rainfall category 5–9.9 mm
Enterococci 16 12 8 18 24 14 12 2 8 12 21
Rainfall category 10–19.9 mm
Enterococci 8 30 18 12 24 10 6 26 32 10 31
Rainfall category 20+ mm
Enterococci 422 386 186 220 164 200 98 226 200 210 406
Compare the calculated enterococci 95th percentile for each rainfall category with the threshold limit of 200 cfu/100mL (the upper limit of Microbial Assessment Category B). In this example, the enterococci 95th percentile exceeds the threshold of 200 cfu/100mL when rainfall exceeds 20 mm in a 24-hour period.
On the basis of this information, we can assume that the stormwater runoff affecting Site A may pose a health risk for swimming when more than 20 mm of rain is recorded in a 24 hours period in the beach catchment. Management procedures such as advisory warnings or beach closures should be triggered after 20 mm of rainfall.
Page 62

Reporting
Star ratings
Star ratings allow more frequent reporting of water quality results than a single report at the end of the bathing season and require fewer resources for production than daily bulletins. The ratings provide the community with an assessment of water quality each week and can be reported in local newspapers and or on websites.
Star ratings are based on a single enterococci data point from the most recent sampling occasion. To allow the star ratings to be updated each week, samples must be collected at a minimum frequency of once per week.
The star rating categories are derived from the microbial assessment categories used in the NHMRC (2008) guidelines. Beaches are graded from one star to four stars according to Table 33.
Table 33. Star rating categories
RATING Enterococci (cfu/100ml) category
Description
**** = 40 Good
*** 41 – 200 Fair
** 201 – 500 Poor
* >500 Bad
Calculating star ratings
Each beach is assigned a star rating based on the enterococci result from the latest sampling run. For example, a beach with a result of 51 cfu/100ml would fall into the "41 - 200" enterococci category and be assigned three stars and "Fair" rating.
"Good" rating indicates bacteria levels are generally safe for bathing according to National Health � Medical Research Council guidelines.
"Fair" rating indicates an increased risk of illness to bathers, particularly those with lower immune function such as the elderly and young children.
"Poor" and "Bad" rating indicate bacterial levels pose a substantially increased risk of illness to bathers.
Reporting star ratings
Star ratings can be reported in tables or on maps of the region. It is important to include the date of sampling, recent rainfall in the area, as well as general advisories such as to avoid swimming during and at least one day after heavy rain and if there are signs of stormwater pollution. A contact number should also be provided for further enquiries. This information can be presented on a website or in local papers.
For councils participating in the Beachwatch Partnership Program, star ratings can be calculated by Beachwatch and presented on the Beachwatch website.
Page 63

Reporting
Press release
A press release at the beginning of the swimming season is a good way to advise the community that water quality assessment is being undertaken and advise how they may access the information.
Similarly, a press release at the start of the holiday period may be used to advise the local community, tourists and other visitors on beach suitability.
The Communication Plan
Audience identification
The potential target audience for information on beach water quality must be identified and characterised. The characteristics of beach users will define the mode of communication you select. For example, a sign posted at a beach entrance may be suitable if most beach users live locally, whereas an additional message on a website or telephone line may be necessary where the beach is used by those living farther away.
A survey of the public is a useful means of identifying the audience and gaining an understanding of public behaviour, knowledge, beliefs and the information sources that people use to obtain information.
Methods of communication
The method of communication chosen will largely depend on the needs of the target audience and the objectives of the monitoring program. The methods that are most commonly used are:
Beach signs
Signs are an effective way to communicate advice to the community on when not to swim. A permanent sign displaying the advice can be erected at the access points to the beach. Alternatively, lifeguards can erect temporary signs warning of pollution on particular days or can close the beach if necessary.
Signs should be simple and consistent throughout the council area. They should also be large enough to be noticed, legible and easily understood. Graphics and bright colours such as red or yellow are a good way to get attention. There may be legal implications in using some beach signs. Seek legal advice for particular signs and locations.
Mass media
Newspapers, television and radio are effective means for communicating that swimming is not advisable. These forms of communication enable you to provide more detailed information to the public than a sign at a beach. For example, you can provide information for more than one beach and explain the reason for the warning or beach closure.
Notifying the public through mass media targets a larger audience than a sign at a beach. It also has the added advantage of advising the community before they arrive at the beach, and can be updated regularly.
Page 64

Reporting
Public notification of pollution warnings or beach classification can be provided in the form of a press release. Format the press release to get the reader's attention and communicate the information effectively. To this end, make sure that the release is short, uses bullet points and bold text where necessary, and gives a name and contact phone number.
Websites
Providing beach water quality information on the council's website is a good way to reach many people in the community. This medium can be used to present information on beach classifications, general warnings on when it is suitable to swim, and daily predictions of water quality.
The contents of the website can also include sampling results, maps of the area, information on the monitoring program, photographs of the beach, contact numbers for reporting pollution incidents or inquiries, information on how the community can help reduce levels of pollution at their beach, and promotion of council actions to improve water quality.
View the Beachwatch website at www.environment.nsw.gov.au\beach, as an example of online communication.
Technical reports
Technical reports provide comprehensive information to the community and can include details of the monitoring program, site locations, findings from the sanitary inspections, microbial assessment categories, the impact of rainfall or pollution sources on water quality, and any remediation works undertaken or planned at the site.
Evaluation of your communication plan
Evaluate your communication plan regularly to ensure that it meets the needs of the public and the objectives of the council. Perform a summary evaluation at the end of the swimming season or holiday period.
A survey of the community and tourists could include questions on their knowledge of the health risks associated with swimming in contaminated water, recollection of advice, awareness of websites, and their level of media use and preferred media for communication.
Page 65

Management
Part
7 Management
Management actions
Management of risks from microbial contamination is a critical component of the NHMRC 2008 guidelines. Ideally, identified risks should be eliminated entirely. However, this is rarely ever possible and most management actions focus on reducing the risk. Risk can be reduced in two ways:
• reduce the likelihood of a public health event occurring
• reduce the consequence of the public health event.
In many cases, a combination of both approaches can be used.
Actions to reduce likelihood
Pollution abatement actions aim to contain or reduce the release of sewage or faecal contamination into the environment and include:
• relining sewers and stormwater pipes, fixing sewage pumping stations and reducing sewer inputs to reduce the potential for overflows, such as by reusing wastewater;
• using sewage retention tanks or tunnels that discharge during periods when water is not being used recreationally or that act as buffers during storms by retaining sewage for future treatment (these are costly and may be impractical for large urban areas, but examples exist, such as the Northside tunnel in Sydney);
• transporting sewage to locations distant from recreational areas via piped collection systems or effective outfalls; and
• disinfection (ozone, chlorine, peracetic acid or UVR), which may not be effective against all hazards.
Many of the above actions require major capital expenditure and may not be readily justifiable, especially in rural communities where the cost is borne by a smaller population. Sources requiring pollution abatement measures can be prioritised according to likelihood, with resources focused on sources rated as Very Likely or Likely.
Identifying sources
In some cases, elevated bacterial levels will be measured during routine monitoring and the source will be unknown. Inputs may come from human sewage, farm animals, native birds and animals or domestic pets. Identifying the source is an important part of the risk management
Page 67

Management
process and some of the most common source detection methods are outlined below. Some of these procedures are simple and can be done in situ while others are more complex, requiring specialist laboratory techniques.
Faecal sterols
Faecal sterols are excreted by animals and humans as by-products of digestion of dietary sterols. The particular distribution of sterols found in faecal matter is influenced by factors such as diet, intestinal microflora and the animal's ability to synthesise its own sterols. The combination of these factors determines 'the sterol fingerprint'. Faecal sterols as biomarkers provide a valuable tool in the investigation of the sources and fate of faecal contamination in the environment. Faecal contamination from humans, dogs, birds and herbivores such as cattle, sheep, kangaroos, etc. may be differentiated from each other through the identification and relative abundance of the various sterols, in combination with microbiological analysis.
Conductivity
Conductivity is the property of a substance which enables it to serve as a channel or medium for electricity. Salty water conducts electricity more readily than purer water. Therefore, electrical conductivity is routinely used to measure salinity. Significant changes in conductivity may indicate that a discharge or some other source of contamination has entered recreational waters.
Each waterbody tends to have a relatively consistent range of electrical conductivity values that, once known, can be used as a baseline against which to compare regular measurements of conductivity. Marine waters have a higher conductivity than freshwater and therefore a reduction in conductivity can indicate freshwater influence from stormwater. Gradients in conductivity can also be measured from stormwater drains to assess the extent of impact from this pollution source on a specific swimming location.
Bacterial source sampling
Bacterial source sampling aims to identify the source of faecal contamination by obtaining a 'fingerprint' of the indicator bacteria that can be then be classified as derived from a particular host group or locality. The techniques in use include examining antibiotic resistance profiles and genotyping bacteria to determine clonal composition.
The success of these efforts depends on several assumptions being valid (Gordon 2001):
1. The clonal composition of the bacteria differs among localities.
2. The clonal composition of the bacteria is likely to be specific to a particular host species. For example, bacteria from a human source of contamination will have a difference clonal composition from the same bacterial species sourced from cows.
3. The clonal composition of the species isolated from the water represents the clonal composition of the species in the host populations responsible for the faecal inputs to the environment.
Page 68
Management
4. The clonal composition of populations is stable through time. That is, that the same clones can be recovered from the same locality or host populations for 'extended' periods.
Actions to reduce consequence
The impact of a faecal contamination incident can be greatly reduced by restricting public use of the site during the period of increased risk.
Beach closures
Council lifeguards routinely close beaches in response to dangerous surf conditions and may also do so when water pollution is clearly visible, for example, when there are grease balls on the sand, turbid stormwater or lagoon discharges or extensive surface scum or slicks.
Beach closures may also be initiated as part of an incident response procedure, as outlined below. Many overseas countries, such as the United States, also close beaches in response to elevated bacterial levels measured during routine sampling. In New Zealand, local authorities are required to erect health warning signs at the entrances to swimming sites when elevated bacterial levels are detected (New Zealand Ministry for the Environment, 2003)
It is recommended that swimming locations rated as Very Poor be permanently closed (NHMRC 2008).
Informed personal choice
Reporting of beach suitability grades and other water quality information enables the community to make informed personal choices about where and when to swim.
Daily advisories provide an assessment of the likelihood of faecal contamination at a swimming location and can be used to warn the community about periods of increased risk, such as following rainfall. These can be placed on websites, sent as RSS feeds, posted on social media, recorded on telephone information lines, issued by local radio or posted on signs at beach entrance points or on surf club notice boards.
Weekly star ratings provide regular reports on water quality and raise the community's awareness about when to avoid swimming. These can be placed on websites, advertised in local press or posted on signs and noticeboards at the beach.
Press releases can be issued at the start of the swimming season, at peak holiday periods, in response to pollution incidents or to report beach suitability grades.
Part 6 of this protocol provides further information on reporting.
Triggers for Management Actions
Water quality monitoring
Elevated enterococci results may be recorded during routine monitoring over the summer season. These elevated results can signify a significant deterioration in water quality. When detected, they should trigger a
Page 69
Management
response to investigate the cause of faecal contamination. If sampling results remain elevated, the source or cause must be identified and appropriate action taken. This may include signage at the site to advise the public on the safety of the recreational water body.
Site specific trigger levels allow response to unanticipated deterioration in water quality that is unusual for a specific site rather than using a generic trigger that is applied for all sites. The guidelines do not provide specific guidance as to what level of elevated microbial count represents a trigger level for action. However, when sampling data is entered into the Enterotester spreadsheet, a trigger level will be automatically calculated for the sampling location (Appendix C).
Incidents or exceptional circumstances
Incidents such as sewage overflows can greatly increase the risk to human health. All agencies need to be aware of their roles and responsibilities to ensure that the incident is managed in a rapid, coordinated and effective manner to prevent or minimise impacts to public health. While individual agencies may have their own risk management plans, it is essential that a coordinated approach is developed to ensure effective management and communication between relevant authorities.
Development of Incident Response Plans
Incident response plans should include:
Definition of the incident When should the plan be applied� Include definitions of any general terms, such as 'recreational water body'.
Roles and responsibilities Identify all agencies that have a role in managing the incident including initial assessment, containment and clean up of contamination, installation, management and removal of warning signs, issuing of public health advisories, providing advice on risks, collection of samples, media and stakeholder liaison and determining when area is again safe for swimming.
Notification process Detail the notification process, including when and how to contact each agency.
Response process Detail the actions each agency must undertake when notified of an incident. This expands on the agencies' responsibilities and includes specifications for signage, barriers, sampling, public notifications and the decision framework for re-opening a beach.
Contact details Include during and after hours contact details for principal and secondary contacts in all agencies.
Page 70
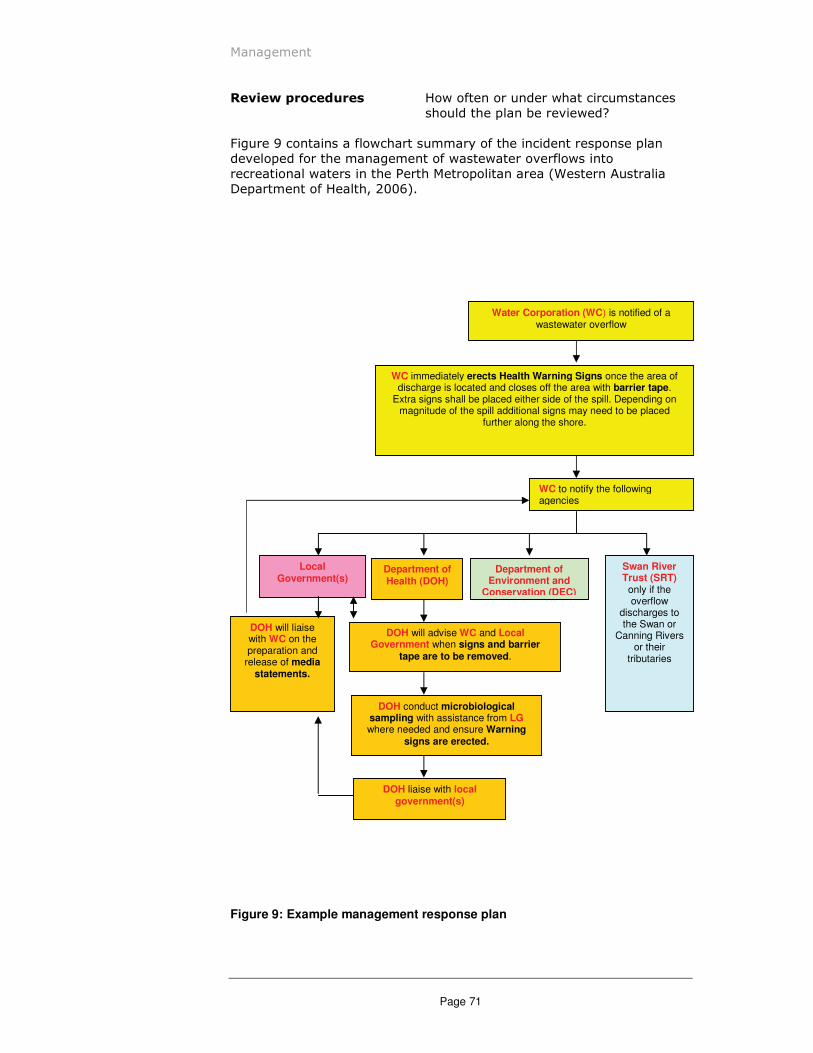
Management
Review procedures How often or under what circumstances should the plan be reviewed�
Figure 9 contains a flowchart summary of the incident response plan developed for the management of wastewater overflows into recreational waters in the Perth Metropolitan area (Western Australia Department of Health, 2006).
Water Corporation (WC) is notified of a wastewater overflow
WC immediately erects Health Warning Signs once the area of discharge is located and closes off the area with barrier tape.
Extra signs shall be placed either side of the spill. Depending on magnitude of the spill additional signs may need to be placed
further along the shore.
WC to notify the following agencies
Local Government(s)
Department of Health (DOH)
Department of Environment and
Conservation (DEC)
DOH will liaise with WC on the preparation and
release of media statements.
DOH liaise with local government(s)
DOH conduct microbiological sampling with assistance from LG where needed and ensure Warning
signs are erected.
DOH will advise WC and Local Government when signs and barrier
tape are to be removed.
Swan River Trust (SRT)
only if the overflow
discharges to the Swan or
Canning Rivers or their
tributaries
Figure 9: Example management response plan
Page 71

References
References
References
ANZECC. 2000. Australian and New Zealand Guidelines for Fresh and Marine Water Quality. National Water Quality Management Strategy. Australian and New Zealand Environment and Conservation Council � Agriculture and Resource Management Council of Australia and New Zealand, Canberra.
APHA 1998. Standard Methods for the Examination of Water and Wastewater, 20th Edition. American Public Health Association, Washington, DC.
AS/NZS 4360:1999 Standards for Risk Management.
Balarajan R, Soni Raleigh V, Buen P, Wheeler D, Cartright R. 1991. Health Risks of Fresh Water Bathing among Primary School Children. Report No. 289202017, RIVM, Bilthoven, Netherlands. 50 pp.
Cheung WHS, Hung RPS, Chang KCK, Kleevens JWL. 1990. Epidemiological study of beach water pollution and health-related bathing water standards in Hong Kong. Wat. Sci. Technol. 23(1–3):243–
252.
Corbett SJ, Ruben GL, Klienbaum DG. 1993. The health effects of swimming at Sydney beaches. The Sydney Beach Users Advisory Group. Am. J. Publ. Health 83(12): 1701–1706.
DEC 2004. Monitoring and Reporting Coastal Recreational Water Quality Information Package and Field Manual. Department of Environment and Conservation (NSW), Sydney.
Fattal B, Peleg-Olvesky, Agurshy T, Shuval HI. 1987. The association between sea water pollution as measured by bacterial indicators and morbidity of bathers at Mediterranean beaches in Israel. Chemosphere 16: 565–570.
Fleisher JM, Kay D, Salmon RL, Jones F, Wyer MD, Godfree AF. 1996. Marine waters contaminated with domestic sewage: non-enteric illnesses associated with bather exposure in the United Kingdom. Am. J. Publ. Health 86(9): 1228–1234.
Gordon, D. 2001. Geographical structure and host specificity in bacteria and the implications for tracing the source of coliform contamination. Microbiology 147, 1079-1085
Page 73
References
Kay D, Fleisher JM, Salmon RL, Wyer MD, Godfree AF, Zelenauch-
Jacquotte Z, Shore R. 1994. Predicting likelihood of gastroenteritis from sea bathing; results from randomised exposure. The Lancet 344 (8927): 905–909.
Kueh CSW, Tam T-B, Lee T. 1995. Epidemiological study of swimming-
associated illnesses relating to bathing-beach water quality. Wat. Sci. Technol. 31(516): 1-4.
McBride GB, Bandaranayake DR, Salmond CE, Turner SJ, Lewis G, Till D, Hatton C, Cooper AB. 1998/3. Faecal indicator density and illness risk to swimmers in coastal waters: a preliminary study for New Zealand. Proc. Ann. Conf. NZ Water and Waste Assoc., Havelock North, New Zealand, 1–3 September, 43–49.
NHMRC 1990. Australian Guidelines for Recreational Use of Water. National Health and Medical Research Council, Australian Government Publishing Service, Canberra.
NHMRC 2008. Guidelines for Managing Risks in Recreational Waters. National Health and Medical Research Council, Australian Government Publishing Service, Canberra.
NHMRC/NRMMC (2004). Australian Drinking Water Guidelines. National Health and Medical Research Council, Natural Resource Management Ministerial Council, Canberra.
New Zealand Ministry for the Environment 2003. Microbial Water Quality Guidelines for Marine and Freshwater Recreational Areas. New Zealand Ministry for the Environment, Wellington.
Pruss A. 1998. Review of epidemiological studies on health effects from exposure to recreational water. Int J Epidemiol 27: 1–9.
USEPA 1999. Review of Potential Modeling Tools and Approaches to Support the BEACH Program. US Environmental Protection Agency, Office of Water. Washington DC.
von Schirnding BER, Straus N, Robertson P, Kifr R, Fattal B, Mahee A, Frank M, Cabelli VJ. 1993. Bather morbidity from recreational exposure to sea water. Wat. Sci. Technol. 27(3-4): 183–186.
Western Australia Department of Health 2006. Roles in Response to Wastewater Overflows into Recreational Water Bodies within the Perth Metropolitan Area. Western Australia Department of Health, Perth.
WHO 2003. Guidelines for Safe Recreational Water Environments. Volume 1. Coastal and Fresh Waters. World Health Organisation, Geneva.
WHO 1999. Health-based monitoring of recreational waters: the feasibility of a new approach (the"Annapolis Protocol'). World Health Organisation, Geneva.
WSAA 2003. Catchments for Recreational Water: Conducting and Assessing Sanitary Inspections. Occasional Paper Number 8, Water Services Association of Australia, May 2003.
Page 74