
Monthly Report FRC Team 1772 The Brazilian Trail Blazers - Publication 5
Upload
russab-aliCategory
view
77download
0
Chapter 8 : Marketing Research

Agenda
Portland Trail Blazers
• Professional Basketball Team Based in Portland, Oregon founded 1970 (1977 won)
• Corporate Entity owned by Vulcan Sports and Entertainment which is owned by Paul Allen(Microsoft Co-Founder)
• Play in moda Center (formally rose garden)• Make money through ticket Sales, Revenue
Sharing, National and Local TV contracts, Sponsorships, stadium concessions, etc.
• Valued at $356 Million
Marketing Research
• the process of defining a marketing problem and opportunity, systematically collecting and analyzing information, and recommending actions.
• Problems– Suppose your firm is developing a new product never before seen by
consum- ers. Will consumers really know whether they are likely to buy a product that they have never thought about before?
– Imagine if you, as a consumer, were asked about your personal hygiene habits. Even though you know the answers, will you reveal them? When personal or status questions are involved, will people give honest answers?
– Will consumers’ actual purchase behavior match their stated interest or inten- tions? Will they buy the same brand they say they will?
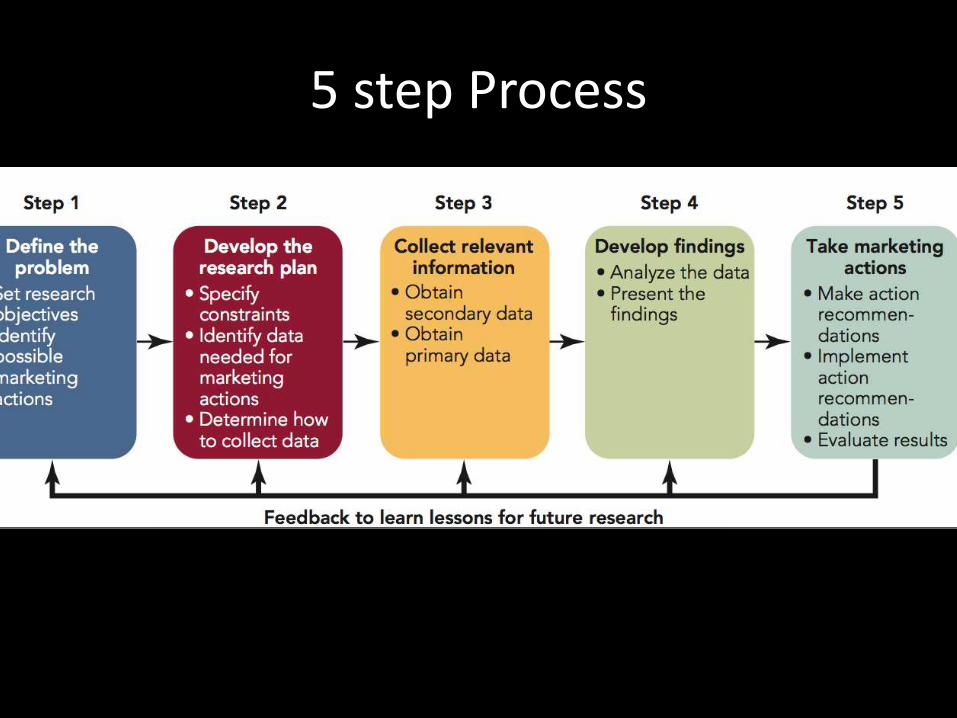
5 step Process
Problem
• Ticket sale revenues slowing down as team finds it hard to stay relevant
• Research Objective: what can we do about it?– Casual Research: What factors can we influence to
fix this (maybe bring up descriptive and explantory as well)
• Measure of Success: Increasing ticket revenues in which case the marketing action would be to use new marketing strategy
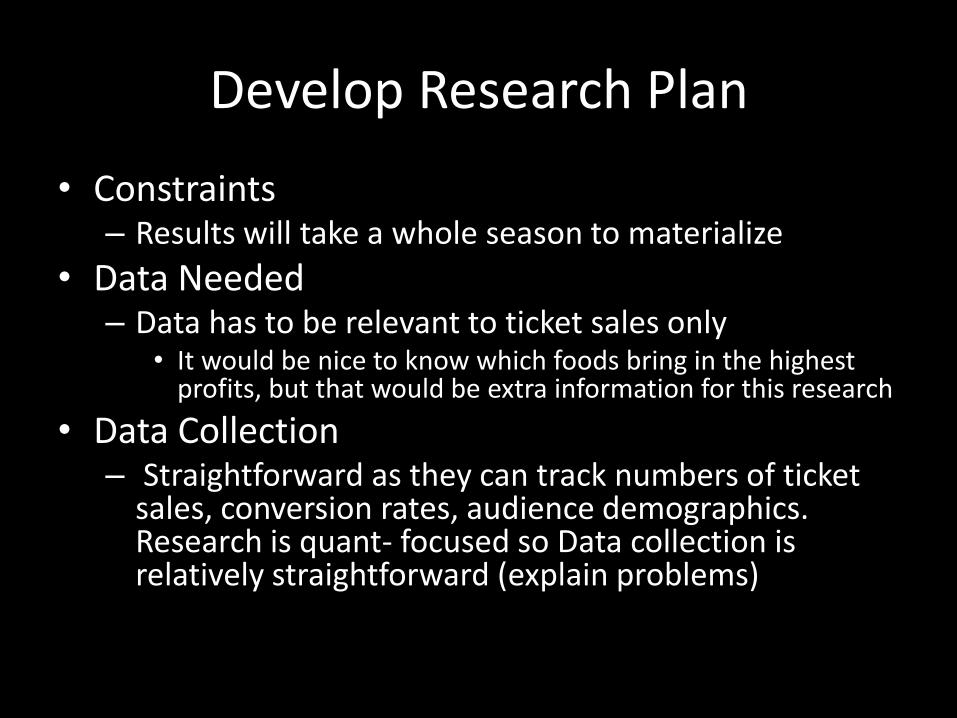
Develop Research Plan
• Constraints– Results will take a whole season to materialize
• Data Needed– Data has to be relevant to ticket sales only
• It would be nice to know which foods bring in the highest profits, but that would be extra information for this research
• Data Collection– Straightforward as they can track numbers of ticket
sales, conversion rates, audience demographics. Research is quant- focused so Data collection is relatively straightforward (explain problems)
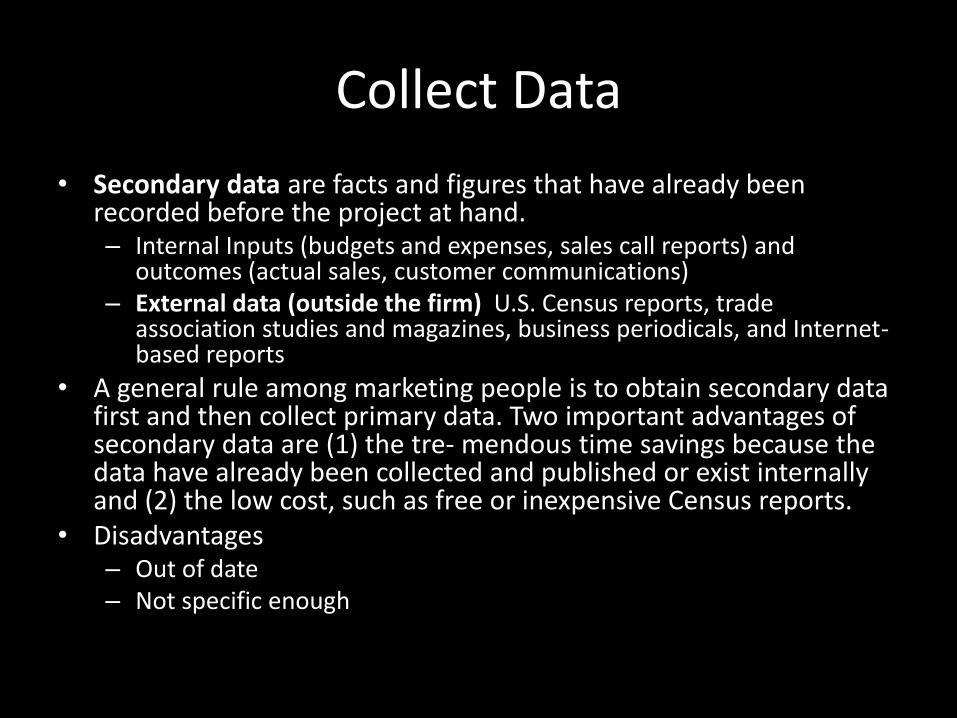
Collect Data
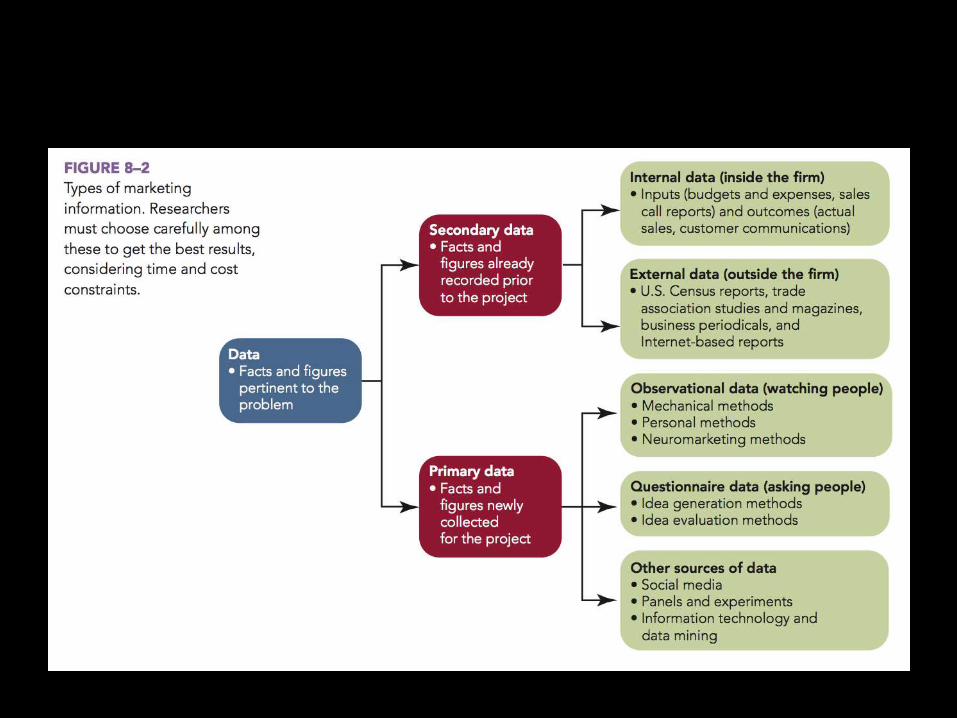
• Secondary data are facts and figures that have already been recorded before the project at hand. – Internal Inputs (budgets and expenses, sales call reports) and
outcomes (actual sales, customer communications) – External data (outside the firm) U.S. Census reports, trade
association studies and magazines, business periodicals, and Internet-based reports
• A general rule among marketing people is to obtain secondary data first and then collect primary data. Two important advantages of secondary data are (1) the tre- mendous time savings because the data have already been collected and published or exist internally and (2) the low cost, such as free or inexpensive Census reports.
• Disadvantages– Out of date– Not specific enough
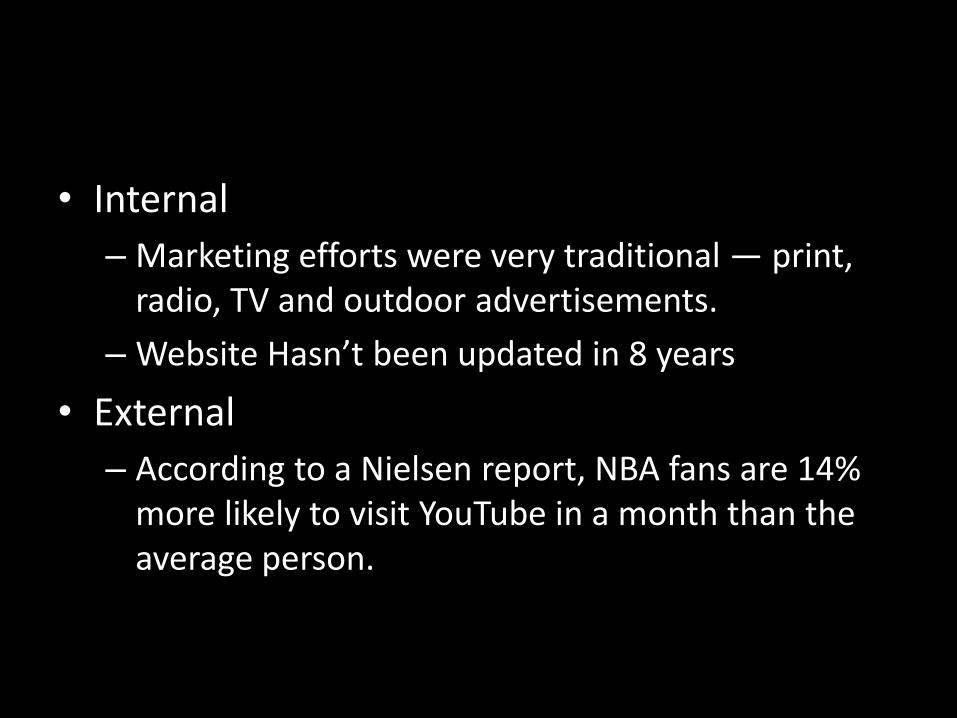
• Internal
– Marketing efforts were very traditional — print, radio, TV and outdoor advertisements.
– Website Hasn’t been updated in 8 years
• External
– According to a Nielsen report, NBA fans are 14% more likely to visit YouTube in a month than the average person.
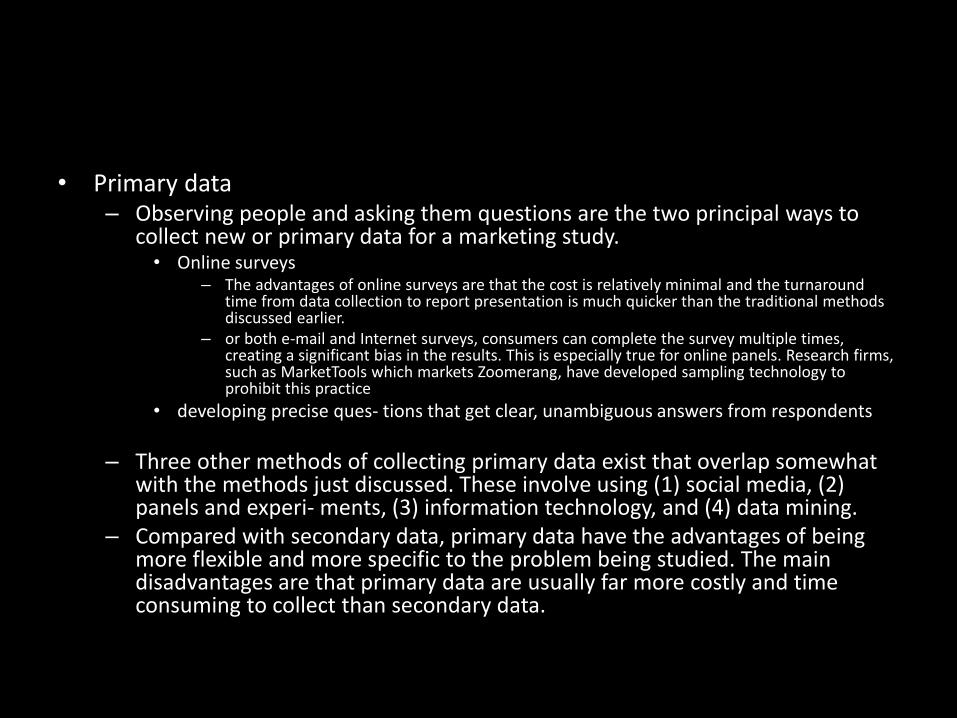
• Primary data– Observing people and asking them questions are the two principal ways to
collect new or primary data for a marketing study. • Online surveys
– The advantages of online surveys are that the cost is relatively minimal and the turnaround time from data collection to report presentation is much quicker than the traditional methods discussed earlier.
– or both e-mail and Internet surveys, consumers can complete the survey multiple times, creating a significant bias in the results. This is especially true for online panels. Research firms, such as MarketTools which markets Zoomerang, have developed sampling technology to prohibit this practice
• developing precise ques- tions that get clear, unambiguous answers from respondents
– Three other methods of collecting primary data exist that overlap somewhat with the methods just discussed. These involve using (1) social media, (2) panels and experi- ments, (3) information technology, and (4) data mining.
– Compared with secondary data, primary data have the advantages of being more flexible and more specific to the problem being studied. The main disadvantages are that primary data are usually far more costly and time consuming to collect than secondary data.
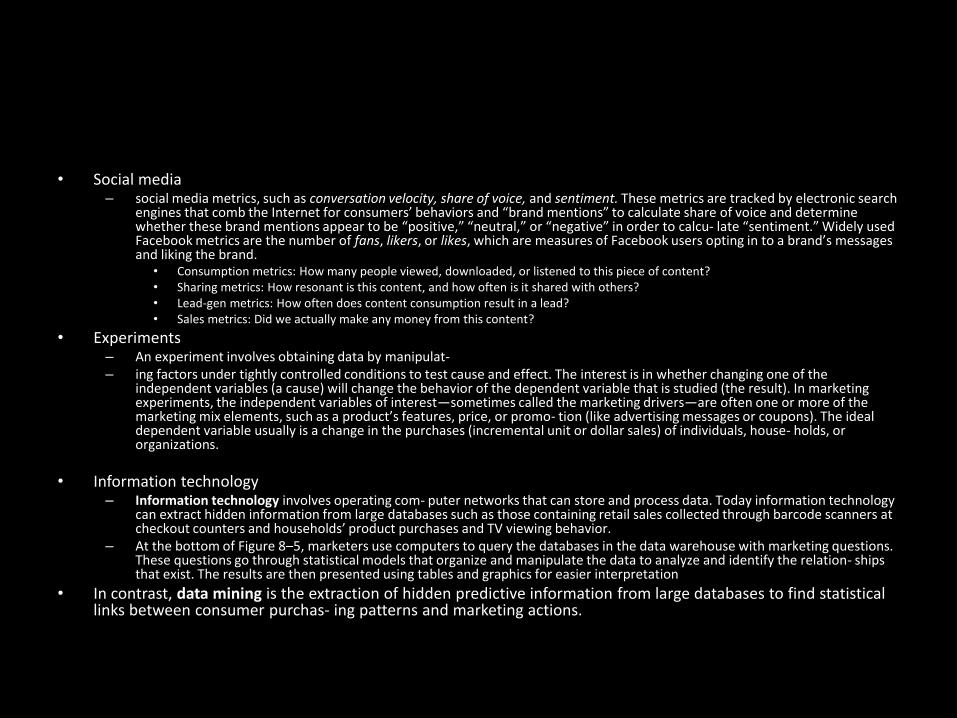
• Social media– social media metrics, such as conversation velocity, share of voice, and sentiment. These metrics are tracked by electronic search
engines that comb the Internet for consumers’ behaviors and “brand mentions” to calculate share of voice and determine whether these brand mentions appear to be “positive,” “neutral,” or “negative” in order to calcu- late “sentiment.” Widely used Facebook metrics are the number of fans, likers, or likes, which are measures of Facebook users opting in to a brand’s messages and liking the brand.
• Consumption metrics: How many people viewed, downloaded, or listened to this piece of content?• Sharing metrics: How resonant is this content, and how often is it shared with others?• Lead-gen metrics: How often does content consumption result in a lead?• Sales metrics: Did we actually make any money from this content?
• Experiments– An experiment involves obtaining data by manipulat-– ing factors under tightly controlled conditions to test cause and effect. The interest is in whether changing one of the
independent variables (a cause) will change the behavior of the dependent variable that is studied (the result). In marketingexperiments, the independent variables of interest—sometimes called the marketing drivers—are often one or more of the marketing mix elements, such as a product’s features, price, or promo- tion (like advertising messages or coupons). The ideal dependent variable usually is a change in the purchases (incremental unit or dollar sales) of individuals, house- holds, or organizations.
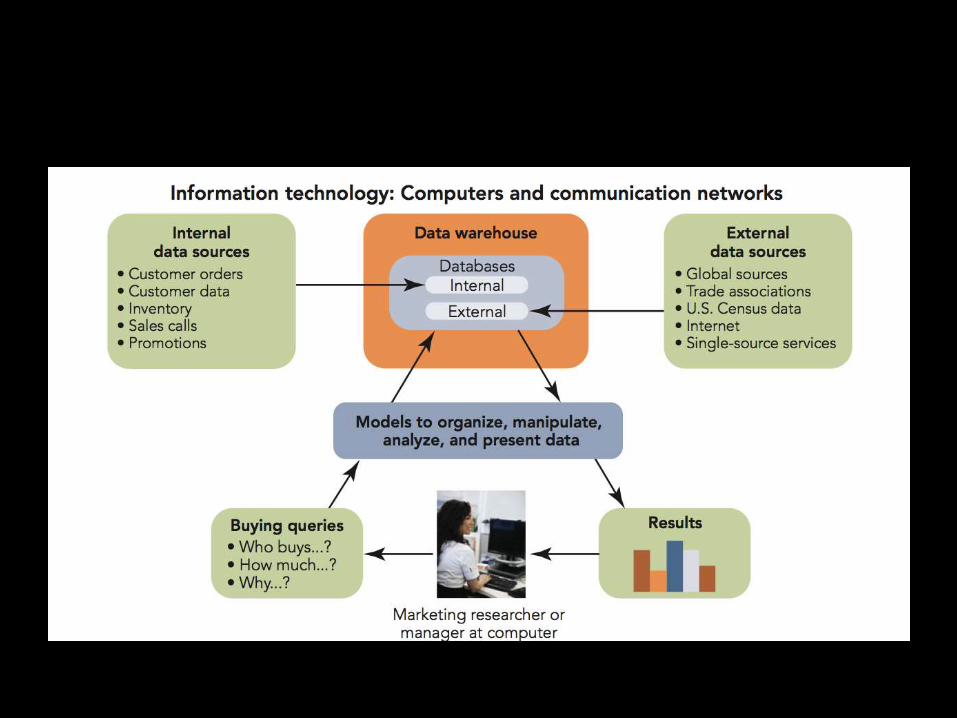
• Information technology– Information technology involves operating com- puter networks that can store and process data. Today information technology
can extract hidden information from large databases such as those containing retail sales collected through barcode scanners at checkout counters and households’ product purchases and TV viewing behavior.
– At the bottom of Figure 8–5, marketers use computers to query the databases in the data warehouse with marketing questions. These questions go through statistical models that organize and manipulate the data to analyze and identify the relation- ships that exist. The results are then presented using tables and graphics for easier interpretation
• In contrast, data mining is the extraction of hidden predictive information from large databases to find statistical links between consumer purchas- ing patterns and marketing actions.
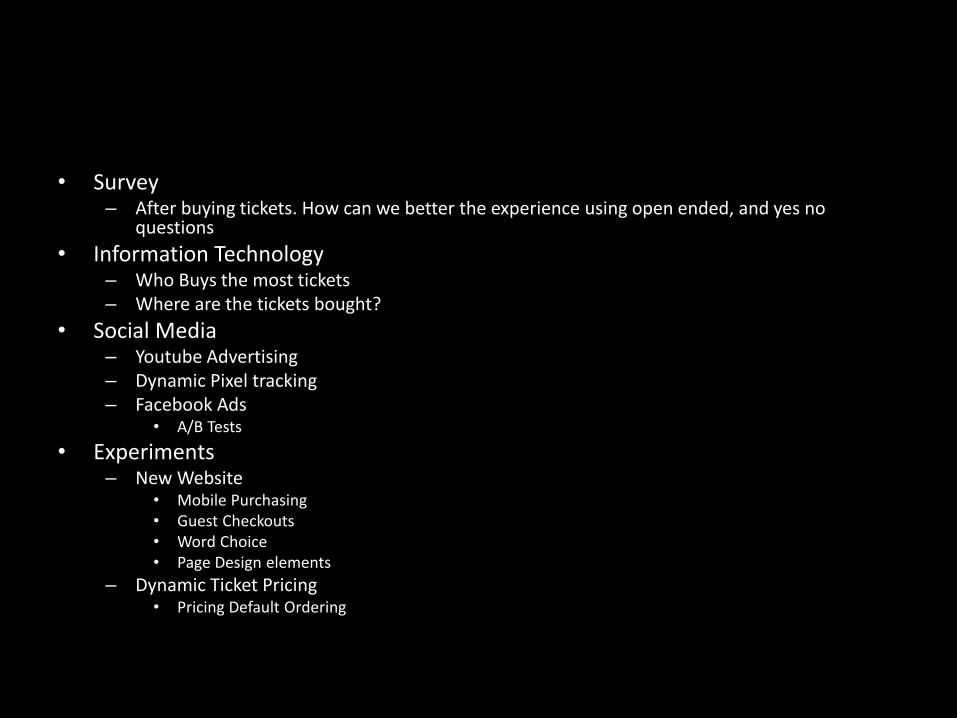
• Survey– After buying tickets. How can we better the experience using open ended, and yes no
questions
• Information Technology– Who Buys the most tickets– Where are the tickets bought?
• Social Media– Youtube Advertising– Dynamic Pixel tracking– Facebook Ads
• A/B Tests
• Experiments– New Website
• Mobile Purchasing• Guest Checkouts• Word Choice• Page Design elements
– Dynamic Ticket Pricing• Pricing Default Ordering
Develop Findings
• Analyze Data and Present Findings
– Findings should be clear and understandable from the way the data are pre- sented. Managers are responsible for actions. Often it means delivering the results in clear pictures and, if possible, in a single page.
• Surveys– No guest checkout– No mobile purchasing– Over nine pages in the purchase process
• Information tech – Our fan base is very passionate about the Trail Blazers,
but we were also an older demographic, 55-plus with our season ticket holders. Our package buyers, people who bought 10 to 15 games, were 50-plus. Even our individual game buyers were in the 40-plus range," he explained.
– 70% of tickets purchased were bought online
• Social Media
– less sales-driven messaging worked better for driving brand awareness and engagement.
• Experiments
– The team found that the lowest ticket prices next to the "Find Tickets" button led to 51% more revenue per visitor.
– Thursdays are slowest days
– 40% increase in new single-game ticket buyers
Take Marketing Actions
• someone has to identify the marketing actions, put them into effect, and monitor how the decisions turn out
• Evaluating results is a continuing way of life for effective marketing managers. – Evaluating the decision itself. – Evaluating the decision process used
• First round– untapped potential for marketing to younger fans as well as the potential to bring in a larger number of new
fans. However, he knew changing the existing marketing methods and channels was the only way to fill the seats with these new demographics. Hankins noted that at the time, 70% of tickets purchased were bought online, which begged the question: "Why weren't we spending more time marketing online?”
– Portland Trail Blazers did not have a centralized website on the NBA.com platform. Hankins saw that as an opportunity to consolidate all of the disconnected sites and get "everything under one roof." To allow for a more targeted purchase process, the team had to focus on improving what was already in place, while identifying essential changes that would need to be made. The old site had some good content but needed a user experience redesign.
– Better checkout process– Reduce fees– cater to each demographics' differing price range.
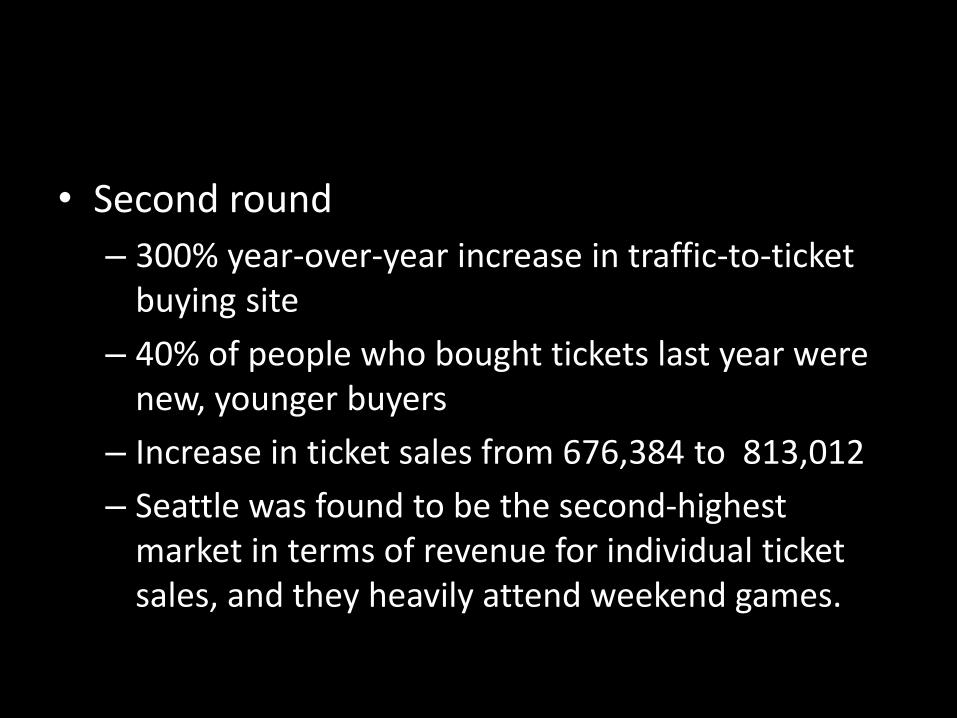
• Second round
– 300% year-over-year increase in traffic-to-ticket buying site
– 40% of people who bought tickets last year were new, younger buyers
– Increase in ticket sales from 676,384 to 813,012
– Seattle was found to be the second-highest market in terms of revenue for individual ticket sales, and they heavily attend weekend games.
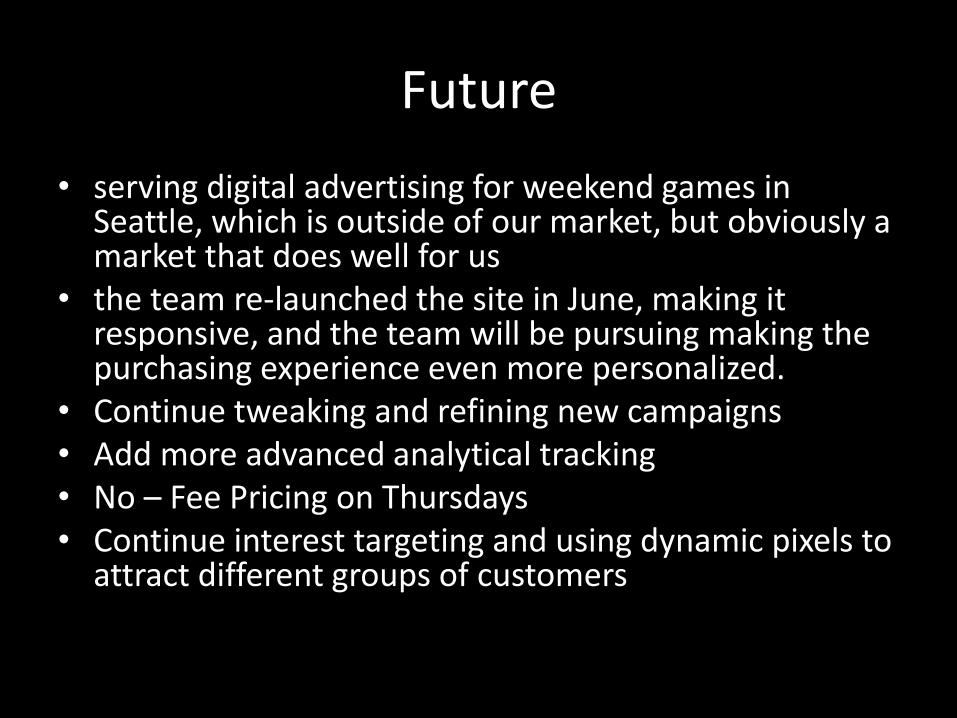
Future
• serving digital advertising for weekend games in Seattle, which is outside of our market, but obviously a market that does well for us
• the team re-launched the site in June, making it responsive, and the team will be pursuing making the purchasing experience even more personalized.
• Continue tweaking and refining new campaigns• Add more advanced analytical tracking• No – Fee Pricing on Thursdays• Continue interest targeting and using dynamic pixels to
attract different groups of customers
• http://www.marketingsherpa.com/article/case-study/personalization-dynamic-pricing-roi-increase
• http://nbahoopsonline.com/Articles/2007-08/NBArevinuesharing.html
• http://www.forbes.com/lists/2010/32/basketball-valuations-11_Portland-Trail-Blazers_324837.html