Protein synthesis rate is the predominant regulator of protein
12
Protein synthesis rate is the predominant regulator of protein expression during differentiation Anders R Kristensen, Joerg Gsponer and Leonard J Foster* Department of Biochemistry and Molecular Biology, Centre for High-Throughput Biology, University of British Columbia, Vancouver, British Columbia, Canada * Corresponding author. Department of Biochemistry and Molecular Biology, University of British Columbia, 2125 East Mall, Vancouver, British Columbia, Canada V6T 1Z4. Tel.: þ 1 604 822 8311; E-mail: [email protected] Received 24.4.13; accepted 21.8.13 External perturbations, by forcing cells to adapt to a new environment, often elicit large-scale changes in gene expression resulting in an altered proteome that improves the cell’s fitness in the new conditions. Steady-state levels of a proteome depend on transcription, the levels of transcripts, translation and protein degradation but system-level contribution that each of these processes make to the final protein expression change has yet to be explored. We therefore applied a systems biology approach to characterize the regulation of protein expression during cellular differentiation using quantitative proteomics. As a general rule, it seems that protein expression during cellular differentiation is largely controlled by changes in the relative synthesis rate, whereas the relative degradation rate of the majority of proteins stays constant. In these data, we also observe that the proteins in defined sub-structures of larger protein complexes tend to have highly correlated synthesis and degradation rates but that this does not necessarily extend to the holo-complex. Finally, we provide strong evidence that the generally poor correlation observed between transcript and protein levels can fully be explained once the protein synthesis and degradation rates are taken into account. Molecular Systems Biology 9: 689; published 17 September2013; doi:10.1038/msb.2013.47 Subject Categories: proteomics; differentiation & death Keywords: differentiation; macromolecular complexes; protein turnover; proteomics; systems biology Introduction Proteins are not stable constituents in the cell; instead, they are continuously synthesized and degraded, leading to different turnover rates for individual proteins. An analogy of this that represents any given protein is a bathtub with an open drain, where the amount of water in the tub corresponds to the amount of protein, the water coming in from the faucet represents the synthesis rate, the water exiting through the drain represents the degradation rate and the change in the water level with time represents the change in expression of the protein (Figure 1A). If the inflow and outflow rate are equal, then the level in the tub stays constant; however, the water is still exchanged (turned over) with a given velocity and similarly, proteins will also have different turnover rates. In order to become more fit for a new state brought on by external perturbation, the cell needs to change the expression levels of many proteins through the regulation of a number of cellular processes, including transcription, protein synthesis and protein degradation. The protein synthesis rate has been shown to be regulated by microRNAs (Selbach et al, 2008), mRNA change and different mRNA sequence features, whereas the protein degradation rate is predominantly regulated by the ubiquitin-proteasomal system (King et al, 1996; Larance et al, 2013). Proteins with fast turnover rates are generally characterized by having low abundance (Schwanha ¨usser et al, 2011; Boisvert et al, 2012), being intrinsically unstructured (Prakash et al, 2004; Gsponer et al, 2008), aggregation prone (De Baets et al, 2011; Gsponer and Babu, 2012) and involved in signal transduction and transcrip- tional activation (Legewie et al, 2008; Yen et al, 2008; Boisvert et al, 2012). The last decade has seen the discovery of a number of characteristics defining the control of absolute expression level in bacteria, mouse and human under steady-state conditions, revealing how the absolute expression level is mainly controlled by the protein synthesis rate, with the degradation rate having only a minimal contribution (Lu et al, 2006; Brockmann et al, 2007; Vogel et al, 2010; Maier et al, 2011; Schwanha ¨usser et al, 2011). Much less information is available regarding the contribution of these processes to the regulation of protein expression change when the proteome needs to be rearranged, such as in response to external perturbation. Interestingly, studies that have examined the contribution of mRNA changes to changes in protein abundance have generally found a relatively poor correlation between them (de Godoy et al, 2008; Fournier et al, 2010; Lee et al, 2011; Maier et al, 2011; Munoz et al, 2011). Protein metabolism has traditionally been investigated using isotope-labeled amino acids (Schoenheimer et al, Molecular Systems Biology 9; Article number 689; doi:10.1038/msb.2013.47 Citation: Molecular Systems Biology 9:689 www.molecularsystemsbiology.com & 2013 EMBO and Macmillan Publishers Limited Molecular Systems Biology 2013 1
Transcript of Protein synthesis rate is the predominant regulator of protein

Protein synthesis rate is the predominant regulatorof protein expression during differentiation
Anders R Kristensen, Joerg Gsponer and Leonard J Foster*
Department of Biochemistry and Molecular Biology, Centre for High-Throughput Biology, University of British Columbia, Vancouver, British Columbia, Canada* Corresponding author. Department of Biochemistry and Molecular Biology, University of British Columbia, 2125 East Mall, Vancouver, British Columbia,Canada V6T 1Z4. Tel.: þ 1 604 822 8311; E-mail: [email protected]
Received 24.4.13; accepted 21.8.13
External perturbations, by forcing cells to adapt to a new environment, often elicit large-scalechanges in gene expression resulting in an altered proteome that improves the cell’s fitness in thenew conditions. Steady-state levels of a proteome depend on transcription, the levels of transcripts,translation and protein degradation but system-level contribution that each of these processes maketo the final protein expression change has yet to be explored. We therefore applied a systems biologyapproach to characterize the regulation of protein expression during cellular differentiation usingquantitative proteomics. As a general rule, it seems that protein expression during cellulardifferentiation is largely controlled by changes in the relative synthesis rate, whereas the relativedegradation rate of the majority of proteins stays constant. In these data, we also observe that theproteins in defined sub-structures of larger protein complexes tend to have highly correlatedsynthesis and degradation rates but that this does not necessarily extend to the holo-complex.Finally, we provide strong evidence that the generally poor correlation observed between transcriptand protein levels can fully be explained once the protein synthesis and degradation rates are takeninto account.Molecular Systems Biology 9: 689; published 17 September 2013; doi:10.1038/msb.2013.47Subject Categories: proteomics; differentiation & deathKeywords: differentiation; macromolecular complexes; protein turnover; proteomics; systems biology
Introduction
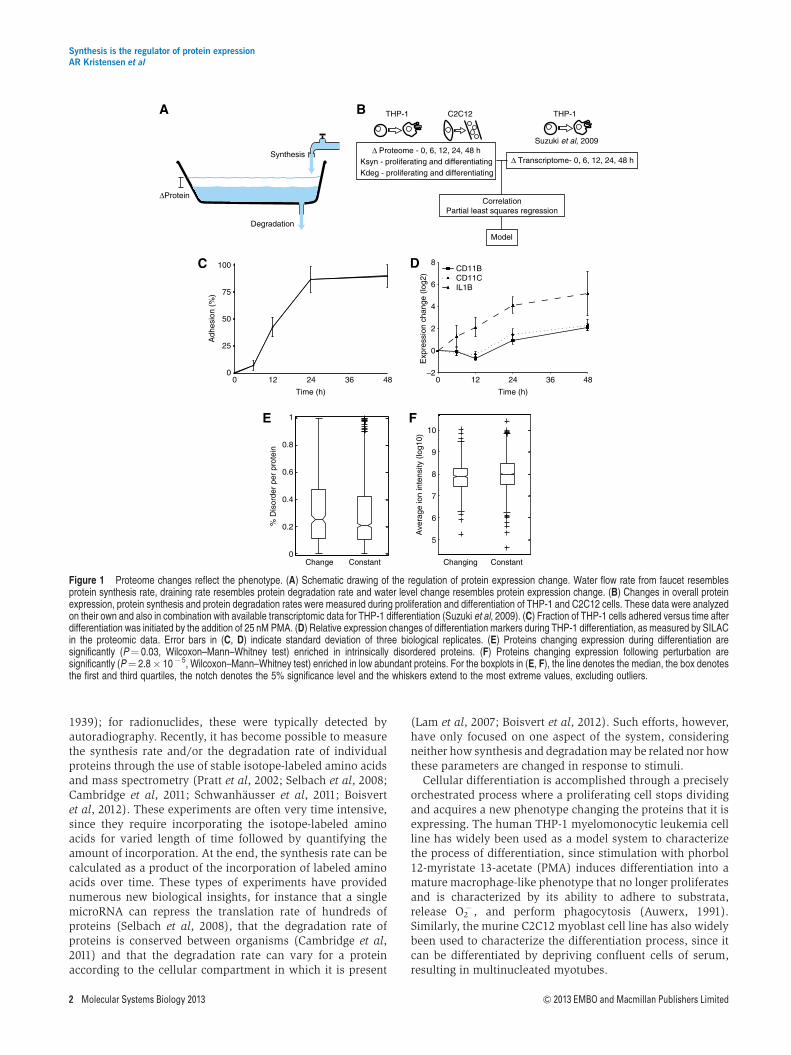
Proteins are not stable constituents in the cell; instead, they arecontinuously synthesized and degraded, leading to differentturnover rates for individual proteins. An analogy of this thatrepresents any given protein is a bathtub with an open drain,where the amount of water in the tub corresponds to theamount of protein, the water coming in from the faucetrepresents the synthesis rate, the water exiting through thedrain represents the degradation rate and the change in thewater level with time represents the change in expression ofthe protein (Figure 1A). If the inflow and outflow rate areequal, then the level in the tub stays constant; however, thewater is still exchanged (turned over) with a given velocity andsimilarly, proteins will also have different turnover rates. Inorder to become more fit for a new state brought on by externalperturbation, the cell needs to change the expression levels ofmany proteins through the regulation of a number of cellularprocesses, including transcription, protein synthesis andprotein degradation. The protein synthesis rate has beenshown to be regulated by microRNAs (Selbach et al, 2008),mRNA change and different mRNA sequence features,whereas the protein degradation rate is predominantlyregulated by the ubiquitin-proteasomal system (King et al,1996; Larance et al, 2013). Proteins with fast turnover rates
are generally characterized by having low abundance(Schwanhausser et al, 2011; Boisvert et al, 2012), beingintrinsically unstructured (Prakash et al, 2004; Gsponer et al,2008), aggregation prone (De Baets et al, 2011; Gsponer andBabu, 2012) and involved in signal transduction and transcrip-tional activation (Legewie et al, 2008; Yen et al, 2008; Boisvertet al, 2012).
The last decade has seen the discovery of a number ofcharacteristics defining the control of absolute expression levelin bacteria, mouse and human under steady-state conditions,revealing how the absolute expression level is mainlycontrolled by the protein synthesis rate, with the degradationrate having only a minimal contribution (Lu et al, 2006;Brockmann et al, 2007; Vogel et al, 2010; Maier et al, 2011;Schwanhausser et al, 2011). Much less information is availableregarding the contribution of these processes to the regulationof protein expression change when the proteome needs to berearranged, such as in response to external perturbation.Interestingly, studies that have examined the contribution ofmRNA changes to changes in protein abundance havegenerally found a relatively poor correlation between them(de Godoy et al, 2008; Fournier et al, 2010; Lee et al, 2011; Maieret al, 2011; Munoz et al, 2011).
Protein metabolism has traditionally been investigatedusing isotope-labeled amino acids (Schoenheimer et al,
Molecular Systems Biology 9; Article number 689; doi:10.1038/msb.2013.47Citation: Molecular Systems Biology 9:689www.molecularsystemsbiology.com
& 2013 EMBO and Macmillan Publishers Limited Molecular Systems Biology 2013 1
1939); for radionuclides, these were typically detected byautoradiography. Recently, it has become possible to measurethe synthesis rate and/or the degradation rate of individualproteins through the use of stable isotope-labeled amino acidsand mass spectrometry (Pratt et al, 2002; Selbach et al, 2008;Cambridge et al, 2011; Schwanhausser et al, 2011; Boisvertet al, 2012). These experiments are often very time intensive,since they require incorporating the isotope-labeled aminoacids for varied length of time followed by quantifying theamount of incorporation. At the end, the synthesis rate can becalculated as a product of the incorporation of labeled aminoacids over time. These types of experiments have providednumerous new biological insights, for instance that a singlemicroRNA can repress the translation rate of hundreds ofproteins (Selbach et al, 2008), that the degradation rate ofproteins is conserved between organisms (Cambridge et al,2011) and that the degradation rate can vary for a proteinaccording to the cellular compartment in which it is present
(Lam et al, 2007; Boisvert et al, 2012). Such efforts, however,have only focused on one aspect of the system, consideringneither how synthesis and degradation may be related nor howthese parameters are changed in response to stimuli.
Cellular differentiation is accomplished through a preciselyorchestrated process where a proliferating cell stops dividingand acquires a new phenotype changing the proteins that it isexpressing. The human THP-1 myelomonocytic leukemia cellline has widely been used as a model system to characterizethe process of differentiation, since stimulation with phorbol12-myristate 13-acetate (PMA) induces differentiation into amature macrophage-like phenotype that no longer proliferatesand is characterized by its ability to adhere to substrata,release O2
� , and perform phagocytosis (Auwerx, 1991).Similarly, the murine C2C12 myoblast cell line has also widelybeen used to characterize the differentiation process, since itcan be differentiated by depriving confluent cells of serum,resulting in multinucleated myotubes.
0483624120
Adh
esio
n (%
)
–2
0
2
4
6
8
0 12 24 36 48
Exp
ress
ion
chan
ge (
log2
)
Time (h)
IL1BCD11CCD11B
0
1
% D
isor
der
per
prot
ein
5
6
7
8
9
Ave
rage
ion
inte
nsity
(lo
g10)
Δ Proteome - 0, 6, 12, 24, 48 hKsyn - proliferating and differentiatingKdeg - proliferating and differentiating
Δ Transcriptome- 0, 6, 12, 24, 48 h
CorrelationPartial least squares regression
Model
THP-1 C2C12 THP-1
Degradation
Synthesis
ΔProtein
Time (h)
100
25
50
75
0.8
0.6
0.4
0.2
Change Constant Constant
10
Changing
Suzuki et al, 2009
Figure 1 Proteome changes reflect the phenotype. (A) Schematic drawing of the regulation of protein expression change. Water flow rate from faucet resemblesprotein synthesis rate, draining rate resembles protein degradation rate and water level change resembles protein expression change. (B) Changes in overall proteinexpression, protein synthesis and protein degradation rates were measured during proliferation and differentiation of THP-1 and C2C12 cells. These data were analyzedon their own and also in combination with available transcriptomic data for THP-1 differentiation (Suzuki et al, 2009). (C) Fraction of THP-1 cells adhered versus time afterdifferentiation was initiated by the addition of 25 nM PMA. (D) Relative expression changes of differentiation markers during THP-1 differentiation, as measured by SILACin the proteomic data. Error bars in (C, D) indicate standard deviation of three biological replicates. (E) Proteins changing expression during differentiation aresignificantly (P¼ 0.03, Wilcoxon–Mann–Whitney test) enriched in intrinsically disordered proteins. (F) Proteins changing expression following perturbation aresignificantly (P¼ 2.8� 10� 5, Wilcoxon–Mann–Whitney test) enriched in low abundant proteins. For the boxplots in (E, F), the line denotes the median, the box denotesthe first and third quartiles, the notch denotes the 5% significance level and the whiskers extend to the most extreme values, excluding outliers.
Synthesis is the regulator of protein expressionAR Kristensen et al
2 Molecular Systems Biology 2013 & 2013 EMBO and Macmillan Publishers Limited
Here, our aim has been to characterize the various factorsaffecting regulation of protein expression change duringcellular differentiation by measuring the synthesis anddegradation rates of proteins in proliferating and differentiatingTHP-1 and C2C12 cells using quantitative proteomics. Bycomparing these parameters with mRNA and protein expres-sion change at multiple time points, we are able to construct apredictive model that highlights the contribution of differentcellular processes to the regulation of the expression change ofindividual proteins during differentiation (Figure 1B).
Results
Quantitative proteomics reveals mechanismsbehind phenotypic changes
The primary system used here was the human THP-1myelomonocytic leukemia cell line that can be differentiatedfrom monocytes into macrophage-like cells by stimulationwith 25 nM PMA. We used stable isotope labeling with aminoacids in cell culture (SILAC) (Ong et al, 2002), with two triplexSILAC experiments to cover five time points of differentiationin THP-1 cells, to mass encode the cells. The cells werestimulated with PMA for 0, 6, 12, 24 and 48 h, which causesseveral morphological changes, including adherence(Figure 1C); biological triplicates were performed for allexperiments. Whole-cell lysates from the different conditionswere combined as appropriate and the samples were split intotwo, with the two halves being pre-fractionated, either at theprotein level by SDS–PAGE or at the peptide level by isoelectricfocusing (IEF), before analysis on an LTQ-OrbitrapXL massspectrometer. A total of 4977 proteins could be identified fromthe tandem mass spectra at a false discovery rate (FDR) below1%. Among the identified proteins were very well-knownmarkers for monocyte to macrophage differentiation such asCD11B, CD11C and IL1B (Figure 1D), demonstrating that thecells were differentiating as expected and that the method issensitive enough to detect relevant changes.
To identify proteins with significant differential expression,we applied a strict statistical test (ANOVA Po0.05, S0¼1)among the five time points and found 457 proteins withsignificant changes in expression during differentiation, whichcould serve as potentially new markers for the differentiationprocess (see Supplementary Table S1 for complete list).Functional enrichment analysis on the increasing or decreasingproteins revealed the majority of the originally describedphenotypic changes associated with differentiation, such ashalting of the cell cycle, increased adhesion and increasedlysosomal capacity (Table I). In addition, those proteins alteredby differentiation tended to be more intrinsically disordered(P¼ 0.03, Wilcoxon–Mann–Whitney test) (Figure 1E) andwere generally lower in abundance (P¼ 2.8�10� 5,Wilcoxon–Mann–Whitney test) than the unregulated proteins(Figure 1F).
Finally, we decided to complement these data with acompletely unrelated system of differentiation so as to allowus to make more general statements about the regulation ofprotein expression; to this end we performed a similar studyusing mouse C2C12 cells that were induced to differentiatefrom myoblasts, by deprivation of serum at confluence, to
myotubes for 48 h (Supplementary Table S2). Even though themyoblasts-to-myotubes and monocytes-to-macrophages sys-tems are quite distinct and from different organisms, many ofthe same mechanisms appear to be employed to achieve therequired changes (Supplementary Figure S1).
Measuring relative synthesis and degradationrates
To gain insight into the factors that regulate protein expressionchange, we decided to measure the synthesis and degradationrates of proteins in both proliferating and differentiating THP-1and C2C12 cells, which hereby should allow us to deduce someof the general regulatory mechanisms at work. To increase thethroughput of this study, we decided to measure the relativesynthesis and degradation rates of the individual proteins byslightly modifying a previously described approach (Boisvertet al, 2012). We first completely incorporated two cellpopulations using light and medium amino acids. Then, byswitching the medium population to heavy amino acids at thesame time as the induction of differentiation, all newlysynthesized proteins are made with heavy forms of aminoacids and all proteins being degraded can be monitored as adecrease in medium amino acids, with the light-labeledpopulation acting as an internal control against which themedium and heavy can be compared. These measurementswere made in proliferating myoblasts and monocytes, as wellas during the differentiation of each cell type, thereby allowingus to deduce the changes in the synthesis and degradationrates of the individual proteins between proliferating anddifferentiating cells. Biological triplicates of all the aboveexperiments resulted in the identification of 5721 proteinswith an FDR of below 1% (Supplementary Table S3). Wesubsequently calculated the relative degradation andsynthesis rates of the individual proteins by Z-transformingthe medium/light and heavy/light ratios of the proteins,respectively (see Supplementary materials for details).
With these data in hand, we first asked if the approach ofidentifying relative degradation and synthesis rates couldidentify some of the turnover characteristics previouslydescribed in studies that had measured absolute proteinturnover. We therefore defined unstable proteins as the 20% ofproteins with the fastest degradation rate and stable proteinsas the 20% of proteins with the slowest degradation rate inboth murine and human cells. In this way, we were able toconfirm what has been reported previously that unstableproteins are less abundant (P¼ 1.7�10� 30, Wilcoxon–Mann–Whitney test), more intrinsic disordered (P¼ 1.3�10� 27,
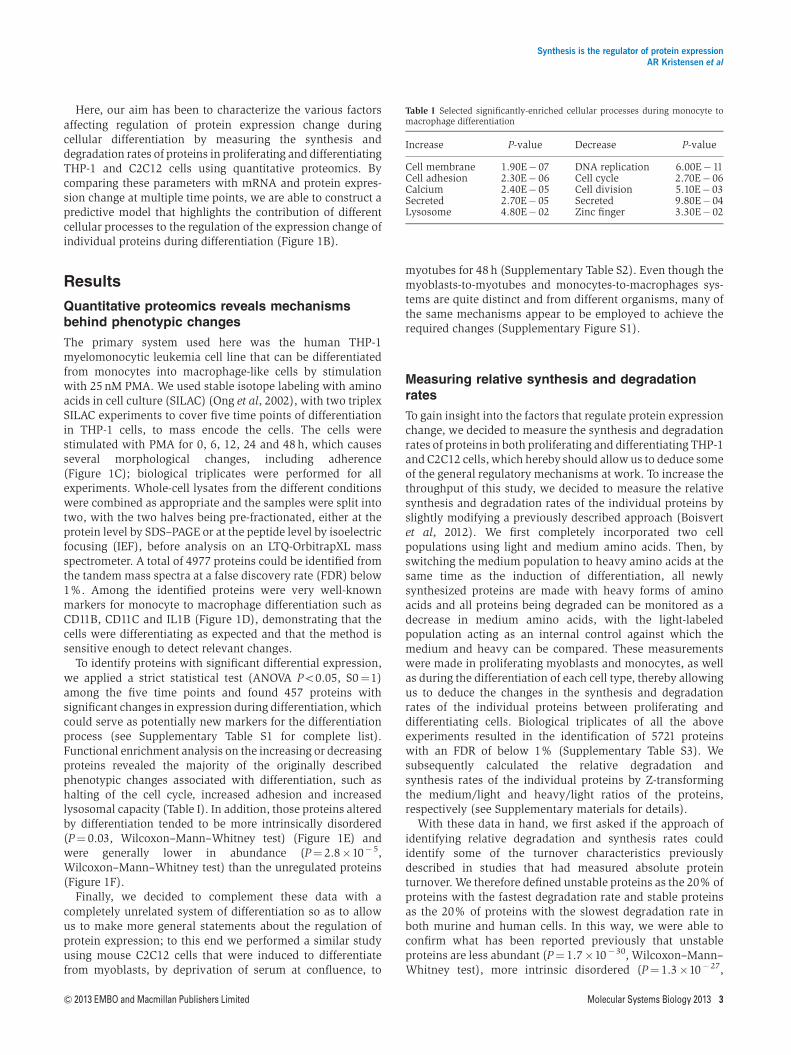
Table I Selected significantly-enriched cellular processes during monocyte tomacrophage differentiation
Increase P-value Decrease P-value
Cell membrane 1.90E� 07 DNA replication 6.00E� 11Cell adhesion 2.30E� 06 Cell cycle 2.70E� 06Calcium 2.40E� 05 Cell division 5.10E� 03Secreted 2.70E� 05 Secreted 9.80E� 04Lysosome 4.80E� 02 Zinc finger 3.30E� 02
Synthesis is the regulator of protein expressionAR Kristensen et al
& 2013 EMBO and Macmillan Publishers Limited Molecular Systems Biology 2013 3

Wilcoxon–Mann–Whitney test) and contain more KEN-boxmotifs (P¼ 0.02, Fisher’s exact test) than stable proteins.
Previous observations have shown how proteins involved indistinct biological processes can display different stabilities(Cambridge et al, 2011; Boisvert et al, 2012) so, to test this inour own data we performed two-dimensional enrichmentanalysis between the proliferating C2C12 and THP-1 cells (Coxand Mann, 2012). Briefly, this tests for whether cellularprocesses are displaying consistent behavior in any of the datadimensions versus the rest of the proteins in the data set. Thisrevealed that protein stability is very consistent regulationbetween the two cell lines, since the majority of biologicalprocesses are located on the diagonal (Figure 2).
Turnover rates of macromolecular sub-complexes
Having established the veracity of the data from the parallelmeasurement of synthesis and degradation rates under bothproliferating and differentiating conditions in two different celllines, we next asked whether there were any characteristicscommon to the proteins that display similar synthesis anddegradation rates. As a measurement of similarity of thesynthesis and degradation rates of the proteins, we calculatedthe Euclidian distances between proteins involved in the samebiological process in synthesis-degradation space and deter-mined whether this distance was significantly shorter forparticular groups of proteins than random chance woulddictate. Two proteins with similar synthesis and degradationrates should therefore have short Euclidian distances, whereasprotein with very different synthesis and degradation rateswill be farther apart. By measuring the distances betweenproteins involved in the same biological process of bothproliferating and differentiating THP-1 and C2C12 cells, it
became especially clear that proteins participating in macro-molecular complexes had very similar synthesis and degrada-tion rates (Supplementary Table S4). We could investigate, in asimilar way, whether any members of the macromolecularcomplex displayed different synthesis/degradation from therest of the members of the complex. Interestingly, we noticedthat 30±1% of the macromolecular complexes had memberswith different synthesis and/or degradation rates fromthe other members of the same complex (SupplementaryTable S4). An interesting example is RPN10 (aka MCB1 orPSMD4) that displayed different synthesis and degradationfrom the rest of the proteasome regulatory particle (Figure 3A),whereas all the members of the proteasome core complexdisplayed similar synthesis and degradation rates.
To investigate the synthesis and degradation rates forproteins that participate in macromolecular complexes inmore detail, we decided to directly measure synthesis anddegradation within individual complexes using proteincorrelation profiling-SILAC (PCP-SILAC) and size-exclusionchromatography (SEC) (Kristensen et al, 2012). This wasaccomplished by first completely incorporating two cellpopulations using light and medium amino acids andsubsequently switching the medium population to heavyamino acids and allowing the cells to proliferate for 24 h.However, this time the cells were lysed without the use ofdetergents and the resulting lysate was separated by SEC into48 fractions, before the proteins in each individual fractionwere digested to peptides and analyzed by LC-MS/MS. Hereby,the individual sub-complexes will be separated out by SEC andelution profiles of the individual proteins can be constructed,using label-free quantitation (Cox and Mann, 2008), from theion intensities of the light form of each peptide, whereas therelative synthesis and degradation can be determined bythe H/L and M/L ratios, respectively (see Supplementarymaterials for details). By this approach, we were able toidentify 2423 proteins in 48 SEC fractions, from which 31% arerecorded to participate in macromolecular complexes based onthe CORUM database (Supplementary Table S5).
The discovery approach to investigate the synthesis anddegradation used here allowed us, for the first time, to unravelwhether any relationship exists between protein complex sizeand the degradation and synthesis rates of the components.While it seems reasonable to expect that the proteins found inlarger complexes might be more stable than those in smallercomplexes since more energy would be required to replace alarge complex than a small one but, surprisingly, there appearsto be no correlation between complex size and componentprotein stability (Supplementary Figure S2).
Next, we validated whether the proteins of the proteasomecore subunit also displayed similar synthesis and degradationrates at the sub-complex level. Plotting the elution profileand synthesis and degradation rates of the alpha- andbeta-subunits revealed similar synthesis and degradationrates when these co-elute with regulatory subunit, suggestingthat the 26S proteasome is degraded as an intact complex(Figure 3B and C). Interestingly, we noticed that aroundfraction 29 the alpha-subunits displayed an additional peak,which co-eluted with the peaks for the proteasome assemblingchaperones (PAC1–PAC4) (Supplementary Figure S3) and ischaracterized by only containing newly synthesized proteins,
–1.0 0.0 1.0–1.0
0.0
1.0
Relative degradation rate THP-1 cells score
Rel
ativ
e de
grad
atio
n ra
te C
2C12
cel
ls s
core
Cell cycleUbl conjugation pathway
Nucleosome core
Ribosomal protein
SecretedMitochondrion
Zinc finger
Figure 2 Relative protein degradation rates capture known protein turnovercharacteristics. Degradation rates for functional classes of proteins are largelysimilar (Po0.05) between THP-1 and C2C12, based on the 2D enrichmentanalysis (Cox and Mann, 2012).
Synthesis is the regulator of protein expressionAR Kristensen et al
4 Molecular Systems Biology 2013 & 2013 EMBO and Macmillan Publishers Limited

suggesting that we are able for the first time to capture that theproteasome alpha-ring gets de novo assembled from onlynewly synthesized proteins.
In our initial measurements of synthesis and degradationrates, we observed that the ubiquitin receptor RPN10 ofthe proteasome regulatory particle is synthesized anddegraded faster than the rest of the proteins of the regulatorysubunit. This could be a result of RPN10 participating inadditional complexes that are regulated differently fromthe proteasome and thus result in distinct average rates forRPN10 or because RPN10 is simply turned over differentlyfrom all the other components of the proteasome. Toinvestigate this in more detail, we decided to compare theelution profile and turnover rates of RPN10 with the restof the proteins within the regulatory particle, revealing thatthe elution profile of RPN10 is very similar to the rest ofthe regulatory particle, yet its turnover rate even in thatregion of the size-exclusion chromatogram was still signi-ficantly faster than the rest of the proteins of the regulatoryparticles (P¼ 2.8�10� 8, Wilcoxon–Mann–Whitney test)(Figure 3C). Intriguingly, we noticed that the other ubiquitinreceptor of the proteasome RPN13 (Adrm1) displayed simi-larly high turnover rates while bound to the regulatory particle(P¼ 3.7�10� 8, Wilcoxon–Mann–Whitney test), suggestingfor the first time that both the ubiquitin receptors RPN10 andRPN13 can exchange with their free forms and that thisapproach provides a completely novel ability to probe suchdetails.
Temporal correlation between the transcriptomeand the proteome
Many studies have found a poor correlation between changesin mRNA and protein levels in response to perturbation
(de Godoy et al, 2008; Fournier et al, 2010) but the CentralDogma still suggests that there must be a link. We thereforedecided to correlate our data sets of protein expression changeand the relative synthesis rate data with a recently publishedtranscriptomic study, which also studied differentiation ofTHP-1 cells using similar stimuli and time points as ourexperiments (Suzuki et al, 2009). First, we investigated howprotein synthesis correlated with the mRNA and proteinexpression changes, both of which revealed moderate correla-tion of 0.52±0.07 and 0.59±0.07, respectively (Figure 4A).The lack of a perfect correlation highlights how proteinsynthesis is regulated by a number of post-transcriptionalprocesses, and that the levels of proteins within a cell areregulated by processes beyond just protein synthesis.
Few studies have investigated how the correlation betweenexpression change of mRNA and proteins changes over timein response to perturbation, and the correlation has only beeninvestigated after relatively short-term perturbations (Fournieret al, 2010; Lee et al, 2011). When we examined the correlationof mRNA and proteins expression change at each of the fivetime points, we observed that the relationship nearly reached asteady state after 24 h differentiation, suggesting a lag betweenmRNA and protein expression changes and/or that extensivepost-transcriptional regulation is taking place during earlydifferentiation (Figure 4B). Interestingly, however, proteinsand mRNAs that were being up- or down-regulated duringdifferentiation were much more highly correlated, with o6%of the significantly changing genes showing anti-correlation at48 h differentiation, suggesting that post-transcriptional reg-ulation such as miRNA and 30 and 50 UTRs is mainly just finetuning the levels of these proteins after 48 h stimulation.Similarly, 2D enrichment analysis revealed that a generallyconsistent regulation of the cellular processes in both thetranscriptome and the proteome of differentiating THP-1 cells(Figure 4C).
1.5
1.0
0.5
0.0
0.0
RPN10
RPN13
Reg. particle
0.5 1.0 1.5
0.2
0.00 10 20 30
0 10 20 30
0 10Fraction no. Fraction no.
20 30 0 10 20 30
0 10 20 30
0 10 20 30
0.4
0.4
0.2
0.0
–0.2
–1.0
0.0
1.0
2.0
0.6Psma
PsmbRPN13RPN10
Reg. particle1.0
0.8
0.6
0.4
0.4
0.2
0.2
0.0
0.0
–0.2
–0.4–0.8
0.00.40.8
–0.5
–0.5–1.0
–1.0
Rel
ativ
e sy
nthe
sis
rate
Rel
ativ
e in
tens
ity
Rel
ativ
e in
tens
ity
Syn
thes
is r
ate
log2
(H
/L)
Syn
thes
is r
ate
log2
(H
/L)
Deg
rada
tion
rate
– lo
g2 (
M/L
)
Deg
rada
tion
rate
– lo
g2 (
M/L
)
Relative degradation rate
Figure 3 Synthesis and degradation rates are consistent among members of protein complexes. (A) The relative synthesis and degradation rates of the components ofthe proteasome regulatory particle, which are generally tightly clustered in a scatterplot of synthesis versus degradation rates. (B) Top, the median size-exclusionchromatograms of the alpha- and beta-subunits of the proteasome core particle. Middle, the synthesis rate of the alpha- and beta-subunits of the proteasome coreparticle. Bottom, the degradation rate of the alpha- and beta-subunits of the proteasome core particle. (C) Top, the median size-exclusion chromatogram of the regulatoryparticle of the proteasome, RPN10 and RPN13. Middle, the synthesis rate of regulatory particle of the proteasome, RPN10 and RPN13. Bottom, the relative degradationrates of the regulatory particle of the proteasome, RPN10 and RPN13.
Synthesis is the regulator of protein expressionAR Kristensen et al
& 2013 EMBO and Macmillan Publishers Limited Molecular Systems Biology 2013 5

Messenger RNA expression changes have widely been usedto predict protein–protein interactions since proteins withsimilar mRNA expression change are more likely to interactthan a random selection of proteins (Jansen et al, 2002). Sincewe have mRNA and protein expression change recorded in thesame system at similar time points, we explored whatparameters are most predictive for interactivity. We focusedonly on those proteins annotated as components of complexesin the CORUM database, as this is the most widely acceptedgold-standard interaction set. A comparison of how closely themRNA versus protein expression change tracked for membersof CORUM complexes reveals that protein expression changesare vastly more predictive for interactions than are mRNAchange (P¼ 7.9�10�14, Wilcoxon–Mann–Whitney test)(Figure 4D). This suggests a novel concept: that if proteinexpression changes can be measured, then they could be used
to make much more accurate predictions (e.g., of protein–protein interactions) than what mRNA expression changesalone would yield.
Modeling the control of protein expression
A protein’s expression change is regulated by a number ofprocesses, such as RNA transcription, protein synthesisand protein degradation but little information exists aboutthe contribution of each or the combination of any of theseprocesses in the control of protein expression change. If onelooks first at the effect of synthesis and degradation rates onoverall protein expression, it is obvious that whether thesynthesis and degradation rates of a protein are equal, thenthe expression of the protein is at a steady state, whereasthe net protein expression change is the result of therelationship between the synthesis and degradation rates(Figure 5A and B).
We then applied partial least square regression to our owndata from differentiating THP-1 cells and similar transcrip-tional data from Suzuki et al (2009) to examine for the firsttime the contributions of various factors across the board of allproteins to the ultimate changes in protein expression. Thisrevealed that after 48 h of THP-1 differentiation, the transcrip-tional change (49±4%) was the single best predictor, followedby protein synthesis rate (46±7%) and degradation rate(15±3%), for the experimentally confirmed protein expres-sion change. Combining all three parameters gives a veryrespectable predictive power of 69±7% for any givenreplicate and this could be increased to 74% by simply takingthe mean of the parameters from the biological replicates(Supplementary Figure S4). A breakdown of the contributionsof the individual parameters in this model using onecomponent is as follows: synthesis rate—41%, transcriptionalchange—45% and degradation rate—14% (Figure 5C;Supplementary Table S6), which indicates that the synthesisrate contributes more than the degradation rate to the variancenot explained by the transcription change. Similarly, weobserved that during C2C12 differentiation the synthesis ratepredicted the protein expression change better than thedegradation rate of the proteins (Supplementary Figure S5).Taken together, this clearly shows that both the synthesis anddegradation rates of a protein are important processes inregulating the protein’s expression change. The effect of post-transcriptional regulatory mechanisms such as microRNAafter 48 h differentiation can be monitored by comparing theprediction of protein expression changes from only transcrip-tional changes or from transcriptional changes plus thesynthesis rates. Interestingly, we observe that post-transcrip-tional regulation seems to fine tune the precise control ofproteins expression (Supplementary Figure S6), since manyproteins displayed rather small changes, which is in excellentagreement with proteomics studies measuring the effects ofmiRNA (Baek et al, 2008; Selbach et al, 2008).
To investigate whether proteins with increasing or decreas-ing expression changes were regulated similarly, we per-formed partial least square regression on the proteinssignificantly increasing or decreasing during differentiation.This revealed that the transcription change and synthesis rate
1
Protein
0
1
Cor
rela
tion
0
0.2
0.4
0.6
0.8
1.0
0 6 12 24 48
Cor
rela
tion
Cor
rela
tion
Time (h)
–1 0 1–1
0
1
Protein expression change score
mR
NA
exp
ress
ion
chan
ge s
core Gangliosidosis
Integrin
Lysosome
Glycosidase
DNA replication
Cell division
ChangingAll proteins
Synthesis rate
Protein complexes
–0.2
0.2
0.4
0.6
0
0.2
0.4
0.6
0.8
0.8
Protein RNA
RNA
Figure 4 Correlation between mRNA and protein expression increases overtime during monocyte to macrophage differentiation. (A) Spread of the correlationbetween the protein synthesis rate and final changes in mRNA or proteinexpression changes after 48 h THP-1 differentiation for three biological replicatesof each parameter (n¼ 9). The center horizontal line represents the median, thebox spans the first through the third quartiles and the whiskers span the mostextreme values, excluding outliers. (B) A plot of the level of correlation betweenmRNA and protein expression changes across 48 h of differentiation. The solidpink line represents genes that are changing at the mRNA and protein levelwhereas the dotted blue line represents all the genes. Error bars denote thestandard deviation of three biological replicates of both transcriptomic andproteomic experiments. (C) 2D enrichment (Po0.05) of functional classesaccording to the expression changes observed in the proteome versus thetranscriptome. (D) Correlation of mRNA versus protein expression changes formembers of CORUM complexes during differentiation of THP-1 cells reveals thatprotein expression change are considerably better predictors for interactions thanare mRNA change (P¼ 7.9� 10� 14, Wilcoxon–Mann–Whitney test) (n¼ 125and n¼ 227 for protein and mRNA, respectively).
Synthesis is the regulator of protein expressionAR Kristensen et al
6 Molecular Systems Biology 2013 & 2013 EMBO and Macmillan Publishers Limited

makes the biggest contribution for proteins whose expressionincreases (55 and 31%, respectively), whereas the degradationrate accounted for 13% of the variance explained by the model(Figure 5C). The opposite was observed for the proteins whoseexpression decreased, since here the transcription change andsynthesis rate accounted for only 25 and 26%, whereas thedegradation rate accounted for 49% of the variance explainedby the model (Figure 5C).
Next, we investigated whether the addition of degradationand synthesis rates obtained under a different cellular statecould improve the prediction of protein expression changesfrom transcriptional changes. We therefore used the degrada-tion and synthesis rates obtained in proliferating THP-1 cells totry to predict the protein expression in differentiating THP-1cells. Interestingly, if one can use both the synthesis and thedegradation rates in such a prediction, then the calculatedchanges in protein expression come much closer to themeasured values (Figure 5D). Since we earlier observed ahigh conservation between degradation rates in the mouse andhuman cells, we next investigated whether knowledge of thesynthesis and degradation rates in differentiating or proliferatingmurine C2C12 cells would improve the predictive powerversus RNA expression change alone. Indeed, both thesynthesis and degradation rates improve the model consider-ably in differentiating murine C2C12 cells, although the effectwas much more modest in proliferating murine C2C12 cells(Figure 5D).
Protein synthesis rate is intensively regulated indifferentiating cells
How the synthesis and degradation rates for individual proteinsrespond to external perturbation has long been an openquestion that our data now allow us to address directly. Acomparison of the synthesis and degradation rates in differ-entiating versus proliferating cells reveals a significantly poorercorrelation for synthesis rates than for relative degradationrates in both THP-1 cells and C2C12 (Figure 6A and B). Toinvestigate this regulation more in detail, we performed 2Denrichment analysis (Po0.05) for the different biologicalprocesses between the relative synthesis rates of differentiatingand proliferating cells (Figure 6C; Supplementary Figure S7).This clearly revealed that many biological processes havedifferent synthesis rates in proliferating and differentiating cellsas can be seen by their off-diagonal location. For example, weobserved a decrease in the relative synthesis rates of proteinsinvolved in DNA condensation and cell cycle in differentiatingversus proliferating cells (see Supplementary Table S7 forcomplete list). On the contrary, the degradation rates betweenproliferating and differentiating cells were highly correlated inboth THP-1 and C2C12 cell lines, suggesting that differentiationhas little impact on degradation. 2D enrichment analysis(Po0.05) of degradation rates between differentiating andproliferating cells (Figure 6D; Supplementary Figure S8)revealed a very different picture from that of the synthesisrates, since most enriched biological processes were located on
mRNA change
Synthesis rate
Degradation rate
–5 0 5–5
0
5
–2
–1.5
–1
–0.5
0
0.5
1
1.5
2
–5 0 5–5
0
5
Relative synthesis rate Relative synthesis rateR
elat
ive
degr
adat
ion
rate
Rel
ativ
e de
grad
atio
n ra
te
Pro
tein
exp
ress
ion
(log2
)
Pre
dict
ed p
rote
in e
xpre
ssio
n (R
2 )
0.0
0.1
0.2
0.3
0.4
0.5
0.6
0.7
0.8
Pre
dict
ed p
rote
in e
xpre
ssio
n (R
2 )
DecreaseIncreaseAll0.00
0.05
0.10
0.15
0.20
0.25
0.30
0.35
0.40
Prolife
ratin
g
THP-1
Differe
ntiat
ing
C2C12
Prolife
ratin
g
C2C12
Figure 5 Parameters controlling protein expression changes during cellular differentiation. (A) A scatterplot of the synthesis and degradation rates in THP-1 after 48 hof differentiation from monocytes to macrophages, with the resulting change in overall expression encoded by color. (B) A scatterplot of the synthesis and degradationrates in C2C12 after 48 h of differentiation from myoblasts to myotubes, with the resulting change in overall expression encoded by color. (C) Protein expression changepredictions of all proteins, significant increasing and significant decreasing proteins, respectively derived from partial least squares (PLS) regression of the variousparameters controlling protein expression change during THP-1 differentiation, using the mean of at least two out of three biological replicates per parameter.(D) Predicted protein expression change during THP-1 differentiation derived from PLS regression of the contributions of the various parameters controlling expressionchange using the synthesis and degradation rates deriving from proliferating THP-1 cells, differentiating C2C12 cells and proliferating C2C12 cells, respectively. For(C, D) a value of 1 would indicate that the model perfectly predicts the expression change.
Synthesis is the regulator of protein expressionAR Kristensen et al
& 2013 EMBO and Macmillan Publishers Limited Molecular Systems Biology 2013 7

the diagonal, suggesting that the degradation rates of thedifferent biological processes are not different in the differ-entiating and proliferating cells (see Supplementary Table S8for complete list). As an example, the biological process ‘cellcycle’ was highly affected by differentiation in THP-1 cells andif one examines the proteins assigned to this class in detail, it isobvious that they have very different synthesis rates but verysimilar degradation rates (Supplementary Figure S9). Lastly, acomparison of the biological processes enriched among thoseproteins that displayed significant changes in synthesis ordegradations rates versus those that displayed significantchanges in protein expression during THP-1 differentiationrevealed that similar processes were enriched in those proteinswith significantly changed synthesis rates and protein expres-sion but not degradation rates (Figure 6E; SupplementaryTable S9). Taken this together strongly suggests that the cellchanges a protein’s synthesis rate up or down either increase ordecrease the amount of that protein.
Discussion
The regulation of protein expression change in response toexternal stimuli is fundamental to survival of all livingorganisms yet, to our knowledge, no quantitative assessmentof the contributions that various cellular processes make to
such a response has been made. Here, we set out to model howprotein expression change is regulated during differentiationusing two unrelated model systems so as to support moregeneralized conclusions. That unstructured, lower abundanceproteins were most dramatically affected by differentiationseems to be designed to allow very fast regulation of a largepart of the signal transduction network. This is also consistentwith observations that the differences among cell types arelargely a result of lower abundance proteins (Lundberg et al,2010) and that intrinsically unstructured proteins have moreinteraction partners and are involved in cellular signaling(Uversky et al, 2005; Babu et al, 2012).
Measuring the synthesis and degradation rates of proteinson a system level revealed that protein assigned to the samemacromolecular complex displayed similar synthesis anddegradation rates. However, closer examination of the synth-esis and degradation rates for components of sub-complexesrevealed that the alpha-subunits of the proteasome coreparticle are being formed wholly from newly synthesizedproteins rather than being re-assembled from recycledsubunits, which implies that the proteasome core particle isalso degraded as an intact complex. Thus, we speculate thatthe established modularity of macromolecular complexes(Gavin et al, 2006) is also present during synthesis anddegradation of the complexes, since the different modules of acomplex will display similar synthesis and degradation rates,
0
0.2
0.4
0.6
0.8
1
Syn
thes
is r
ates
Deg
rada
tion
rate
s
Cor
rela
tion
–0.2
0
0.2
0.4
0.6
0.8
1
Cor
rela
tion
0
1
2
3
4
5
–Log
10 (
p)
Exp
ress
ion-
incr
ease
Syn
thes
is-in
crea
seD
egra
datio
n-de
crea
seD
egra
datio
n-in
crea
seS
ynth
esis
-dec
reas
eE
xpre
ssio
n-de
crea
se
GlycoproteinDisulphide bondSignalReceptorIntegrinCell projectionCell junctionCell membraneCell adhesionCalciumActin bindingMembraneTransmembrane helixTransmembraneCytoskeletonNitrationSH3 domainRepressorChromatin regulatorTranscription regulationCell divisionMitosisSecretedPolymorphismCellcycleAntimicrobialChromosomeNucleusDNA bindingDNA replication
Syn
thes
is r
ates
Deg
rada
tion
rate
s
Synthesis rate differentiating scoreS
ynth
esis
rat
e pr
olife
ratin
g sc
ore
–1 0 1–1
0
1
Nucleosome core
DNA replication
DNA condensation Initiation factor
Calcium/phospholipidbinding
–1 0 1–1
0
1
Integrin
Lysosome
Mitochondrion
Nucleosome core
Degradation rate differentiating score
Deg
rada
tion
rate
pro
lifer
atin
g sc
ore
THP-1 cells
C2C12 cells
Figure 6 Regulation of protein synthesis and degradation rates for differentiating and proliferating cells. Boxplots of the spread of correlations (Spearman) from threebiological replicates between the synthesis and degradation rates in differentiating and proliferating (A) THP-1 and (B) C2C12 cells. 2D analysis (Po0.05) of thefunctional classes of proteins enriched in different regions of proliferating versus differentiating space of THP-1 cells for (C) synthesis and (D) degradation rates. (E) AClusterogram of the –log10(P-value) from enrichment analysis of the proteins whose expression, synthesis and degradation rates changed significantly (Po0.05) duringTHP-1 differentiation from monocytes to macrophages. The cellular processes enriched among those proteins with increased synthesis rates also tended to be enrichedin those with increased protein expression change, whereas virtually no classes were enriched among those with altered degradation rates.
Synthesis is the regulator of protein expressionAR Kristensen et al
8 Molecular Systems Biology 2013 & 2013 EMBO and Macmillan Publishers Limited
thereby adding an additional layer to the established assump-tion that proteins display different synthesis and degradationrates in different cellular compartments (Lam et al, 2007;Boisvert et al, 2012). This would also mean that synthesis anddegradation rates of a protein could be used as discriminatoryparameters to improve the assignment of protein interactions,similarly to mRNA co-expression (Jansen et al, 2002).
Toward our primary goal of modeling the contributionsvarious cellular processes make to an eventual proteome,predictions of protein expression changes can be significantlyimproved by taking into account both the synthesis and thedegradation rates of the proteins, contributing 41 and 13%respectively to the variance not explained by changes intranscription. That post-transcriptional regulation of synthesisand degradation rate is having such an impact after 48 h ofdifferentiation, where the highest correlation between tran-scriptome and proteome expression changes was observed,suggests that the factors are even more important earlier indifferentiation when RNA and protein levels are very poorlycorrelated. The importance of post-transcriptional regulationof protein expression changes during THP-1 differentiationwas illustrated in a recent paper that describes how over-expressing four miRNAs lead to partial differentiation (Forrestet al, 2009). Our results found that synthesis rate contributemore than degradation rate to the prediction from transcript toprotein expression changes which is in agreement to what hasbeen observed for these processes’ contributions in predictingprotein abundance, where it was observed that proteinsynthesis rate was a better predictor than protein degradationrate (Schwanhausser et al, 2011).
We observed clear differences in the extent to whichsynthesis and degradation rates contributed to the changesof protein expression during differentiation; perhaps unsur-prisingly the synthesis rate was the best predictor for thoseproteins that increased in expression whereas the degradationrate contributed the most in predicting decreasing proteins.This does suggest though that failure to consider degradationrates is the most likely explanation for why a poor correlationis generally observed between transcriptome and proteomeexpression changes for proteins whose expression decreases(Lee et al, 2011). That we observe a strong correlationbetween degradation rates in proliferating and differentiatingcells suggests that one does not even have to measure thedegradation rate in the same cellular state of the systemof interest in order to take such a parameter into accountwhen using transcriptome changes to predict protein expres-sion changes; degradation rates are now being recorded inthe newly developed Encyclopedia of Proteome Dynamics(Larance et al, 2013).
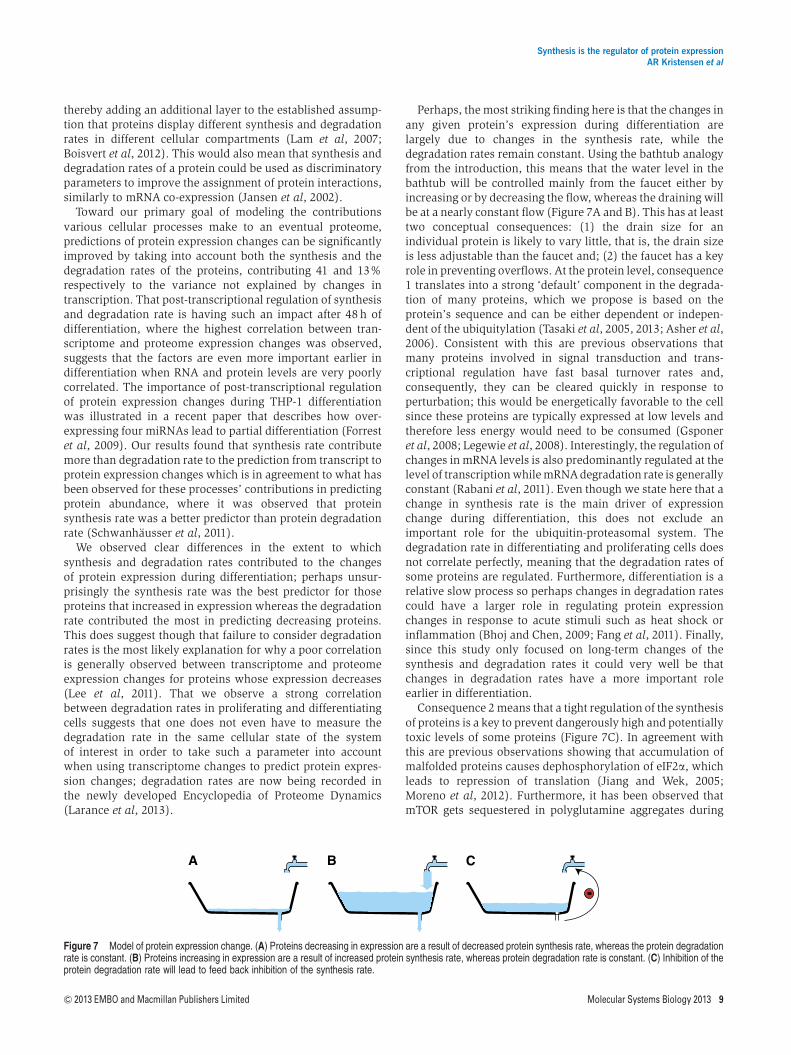
Perhaps, the most striking finding here is that the changes inany given protein’s expression during differentiation arelargely due to changes in the synthesis rate, while thedegradation rates remain constant. Using the bathtub analogyfrom the introduction, this means that the water level in thebathtub will be controlled mainly from the faucet either byincreasing or by decreasing the flow, whereas the draining willbe at a nearly constant flow (Figure 7A and B). This has at leasttwo conceptual consequences: (1) the drain size for anindividual protein is likely to vary little, that is, the drain sizeis less adjustable than the faucet and; (2) the faucet has a keyrole in preventing overflows. At the protein level, consequence1 translates into a strong ‘default’ component in the degrada-tion of many proteins, which we propose is based on theprotein’s sequence and can be either dependent or indepen-dent of the ubiquitylation (Tasaki et al, 2005, 2013; Asher et al,2006). Consistent with this are previous observations thatmany proteins involved in signal transduction and trans-criptional regulation have fast basal turnover rates and,consequently, they can be cleared quickly in response toperturbation; this would be energetically favorable to the cellsince these proteins are typically expressed at low levels andtherefore less energy would need to be consumed (Gsponeret al, 2008; Legewie et al, 2008). Interestingly, the regulation ofchanges in mRNA levels is also predominantly regulated at thelevel of transcription while mRNA degradation rate is generallyconstant (Rabani et al, 2011). Even though we state here that achange in synthesis rate is the main driver of expressionchange during differentiation, this does not exclude animportant role for the ubiquitin-proteasomal system. Thedegradation rate in differentiating and proliferating cells doesnot correlate perfectly, meaning that the degradation rates ofsome proteins are regulated. Furthermore, differentiation is arelative slow process so perhaps changes in degradation ratescould have a larger role in regulating protein expressionchanges in response to acute stimuli such as heat shock orinflammation (Bhoj and Chen, 2009; Fang et al, 2011). Finally,since this study only focused on long-term changes of thesynthesis and degradation rates it could very well be thatchanges in degradation rates have a more important roleearlier in differentiation.
Consequence 2 means that a tight regulation of the synthesisof proteins is a key to prevent dangerously high and potentiallytoxic levels of some proteins (Figure 7C). In agreement withthis are previous observations showing that accumulation ofmalfolded proteins causes dephosphorylation of eIF2a, whichleads to repression of translation (Jiang and Wek, 2005;Moreno et al, 2012). Furthermore, it has been observed thatmTOR gets sequestered in polyglutamine aggregates during
Figure 7 Model of protein expression change. (A) Proteins decreasing in expression are a result of decreased protein synthesis rate, whereas the protein degradationrate is constant. (B) Proteins increasing in expression are a result of increased protein synthesis rate, whereas protein degradation rate is constant. (C) Inhibition of theprotein degradation rate will lead to feed back inhibition of the synthesis rate.
Synthesis is the regulator of protein expressionAR Kristensen et al
& 2013 EMBO and Macmillan Publishers Limited Molecular Systems Biology 2013 9

Huntington’s disease, resulting in decreased mTOR-dependentTOP translation and introduction of autophagy, therebyserving a protective function (Ravikumar et al, 2004).
These findings then raise the captivating question: why hasevolution favored regulation of synthesis rather than ofdegradation? One possibility is that altering degradation ratesmight too easily induce protein aggregation, similar to what isseen when the autophagy or the proteasome is inhibited (Haraet al, 2006; Komatsu et al, 2006; Bence et al, 2001). One waythe cell avoids aggregate formation is by keeping the lifetimesof aggregate-prone proteins short (De Baets et al, 2011;Gsponer and Babu, 2012), which would be more difficult ifthe lifetime of a protein could be extended in response toperturbation.
Conclusion
Here, we have demonstrated that changes in protein synthesisrates are the primary drivers of differentiation. Clear andconsistent trends in support of this were observed in verydiverse cell types from two different organisms, providingstrong evidence that these trends are universal characteristicsof cellular differentiation. Furthermore, we have providedquantitative evidence to support the common assumption thatthe reason why transcriptomes and proteomes frequentlycorrelate very poorly is that there is still substantial varianceimparted at the levels of protein synthesis and degradation.This can even be observed in sub-populations of a givenprotein, such as those bound in specific protein complexes.Future experiments will hopefully extend these measurementsto other systems to test how widely these characteristics areconserved.
Materials and methods
Identifying changes in the proteome duringdifferentiation of THP-1 and C2C12 cells
THP-1 or C2C12 cells were grown in RPMI or DMEM media,respectively, with added 10% dialyzed fetal bovine serum (FBS), 1%glutamine, 1% non-essential amino acids, 1% penicillin/streptomycinand (L-[U-13C6,
14N4]arginine and L-[2H4]lysine or L-[U-12C6,14N4]argi-
nine [1H4]lysine or L-[U-13C6,15N4]arginine and L-[U-13C6,
15N2]lysine(Cambridge Isotope Labs, Cambridge, MA). The cells were grown forat least five doublings to ensure 100% incorporation of labeled aminoacids before THP-1 cells were differentiated by 25 nM PMA and C2C12cells were differentiated by increasing the confluency to 100% whiledecreasing the serum concentration to 2%.
Peptide separation and MS
The cells were washed three times in PBS and lysed in 1%deoxycholate before being boiled for 5 min. The lysate was digestedto peptides as in Rogers and Foster (2007) before being separated byIEF (Agilent Technology) following the manufacturers’ instructions.The separated peptides were STAGE Tipped as in Rappsilber et al(2007) before being analyzed by MS as in Kristensen et al (2012) andproteins were identified and quantified using MaxQuant (Cox andMann, 2008) with the settings as supplied in Supplementary methods.The mass spectrometry data acquired here have been deposited to theProteomeXchange Consortium (http://proteomecentral.proteomex-change.org) via the PRIDE partner repository (Vizcaıno et al, 2013)with the data set identifier PXD000328.
Data analysis
Significantly changing proteins were identified by applying ANOVAbetween the five time points with the following settings (permutation-based FDR, P¼ 0.05, S0¼1, 250 randomizations) using Perseus.Increasing and decreasing proteins were defined by clustering thedata into two clusters using fuzzy C mean clustering. Wilcoxon–Mann–Whitney test, partial least regression, and KEN-box motifdetermination were performed using Matlab (http://www.mathworks.com), whereas correlation coefficients and 2D enrichment analysis(Po0.05, Benjamini-Hochberg FDR for truncation) of the biologicalprocessed (Uniprot Keywords) were performed in Perseus, similarlyto Cox and Mann (2012). In boxplots, points were drawn as outliersif they were larger than q3þ1.5 (q3�q1) or smaller than q3�1.5(q3� q1).
Finally, enrichment (Uniprot Keywords) analysis of changingproteins, synthesis and degradation rates were performed by GPROX(Rigbolt et al, 2011) using Fisher’s exact test (Po0.05, Benjamini-Hochberg FDR for truncation).
For further detail, see Supplementary methods.
Supplementary information
Supplementary information is available at the Molecular SystemsBiology website (www.nature.com/msb).
AcknowledgementsWe wish to thank Nikolay Stoynov and Joost Gouw for assistance withthe mass spectrometers used in this study, Nat. F. Brown for producingFigures 1A and 7, and the PRIDE Team for help with depositing thedata. An Operating Grant from the Canadian Institutes of HealthResearch (MOP-77688) to LJF supported this research. ARK wassupported by a four-year fellowship from the University of BritishColumbia and by the Danish Agency for Science Technology andInnovation. LJF is the Canada Research Chair in QuantitativeProteomics. The mass spectrometry infrastructure used here wassupported, in part, by funds from the Canada Foundation forInnovation, the BC Knowledge Development Fund and the BCProteomics Network.
Author contributions: ARK conceived of and performed theexperiments; ARK, JG and LJF analyzed the data and wrote themanuscript.
Conflict of interestThe authors declare that they have no conflict of interest.
References
Asher G, Reuven N, Shaul Y (2006) 20S proteasomes and proteindegradation "by default". Bioessays 28: 844–849
Auwerx J (1991) The human leukemia cell line, THP-1: a multifacettedmodel for the study of monocyte-macrophage differentiation.Experientia 47: 22–31
Babu MM, Kriwacki RW, Pappu RV (2012) Versatility from proteindisorder. Science 337: 1460–1461
Baek D, Villen J, Shin C, Camargo FD, Gygi SP, Bartel DP (2008) Theimpact of microRNAs on protein output. Nature 455: 64–71
Bence NF, Sampat RM, Kopito RR (2001) Impairment of the ubiquitin-proteasome system by protein aggregation. Science 292: 1552–1555
Bhoj VG, Chen ZJ (2009) Ubiquitylation in innate and adaptiveimmunity. Nature 458: 430–437
Boisvert FM, Ahmad Y, Gierlinski M, Charriere F, Lamont D, Scott M,Barton G, Lamond AI (2012) A quantitative spatial proteomicsanalysis of proteome turnover in human cells. Mol Cell Proteomics11: M111.011429
Synthesis is the regulator of protein expressionAR Kristensen et al
10 Molecular Systems Biology 2013 & 2013 EMBO and Macmillan Publishers Limited

Brockmann R, Beyer A, Heinisch JJ, Wilhelm T (2007) Post-transcriptional expression regulation: what determines trans-lation rates? PLoS Comput Biol 3: e57
Cambridge SB, Gnad F, Nguyen C, Bermejo JL, Kruger M, Mann M(2011) Systems-wide proteomic analysis in mammalian cellsreveals conserved, functional protein turnover. J Proteome Res 10:5275–5284
Cox J, Mann M (2008) MaxQuant enables high peptide identificationrates, individualized p.p.b.-range mass accuracies and proteome-wide protein quantification. Nat Biotechnol 26: 1367–1372
Cox J, Mann M (2012) 1D and 2D annotation enrichment: a statisticalmethod integrating quantitative proteomics with complementaryhigh-throughput data. BMC Bioinformatics 13: S12
De Baets G, Reumers J, Delgado Blanco J, Dopazo J, Schymkowitz J,Rousseau F (2011) An evolutionary trade-off between proteinturnover rate and protein aggregation favors a higher aggregationpropensity in fast degrading proteins. PLoS Comput Biol 7:e1002090
de Godoy LMF, Olsen JV, Cox J, Nielsen ML, Hubner NC, Frohlich F,Walther TC, Mann M (2008) Comprehensive mass-spectrometry-based proteome quantification of haploid versus diploid yeast.Nature 455: 1251–1254
Fang NN, Ng AHM, Measday V, Mayor T (2011) Hul5 HECT ubiquitinligase plays a major role in the ubiquitylation and turnover ofcytosolic misfolded proteins. Nat Cell Biol 13: 1344–1352
Forrest ARR, Kanamori-Katayama M, Tomaru Y, Lassmann T,Ninomiya N, Takahashi Y, de Hoon MJL, Kubosaki A, Kaiho A,Suzuki M, Yasuda J, Kawai J, Hayashizaki Y, Hume DA, Suzuki H(2009) Induction of microRNAs, mir-155, mir-222, mir-424 andmir-503, promotes monocytic differentiation throughcombinatorial regulation. Leukemia 24: 460–466
Fournier ML, Paulson A, Pavelka N, Mosley AL, Gaudenz K, Bradford WD,Glynn E, Li H, Sardiu ME, Fleharty B, Seidel C, Florens L, Washburn MP(2010) Delayed correlation of mRNA and protein expression inrapamycin-treated cells and a role for Ggc1 in cellular sensitivity torapamycin. Mol Cell Proteomics 9: 271–284
Gavin A-C, Aloy P, Grandi P, Krause R, Boesche M, Marzioch M, Rau C,Jensen LJ, Bastuck S, Dumpelfeld B, Edelmann A, Heurtier M-A,Hoffman V, Hoefert C, Klein K, Hudak M, Michon A-M, Schelder M,Schirle M, Remor M et al (2006) Proteome survey revealsmodularity of the yeast cell machinery. Nature 440: 631–636
Gsponer J, Babu MM (2012) Cellular strategies for regulatingfunctional and nonfunctional protein aggregation. Cell Rep 2:1425–1437
Gsponer J, Futschik ME, Teichmann SA, Babu MM (2008) Tightregulation of unstructured proteins: from transcript synthesis toprotein degradation. Science 322: 1365–1368
Hara T, Nakamura K, Matsui M, Yamamoto A, Nakahara Y, Suzuki-Migishima R, Yokoyama M, Mishima K, Saito I, Okano H,Mizushima N (2006) Suppression of basal autophagy in neuralcells causes neurodegenerative disease in mice. Nature 441:885–889
Jansen R, Greenbaum D, Gerstein M (2002) Relating whole-genomeexpression data with protein-protein interactions. Genome Res 12:37–46
Jiang H-Y, Wek RC (2005) Phosphorylation of the alpha-subunit of theeukaryotic initiation factor-2 (eIF2alpha) reduces protein synthesisand enhances apoptosis in response to proteasome inhibition. J BiolChem 280: 14189–14202
King RW, Deshaies RJ, Peters JM, Kirschner MW (1996) Howproteolysis drives the cell cycle. Science 274: 1652–1659
Komatsu M, Waguri S, Chiba T, Murata S, Iwata J-I, Tanida I, Ueno T,Koike M, Uchiyama Y, Kominami E, Tanaka K (2006) Loss ofautophagy in the central nervous system causes neurodegenerationin mice. Nature 441: 880–884
Kristensen AR, Gsponer J, Foster LJ (2012) A high-throughputapproach for measuring temporal changes in the interactome. NatMethods 9: 907–909
Lam YW, Lamond AI, Mann M, Andersen JS (2007) Analysis ofnucleolar protein dynamics reveals the nuclear degradation ofribosomal proteins. Curr Biol 17: 749–760
Larance M, Ahmad Y, Kirkwood KJ, Ly T, Lamond AI (2013) Globalsubcellular characterization of protein degradation usingquantitative proteomics. Mol Cell Proteomics 12: 638–650
Lee MV, Topper SE, Hubler SL, Hose J, Wenger CD, Coon JJ, Gasch AP(2011) A dynamic model of proteome changes reveals new roles fortranscript alteration in yeast. Mol Syst Biol 7: 514
Legewie S, Herzel H, Westerhoff HV, Bluthgen N (2008) Recurrentdesign patterns in the feedback regulation of the mammaliansignalling network. Mol Syst Biol 4: 190
Lu P, Vogel C, Wang R, Yao X, Marcotte EM (2006) Absolute proteinexpression profiling estimates the relative contributions oftranscriptional and translational regulation. Nat Biotechnol 25:117–124
Lundberg E, Fagerberg L, Klevebring D, Matic I, Geiger T, Cox J,Algenas C, Lundeberg J, Mann M, Uhlen M (2010) Defining thetranscriptome and proteome in three functionally different humancell lines. Mol Syst Biol 6: 450
Maier T, Schmidt A, Guell M, Kuhner S, Gavin AC, Aebersold R,Serrano L (2011) Quantification of mRNA and protein and integrationwith protein turnover in a bacterium. Mol Syst Biol 7: 511
Moreno JA, Radford H, Peretti D, Steinert JR, Verity N, Martin MG,Halliday M, Morgan J, Dinsdale D, Ortori CA, Barrett DA, Tsaytler P,Bertolotti A, Willis AE, Bushell M, Mallucci GR (2012) Sustainedtranslational repression by eIF2a-P mediates prion neuro-degeneration. Nature 485: 507–511
Munoz J, Low TY, Kok YJ, Chin A, Frese CK, Ding V, Choo A, Heck AJR(2011) The quantitative proteomes of human-induced pluripotentstem cells and embryonic stem cells. Mol Syst Biol 7: 550
Ong S-E, Blagoev B, Kratchmarova I, Kristensen DB, Steen H, Pandey A,Mann M (2002) Stable isotope labeling by amino acids in cell culture,SILAC, as a simple and accurate approach to expression proteomics.Mol Cell Proteomics 1: 376–386
Prakash S, Tian L, Ratliff KS, Lehotzky RE, Matouschek A (2004) Anunstructured initiation site is required for efficient proteasome-mediated degradation. Nat Struct Mol Biol 11: 830–837
Pratt JM, Petty J, Riba-Garcia I, Robertson DHL, Gaskell SJ, Oliver SG,Beynon RJ (2002) Dynamics of protein turnover, a missingdimension in proteomics. Mol Cell Proteomics 1: 579–591
Rabani M, Levin JZ, Fan L, Adiconis X, Raychowdhury R, Garber M,Gnirke A, Nusbaum C, Hacohen N, Friedman N, Amit I, Regev A(2011) Metabolic labeling of RNA uncovers principles of RNAproduction and degradation dynamics in mammalian cells. NatBiotechnol 29: 436–442
Rappsilber J, Mann M, Ishihama Y (2007) Protocol for micro-purification, enrichment, pre-fractionation and storage ofpeptides for proteomics using StageTips. Nat Protoc 2: 1896–1906
Ravikumar B, Vacher C, Berger Z, Davies JE, Luo S, Oroz LG, Scaravilli F,Easton DF, Duden R, O’Kane CJ, Rubinsztein DC (2004) Inhibition ofmTOR induces autophagy and reduces toxicity of polyglutamineexpansions in fly and mouse models of Huntington disease. Nat Genet36: 585–595
Rigbolt KTG, Vanselow JT, Blagoev B (2011) GProX, a user-friendlyplatform for bioinformatics analysis and visualization ofquantitative proteomics data. Mol Cell Proteomics 10: O110.007450
Rogers LD, Foster LJ (2007) The dynamic phagosomal proteome andthe contribution of the endoplasmic reticulum. Proc Natl Acad SciUSA 104: 18520–18525
Schoenheimer R, Ratner S, Rittenberg D (1939) Studies of proteinmetabolism. J Biol Chem 333–344
Schwanhausser B, Busse D, Li N, Dittmar G, Schuchhardt J, Wolf J,Chen W, Selbach M (2011) Global quantification of mammaliangene expression control. Nature 473: 337–342
Selbach M, Schwanhausser B, Thierfelder N, Fang Z, Khanin R,Rajewsky N (2008) Widespread changes in protein synthesisinduced by microRNAs. Nature 455: 58–63
Synthesis is the regulator of protein expressionAR Kristensen et al
& 2013 EMBO and Macmillan Publishers Limited Molecular Systems Biology 2013 11

Suzuki H, Forrest ARR, van Nimwegen E, Daub CO, Balwierz PJ,Irvine KM, Lassmann T, Ravasi T, Hasegawa Y, de Hoon MJL,Katayama S, Schroder K, Carninci P, Tomaru Y, Kanamori-Katayama M, Kubosaki A, Akalin A, Ando Y, Arner E, Asada Met al (2009) The transcriptional network that controls growth arrestand differentiation in a human myeloid leukemia cell line. NatGenet 41: 553–562
Tasaki T, Kim ST, Zakrzewska A, Lee BE, Kang MJ, Yoo YD, Cha-Molstad HJ, Hwang J, Soung NK, Sung KS, Kim S-H, Nguyen MD,Sun M, Yi EC, Kim BY, Kwon YT (2013) UBR box N-recognin-4(UBR4), an N-recognin of the N-end rule pathway, and its role inyolk sac vascular development and autophagy. Proc Natl Acad SciUSA 110: 3800–3805
Tasaki T, Mulder LCF, Iwamatsu A, Lee MJ, Davydov IV, Varshavsky A,Muesing M, Kwon YT (2005) A family of mammalian E3 ubiquitinligases that contain the UBR box motif and recognize N-degrons.Mol Cell Biol 25: 7120–7136
Uversky VN, Oldfield CJ, Dunker AK (2005) Showing your ID: intrinsicdisorder as an ID for recognition, regulation and cell signaling.J Mol Recognit 18: 343–384
Vizcaıno JA, Cote RG, Csordas A, Dianes JA, Fabregat A, Foster JM, Griss J,Alpi E, Birim M, Contell J, O’Kelly G, Schoenegger A, Ovelleiro D,Perez-Riverol Y, Reisinger F, Rıos D, Wang R, Hermjakob H (2013)The PRoteomics IDEntifications (PRIDE) database and associatedtools: status in 2013. Nucleic Acids Res 41: D1063–D1069
Vogel C, de Sousa Abreu R, Ko D, Le S-Y, Shapiro BA, Burns SC, Sandhu D,Boutz DR, Marcotte EM, Penalva LO (2010) Sequence signatures andmRNA concentration can explain two-thirds of protein abundancevariation in a human cell line. Mol Syst Biol 6: 400
Yen H-CS, Xu Q, Chou DM, Zhao Z, Elledge SJ (2008) Global proteinstability profiling in mammalian cells. Science 322: 918–923
Molecular Systems Biology is an open-accessjournal published by the European Molecular
Biology Organization and Nature Publishing Group. Thiswork is licensed under a Creative Commons Attribution 3.0Unported Licence. To view a copy of this licence visit http://creativecommons.org/licenses/by/3.0/.
Synthesis is the regulator of protein expressionAR Kristensen et al
12 Molecular Systems Biology 2013 & 2013 EMBO and Macmillan Publishers Limited