
Protein-Style Dynamical Transition in a Non-Biological ...
8
Protein-Style Dynamical Transition in a Non-Biological Polymer and a Non-Aqueous Solvent E. Mamontov,* ,† V. K. Sharma, ‡,§ J. M. Borreguero, ∥ and M. Tyagi ⊥,# † Chemical and Engineering Materials Division, Neutron Sciences Directorate, Oak Ridge National Laboratory, Oak Ridge, Tennessee 37831, United States ‡ Biology and Soft Matter Division, Neutron Sciences Directorate, Oak Ridge National Laboratory, Oak Ridge, Tennessee 37831, United States § Solid State Physics Division, Bhabha Atomic Research Centre, Mumbai 400085, India ∥ Neutron Data Analysis and Visualization Division, Neutron Sciences Directorate, Oak Ridge National Laboratory, Oak Ridge, Tennessee 37831, United States ⊥ National Institute of Standards and Technology Center for Neutron Research, Gaithersburg, Maryland 20899, United States # Department of Materials Science and Engineering, University of Maryland, College Park, Maryland 20742, United States ABSTRACT: Temperature-dependent onset of apparent anharmonicity in the micro- scopic dynamics of hydrated proteins and other biomolecules has been known as protein dynamical transition for the last quarter of a century. Using neutron scattering and molecular dynamics simulation, techniques most often associated with protein dynamical transition studies, we have investigated the microscopic dynamics of one of the most common polymers, polystyrene, which was exposed to toluene vapor, mimicking the process of protein hydration from water vapor. Polystyrene with adsorbed toluene is an example of a solvent−solute system, which, unlike biopolymers, is anhydrous and lacks hydrogen bonding. Nevertheless, it exhibits the essential traits of the dynamical transition in biomolecules, such as a specific dependence of the microscopic dynamics of both solvent and host on the temperature and the amount of solvent adsorbed. We conclude that the protein dynamical transition is a manifestation of a universal solvent−solute dynamical relationship, which is not specific to either biomolecules as solute, or aqueous media as solvent, or even a particular type of interactions between solvent and solute. 1. INTRODUCTION Measurements over a broad temperature range are invaluable in studies of microscopic dynamics of proteins and other biomolecules. On warming up from a baseline temperature, often in the range of several Kelvin, where only vibrational degrees of freedom are detected, various relaxation-type processes gradually become visible, eventually coming to dominate the microscopic dynamics of biomolecules at ambient temperatures. The idea of protein dynamical transition has become universally accepted as an attempt to rationalize the principles governing the microscopic dynamics of biomolecules. The dynamical transition manifests itself in the onset of apparent anharmonicity due to activation of the relaxation degrees of freedom, commonly detected in measurements of the temperature dependence of the mean-squared atomic displacements (MSDs). If the dynamical transition temperature is resolution-dependent, it means that the relaxation degrees of freedom actually become activated at lower temperature, and the apparent onset of amharmonicity at the dynamical transition merely reflects the fact that the relaxations have become fast enough to be resolved with the resolution of the measurement. Even dehydrated proteins exhibit some apparent anharmo- nicity (e.g., due to relaxation-type dynamics of side chains such as methyl groups), but the main dynamical transition, observed within the 180−240 K temperature range, is strongly hydration- dependent. The defining influence of the aqueous solvent on the picosecond−nanosecond (ps−ns) time scale of biopolymer dynamics has been widely acknowledged, 1,2 even though its exact mechanisms remain debated. 3−7 Incoherent quasielastic neutron scattering (QENS) has become a tool of choice for studying the protein dynamical transition, 8,9 largely due to its ability to measure separately the dynamics of the hydrated host and its hydration water using hydrogenated vs deuterated constituents. The ps−ns accessible time scale and (H/D) sensitivity makes QENS a powerful tool for studying micro- scopic dynamics of not only biopolymers but polymers in general. 10 In recent years, some studies have taken a less conventional approach to the problem of solvent−solute microscopic dynamic coupling. One line of studies has established that Received: January 26, 2016 Revised: February 29, 2016 Published: March 15, 2016 Article pubs.acs.org/JPCB © 2016 American Chemical Society 3232 DOI: 10.1021/acs.jpcb.6b00866 J. Phys. Chem. B 2016, 120, 3232−3239
Transcript of Protein-Style Dynamical Transition in a Non-Biological ...

Protein-Style Dynamical Transition in a Non-Biological Polymer and aNon-Aqueous SolventE. Mamontov,*,† V. K. Sharma,‡,§ J. M. Borreguero,∥ and M. Tyagi⊥,#
†Chemical and Engineering Materials Division, Neutron Sciences Directorate, Oak Ridge National Laboratory, Oak Ridge, Tennessee37831, United States‡Biology and Soft Matter Division, Neutron Sciences Directorate, Oak Ridge National Laboratory, Oak Ridge, Tennessee 37831,United States§Solid State Physics Division, Bhabha Atomic Research Centre, Mumbai 400085, India∥Neutron Data Analysis and Visualization Division, Neutron Sciences Directorate, Oak Ridge National Laboratory, Oak Ridge,Tennessee 37831, United States⊥National Institute of Standards and Technology Center for Neutron Research, Gaithersburg, Maryland 20899, United States#Department of Materials Science and Engineering, University of Maryland, College Park, Maryland 20742, United States
ABSTRACT: Temperature-dependent onset of apparent anharmonicity in the micro-scopic dynamics of hydrated proteins and other biomolecules has been known as proteindynamical transition for the last quarter of a century. Using neutron scattering andmolecular dynamics simulation, techniques most often associated with protein dynamicaltransition studies, we have investigated the microscopic dynamics of one of the mostcommon polymers, polystyrene, which was exposed to toluene vapor, mimicking theprocess of protein hydration from water vapor. Polystyrene with adsorbed toluene is anexample of a solvent−solute system, which, unlike biopolymers, is anhydrous and lackshydrogen bonding. Nevertheless, it exhibits the essential traits of the dynamical transition inbiomolecules, such as a specific dependence of the microscopic dynamics of both solventand host on the temperature and the amount of solvent adsorbed. We conclude that theprotein dynamical transition is a manifestation of a universal solvent−solute dynamicalrelationship, which is not specific to either biomolecules as solute, or aqueous media assolvent, or even a particular type of interactions between solvent and solute.
1. INTRODUCTION
Measurements over a broad temperature range are invaluable instudies of microscopic dynamics of proteins and otherbiomolecules. On warming up from a baseline temperature,often in the range of several Kelvin, where only vibrationaldegrees of freedom are detected, various relaxation-typeprocesses gradually become visible, eventually coming todominate the microscopic dynamics of biomolecules at ambienttemperatures. The idea of protein dynamical transition hasbecome universally accepted as an attempt to rationalize theprinciples governing the microscopic dynamics of biomolecules.The dynamical transition manifests itself in the onset ofapparent anharmonicity due to activation of the relaxationdegrees of freedom, commonly detected in measurements ofthe temperature dependence of the mean-squared atomicdisplacements (MSDs). If the dynamical transition temperatureis resolution-dependent, it means that the relaxation degrees offreedom actually become activated at lower temperature, andthe apparent onset of amharmonicity at the dynamicaltransition merely reflects the fact that the relaxations havebecome fast enough to be resolved with the resolution of themeasurement.
Even dehydrated proteins exhibit some apparent anharmo-nicity (e.g., due to relaxation-type dynamics of side chains suchas methyl groups), but the main dynamical transition, observedwithin the 180−240 K temperature range, is strongly hydration-dependent. The defining influence of the aqueous solvent onthe picosecond−nanosecond (ps−ns) time scale of biopolymerdynamics has been widely acknowledged,1,2 even though itsexact mechanisms remain debated.3−7 Incoherent quasielasticneutron scattering (QENS) has become a tool of choice forstudying the protein dynamical transition,8,9 largely due to itsability to measure separately the dynamics of the hydrated hostand its hydration water using hydrogenated vs deuteratedconstituents. The ps−ns accessible time scale and (H/D)sensitivity makes QENS a powerful tool for studying micro-scopic dynamics of not only biopolymers but polymers ingeneral.10
In recent years, some studies have taken a less conventionalapproach to the problem of solvent−solute microscopicdynamic coupling. One line of studies has established that
Received: January 26, 2016Revised: February 29, 2016Published: March 15, 2016
Article
pubs.acs.org/JPCB
© 2016 American Chemical Society 3232 DOI: 10.1021/acs.jpcb.6b00866J. Phys. Chem. B 2016, 120, 3232−3239

the dynamical transition is essentially independent of proteinstructure11,12 and observed even in denatured proteins13 andamino acid mixtures.14 Another line of studies has revealed15−17
that water hydrating even “rigid” inorganic compounds exhibitsthe same characteristic temperature and hydration leveldependence of MSD and relaxation time as displayed bywater hydrating proteins and other biomolecules.18,19 Thesefindings suggest that hydration water may be solely responsiblefor the main characteristic features of the dynamical transition,while in turn experiencing the influence of the host, e.g.,through acquiring host-specific hydration level and assumingthe relaxation dynamics specific to this particular hydrationlevel.We hypothesize that the dynamical transition in the
hydration water and, by extension, the protein host is merelya manifestation of a universal solvent−solute relationshipindependent of composition, chemical bonding, and physicalinteractions in the solvent−solute system. To test thishypothesis, we follow a protocol commonly adopted in studiesof protein powders hydrated in a controlled manner from watervapors but use a simple nonbiological polymer, polystyrene(PS), exposed to vapors of toluene. Unlike in hydratedbiopolymers, there is no hydrogen bonding in the PS−toluenesystem, which is instead dominated by dispersion forces and byπ−π interactions between aromatic rings. Nevertheless, thisnonbiological polymer and nonaqueous solvent reproduce theessential features of the protein dynamical transition, includingits dependence on the amount of adsorbed solvent and thestrong coupling of the host to the translational dynamics of theadsorbed solvent.
2. EXPERIMENT AND SIMULATION
Samples. Because of the dominant incoherent neutronscattering cross section of hydrogen compared to otherelements, including deuterium, we use PS-d3 (deuteratedbackbone) and PS-d5 (deuterated aromatic ring side groups)exposed to fully deuterated toluene-d8 in order to emphasizethe scattering signal from the PS side groups and the PSbackbone, respectively. Likewise, we use fully deuterated PS-d8exposed to methyl-deuterated toluene-d3 to probe the dynamicsof the toluene solvent with the emphasis on its aromatic rings,as opposed to the methyl group.Fully deuterated toluene (C6D5CD3, toluene-d8) and partially
deuterated toluene (C6H5CD3, toluene-d3) were purchasedfrom Sigma-Aldrich. Fully and partially deuterated atacticpolymers, (−C6D5CD2CD− , PS-d8, Mn = 15,800),(−C6H 5CD2CD− , P S - d 3 , M n = 1 5 , 0 0 0 ) , a n d(−C6D5CH2CH−, PS-d5, Mn = 4,500), were purchased fromPolymer Source Inc. The as received polymers have beenseparately vacuum-annealed at 363 K for 2 days, resulting in amaximum weight loss of 0.6%. The annealing process removes
the residual volatile contaminants from the polymer samplesand is conceptually equivalent to protein sample lyophilizationprior to controlled hydration. A control annealed sample wasstored on a benchtop in an open dish for about 72 h, withoutany significant weight uptake, as expected from hydrophobicinteractions between polystyrene and atmospheric water. Threeof the annealed samples, one of each H−D composition, werethen sealed with indium wire in annular aluminum sampleholders and subsequently used as h = 0 samples in the neutronscattering experiments. Here h is the solvent uptake, in gramsper gram of sample, using the notation commonly employed forhydrated proteins. Six of the annealed samples, two of each H−D composition, were then placed in enclosed chambers thatalso contained open dishes of either toluene-d8 or toluene-d3.The continuously increasing uptake of toluene by polystyrenefrom the vapors was then monitored for about 24 h, and uponreaching the target uptake, the samples were removed from thechambers and sealed with indium wire in annular aluminumsample holders. Altogether we prepared the following ninesamples for neutron scattering experiments: polystyrene-d3−toluene-d8 at h = 0, 0.19, and 0.39, polystyrene-d5−toluene-d8 ath = 0, 0.19, and 0.38, and polystyrene-d8−toluene-d3 at h = 0,0.20, and 0.44. The mass of polystyrene samples prior to theirexposure to toluene vapor was controlled in order to minimizethe effects of multiple scattering in neutron scatteringexperiments, and varied between 0.33 and 0.47 g among thenine samples.
Neutron Scattering Experiment. Measurements of thenine samples were carried out using the High Flux NeutronBackscattering Spectrometer (HFBS)20 at the NIST Center forNeutron Research (NCNR), Gaithersburg, MD. A reactor-based backscattering spectrometer such as HFBS (1 μeV energyresolution, FHWM) is an optimal choice for collecting theenergy-resolved elastic scattering that can be used to extract theMSD temperature dependence averaged over the hydrogen-bearing species in the sample. The elastic intensity temperaturescan measurements have been carried out with the Dopplermonochromator at rest in the course of a heating cycle from thebaseline temperature of 30 K at a ramp rate of 0.6 K/min with adata point recorded every 2.5 min. The atomic MSD wasobtained from the elastic intensities using a Gaussianapproximation, Ielastic(Q, T) = Ielastic(Q, T0) exp(−Q2⟨u2(T)⟩/3), with a baseline temperature of T0 = 30 K and 0.36 Å−1 < Q< 1.51 Å−1. Besides, the elastic scattering intensities have beenanalyzed separately, without calculating the MSD. One of thesamples, polystyrene-d8−toluene-d3 at h = 0.44, was sub-sequently measured using the backscattering spectrometerBASIS21 at the Spallation Neutron Source (SNS), Oak RidgeNational Laboratory (ORNL). This spectrometer had anenergy resolution of 3.4 μeV FHWM) and a range of accessible
Table 1. Settings for the Equilibration MD Runs
runnumber run type
Ti(K)
Tf(K)
Langevin damping period(fs)
Pi(atm)
Pf(atm)
pressure damping period(ps)
simulation time(ns)
time step(fs)
1 compress 10 10 10 0 100 100 0.2 0.12 compress 10 10 10 10 10 100 0.5 0.13 compress 10 10 10 1 10 10 1 0.14 compress 10 10 10 10 10 10 0.1 15 compress 10 10 10 10 10 100 2 16 compress 10 10 10 10 1 100 5 17 heating 10 450 20000 1 1 100 4.5 1
The Journal of Physical Chemistry B Article
DOI: 10.1021/acs.jpcb.6b00866J. Phys. Chem. B 2016, 120, 3232−3239
3233

energy transfers of ±100 μeV. When not visible in the figures,the error bars are within the size of the symbols.Molecular Dynamics Simulation. Using the polymer
builder tool of Biovia Materials Studio22 (BMS), we arrangedeight atactic polystyrene chains, each 32 monomers long, in acubic grid with a cell size of 10 nm. This initial configurationwas minimized for 400 steps with the BMS module Forcite andthe CVFF23 force field. Using the BMS module “AmorphousCell”, we randomly inserted 128 toluene molecules in thesystem for a ratio of two styrene monomers per toluenemolecule. A second minimization with the previous settings wascarried out in this styrene plus toluene system. The final systemconsists of a gas of polystyrene chains and toluene moleculesthat is subsequently equilibrated to a target temperature of 450K and a pressure of 1 atm. To attain equilibration, we firstexport the minimized system in a format suitable forsimulations with the LAMMPS24 package and the CVFFforce field. The initial equilibration protocol consists of a seriesof compression runs at a constant T = 10 K followed by a slowheating of the system to a target temperature of 450 K at aconstant pressure of P = 1 atm (see Table 1).Once equilibration is achieved at 450 K, a 5 ns run in the
NPT ensemble (450 K, 1 atm) is performed. The endconformation of this run is taken as the initial conformation fortwo runs: (1) a production run of 100 ns at the sametemperature of 450 K and (2) an equilibration run of 5 ns at aslightly colder temperature of 440 K. We repeat this protocol,each time collecting a production run at temperature T and anequilibration run at T′ = T − 10 K, until we reached the lowestsimulated temperature (80 K).In order to make a straightforward comparison between
simulation and experiment results, we reproduce the exper-imental methodology. First, the intermediate neutron self-incoherent scattering function I(Q, t) is calculated with theSassena25 package, which is then followed by Fourier transformto obtain S(Q, E) with the SassenaFFT algorithm of the
Mantid26 framework. Convolution with a model functiondescribing the resolution function of the HFBS instrument (aGaussian centered at E = 0 with FWHM = 0.8 μeV) is carriedout, followed by integration in the [−FHWM, FHWM] energyrange to finally obtain the elastic signal IESF. The resultingIESF(Q) is fitted to the same Gaussian decay model as in theexperiment in order to derive the MSD value. Differenthydrogen atoms are considered when comparing to differentexperimental samples. For instance, only hydrogen atoms in therings of the toluene molecules were taken into account in theIESF calculation when comparing to the PS-d8−toluene-d3sample.Trajectories for the center of mass (CoM) of each styrene
ring, each styrene backbone, and each toluene ring aregenerated with the pyTraj27,28 library. The CoM trajectoriesare treated in the same way as the atomic trajectories for thepurposes of deriving ⟨ucom
2⟩ values.
3. RESULTS AND DISCUSSION
The molecular dynamics (MD) simulation snapshot of the PS−toluene system is presented in Figure 1, exhibiting similarity tonumerous pictures of hydrated biopolymers available in theliterature. However, particularly striking similarity to proteindata available from numerous publications is exhibited byFigure 2. The “dry” PS shows essentially harmonic behavior asa function of temperature up to its glass transition of ca. 370 K.The PS with toluene solvent shows apparent temperature-dependent anharmonicity, with a larger increase in MSD andearlier onset of apparent anharmonicity for the higher solventuptake compared to the lower solvent uptake. The temperaturedependence of MSD of PS with variable toluene adsorptionshown in Figure 2 looks very similar to that of biopolymers,except for the particular temperature range of the dynamicaltransition. Besides, we have deliberately heated up the “dry” PSsample above its glass transition temperature of ca. 370 K,leading to the eventual increase in the MSD, even though it
Figure 1. Fully equilibrated MD simulation structure of the styrene−toluene system at h = 0.44 (grams of toluene per gram of styrene),corresponding to one toluene molecule per two styrene monomers. There are eight chains of styrene (colored). The toluene molecules are drawn assticks. Inset: a fragment of a polystyrene chain drawn as sticks.
The Journal of Physical Chemistry B Article
DOI: 10.1021/acs.jpcb.6b00866J. Phys. Chem. B 2016, 120, 3232−3239
3234

would correspond to heat denaturation of biomolecules, whichis not commonly done in experiments. Also presented in Figure2 is the glass transition temperature for polystyrene and toluenein bulk form.The temperature dependence of MSD presented in Figure 2
may enjoy widespread recognition by the biophysicscommunity. It convincingly demonstrates that the dynamicaltransition in polystyrene is solvent-driven and depends on theamount of solvent in the same manner as the dynamicaltransition in hydrated proteins. However, strictly speaking,despite its widespread use in the literature, the derivation of the⟨u2(T)⟩ from the elastic intensities using a Gaussianapproximation is no longer valid when relaxation degrees offreedom become activated. For this reason, direct analysis ofelastic scattering intensities29 may be preferred. Since we couldnot vary the energy resolution of the backscatteringspectrometer, the temperature dependence of the elasticintensities at a fixed energy resolution (τres ≈ 1500 ps) needsto be analyzed.Because of the anticipated complexity of the intermediate
relaxation function, I(Q, t), for the system studied, it wasapproximated by a stretched exponential (Kohlrausch) function
τ= − − +βI Q t Q t T Q( , ) (1 EISF( )) exp( / ( )) EISF( )c(1)
where EISF(Q) is the temperature-independent elasticscattering fraction and τc(T) is the temperature-dependentrelaxation time. Following ref 29, we use the δ-resolutionfunction approximation, where the difference between the totalelastic scattering fraction and the elastic scattering intensityvanishes, and the measured elastic scattering intensity, SR(Q, E= 0), is related to the I(Q, t) evaluated at t = τres:
πτ= = =S Q E I Q t( , 0)
1( , )R res (2)
In order to fit the temperature dependence of SR(Q, E = 0), wemake an assumption of the Arrhenius-type relaxation time,τc(T) = τ0 exp(Ea/RT), and the linear temperature dependenceof the vibrational displacements of the Debye−Waller factor,which is thus assumed to modulate the experimentallymeasured SR(Q, E = 0) proportionally to exp(−αT). If theenergy resolution cannot be varied, which is usually the case inbackscattering experiments, there is degeneracy between thestretch parameter, β, and the prefactor of Arrhenius relaxationtime, τ0. Fortunately, at the temperature that manifests thedynamical transition, when τc(T) = τres, the elastic intensitydecays to (1/e) of its initial value, regardless of the stretchparameter, β.29 Thus, the activation energy, Ea, can bedetermined reliably, even if the prefactor, τ0, cannot. Two ofthe data sets shown in Figure 2 exhibit sufficiently largeintensity decay at the highest measured temperature, whichmakes them suitable for this kind of analysis, as presented inFigure 3.
Observation of the Q-dependence of elastic intensitiessuggests that toluene solvent may exhibit more than onerelaxation process, whereas polystyrene exhibits only onerelaxation, correlated with the higher-temperature relaxationin toluene. This observation is corroborated by the analysisusing eqs 1 and 2 as described above. The Kohlrauschrelaxation function adequately describes the elastic intensityfrom polystyrene, yielding a Q-independent activation energy ofEa ≈ 0.35 kJ/mol, as expected from a localized process. On theother hand, a single Kohlrausch function proves less thanadequate for description of the elastic intensity from
Figure 2. Mean-squared displacements obtained from the temperaturedependence of the energy-resolved elastic scattering intensitiesmeasured on warming up from the baseline temperature. The glasstransition temperatures of polystyrene and bulk toluene are marked byvertical dashed lines.
Figure 3. Left panels: Q-dependence of elastic scattering intensitiesdominated by the solvent (PS-d8, toluene-d3) and the polymer matrix(PS-d5, toluene-d8). Right panels: analysis of elastic scatteringintensities presented at a selected Q value of 1.32 Å−1. Symbols:data. Solid lines: fits with eqs 1 and 2 as described in the text. Insetsshow the Q-dependence of the activation energy for the relaxations.
The Journal of Physical Chemistry B Article
DOI: 10.1021/acs.jpcb.6b00866J. Phys. Chem. B 2016, 120, 3232−3239
3235

polystyrene, suggesting the presence of more than onerelaxation process. This is clearly seen in Figure 3 at a selectedQ value, and such inadequacy of a single relaxation description,compared to a goof fit for polystyrene data, is observed at allother Q values. The activation energy obtained for toluene issomewhat lower compared to that for polystyrene, and issomewhat Q-dependent, as expected for a solvent with largermolecular displacements, which may be of partially translationalorigin. As we discuss below, additional experiments andsimulation indeed demonstrate the complex character of thetoluene solvent dynamics.Even though we are unaware of prior neutron scattering
experiments specifically targeting microscopic dynamics inpolymer powders with different levels of solvent uptake, someinteresting conclusions may be inferred from the existingliterature on neutron scattering studies of PS. Several papers byKanaya et al. have described the “fast process” in PS with theonset temperature similar to what we observe in the currentwork, although it is not clear whether the solvent, apparentlyintroduced in the PS samples unintentionally, was toluene ormethanol.30,31 Even though PS phenyl rings were implicated inthe detected relaxation dynamics, their full flips have been ruledout as a possible origin of this relaxation process.31 Thisprominent relaxation process, which we believe might havebeen the same as the relaxation observed in the current work,was likely solvent-driven, because similar measurements of thesolvent-free PS indicated only very weak relaxation dynamicsbelow the glass transition temperature.32 This is in agreementwith our data in Figure 2 for h = 0 samples and numerousstudies of solvent-free (dry) proteins that exhibit measurablebut weak dynamics in the dry state. It is also possible that the“fast process” dynamics reported for PS films33 could have beenaffected by the solvent or lack thereof in the films and controlsamples, even though the validity of comparison of microscopicrelaxation dynamics between films and powder samples couldbe questioned.As evidenced by the bottom panel in Figure 2, the toluene
solvent itself exhibits a dynamical transition, similar to thatdemonstrated by hydration water,16 with the same solvent-leveldependence, though shifted in temperature. Quasielasticneutron scattering data for the high solvent level sample, h =0.44, are shown in Figure 4. These spectra were collected fromPS-d8−toluene-d3 to probe the dynamics of toluene, predom-inantly its aromatic rings. For clarity, only the lowest- andhighest-Q data are shown. The corresponding dynamicsusceptibilities presented in the insets show complex, highlyheterogeneous microscopic dynamics, as evidenced by theabsence of maxima in the susceptibility spectra, which defies thestandard data fitting approach that relies on susceptibilitymaxima to extract the characteristic relaxation times. Thecomplex character of the toluene solvent relaxations corrobo-rates our earlier discussion of elastic intensity temperaturedependence demonstrating inadequacy of a single relaxationcomponent (even stretched) for description of toluene.However, from model-independent observation of data inFigure 4, we conclude that the Q-dependence of the scatteringspectra changes qualitatively somewhere between 257 and 297K, as evidenced by the crossing of the low-Q and high-Qspectra in Figure 4 at high, but not low, temperatures. Below257 K, the low-Q and high-Q signal wings exhibit a similarwidth, though the wing intensity is higher at high Q. Above 257K, the high-Q spectra are broader than the low-Q spectra,leading to spectra crossing, as corroborated by crossing in the
susceptibility plots shown in the insets. Together with the Q-dependent signal intensity, the Q-independent signal width atlow temperatures is indicative of the localized diffusion.34 Onthe other hand, the Q-dependent signal width at hightemperatures indicates long-range translational diffusion.34
Thus, despite the onset of apparent anharmonicity evident inthe bottom panel of Figure 2 already at a low temperature(comparable with the glass-transition temperature of bulktoluene of 117 K), the diffusion of the adsorbed toluene doesnot become translational until the temperature reaches the257−297 K range. This solvent behavior is reminiscent ofhydration water in an inorganic system, which does not becometranslationally mobile until 240−250 K, despite starting toexhibit localized diffusion at much lower temperatures.1
Besides, this suggests that only the high-temperature, but notthe low-temperature, relaxation process in toluene visible in theelastic intensity in Figure 3 above ca. 300 K is associated withpronounced translational mobility.MD simulations allow separation of the atomic mean-
squared displacements into the center-of-mass (com) andinternal (int) contributions, ⟨u2⟩ = ⟨ucom
2⟩ + ⟨uint2⟩, for the
toluene molecules and the styrene monomers. This enablesassessment of their relative importance through differenttemperature ranges. The results of such analysis are presentedin Figure 5 for the same solvent-level sample of h = 0.44.Expectedly, the relative contribution of ⟨ucom
2⟩ is highest for thebackbone dynamics (solid blue line), represented in theexperiments by PS-d5−toluene-d8 samples. Toluene dynamics,represented in the experiments by PS-d8−toluene-d3 samples,expectedly shows the lowest relative contribution of ⟨ucom
2⟩
Figure 4. Temperature dependence of the scattering intensity fromPS-d8-toluene-d3, h = 0.44, measured at Q = 0.5 Å−1 (pink symbols)and Q = 1.7 Å−1 (cyan symbols). For comparison, the spectrameasured at 10 K are shown with solid lines of the same colors. Insets:log−log plots of the scattering intensities converted to dynamicsusceptibilities, χ″(E) = I(Q, E)/nb(E), where nb(E) is the thermalBose factor.
The Journal of Physical Chemistry B Article
DOI: 10.1021/acs.jpcb.6b00866J. Phys. Chem. B 2016, 120, 3232−3239
3236
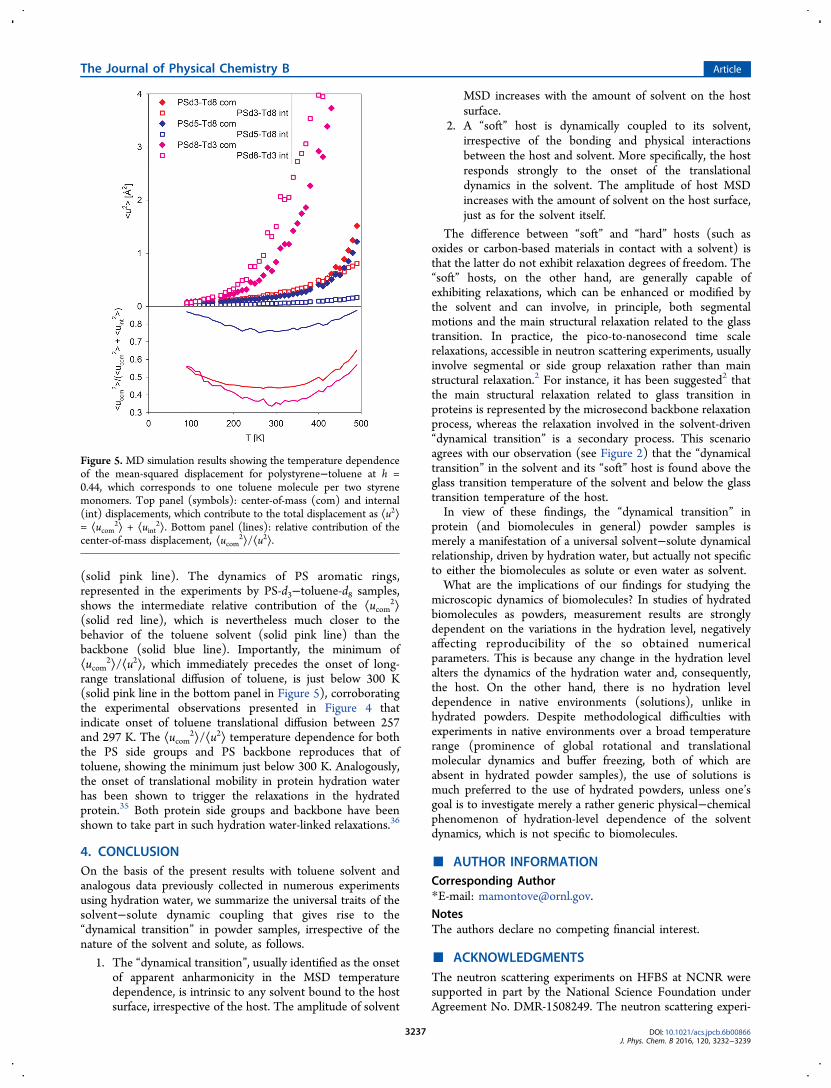
(solid pink line). The dynamics of PS aromatic rings,represented in the experiments by PS-d3−toluene-d8 samples,shows the intermediate relative contribution of the ⟨ucom
2⟩(solid red line), which is nevertheless much closer to thebehavior of the toluene solvent (solid pink line) than thebackbone (solid blue line). Importantly, the minimum of⟨ucom
2⟩/⟨u2⟩, which immediately precedes the onset of long-range translational diffusion of toluene, is just below 300 K(solid pink line in the bottom panel in Figure 5), corroboratingthe experimental observations presented in Figure 4 thatindicate onset of toluene translational diffusion between 257and 297 K. The ⟨ucom
2⟩/⟨u2⟩ temperature dependence for boththe PS side groups and PS backbone reproduces that oftoluene, showing the minimum just below 300 K. Analogously,the onset of translational mobility in protein hydration waterhas been shown to trigger the relaxations in the hydratedprotein.35 Both protein side groups and backbone have beenshown to take part in such hydration water-linked relaxations.36
4. CONCLUSIONOn the basis of the present results with toluene solvent andanalogous data previously collected in numerous experimentsusing hydration water, we summarize the universal traits of thesolvent−solute dynamic coupling that gives rise to the“dynamical transition” in powder samples, irrespective of thenature of the solvent and solute, as follows.
1. The “dynamical transition”, usually identified as the onsetof apparent anharmonicity in the MSD temperaturedependence, is intrinsic to any solvent bound to the hostsurface, irrespective of the host. The amplitude of solvent
MSD increases with the amount of solvent on the hostsurface.
2. A “soft” host is dynamically coupled to its solvent,irrespective of the bonding and physical interactionsbetween the host and solvent. More specifically, the hostresponds strongly to the onset of the translationaldynamics in the solvent. The amplitude of host MSDincreases with the amount of solvent on the host surface,just as for the solvent itself.
The difference between “soft” and “hard” hosts (such asoxides or carbon-based materials in contact with a solvent) isthat the latter do not exhibit relaxation degrees of freedom. The“soft” hosts, on the other hand, are generally capable ofexhibiting relaxations, which can be enhanced or modified bythe solvent and can involve, in principle, both segmentalmotions and the main structural relaxation related to the glasstransition. In practice, the pico-to-nanosecond time scalerelaxations, accessible in neutron scattering experiments, usuallyinvolve segmental or side group relaxation rather than mainstructural relaxation.2 For instance, it has been suggested2 thatthe main structural relaxation related to glass transition inproteins is represented by the microsecond backbone relaxationprocess, whereas the relaxation involved in the solvent-driven“dynamical transition” is a secondary process. This scenarioagrees with our observation (see Figure 2) that the “dynamicaltransition” in the solvent and its “soft” host is found above theglass transition temperature of the solvent and below the glasstransition temperature of the host.In view of these findings, the “dynamical transition” in
protein (and biomolecules in general) powder samples ismerely a manifestation of a universal solvent−solute dynamicalrelationship, driven by hydration water, but actually not specificto either the biomolecules as solute or even water as solvent.What are the implications of our findings for studying the
microscopic dynamics of biomolecules? In studies of hydratedbiomolecules as powders, measurement results are stronglydependent on the variations in the hydration level, negativelyaffecting reproducibility of the so obtained numericalparameters. This is because any change in the hydration levelalters the dynamics of the hydration water and, consequently,the host. On the other hand, there is no hydration leveldependence in native environments (solutions), unlike inhydrated powders. Despite methodological difficulties withexperiments in native environments over a broad temperaturerange (prominence of global rotational and translationalmolecular dynamics and buffer freezing, both of which areabsent in hydrated powder samples), the use of solutions ismuch preferred to the use of hydrated powders, unless one’sgoal is to investigate merely a rather generic physical−chemicalphenomenon of hydration-level dependence of the solventdynamics, which is not specific to biomolecules.
■ AUTHOR INFORMATIONCorresponding Author*E-mail: [email protected] authors declare no competing financial interest.
■ ACKNOWLEDGMENTSThe neutron scattering experiments on HFBS at NCNR weresupported in part by the National Science Foundation underAgreement No. DMR-1508249. The neutron scattering experi-
Figure 5. MD simulation results showing the temperature dependenceof the mean-squared displacement for polystyrene−toluene at h =0.44, which corresponds to one toluene molecule per two styrenemonomers. Top panel (symbols): center-of-mass (com) and internal(int) displacements, which contribute to the total displacement as ⟨u2⟩= ⟨ucom
2⟩ + ⟨uint2⟩. Bottom panel (lines): relative contribution of the
center-of-mass displacement, ⟨ucom2⟩/⟨u2⟩.
The Journal of Physical Chemistry B Article
DOI: 10.1021/acs.jpcb.6b00866J. Phys. Chem. B 2016, 120, 3232−3239
3237

ments on BASIS at SNS were supported by the Scientific UserFacilities Division, Office of Basic Energy Sciences, U.S.Department of Energy. J.M.B. is supported by the Center forAccelerating Materials Modeling (CAMM) funded by the U.S.Department of Energy, Basic Energy Sciences, MaterialSciences and Engineering Division under FWP-3ERKCSNL.This manuscript has been authored by UT-Battelle, LLC underContract No. DE-AC05-00OR22725 with the U.S. Departmentof Energy. The United States Government retains and thepublisher, by accepting the article for publication, acknowledgesthat the United States Government retains a nonexclusive, paid-up, irrevocable, worldwide license to publish or reproduce thepublished form of this manuscript, or allow others to do so, forUnited States Government purposes. The Department ofEnergy will provide public access to these results of federallysponsored research in accordance with the DOE Public AccessPlan (http://energy.gov/downloads/doe-public-access-plan).Certain commercial material suppliers are identified in thispaper to foster understanding. Such identification does notimply recommendation or endorsement by the NationalInstitute of Standards and Technology, nor does it imply thatthe materials or equipment identified are necessarily the bestavailable for the purpose. The authors declare no competingfinancial interests.
■ REFERENCES(1) Mamontov, E.; Chu, X. Water-Protein Dynamic Coupling andNew Opportunities for Probing It at Low to Physiological Temper-atures in Aqueous Solutions. Phys. Chem. Chem. Phys. 2012, 14,11573−11588.(2) Khodadadi, S.; Sokolov, A. P. Protein Dynamics: From Rattling ina Cage to Structural Relaxation. Soft Matter 2015, 11, 4984−4998.(3) Fenimore, P. W.; Frauenfelder, H.; McMahon, B. H.; Parak, F. G.Slaving: Solvent Fluctuations Dominate Protein Dynamics andFunctions. Proc. Natl. Acad. Sci. U. S. A. 2002, 99, 16047−16051.(4) Fenimore, P. W.; Frauenfelder, H.; McMahon, B. H.; Young, R.D. Bulk-Solvent and Hydration-Shell Fluctuations, Similar to α- and β-Fluctuations in Glasses, Control Protein Motions and Functions. Proc.Natl. Acad. Sci. U. S. A. 2004, 101, 14408−14413.(5) Frauenfelder, H.; Chen, G.; Berendzen, J.; Fenimore, P. W.;Jansson, H.; McMahon, B. H.; Stroe, I. R.; Swenson, J.; Young, R. D. AUnified Model of Protein Dynamics. Proc. Natl. Acad. Sci. U. S. A.2009, 106, 5129−5134.(6) Doster, W.; Settles, M. Protein-Water Displacements Distribu-tions. Biochim. Biophys. Acta, Proteins Proteomics 2005, 1749, 173−186.(7) Khodadadi, S.; Roh, J. H.; Kisliuk, A.; Mamontov, E.; Tyagi, M.;Woodson, S. A.; Briber, R. M.; Sokolov, A. P. Dynamics of BiologicalMacromolecules: Not a Simple Slaving by Hydration Water. Biophys. J.2010, 98, 1321−1326.(8) Doster, W.; Cusack, S.; Petry, W. Dynamical Transition ofMyoglobin Revealed By Inelastic Neutron Scattering. Nature (London,U. K.) 1989, 337, 754−756.(9) Doster, W. The Two-Step Scenario of the Protein DynamicalTransition. J. Non-Cryst. Solids 2011, 357, 622−628.(10) Colmenero, J.; Arbe, A. Recent Progress on Polymer Dynamicsby Neutron Scattering: From Simple Polymers to Complex Materials.J. Polym. Sci., Part B: Polym. Phys. 2013, 51, 87−113.(11) Sacquin-Mora, S.; Sebban, P.; Derrien, V.; Frick, B.; Lavery, R.;Alba-Simionesco, C. Probing the Flexibility of the Bacterial ReactionCenter: The Wild-Type Protein is More Rigid than Two Site-SpecificMutants. Biochemistry 2007, 46, 14960−14968.(12) He, Y.; Ku, P. I.; Knab, J. R.; Chen, J. Y.; Markelz, A. G. ProteinDynamical Transition Does Not Require Protein Structure. Phys. Rev.Lett. 2008, 101, 178103.
(13) Mamontov, E.; O’Neill, H.; Zhang, Q. Mean-Squared AtomicDisplacements in Hydrated Lysozyme, Native and Denatured. J. Biol.Phys. 2010, 36, 291−297.(14) Schiro, G.; Caronna, C.; Natali, F.; Koza, M. M.; Cupane, A.The “Protein Dynamical Transition” Does Not Require the ProteinPolypeptide Chain. J. Phys. Chem. Lett. 2011, 2, 2275−2279.(15) Mamontov, E.; Vlcek, L.; Wesolowski, D. J.; Cummings, P. T.;Rosenqvist, J.; Wang, W.; Cole, D. R.; Anovitz, L. M.; Gasparovic, G.Suppression of the Dynamic Transition in Surface Water at LowHydration Levels: A Study of Water on Rutile. Phys. Rev. E 2009, 79,051504.(16) Mamontov, E.; O’Neill, H.; Zhang, Q.; Wang, W.; Wesolowski,D. J. Common Features in the Microscopic Dynamics of HydrationWater on Organic and Inorganic Surfaces. J. Phys.: Condens. Matter2012, 24, 064104.(17) Bertrand, C. E.; Liu, K.-H.; Mamontov, E.; Chen, S.-H.Hydration-Dependent Dynamics of Deeply Cooled Water underStrong Confinement. Phys. Rev. E 2013, 87, 042312.(18) Roh, J. H.; Briber, R. M.; Damjanovic, A.; Thirumalai, D.;Woodson, S. A.; Sokolov, A. P. Dynamics of tRNA at Different Levelsof Hydration. Biophys. J. 2009, 96, 2755−2762.(19) Wang, Z.; Fratini, E.; Li, M.; Le, P.; Mamontov, E.; Baglioni, P.;Chen, S.-H. Hydration-Dependent Dynamic Crossover Phenomenonin Protein Hydration Water. Phys. Rev. E 2014, 90, 042705.(20) Meyer, A.; Dimeo, R. M.; Gehring, P. M.; Neumann, D. A. TheHigh Flux Backscattering Spectrometer at the NIST Center forNeutron Research. Rev. Sci. Instrum. 2003, 74, 2759−2777.(21) Mamontov, E.; Herwig, K. W. A Time-of-Flight BackscatteringSpectrometer at the Spallation Neutron Source, BASIS. Rev. Sci.Instrum. 2011, 82, 085109.(22) Inc., A. S. Discovery Studio Modeling Environment, 4.0;Accelrys Software Inc.: San Diego, CA, 2013.(23) Dauberosguthorpe, P.; Roberts, V. A.; Osguthorpe, D. J.; Wolff,J.; Genest, M.; Hagler, A. T. Structure and Energetics of Ligand-Binding to Proteins - Escherichia-Coli Dihydrofolate ReductaseTrimethoprim, a Drug-Receptor System. Proteins: Struct., Funct.,Genet. 1988, 4, 31−47.(24) Plimpton, S. Fast Parallel Algorithms for Short-RangeMolecular-Dynamics. J. Comput. Phys. 1995, 117, 1−19.(25) Lindner, B.; Smith, J. C. Sassena - X-ray and Neutron ScatteringCalculated from Molecular Dynamics Trajectories using MassivelyParallel Computers. Comput. Phys. Commun. 2012, 183, 1491−1501.(26) Arnold, O.; Bilheux, J. C.; Borreguero, J. M.; Buts, A.; Campbell,S. I.; Chapon, L.; Doucet, M.; Draper, N.; Ferraz Leal, R.; Gigg, M. A.;Lynch, V. E.; Markvardsen, A.; Mikkelson, D. J.; Mikkelson, R. L.;Miller, R.; Palmen, K.; Parker, P.; Passos, G.; Perring, T. G.; Peterson,P. F.; Ren, S.; Reuter, M. A.; Savici, A. T.; Taylor, J. W.; Taylor, R. J.;Tolchenov, R.; Zhou, W.; Zikovsky, J. MantidData Analysis andVisualization Package for Neutron Scattering and SR Experiments.Nucl. Instrum. Methods Phys. Res., Sect. A 2014, 764, 156−166.(27) Roe, D. R.; Cheatham, T. E. PTRAJ and CPPTRAJ: Softwarefor Processing and Analysis of Molecular Dynamics Trajectory Data. J.Chem. Theory Comput. 2013, 9, 3084−3095.(28) Nguyen, H. Python front-end of cpptraj: a data analysis packagefor biomolecular simulation. https://github.com/Amber-MD/pytraj(accessed June 4, 2015).(29) Doster, W.; Nakagawa, H.; Appavou, M. S. Scaling Analysis ofBio-Molecular Dynamics Derived from Elastic Incoherent NeutronScattering Experiments. J. Chem. Phys. 2013, 139, 045105.(30) Kawaguchi, T.; Kanaya, T.; Kaji, K. Fast Relaxations ofAmorphous Polystyrene. Phys. B 1995, 213-214, 510−512.(31) Kanaya, T.; Kawaguchi, T.; Kaji, K. Fast Process of AmorphousPolystyrene Below and Above the Glass transition Temperature Tg asStudied by Quasielastic Neutron Scattering. J. Chem. Phys. 1996, 104,3841−3850.(32) Arrese-Igor, S.; Arbe, A.; Frick, B.; Colmenero, J. GlassyDynamics of Polystyrene by Quasielastic Neutron Scattering. Macro-molecules 2011, 44, 3161−3168.
The Journal of Physical Chemistry B Article
DOI: 10.1021/acs.jpcb.6b00866J. Phys. Chem. B 2016, 120, 3232−3239
3238

(33) Inoue, R.; Kanaya, T.; Nishida, K.; Tsukushi, I.; Shibata, K. Low-Energy Excitations and the Fast Process of Polystyrene ThinSupported Films Studied by Inelastic and Quasielastic NeutronScattering. Phys. Rev. E 2006, 74, 021801.(34) Bee, M. Quasielastic Neutron Scattering; Hilger: Bristol, England,1988.(35) Schiro, G.; Fichou, Y.; Gallat, F.-X.; Wood, K.; Gabel, F.;Moulin, M.; Hartlein, M.; Heyden, M.; Colletier, J.-P.; Orecchini, A.;Paciaroni, A.; Wuttke, J.; Tobias, D. J.; Weik, M. TranslationalDiffusion of Hydration Water Correlates with Functional Motions inFolded and Intrinsically Disordered Proteins. Nat. Commun. 2015, 6,6490.(36) Schiro, G.; Caronna, C.; Natali, F.; Cupane, A. Direct Evidenceof the Amino Acid Side Chain and Backbone Contributions to ProteinAnharmonicity. J. Am. Chem. Soc. 2010, 132, 1371−1376.
The Journal of Physical Chemistry B Article
DOI: 10.1021/acs.jpcb.6b00866J. Phys. Chem. B 2016, 120, 3232−3239
3239


![1 Protein Protein Interactions: An Overview · ADF/cofilin and profilin [10]. Biological (surface) recognition, like in the immune Biological (surface) recognition, like in the](https://static.fdocuments.net/doc/165x107/5b618dcc7f8b9a08478c7338/1-protein-protein-interactions-an-overview-adfcolin-and-prolin-10.jpg)