Protein digestion and peptide mass fingerprint (PMF) analysis Yuanming Luo Institute of...
60
Protein digestion and peptide mass fingerprint (PMF) analysis Yuanming Luo Institute of Microbiology,CAS
-
date post
20-Dec-2015 -
Category
Documents
-
view
222 -
download
2
Transcript of Protein digestion and peptide mass fingerprint (PMF) analysis Yuanming Luo Institute of...

Protein digestion and peptide mass fingerprint
(PMF) analysis
Yuanming LuoInstitute of Microbiology,CAS

Protein digestion
In gel digestion
On-membrane digestion
In solution digestion

Two main approaches for digesting gel-separated proteins Protein blotting onto immobilizing me
mbranes followed by on-membrane digestion (simpson et al., 1989; Gevaert and Vandekerckhove 2000)
Digesting proteins directly in the gel matrix and extracting the peptides (Ward et al., 1990)
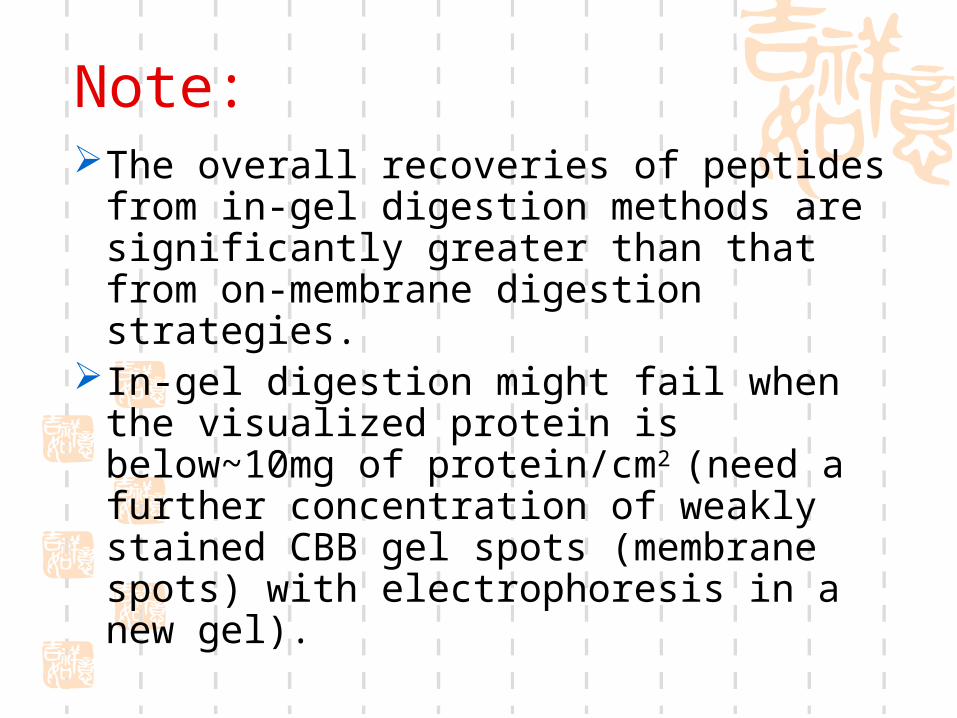
Note:The overall recoveries of peptides
from in-gel digestion methods are significantly greater than that from on-membrane digestion strategies.
In-gel digestion might fail when the visualized protein is below~10mg of protein/cm2 (need a further concentration of weakly stained CBB gel spots (membrane spots) with electrophoresis in a new gel).

In gel digestion1. Excise the protein gel spots of interest
and place in microfuge tube.2. Remove excess CBB by washing twice
with 1 ml of either 0.1 M NH4HCO3, 50% acetonitrile.
3. Dry each gel piece completely by speed Vac. The gel piece should not stick to the walls of the EP tube when completely dry.
In gel digestion (continued)
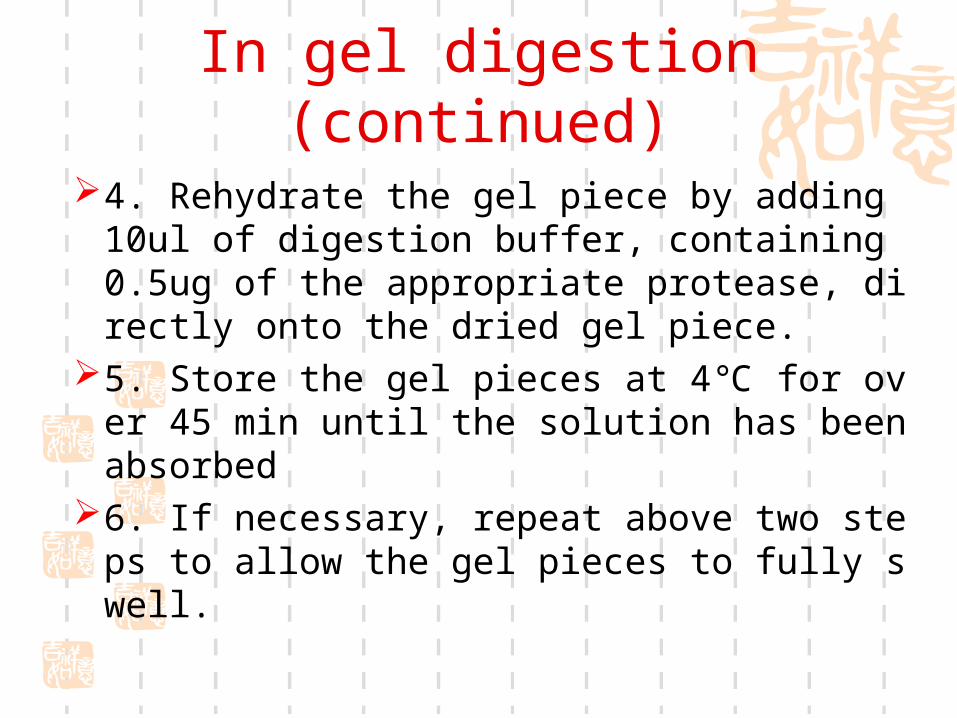
4. Rehydrate the gel piece by adding 10ul of digestion buffer, containing 0.5ug of the appropriate protease, directly onto the dried gel piece.
5. Store the gel pieces at 4℃ for over 45 min until the solution has been absorbed
6. If necessary, repeat above two steps to allow the gel pieces to fully swell.
In gel digestion (continued)
7. Add 20 ul of digestion buffer without protease to fully immerse the gel piece.
8. Incubate for 12-16 hours at 37 ℃.9. Carefully remove the digestion buffer
(now called the extract), and place it into a clean microfuge tube.
The digestion buffer contains > 80% of the extractable peptides10. Add 200 ul of 5 %TFA/50% acetonitri
le to the gel piece.
In gel digestion (continued)
11. Incubate the tube with the gel piece for 1 hour at room temparature(37 ℃).
12. Carefully remove the extract away from the gel piece and combine it with previous extract from step 9.
Repeat step 10,11,12 once again.Concentrate the pooled extracts by speed
Vac. Store the peptide extracts at -20 ℃ for future mass spectrometric analysis.
In gel digestion of silver-stained gels
Most of the steps of in gel digestion for silver-stained gels are the same except for the destaining solution which was prepared by mixing 30 mM potassium ferricyanide with 100 mM sodium thiosulfate (1:1 v/v).

On-membrane proteolytic digestion of electroblotted proteins
Proposed membranes are nitrocellulose membranes, because the hydrophobic surface of PVDF limits the recovery of peptide fragments.
Proposed dyes are Amido Black and Ponceau S, which are compatible with proteolytic digestion, peptide extraction from membrane and subsequent RP-HPLC analysis of peptides.

Electroblotting of staining the protein
1. electroblot the proteins from the gel onto a nitrocellulose (for proteins that are difficult to transfer, add up to 0.005% SDS)
2. stain the membrane with either Amido Black or Ponceau S.
E.g., for staining with Amido Black A. immerse the nitrocellulose membrane in 0.
1% Amido Black 10B for 1-3 minutes B. Rapidly destain with several washes of H2O/
acetic acid/ methanol.

Electroblotting of staining the protein (continued)
C. Rinse the destained blots thoroughly with deionized H2O to remove any excess acetic acid.
D. cut out the stained protein band (or for 2D gel spots, up to 40 spots from identical gels may be required) and transfer these bands to 1.5-ml microfuge tubes for immediate processing (begin with step 3) or for storage at -20℃.

For staining with Ponceau S A. Immerse the nitrocellulose membrane in 0.
1% Ponceau S for 1 minute. B. Gently agitate the blot for 1-3 min in 1% ace
tic acid to remove excess stain. C. Cut out the protein bands of interest and tr
ansfer them to microfuge tubes. D.Destain the protein bands by washing the m
embrane pieces with 200 mM NaOH for 1-2 min.
E. Wash the membrane pieces with deionized H2O and process them immediately or store them wet at -20℃(avoid excessive drying).

Digestion of the membrane-bound proteins
3. Add 1.2 ml of 0.5% (w/v) PVP-40 (which is used to prevent absorption of the protease to the nitrocellulose during digestion) in 100 mM acetic acid to each tube.
4. Incubate the tube for 30 min at 37 ℃.5. Centrifuge the tube at ~1000g for 5 min.6. Remove the supernatant solution and
discard.
7. Add ~1ml of H2O to the tube.(It is essential to remove excess PVP-40 before peptide mapping because of the strong UV absorbance of this detergent. Moreover, breakdown products of PVP-40 produce major contaminant peaks in ESI-MS)
8. Votex the tube for 5 seconds. 9. repeat step 5 and 6. 10. repeat steps 7-9 five more times. 11. cut the nitrocellulose strips into sma
ll pieces (~1x1mm) and place them in a fresh tube (0.5- or a 0.2-ml tube).
Digestion of the membrane-bound protein (continued)
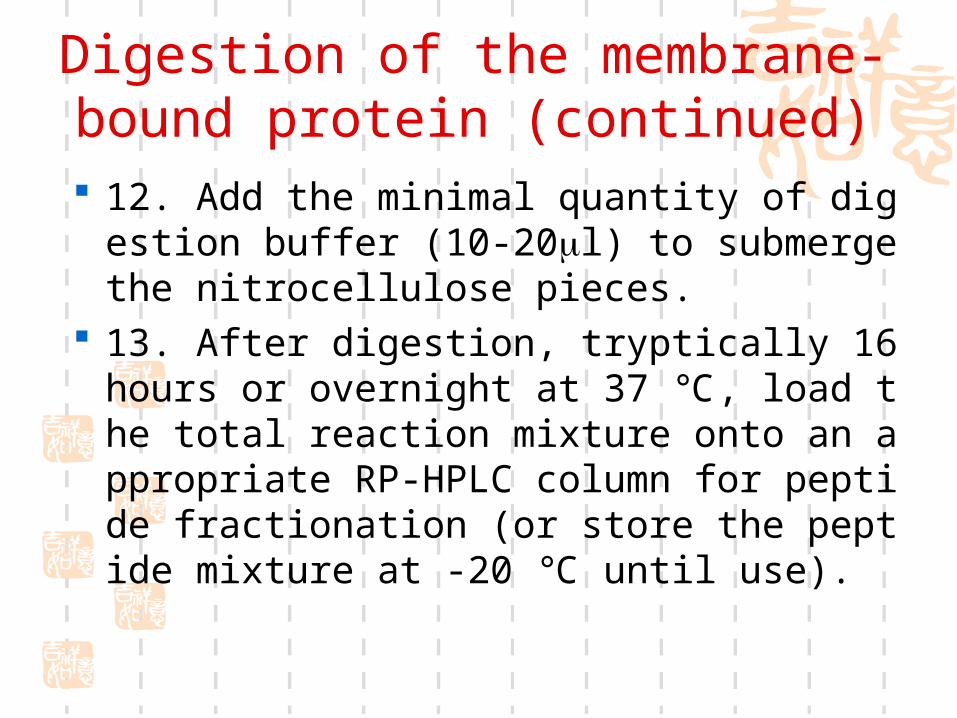
12. Add the minimal quantity of digestion buffer (10-20l) to submerge the nitrocellulose pieces.
13. After digestion, tryptically 16 hours or overnight at 37 ℃, load the total reaction mixture onto an appropriate RP-HPLC column for peptide fractionation (or store the peptide mixture at -20 ℃ until use).

In soltion digestion
Mass spectrometry involved in proteomics
Matrix-associated laser desorption ionization time of flight mass spectrometry (MALDI-TOF-MS)
Electrospray ionization (ESI) ion trap mass spetrometry
Surface-enhanced laser desorption ionization (SELDI) time of flight mass spetrometry (ProteinChip).
Linear and reflectron MALDI-TOF-MS
Linear MALDI-TOF-MS (lower accuracy)
Reflectron MALDI-TOF-MS: (1) higher accuracy, (2) Post-source decay (PSD), (3) delayed extraction

Mass spectrometry termsMass to charge (m/Z): Mass spectromete
rs measure the mass-to-charge values of molecular ions.
Resolution: resolution can be defined as the ability to separate and measure the masses of ions of similar, but not identical, molecular mass.
Signal to noise:Monoisotopic mass versus average mas
s:

What is the difference between monoisotopic and average peptide mass?
As shown in the table, below the atoms that make up the naturally occurring amino acids found in proteins are not isotopically pure.
Natural Abundance of Isotopes Commonly Found in Proteins
Atom Most Abundant Isotope Next Most Abundant Isotope
Carbon 12C 98.9% 13C 1.11%
Nitrogen 14N 99.6% 15N 0.366%
Oxygen 16O 99.8% 18O 0.204%
Sulfur 32S 95.0% 34S 4.22%

Deisotoped MALDI spectrum

Interpreting of the MSn spectra of peptides (AGFI)

Singly-charged peptide fragmentation

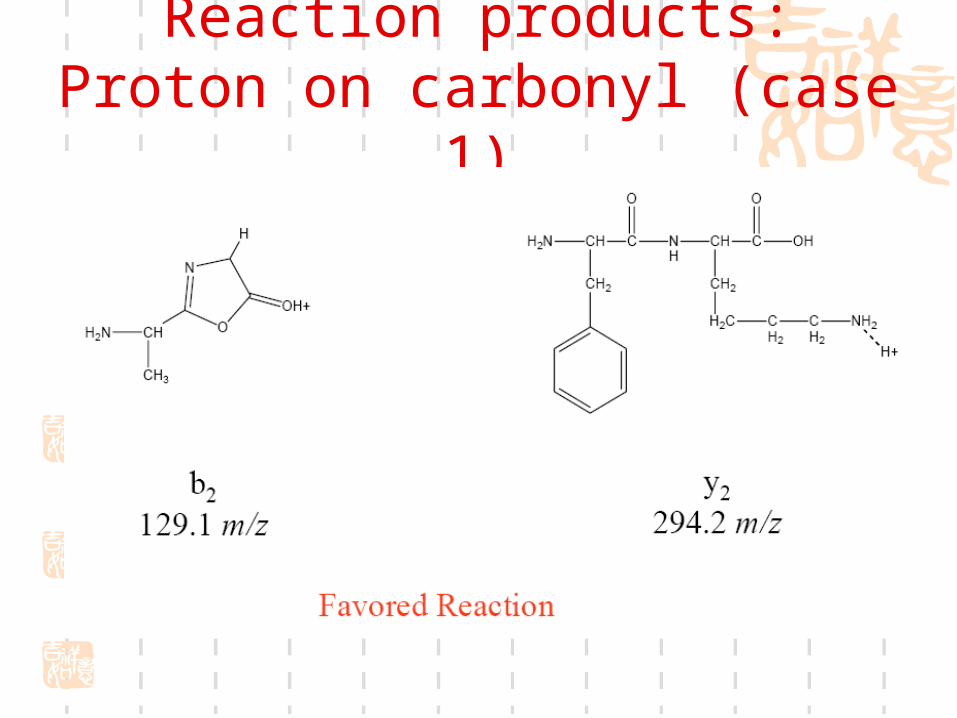
Reaction products: Proton on carbonyl (case 1)

Reaction products: Proton on amine (case 2)

Doubly-charged peptide fragmentation
Reaction products: Proton on carbonyl (case 1)
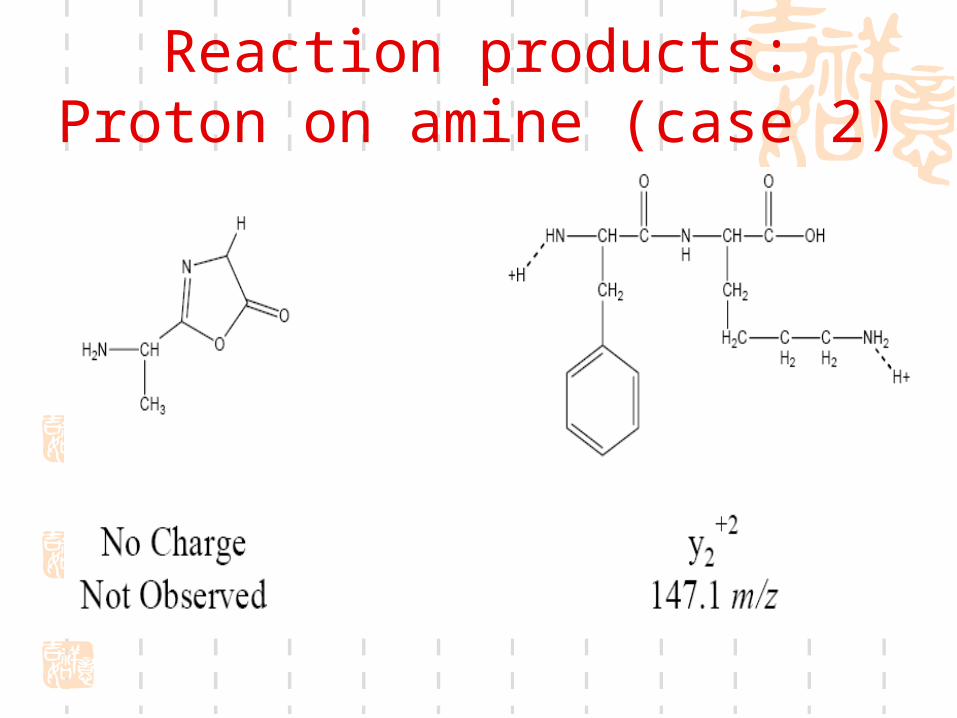
Reaction products: Proton on amine (case 2)

Where is the b1 ion? Why is the a2/b2 big?

Peptide mass fingerprint (PMF) analysis by MALDI-
TOF-MS

MALDI difficultiesSalts and other contaminantsSelection of matrixSample itselfCrystallizationCalibration (external or internal
cablibration)Accuracy (ppm)ResolutionAmount of protease
Dissolve the peptide mixture in 0.1%TFA.Desalt by ZipTip C18 microcolumn (opti
onal).Directly elute the peptide mixture with
-cyano-4-hydroxy cinnamic acid (CHCA) in 70% acetonitrile and spot the peptide mixture on sample plate.
The peptide mixtures cocrystallize with matrix on sample plate

Input of instrumental method and parameter setup
Calibration of spectrometer by external calibration
Crude spectrumTuning of parametersInternal calibration of PMF spectraData processing for database search

Peptide and protein standards
Angiotensin II (human) MW: 1046.2 Substance P (human) MW: 1347.7 Insulin (bovine) MW: 5733.6 Cytochrom c (equine) MW: 12,360.1
RNase A (bovine) MW: 13,682.2 Apo-Myoglobin (equine) MW: 16,951.5
Trypsinogen (bovine) MW: 23,980.9

Manually spot samples onto sample plate
Recrystallization methods for MALDI matrices
Method 1:Re-crystallization in 70% MeCN/30%
water.1.Heat a saturated solution of the
matrix in 70% MeCN/30% water until boiling.
2.Carefully boil until solid dissolves completely.
3.Cool to room temp, then on ice - precipitate should form.
4.Filter precipitate.

Recrystallization methods for MALDI matrices Method 2:
Protocol for re-crystallization of alpha-cyano-4-hyrdoxy-cinnamic acid
1.To 100mg of alpha-cyano-4-hydroxy-cinnamic acid, add 10ml of water
2.Add ammonium hydroxide until most of acid dissolves.
3.Slowly add concentrated HCl to the solution until a large amount of the acid has precipitated (about pH 2).
4.Remove the precipitate by centrifugation or filtering.
5.Wash the precipitate several times with 0.1M HCl.
6.Dry matrix and store at -20 C in the dark.
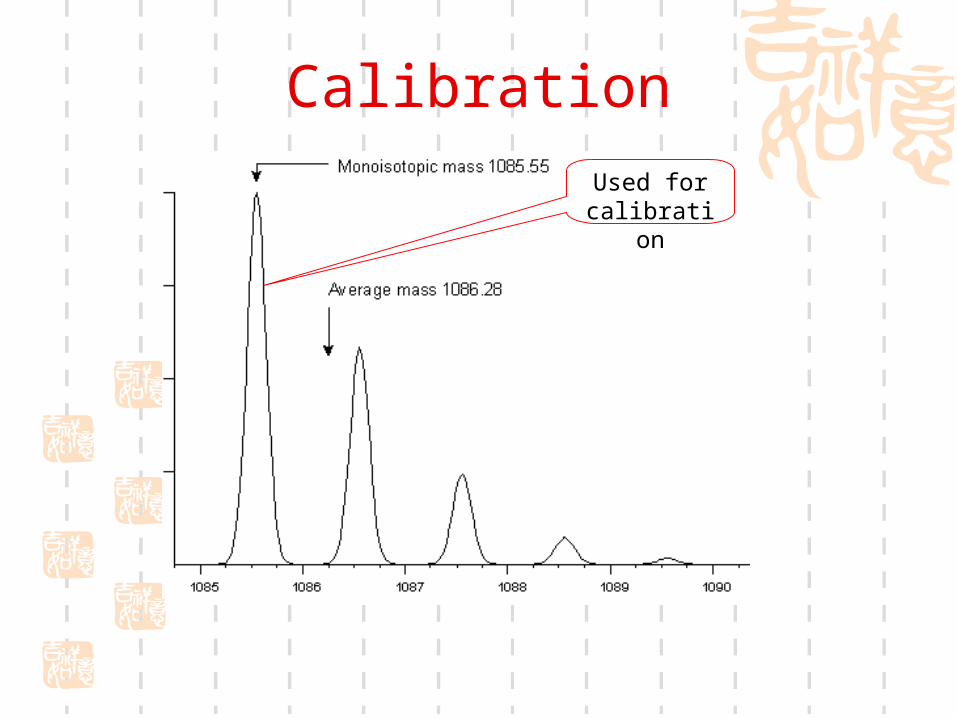
CalibrationUsed for
calibration
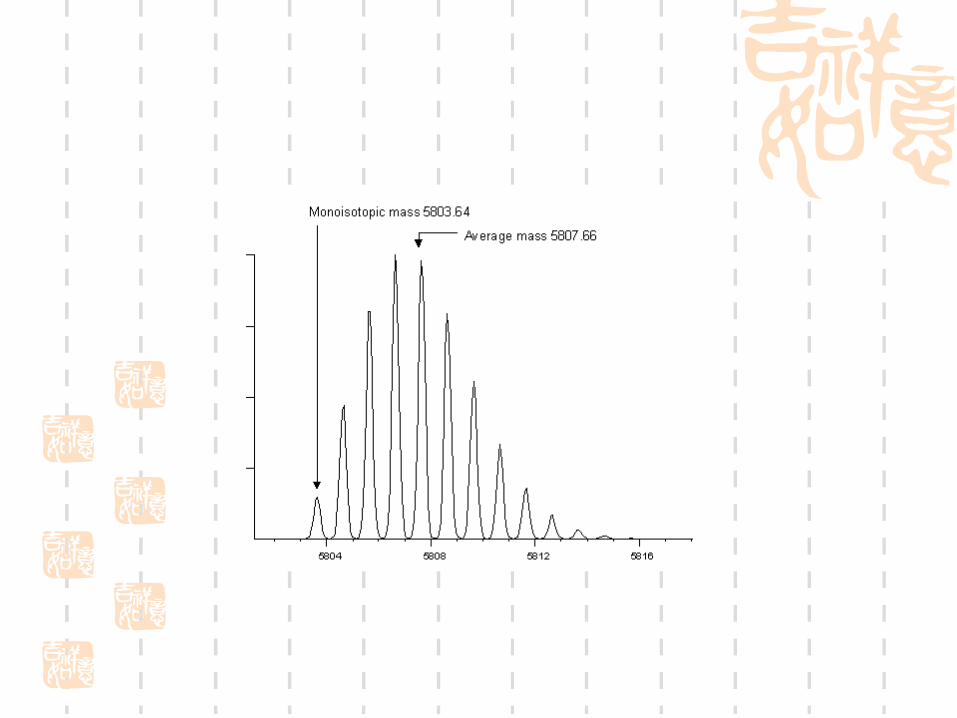
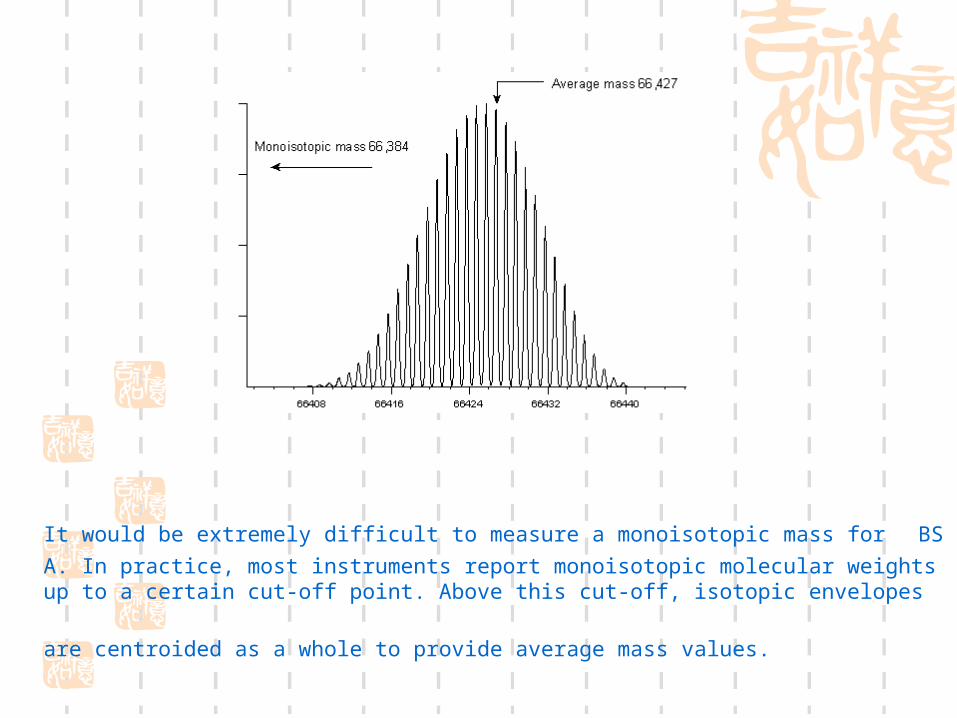
It would be extremely difficult to measure a monoisotopic mass for BSA. In practice, most instruments report monoisotopic molecular weights up to a certain cut-off point. Above this
cut-off, isotopic envelopes are centroided as a whole to provide average mass values.

Control the sample plate
CHCA
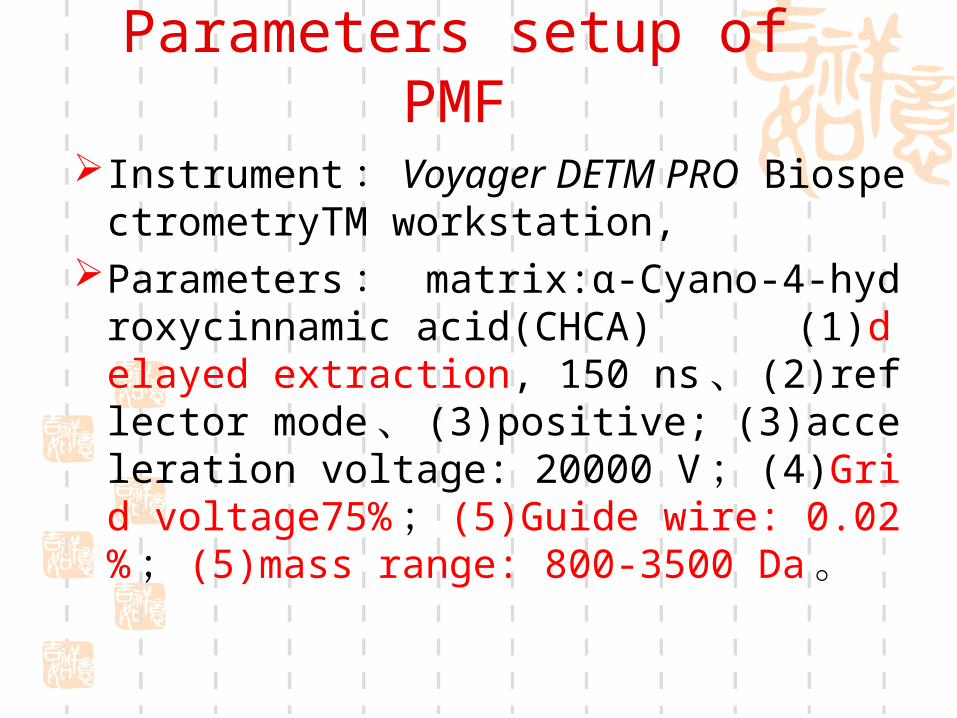
Parameters setup of PMF
Instrument : Voyager DETM PRO BiospectrometryTM workstation,
Parameters : matrix:α-Cyano-4-hydroxycinnamic acid(CHCA) (1)delayed extraction, 150 ns 、 (2)reflector mode 、(3)positive; (3)acceleration voltage: 20000 V ; (4)Grid voltage75% ; (5)Guide wire: 0.02% ; (5)mass range: 800-3500 Da 。

PMF containing isotope peaks
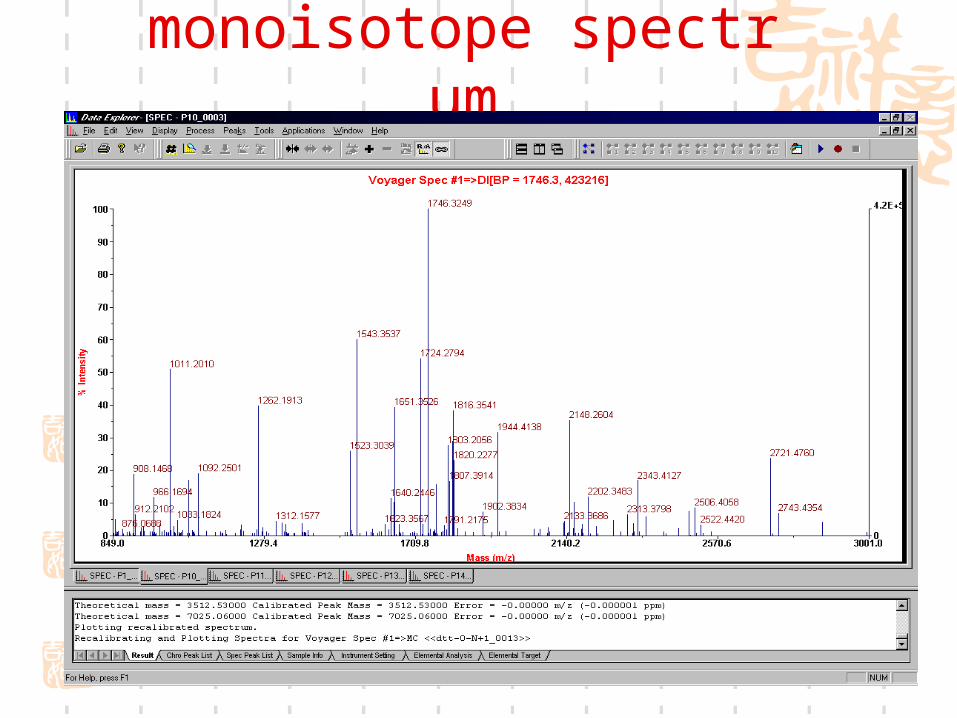
monoisotope spectrum
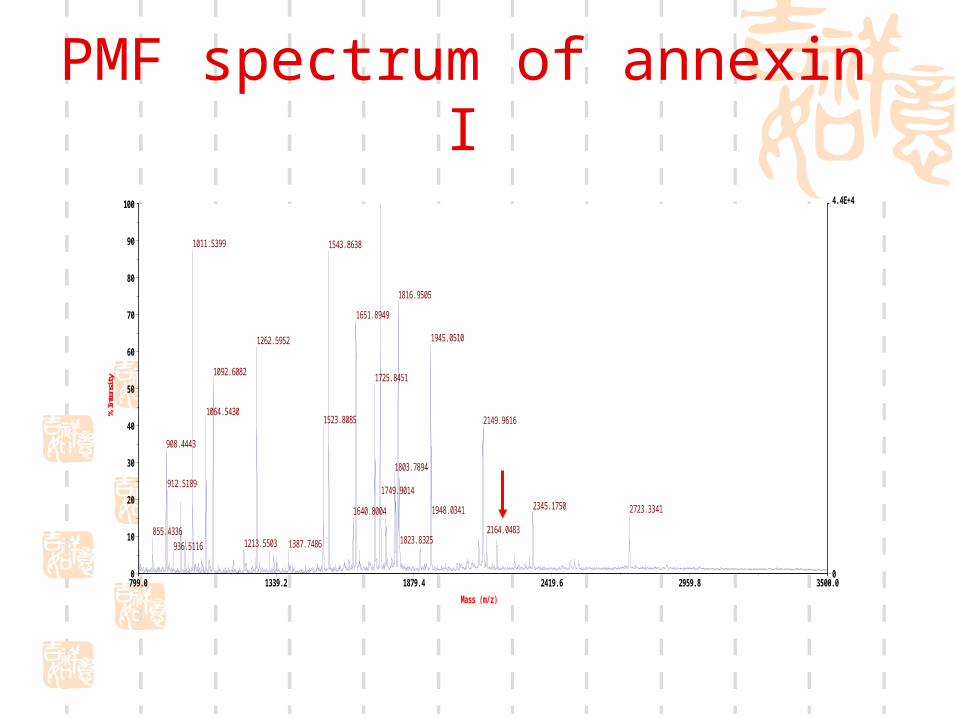
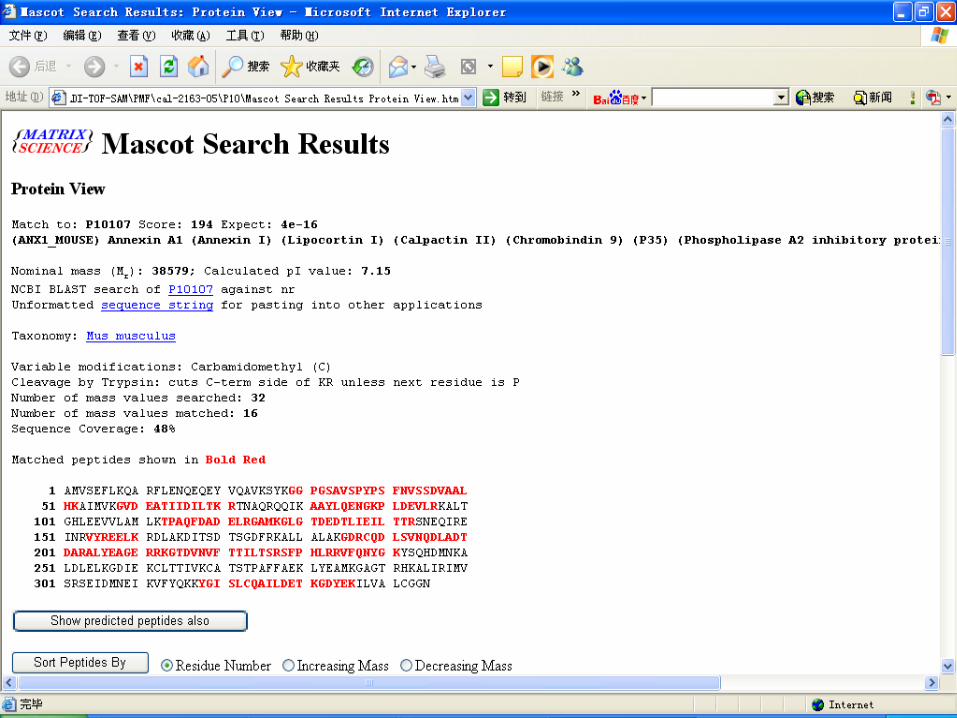
PMF spectrum of annexin I
799.0 1339.2 1879.4 2419.6 2959.8 3500.0
Mass (m/z)
0
4.4E+4
0
10
20
30
40
50
60
70
80
90
100
% In
tens
ity
Voyager Spec #1 MC=>BC=>NF0.7[BP = 1746.9, 43815]
1746.9067
1011.5399 1543.8638
1816.9505
1651.8949
1945.05101262.5952
1092.60821725.8451
1064.54301523.8085 2149.9616
908.4443
1803.7894
912.51891749.9014
2345.1750 2723.33411948.03411640.8004
2164.0483855.43361823.83251213.5503 1387.7486936.5116

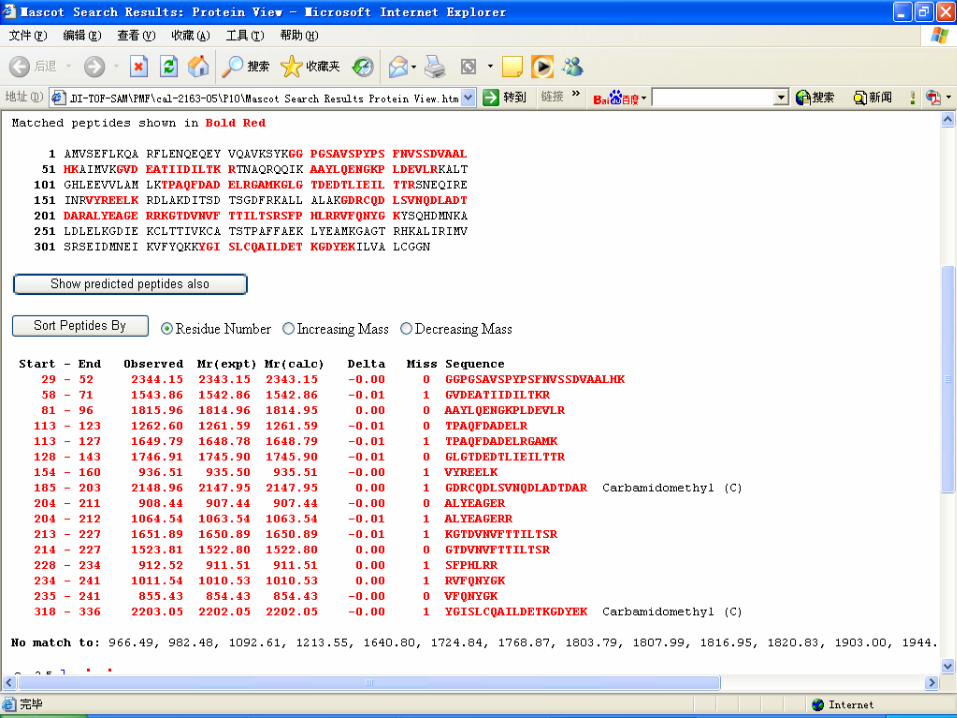
Mass list of annexin I (monoisotope)
1746.906727 1768.874981 1803.789401 1807.994050 1815.963445 1816.950528 1820.832451 1903.003019 1944.068873 1945.050987 2132.706314 2148.959052 2163.051584 2203.054533 2344.153915 2722.314675
855.433556908.444342912.518921936.511625966.487904982.4825241011.5399291064.5430381092.6082311213.5502971262.5951731523.8084511543.8637781640.8004351649.7892971651.8948761724.838185
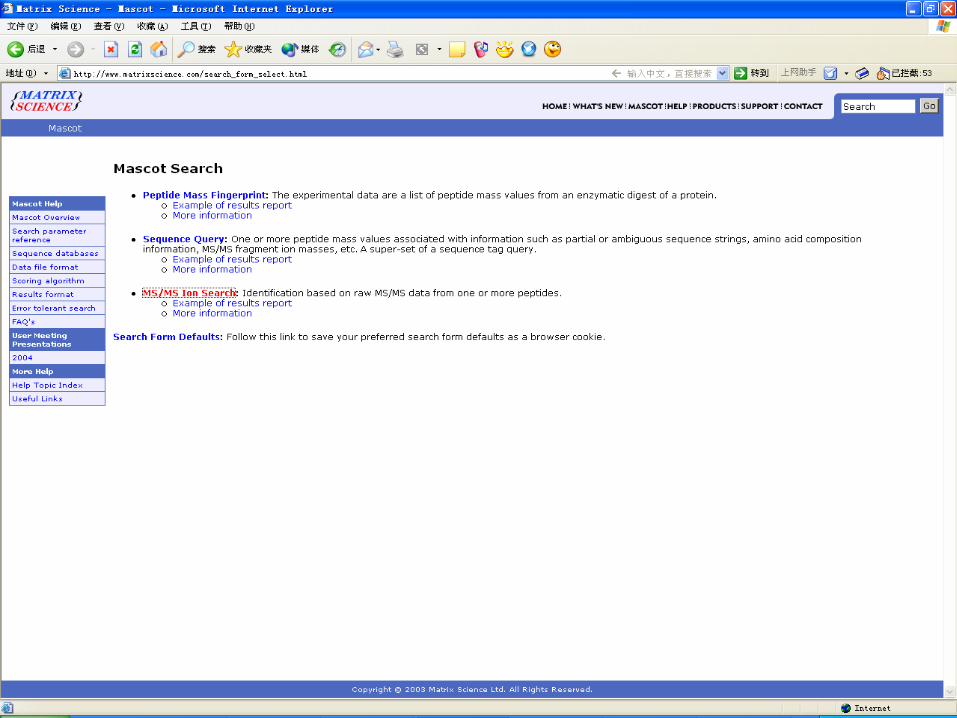

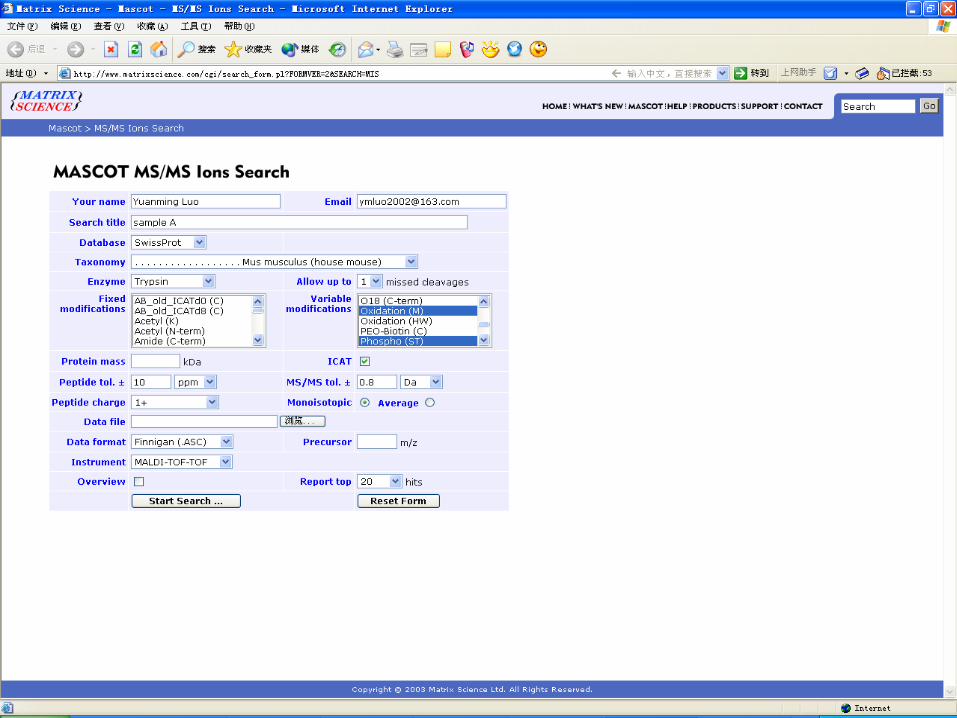
Database search by MASCOT
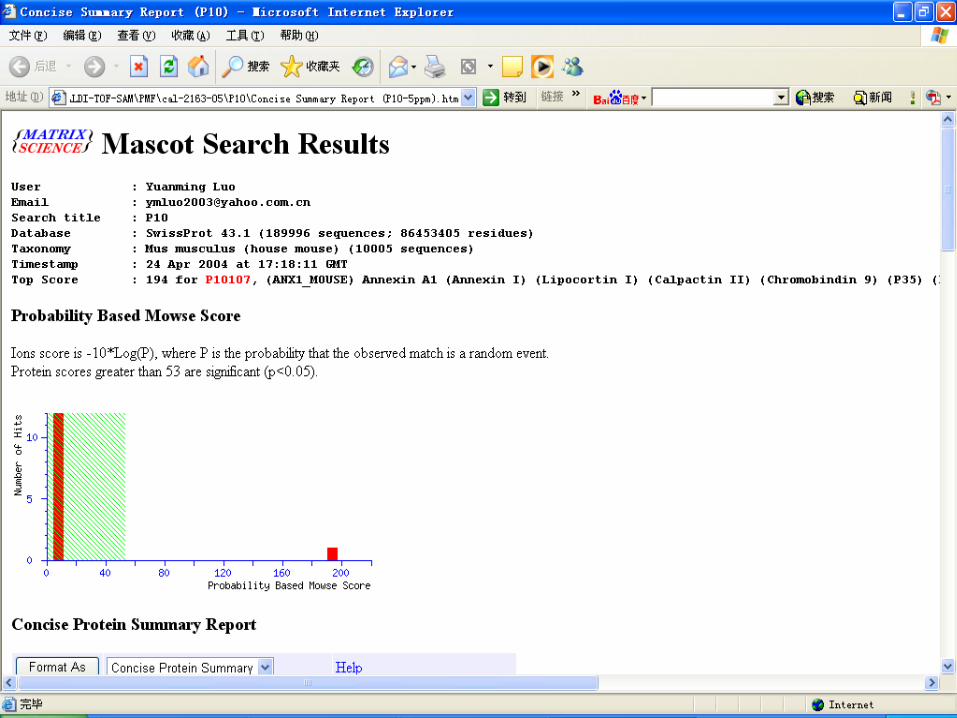

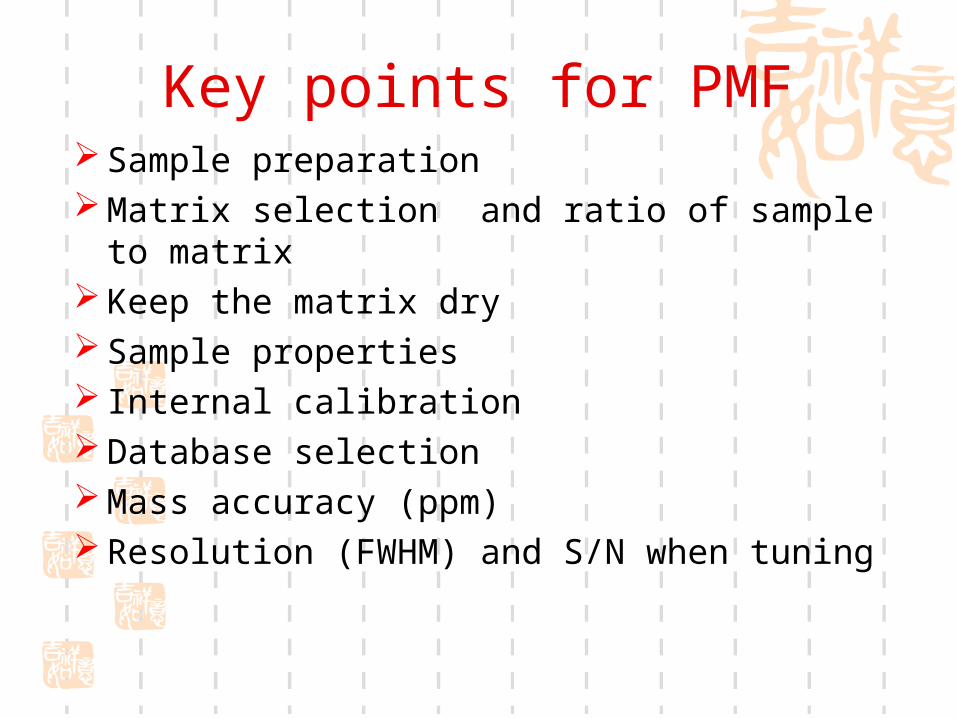
Key points for PMF Sample preparation Matrix selection and ratio of sample to matri
x Keep the matrix dry Sample properties Internal calibration Database selection Mass accuracy (ppm) Resolution (FWHM) and S/N when tuning

Practical consideration -The final molar ratio sample/matrix is about
or around 1/5000. -Final concentration of the sample is from 1 to
10 pmol/ul -Our experience with MALDI point to a dynami
c range of 100 fmol/ul to few hundreds pmol/ul
-MALDI is relatively robust ionization technique that tolerates the use of salts and surfactants and buffers. Although it is best to remove them for better performance.

Theoretical digestion for PTM identification analysis
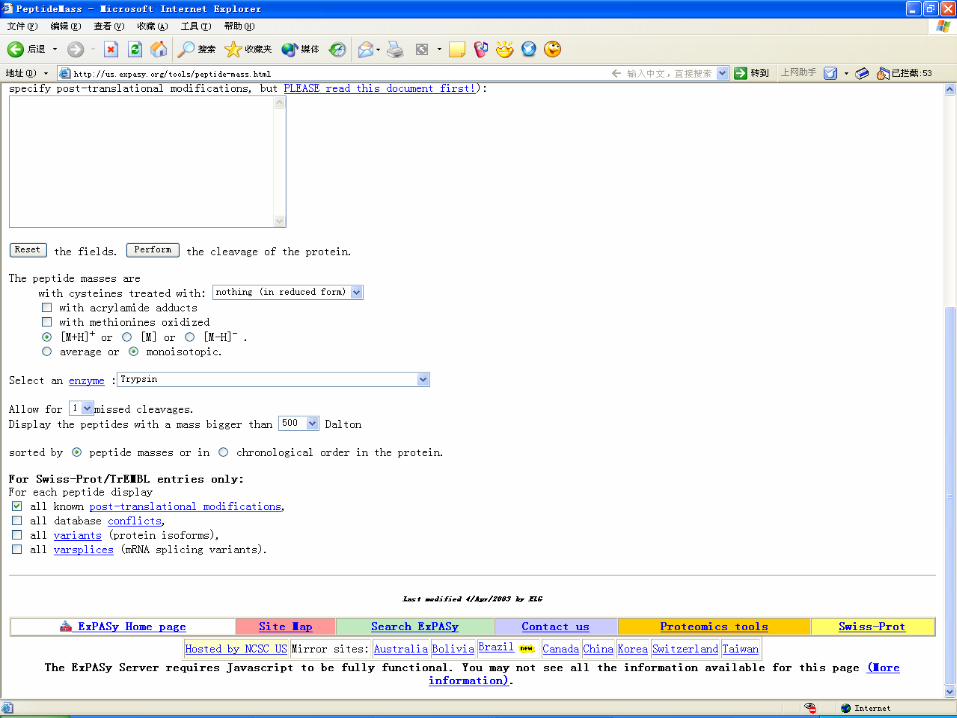
Application of MALDI-TOF-MS
Molecular weight
determination
Peptide mass fingerprint
Disulfide bond identification
C-terminus sequencing