Protein comparison at the domain architecture level
9
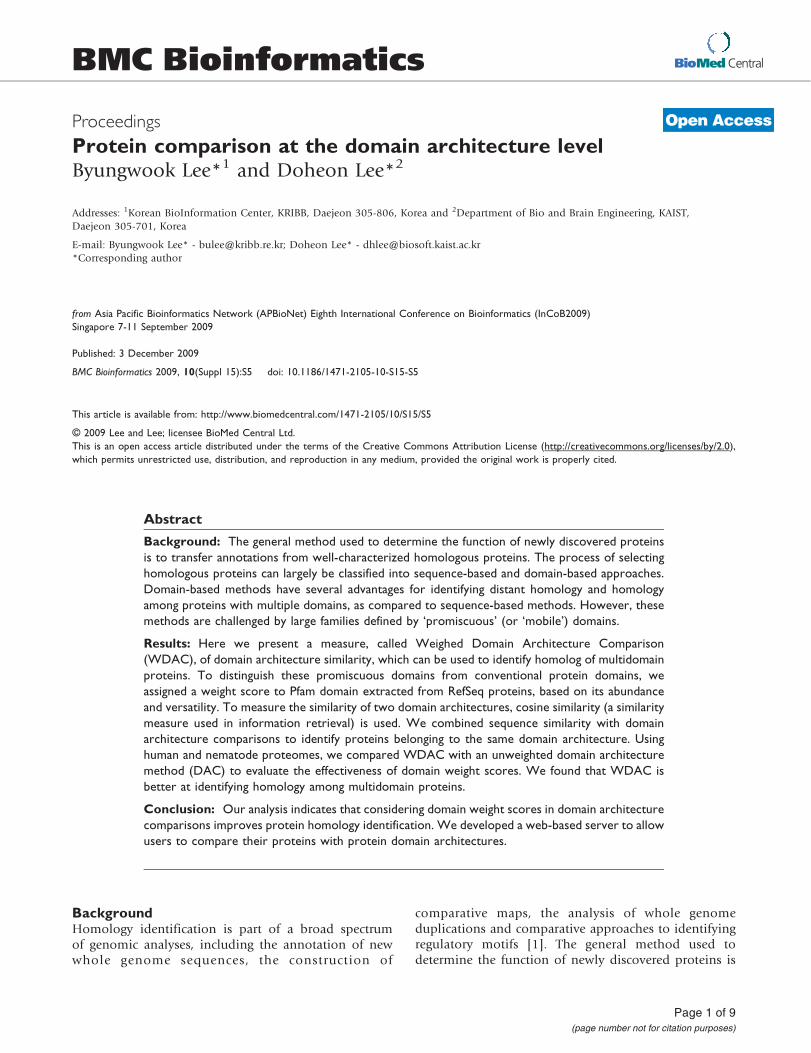
BMC Bioinformatics Proceedings Protein comparison at the domain architecture level Byungwook Lee* 1 and Doheon Lee* 2 Addresses: 1 Korean BioInformation Center, KRIBB, Daejeon 305-806, Korea and 2 Department of Bio and Brain Engineering, KAIST, Daejeon 305-701, Korea E-mail: Byungwook Lee* - [email protected]; Doheon Lee* - [email protected] *Corresponding author from Asia Pacific Bioinformatics Network (APBioNet) Eighth International Conference on Bioinformatics (InCoB2009) Singapore 7-11 September 2009 Published: 3 December 2009 BMC Bioinformatics 2009, 10(Suppl 15):S5 doi: 10.1186/1471-2105-10-S15-S5 This article is available from: http://www.biomedcentral.com/1471-2105/10/S15/S5 © 2009 Lee and Lee; licensee BioMed Central Ltd. This is an open access article distributed under the terms of the Creative Commons Attribution License ( http://creativecommons.org/licenses/by/2.0), which permits unrestricted use, distribution, and reproduction in any medium, provided the original work is properly cited. Abstract Background: The general method used to determine the function of newly discovered proteins is to transfer annotations from well-characterized homologous proteins. The process of selecting homologous proteins can largely be classified into sequence-based and domain-based approaches. Domain-based methods have several advantages for identifying distant homology and homology among proteins with multiple domains, as compared to sequence-based methods. However, these methods are challenged by large families defined by ‘promiscuous’ (or ‘mobile’) domains. Results: Here we present a measure, called Weighed Domain Architecture Comparison (WDAC), of domain architecture similarity, which can be used to identify homolog of multidomain proteins. To distinguish these promiscuous domains from conventional protein domains, we assigned a weight score to Pfam domain extracted from RefSeq proteins, based on its abundance and versatility. To measure the similarity of two domain architectures, cosine similarity (a similarity measure used in information retrieval) is used. We combined sequence similarity with domain architecture comparisons to identify proteins belonging to the same domain architecture. Using human and nematode proteomes, we compared WDAC with an unweighted domain architecture method (DAC) to evaluate the effectiveness of domain weight scores. We found that WDAC is better at identifying homology among multidomain proteins. Conclusion: Our analysis indicates that considering domain weight scores in domain architecture comparisons improves protein homology identification. We developed a web-based server to allow users to compare their proteins with protein domain architectures. Background Homology identification is part of a broad spectrum of genomic analyses, including the annotation of new whole genome sequences, the construction of comparative maps, the analysis of whole genome duplications and comparative approaches to identifying regulatory motifs [1]. The general method used to determine the function of newly discovered proteins is Page 1 of 9 (page number not for citation purposes) BioMed Central Open Access
-
Upload
byungwook-lee -
Category
Documents
-
view
216 -
download
3
Transcript of Protein comparison at the domain architecture level
BMC Bioinformatics
ProceedingsProtein comparison at the domain architecture levelByungwook Lee*1 and Doheon Lee*2
Addresses: 1Korean BioInformation Center, KRIBB, Daejeon 305-806, Korea and 2Department of Bio and Brain Engineering, KAIST,Daejeon 305-701, Korea
E-mail: Byungwook Lee* - [email protected]; Doheon Lee* - [email protected]*Corresponding author
from Asia Pacific Bioinformatics Network (APBioNet) Eighth International Conference on Bioinformatics (InCoB2009)Singapore 7-11 September 2009
Published: 3 December 2009
BMC Bioinformatics 2009, 10(Suppl 15):S5 doi: 10.1186/1471-2105-10-S15-S5
This article is available from: http://www.biomedcentral.com/1471-2105/10/S15/S5
© 2009 Lee and Lee; licensee BioMed Central Ltd.This is an open access article distributed under the terms of the Creative Commons Attribution License (http://creativecommons.org/licenses/by/2.0),which permits unrestricted use, distribution, and reproduction in any medium, provided the original work is properly cited.
Abstract
Background: The general method used to determine the function of newly discovered proteinsis to transfer annotations from well-characterized homologous proteins. The process of selectinghomologous proteins can largely be classified into sequence-based and domain-based approaches.Domain-based methods have several advantages for identifying distant homology and homologyamong proteins with multiple domains, as compared to sequence-based methods. However, thesemethods are challenged by large families defined by ‘promiscuous’ (or ‘mobile’) domains.
Results: Here we present a measure, called Weighed Domain Architecture Comparison(WDAC), of domain architecture similarity, which can be used to identify homolog of multidomainproteins. To distinguish these promiscuous domains from conventional protein domains, weassigned a weight score to Pfam domain extracted from RefSeq proteins, based on its abundanceand versatility. To measure the similarity of two domain architectures, cosine similarity (a similaritymeasure used in information retrieval) is used. We combined sequence similarity with domainarchitecture comparisons to identify proteins belonging to the same domain architecture. Usinghuman and nematode proteomes, we compared WDAC with an unweighted domain architecturemethod (DAC) to evaluate the effectiveness of domain weight scores. We found that WDAC isbetter at identifying homology among multidomain proteins.
Conclusion: Our analysis indicates that considering domain weight scores in domain architecturecomparisons improves protein homology identification. We developed a web-based server to allowusers to compare their proteins with protein domain architectures.
BackgroundHomology identification is part of a broad spectrumof genomic analyses, including the annotation of newwhole genome sequences, the construction of
comparative maps, the analysis of whole genomeduplications and comparative approaches to identifyingregulatory motifs [1]. The general method used todetermine the function of newly discovered proteins is
Page 1 of 9(page number not for citation purposes)
BioMed Central
Open Access

to transfer annotation from well-characterized homo-logous proteins sharing a common ancestry [2]. Currentmethods for the identification of homologous proteinscan be largely classified into sequence-based anddomain-based approaches [3]. Sequence comparisonmethods, such as BLAST and FASTA, are the com-monly-used traditional approaches to identify homo-logous genes [4,5]. These methods assume thatsequences with significant similarity share commonancestry, i.e. are homologs. However, the existence ofmulti-domain proteins and complex evolutionarymechanisms poses difficulties for sequence-basedmethods [6].
Domain-based methods use information of the domainscontained in proteins [7]. Domains are the buildingblocks of all proteins, and present one of the most usefullevels at which protein function can be understood [8].Although the concept of a ‘domain’ now permeatesbiological descriptions, there are several definitionsdirected at different levels of the protein [9]. In structuralbiology, a domain is defined as a spatially distinct,compact and stable protein structural unit that couldconceivably fold and function in isolation. Domains arealso defined as distinct regions of protein sequence thatare highly conserved throughout evolution. These aredescribed as sequence homologs and are often present indifferent molecular contexts. Sequence-based domaindefinitions represent one of the most convenient andpractically important levels at which the evolution andfunction of both proteins and domains can beunderstood.
Domain-based approaches identify homologous pro-teins generally by comparing protein domain architec-ture, which is the linear order of the individual domainsin multidomain protein. About two thirds of proteins inprokaryotes and 80% of proteins in eukaryotes are multi-domain proteins [10]. Studies of domain-based methodsindicate that comparing domain architecture is a usefulmethod for classifying evolutionarily related proteinsand detecting evolutionarily distant homologs [11].Several studies have proposed tools for domain archi-tecture comparison, such as CDART [12] and PDART [9].However, these methods are challenged by large familiesdefined by ‘promiscuous’ (or ‘mobile’) domains, whichcombine in many ways with other domains to formdifferent proteins [13]. Promiscuous domains havetypically auxiliary functions to the primary role ofprotein, acting as signal transducers, or adapters[14,15]. They also play a major role in creating diversityof protein domain architecture in the proteome [16].Because they are not directly related by homology, theyshould be given less importance in homology identifi-cation than key domains. Another problem inherent to
these domain-based measures is that they treat allproteins in a domain architecture equally. They cannotdiscriminate among proteins belonging to the samedomain architecture. Since most domain architecturesconsist of many proteins, identification methods areneeded to determine which protein is the most homo-logous to the query protein within a set of proteinsbelonging to the same domain architecture.
Here we present a measure, called Weighed DomainArchitecture Comparison (WDAC), of domain architec-ture similarity, which can be used to identify homologsof multidomain proteins. The key ideas are the use ofweight scores for domain promiscuity and combiningdomain architecture comparison with sequence similar-ity method. The weight scores are calculated based on adomain’s frequency and versatility in RefSeq [17]proteins. The effectiveness of our method is evaluatedusing human and nematode proteomes. We developed aweb-based server to allow users to compare theirproteins with protein domain architectures. The serveris available at http://wdac.kr/.
MethodsDomain assignmentIn this study we used the Pfam [18] database to analyzethe domain organization of proteins. Pfam is a large andwidely used database of protein domains and families.Pfam contains curated multiple sequence alignments foreach family, as well as profile hidden Markov models forfinding these domains in new sequences. Pfam alsoprovides better genomic coverage than structure-baseddomain assignments, such as CATH [19] and SCOP [20],particularly for membrane proteins.
Measuring the strength of domain promiscuityTo measure the strength of domain promiscuity, weconsidered two features of protein domains, the first ofwhich is domain abundance. Compared to non-promis-cuous domains, promiscuous domains appear in manyproteins because they are needed to perform auxiliaryfunctions. Vogel et al. [21] have shown that thecombination tendencies of domains can be explainedby a random evolutionary process model, in which ahighly abundant domain tends to form more combina-tions. To measure the abundance of a domain, wedefined the Inverse Abundance Frequency (IAF). Thebasic concept of IAF is derived from the InverseDocument Frequency (IDF), a statistic commonly usedin information retrieval. IDF is a measure based on theobservation that a word that occurs in very fewdocuments is more likely to differentiate betweensubjects than a word that occurs frequently [22].Namely, IDF is a measure of the general importance of
BMC Bioinformatics 2009, 10(Suppl 15):S5 http://www.biomedcentral.com/1471-2105/10/S15/S5
Page 2 of 9(page number not for citation purposes)

a term. The IDF score is obtained by dividing the numberof all documents by the number of documents contain-ing the term, and then taking the logarithm of thatquotient. For example, if ‘cow’ appears in 100 docu-ments out of a total of 10,000 and ‘bovine’ in 10documents, the IDF scores of ‘cow’ and ‘bovine’ are 0.2and 0.1, respectively. Thus, the word ‘cow’ conveys lessinformation about the subject of the document than theword ‘bovine’. The number of documents containing aterm and the number of documents in the corpus areanalogous to the proteins containing a domain and thetotal number of proteins under study in the IAF statistic,respectively. The definition of IAF for a domain, d, is
IAF dptpd
( ) log ,= 2 (1)
where pt is the number of total proteins and pd is thenumber of proteins containing domain d.
The second feature of protein domains that we consider isdomain versatility. Promiscuous domains occurring inmany protein clusters havemany partner domain familieswhile highly conserved domains appear in a small numberof protein clusters and their neighbor domains are alsoconserved during evolution [16]. Thus, domains with thesame abundance could have a different number of distinctpartner domain families. To measure the versatility of adomain, we defined the Inverse Versatility (IV) obtainedfrom the inverse of the number of distinct partner domainfamilies at the N- and C-sides adjacent to a domain. Thedefinition of the IV of a domain, d, is
IV dfd
( ) ,= 1(2)
where fd is the number of distinct domain familiesadjacent to domain d. The weight score of a domain issimply calculated by the product of the IDF and the IV ofa domain. Let us consider the theoretical example(Figure 1), where both domain A and domain B occurthree times. Domain A has four distinct neighbors anddomain B has only one distinct neighbor. Since theweight score of domain A is lower than that of domain B,domain A is more promiscuous than domain B.
Comparison of domain architectures using weight scoresUsing the domain weight scores, we compared domainarchitectures. First, the shared distinct domain familiesare compared. We represented the two sets of domainsderived from two architectures as the indices, which arebuilt using the vector-space model (VSM) [23]. Domainarchitectures were converted into a vector in which eachcomponent corresponds to the weight score of a domain.The similarity of the two vectors is measured by
determining their cosine similarity, a measure based onthe angle between two vectors (commonly used in textmining algorithms). If x and y are vectors of two domainarchitectures X and Y, the cosine similarity is defined
sim X Yxkykk
n
xkkn ykk
n( , ) .= =∑
=∑ × =∑1
21
21
(3)
The range of the cosine similarity is [0, 1], where 1indicates that x and y have the same domains and 0indicates that they share no domains.
Second, domain orders were considered. To measure theorder similarity, we compared shared domain pairsbetween two domain architectures. In domain evolution,two- or three-domain combinations, called suprado-main, are re-used in different protein context, anddomain pairs in protein domain architecture occur inonly one order, with only about 2% of such pairsoccurring on both possible orders. The order similarity ismeasured by dividing the shared domain pairs (Qs) bythe total domain pairs (Qt). The function is defined by
order X YQsQt
( , ) .= (4)
The final similarity score between two domain architectures,XandY, isobtainedby combining the indices fromequations3 and 4 (each normalized to [0, 1]) using a simple linearfunction.
Figure 1Example calculation of the weight scores of domains.Black lines represent protein sequences and the coloredboxes, circles, and diamonds represent different domains.The number of occurrences of two exemplary domains, Aand B, is three (P1, P2, and P3), and the number of distinctpartner domains of A and B is three (E, D, and A) and one(E), respectively. The IAF scores of A and B are 0.125, andthe IV scores of A and B are 0.3 and 1.0, respectively. Wecan obtain the final weight score of domain A (0.038) anddomain B (0.125) from the IDF and IV scores. From theweight scores of the two domains, we can determine thatdomain A is a more promiscuous domain than domain B.
BMC Bioinformatics 2009, 10(Suppl 15):S5 http://www.biomedcentral.com/1471-2105/10/S15/S5
Page 3 of 9(page number not for citation purposes)

Pipeline for domain architecture comparisonWe constructed an automatic pipeline for identifyinghomologs of proteins (Figure 2). The pipeline programswere written in Perl and consist of four main steps. First,the pipeline assigns Pfam domains to a query proteinand extracts a domain architecture from the Pfamannotation. Second, the query domain architectures arecompared against the domain architecture database.Third, the query proteins are compared with RefSeqproteins using BLASTP [24]. Lastly, matched domainarchitectures and BLAST results are combined and sortedaccording to their similarity scores.
Web-based serverWe developed a web-based server to provide a back-endpipeline for protein homology and to allow users tocompare their protein sequences with a domain archi-tecture database. The web interface is implemented withstatic HTML and CGI scripts, and MySQL DBMS is usedto store the database.
Results and discussionObtaining weight scores of protein domainsWe downloaded 6,042,750 protein sequences from theRefSeq database (Release 32). The domain content ofthe sequences was analyzed with Pfam 23.0 containing
10,340 families. The Pfam domain annotations of allRefSeq proteins were obtained from the Similarity Matrixof Proteins (SIMAP) [25] database. We filtered domainhits in proteins with a cutoff E-value of 0.01 andexcluded proteins without Pfam signatures. We extractedall the Pfam domains from the Pfam-annotated proteins
Of the 6,042,750 RefSeq proteins, 3,942,678 (65%)contain more than one Pfam domain. These Pfam-annotated proteins were converted into domain archi-tectures, in which we obtained 55,841 distinct domainarchitectures. The domain architecture data show that90% of the domain architectures are kingdom-specific.Thus, we classified the 55,841 domain architecturesinto three kingdoms: Eukaryote, Bacteria, and Archaea(Figure 3). From these domain architectures, weextracted 8,775 domains and then divided them intothe three kingdoms, where 17% of all the domains arecommon to all three kingdoms of life whereas 54%appear only in one kingdom.
Because domains are differently distributed in the threekingdoms and some domains are absent or present inone or two kingdoms, we assigned three kingdom-specific weight scores to each domain based on itsabundance and versatility in the three kingdoms. Tomeasure domain abundance, we obtained the kingdom-specific protein frequency for each domain. Mostdomains occur in a hundred or fewer proteins, but a
Figure 2Workflow for the identification of protein homology.The pipeline combines sequence similarity information anddomain architecture comparison methods.
Figure 3The distribution of domain architectures across thethree kingdoms of life. Ninety percent of the domainarchitectures are kingdom-specific.
BMC Bioinformatics 2009, 10(Suppl 15):S5 http://www.biomedcentral.com/1471-2105/10/S15/S5
Page 4 of 9(page number not for citation purposes)
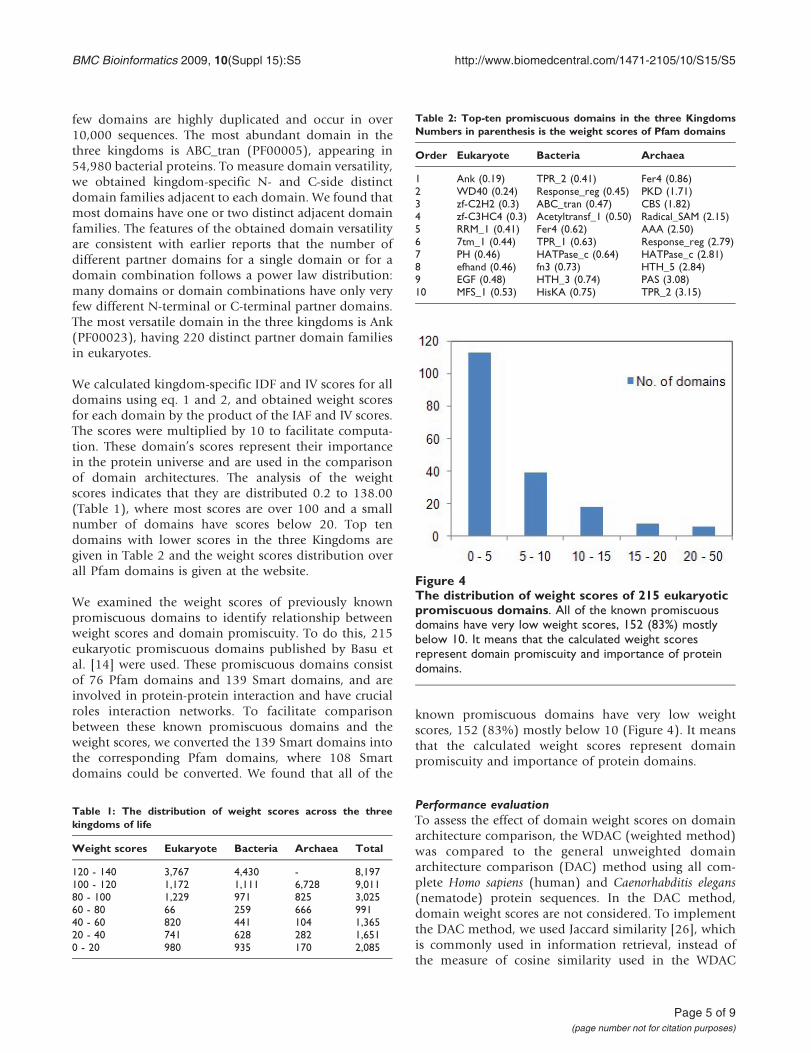
few domains are highly duplicated and occur in over10,000 sequences. The most abundant domain in thethree kingdoms is ABC_tran (PF00005), appearing in54,980 bacterial proteins. To measure domain versatility,we obtained kingdom-specific N- and C-side distinctdomain families adjacent to each domain. We found thatmost domains have one or two distinct adjacent domainfamilies. The features of the obtained domain versatilityare consistent with earlier reports that the number ofdifferent partner domains for a single domain or for adomain combination follows a power law distribution:many domains or domain combinations have only veryfew different N-terminal or C-terminal partner domains.The most versatile domain in the three kingdoms is Ank(PF00023), having 220 distinct partner domain familiesin eukaryotes.
We calculated kingdom-specific IDF and IV scores for alldomains using eq. 1 and 2, and obtained weight scoresfor each domain by the product of the IAF and IV scores.The scores were multiplied by 10 to facilitate computa-tion. These domain’s scores represent their importancein the protein universe and are used in the comparisonof domain architectures. The analysis of the weightscores indicates that they are distributed 0.2 to 138.00(Table 1), where most scores are over 100 and a smallnumber of domains have scores below 20. Top tendomains with lower scores in the three Kingdoms aregiven in Table 2 and the weight scores distribution overall Pfam domains is given at the website.
We examined the weight scores of previously knownpromiscuous domains to identify relationship betweenweight scores and domain promiscuity. To do this, 215eukaryotic promiscuous domains published by Basu etal. [14] were used. These promiscuous domains consistof 76 Pfam domains and 139 Smart domains, and areinvolved in protein-protein interaction and have crucialroles interaction networks. To facilitate comparisonbetween these known promiscuous domains and theweight scores, we converted the 139 Smart domains intothe corresponding Pfam domains, where 108 Smartdomains could be converted. We found that all of the
known promiscuous domains have very low weightscores, 152 (83%) mostly below 10 (Figure 4). It meansthat the calculated weight scores represent domainpromiscuity and importance of protein domains.
Performance evaluationTo assess the effect of domain weight scores on domainarchitecture comparison, the WDAC (weighted method)was compared to the general unweighted domainarchitecture comparison (DAC) method using all com-plete Homo sapiens (human) and Caenorhabditis elegans(nematode) protein sequences. In the DAC method,domain weight scores are not considered. To implementthe DAC method, we used Jaccard similarity [26], whichis commonly used in information retrieval, instead ofthe measure of cosine similarity used in the WDAC
Table 1: The distribution of weight scores across the threekingdoms of life
Weight scores Eukaryote Bacteria Archaea Total
120 - 140 3,767 4,430 - 8,197100 - 120 1,172 1,111 6,728 9,01180 - 100 1,229 971 825 3,02560 - 80 66 259 666 99140 - 60 820 441 104 1,36520 - 40 741 628 282 1,6510 - 20 980 935 170 2,085
Table 2: Top-ten promiscuous domains in the three KingdomsNumbers in parenthesis is the weight scores of Pfam domains
Order Eukaryote Bacteria Archaea
1 Ank (0.19) TPR_2 (0.41) Fer4 (0.86)2 WD40 (0.24) Response_reg (0.45) PKD (1.71)3 zf-C2H2 (0.3) ABC_tran (0.47) CBS (1.82)4 zf-C3HC4 (0.3) Acetyltransf_1 (0.50) Radical_SAM (2.15)5 RRM_1 (0.41) Fer4 (0.62) AAA (2.50)6 7tm_1 (0.44) TPR_1 (0.63) Response_reg (2.79)7 PH (0.46) HATPase_c (0.64) HATPase_c (2.81)8 efhand (0.46) fn3 (0.73) HTH_5 (2.84)9 EGF (0.48) HTH_3 (0.74) PAS (3.08)10 MFS_1 (0.53) HisKA (0.75) TPR_2 (3.15)
Figure 4The distribution of weight scores of 215 eukaryoticpromiscuous domains. All of the known promiscuousdomains have very low weight scores, 152 (83%) mostlybelow 10. It means that the calculated weight scoresrepresent domain promiscuity and importance of proteindomains.
BMC Bioinformatics 2009, 10(Suppl 15):S5 http://www.biomedcentral.com/1471-2105/10/S15/S5
Page 5 of 9(page number not for citation purposes)

method. The Jaccard similarity can be calculated by thefollowing equation:
J X Yf
f f f( , ) ,=
+ +11
01 10 11(5)
where f11 is the number of domains common to bothsequences X and Y, f10 is the number of domains in X,and f01 is the number of domains in Y.
We extracted all complete human and nematode proteinsequences from RefSeq proteins, yielding 32,999 humanand 23,220 nematode protein sequences. Among theseproteins, 23,295 human and 14,522 nematode proteinshave detectable Pfam domain information. Among thehuman proteins, we selected 9,764 proteins that containmore than 2 Pfam domains and performed domainarchitecture comparisons between the selected humanproteins (≥ two domains) and those from the nematodeproteome (≥ one domain) using the WDAC and DACalgorithms.
To validate homologous pairs of human and nematodeproteins, we used the HomoloGene database [27], aNCBI dataset that curates sets of orthologs from theannotated genes of several completely sequenced eukar-yotic genomes. Among the 44,481 groups in Homo-loGene release 61, we selected 2,559 groups that haveboth the selected human proteins and nematodeproteins. From the comparison results, we extracted theWDAC and DAC results that have the same HomoloGene
ID in the query (human) and the best matched protein(nematode). The results show that the number of truepositive values in the WDAC and DAC results are 2,328(91%) and 2,175 (85%) respectively, which means thatconsidering weight scores in domain architecture com-parison can improve homology identification.
In addition, we found that the WDAC results have morespecific homologs than the DAC results. Figure 5 showsthe query results of a human protein NP_006695(suppressor of the G2 allele of SKP1 isoform b). Thebest matched protein from the WDAC results isNP_080750 (SGT1, suppressor of the G2 allele ofSKP1), while DAC results have two proteins,NP_080750 and NP_033916, as the best matchedprotein. The reason that DAC cannot discriminatebetween the two proteins is that DAC treats twodomains, TPR_1 and Siah, equally.
Construction of web server
The query interface accepts protein sequences in FASTAformat, and the maximum number of input proteinsequences for a single submission is 100 and the lengthof each sequence is limited to 5000 residues. The outputof the server is an HTML-formatted file, which consists ofthree parts: query domain architecture with Pfamdomains, matched domain architecture, and domaininformation (Figure 6). For more than two sequences,users must input an email address to receive the WDACresults.
Figure 5The best matches of the WDAC and DAC results for a human protein, NP_006695. (A) Query protein (human).(B) The best-matched proteins in the WDAC and DAC results. DAC cannot distinguish between two proteins (NP_080750and NP_033916), while WDAC can identify more homologous proteins by using weight scores.
BMC Bioinformatics 2009, 10(Suppl 15):S5 http://www.biomedcentral.com/1471-2105/10/S15/S5
Page 6 of 9(page number not for citation purposes)

Figure 6Screenshot of the results of the WDAC server for a query protein. (A) Matched domain architecture. (B) List ofprotein belonging to the selected domain architecture.
BMC Bioinformatics 2009, 10(Suppl 15):S5 http://www.biomedcentral.com/1471-2105/10/S15/S5
Page 7 of 9(page number not for citation purposes)

ConclusionThere are several current homology methods whichcompare domain architectures. However, these methodsare challenged by large families defined by promiscuousdomains. To cope with the promiscuous domainproblem, we present a method for measuring thesimilarity among protein domain architectures basedon their Pfam-A domain annotations. The Pfam databasemay contain a small number of false positives and falsenegatives. Nevertheless, it is currently one of the mostuseful and practical domain annotation databases forprotein sequences. In this study, we consider domainweight scores, obtained based on the abundance andversatility of domains. Our analysis indicates thatconsidering domain weight scores in domain architec-ture comparison improves the performance of proteinhomology identification. The WDAC algorithm is alsoeffective in resolving some issues that have baffledtraditional sequence-based comparison methods, such asthe comparison of proteins with promiscuous domain(s). The WDAC algorithm and its web server could beused to explore the underlying evolutionary relation-ships among proteins at the level of their whole domainarchitectures, rather than at the single-domain or proteinsequence level.
Competing interestsThe authors declare that they have no competinginterests.
Authors’ contributionsBL designed the algorithm, carried out the programming,analyzed the results and wrote the manuscript. DLdirected the entire study. All authors read and approvedthe final manuscript.
NoteOther papers from the meeting have been published aspart of BMC Genomics Volume 10 Supplement 3, 2009:Eighth International Conference on Bioinformatics(InCoB2009): Computational Biology, available onlineat http://www.biomedcentral.com/1471-2164/10?issue=S3.
AcknowledgementsBL was supported by the KRIBB Research Initiative Program and by theKorea Science and Engineering Foundation (KOSEF) grant funded by theKorea government (MEST) (No. M10869030002-08N6903-00210). DLwas supported by the Ministry of Knowledge Economy, Korea, under theITRC support program supervised by the IITA (IITA-2008-C1090-0801-0001) and Korea Institute of Science and Technology InformationSupercomputing Center.
This article has been published as part of BMC Bioinformatics Volume 10Supplement 15, 2009: Eighth International Conference on Bioinformatics(InCoB2009): Bioinformatics. The full contents of the supplement are
available online at http://www.biomedcentral.com/1471-2105/10?issue=S15.
References1. Song N, Sedgewick RD and Durand D: Domain architecture
comparison for multidomain homology identification.J Comput Biol 2007, 14(4):496–516.
2. Punta M and Ofran Y: The rough guide to in silico functionprediction, or how to use sequence and structure informa-tion to predict protein function. PLoS Comput Biol 2008, 4(10):e1000160.
3. Ponting CP and Russell RR: The natural history of proteindomains. Annu Rev Biophys Biomol Struct 2002, 31:45–71.
4. Lee B, Hong T, Byun SJ, Woo T and Choi YJ: ESTpass: a web-based server for processing and annotating expressedsequence tag (EST) sequences. Nucleic acids research 2007, 35Web Server: W159–162.
5. Lee B and Shin G: CleanEST: a database of cleansed ESTlibraries. Nucleic acids research 2009, 37 Database: D686–689.
6. Song N, Joseph JM, Davis GB and Durand D: Sequence similaritynetwork reveals common ancestry of multidomain proteins.PLoS Comput Biol 2008, 4(4):e1000063.
7. Hollich V and Sonnhammer EL: PfamAlyzer: domain-centrichomology search. Bioinformatics (Oxford, England) 2007, 23(24):3382–3383.
8. Chothia C, Gough J, Vogel C and Teichmann SA: Evolution of theprotein repertoire. Science 2003, 300(5626):1701–1703.
9. Lin K, Zhu L and Zhang DY: An initial strategy for comparingproteins at the domain architecture level. Bioinformatics(Oxford, England) 2006, 22(17):2081–2086.
10. Tordai H, Nagy A, Farkas K, Banyai L and Patthy L: Modules,multidomain proteins and organismic complexity. The FEBSjournal 2005, 272(19):5064–5078.
11. Fong JH, Geer LY, Panchenko AR and Bryant SH: Modeling theevolution of protein domain architectures using maximumparsimony. Journal of molecular biology 2007, 366(1):307–315.
12. Geer LY, Domrachev M, Lipman DJ and Bryant SH: CDART:protein homology by domain architecture. Genome research2002, 12(10):1619–1623.
13. Bjorklund AK, Ekman D, Light S, Frey-Skott J and Elofsson A:Domain rearrangements in protein evolution. Journal ofmolecular biology 2005, 353(4):911–923.
14. Basu MK, Carmel L, Rogozin IB and Koonin EV: Evolution ofprotein domain promiscuity in eukaryotes. Genome research2008, 18(3):449–461.
15. Lee B and Lee D: DAhunter: a web-based server that identifieshomologous proteins by comparing domain architecture.Nucleic Acids Res 2008, 36 Web Server: W60–64.
16. Basu MK, Poliakov E and Rogozin IB: Domain mobility inproteins: functional and evolutionary implications. BriefBioinform 2009, 10(3):205–216.
17. Pruitt KD, Tatusova T and Maglott DR: NCBI referencesequences (RefSeq): a curated non-redundant sequencedatabase of genomes, transcripts and proteins. Nucleic acidsresearch 2007, 35 Database: D61–65.
18. Finn RD, Tate J, Mistry J, Coggill PC, Sammut SJ, Hotz HR, Ceric G,Forslund K, Eddy SR and Sonnhammer EL, et al: The Pfam proteinfamilies database. Nucleic acids research 2008, 36 Database:D281–288.
19. Greene LH, Lewis TE, Addou S, Cuff A, Dallman T, Dibley M,Redfern O, Pearl F, Nambudiry R and Reid A, et al: The CATHdomain structure database: new protocols and classificationlevels give a more comprehensive resource for exploringevolution. Nucleic acids research 2007, 35 Database: D291–297.
20. Andreeva A, Howorth D, Chandonia JM, Brenner SE, Hubbard TJ,Chothia C and Murzin AG: Data growth and its impact on theSCOP database: new developments. Nucleic acids research 2008,36 Database: D419–425.
21. Vogel C, Teichmann SA and Pereira-Leal J: The relationshipbetween domain duplication and recombination. Journal ofmolecular biology 2005, 346(1):355–365.
22. Yu S, Van Vooren S, Tranchevent LC, De Moor B and Moreau Y:Comparison of vocabularies, representations and rankingalgorithms for gene prioritization by text mining. Bioinfor-matics (Oxford, England) 2008, 24(16):i119–125.
23. Glenisson P, Coessens B, Van Vooren S, Mathys J, Moreau Y and DeMoor B: TXTGate: profiling gene groups with text-basedinformation. Genome Biol 2004, 5(6):R43.
BMC Bioinformatics 2009, 10(Suppl 15):S5 http://www.biomedcentral.com/1471-2105/10/S15/S5
Page 8 of 9(page number not for citation purposes)
24. Altschul SF, Madden TL, Schaffer AA, Zhang J, Zhang Z, Miller W andLipman DJ: Gapped BLAST and PSI-BLAST: a new genera-tion of protein database search programs. Nucleic Acids Res1997, 25(17):3389–3402.
25. Rattei T, Tischler P, Arnold R, Hamberger F, Krebs J, Krumsiek J,Wachinger B, Stumpflen V and Mewes W: SIMAP–structuring thenetwork of protein similarities. Nucleic Acids Res 2008, 36Database: D289–292.
26. Balestre M, Von Pinho RG, Souza JC and Lima JL: Comparison ofmaize similarity and dissimilarity genetic coefficients basedon microsatellite markers. Genet Mol Res 2008, 7(3):695–705.
27. Sayers EW, Barrett T, Benson DA, Bryant SH, Canese K,Chetvernin V, Church DM, DiCuccio M, Edgar R and Federhen S,et al: Database resources of the National Center forBiotechnology Information. Nucleic Acids Res 2009, 37 Data-base: D5–15.
Publish with BioMed Central and every scientist can read your work free of charge
"BioMed Central will be the most significant development for disseminating the results of biomedical research in our lifetime."
Sir Paul Nurse, Cancer Research UK
Your research papers will be:
available free of charge to the entire biomedical community
peer reviewed and published immediately upon acceptance
cited in PubMed and archived on PubMed Central
yours — you keep the copyright
Submit your manuscript here:http://www.biomedcentral.com/info/publishing_adv.asp
BioMedcentral
BMC Bioinformatics 2009, 10(Suppl 15):S5 http://www.biomedcentral.com/1471-2105/10/S15/S5
Page 9 of 9(page number not for citation purposes)