Protecting the Rainforest? The Effectiveness and Costs of Mahogany Prohibition
28
Protecting the Rainforest? The Effectiveness and Costs of Mahogany Prohibition Ariaster B. Chimeli Ohio University
-
Upload
graham-cleveland -
Category
Documents
-
view
40 -
download
0
description
Protecting the Rainforest? The Effectiveness and Costs of Mahogany Prohibition. Ariaster B. Chimeli Ohio University. Prohibition and Supply Standard Presumption. Prohibition raises production costs. “Imprisonment and other punishments”. Supply decreases. Equilibrium price increases. - PowerPoint PPT Presentation
Transcript of Protecting the Rainforest? The Effectiveness and Costs of Mahogany Prohibition

Protecting the Rainforest?The Effectiveness and Costs
of Mahogany Prohibition
Ariaster B. ChimeliOhio University

Prohibition and SupplyStandard Presumption
• Prohibition raises production costs.– “Imprisonment and other punishments”.
• Supply decreases.
• Equilibrium price increases.
• Equilibrium quantity decreases.

Prohibition and SupplyStandard Presumption
Becker, Murphy and Grossman, JPE, V. 114(1), 2006, p. 42.

Big Leaf Mahogany
• Highly valued timber in high end markets.
• Endangered species?
• Secondary deforestation.

Timeline for Brazilian Mahogany Regulation
Early 1990s
1995 1997 1998Jul-96 Mar-99 Jun-99 Oct-01 Apr-02 Nov-02 Nov-03
Export Quota150,000m3
IBAMA reviewsmgt. plans
2 year moratoriumnew mgt. plans(renewed 98, 00)
Mahoganyin CITES II(rejected)
MahoganyIn CITES IIIEQ 65,000m3
IBAMA report85% mgt. planssuspended
Fed. Gov.working groupon mahoganymeets
EQ 30,000m3
Mahoganyprohibition
Prohibitionmaintained
MahoganyIn CITES II
CITES IIregulationentersinto force

Brazilian Big Leaf Mahogany

Prices and QuantitiesChimeli and Boyd (2010)

Figure 2: Brazilian Exports of Mahogany

Figure 4: Brazilian Exports of Other Tropical Species

Combined series: EU P and Q

Combined series: US P and Q

ViolenceChimeli and Soares I

Illegal Markets and Violence
• This paper:– Unique data: natural experiment involving a
complete shut-down of a market– Not a “vice” good (mahogany).

Empirical Strategy
• Present evidence that mahogany trade persisted after prohibition as “other species” (structural breaks).
• Document (Diff-in-Diff) relative increase in homicide rates after prohibition at the municipal level.

Area of Natural Occurrence of Mahogany in the Brazilian Territory, according to Grogan et al (2002)

Figure 2: Evolution of Homicide Rates (per 100,000) in the State of Pará, Brazil, 1995-2007

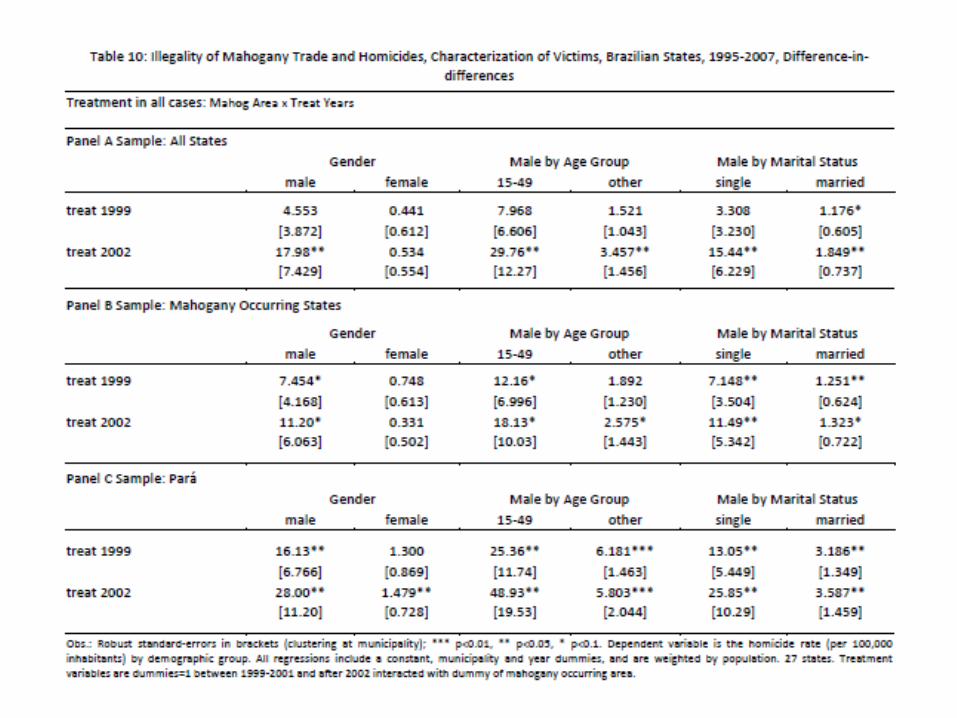

Violence in Mahogany Municipalities
• Over 1,900 additional homicides (estimated) between 1995 to 2007 attributed to illegal mahogany activity.
• Typical victims are those opposing illegal logging.– Members of indigenous tribes (logging in their
land).– Landless peasants.– Environmental activists.– Small farmers.

Five remaining members of the Akuntsu People. Rondônia, Brazil

DeforestationChimeli and Soares II

Logging Industry and Tropical Deforestation in the World
• “Indirect role of timber production in opening up inaccessible forest areas, which then encourages other economic uses of forest resources, such as agricultural cultivation, that lead to deforestation on a wider scale.” Barbier et al. (1995), p. 412.
• Argument applied to:– Brazil, Indonesia, Cameroon and ‘major tropical
countries’ (Amelung and Diehl, 1992; Barbier et al., 1995).
– Thailand (Cropper et al., 1999).

Mahogany and Deforestation in the Brazilian Amazon
“Moreover, mahogany logging indirectly contributes to regional deforestation. Logging companies have opened up some 3000 km of logging roads in southern Pará and mahogany logging has been documented in each of the region's 15 Indian Reserves. After logging, there is a growing trend to convert forests to cattle pasture, in part perhaps, because the prospects for future mahogany harvests do not appear to be good.” (Verissimo et al., 1995, p. 60).


Empirical Strategy
• Diff-in-Diff: forested area in mahogany vs. non-mahogany municipalities
• Dependent variables:– Forest/area (2000 – 2010)– Bovine density (1974– 2007)
• Treatment variables:– Mahogany prohibition (contemporaneous and
lagged)– Areas where mahogany naturally occurs– Mahogany exports (weights at the state level)

ResultsTable 2: Illegality of mahogany trade and deforestation, municipalities in mahogany occurring states, 2000 - 2010
Difference-in-differences
Sample Mahogany Occurring States Pará
Dependent Variable:Forest Cover/Municipality Area
Mahogany Area x Treatment Year
Mahogany Area x Treatment Year
Mahogany Area x Treatment Year
Mahogany Area x Treatment Year
(1) (2) (3) (4)
Treatment 2002 (L1) -0.0295*** -0.0371***
[0.00576] [0.0109]
Treatment 2002 (L2) -0.0314*** -0.0370***
[0.00681] [0.0113]
Constant 0.213 0.368** 0.336*** 0.336***
[0.161] [0.166] [0.0223] [0.0217]
Observations 4,242 4,242 1,024 1,024
R-squared 0.993 0.993 0.985 0.985
Robust standard errors in brackets, clustering at municipality level. *** p<0.01, ** p<0.05, * p<0.1.
All regressions include a constant, municipality and year dummies, and are weighted by population.

ResultsTable 4: Illegality of mahogany trade and bovine density, 1992 - 2007, Difference-in-differences.
Sample All States Mahogany Occurring States Pará
Dependent Variable: Bovine heads/municipality area
Mahogany Area x Treatment
Year
Mahogany Area x Treatment
Year
Mahogany Area x Treatment
Year
Mahogany Area x Treatment
Year
Mahogany Area x Treatment
Year
Mahogany Area x Treatment
Year
(1) (2) (3) (4) (5) (6)
Treatment 1999-2001 (L1) 8.046*** 4.921*** 3.537*
[1.424] [1.524] [2.012]
Treatment 2002 (L1) 17.19*** 13.10*** 13.21***
[2.070] [2.196] [3.176]
Treatment 1999-2001 (L2) 8.907*** 5.604*** 4.047**
[1.319] [1.346] [1.630]
Treatment 2002 (L2) 18.11*** 12.55*** 14.37***
[2.276] [2.341] [3.527]
Constant 25.23** 16.01 74.59** 25.91 6.994*** 6.588***
[12.39] [13.84] [30.52] [30.15] [1.947] [2.068]
Observations 49,377 44,427 6,253 5,628 1,525 1,398
R-squared 0.944 0.958 0.924 0.943 0.893 0.902
Robust standard errors in brackets, clustering at municipality level. *** p<0.01, ** p<0.05, * p<0.1. All regressions include a constant,
municipality and year dummies, and are weighted by population.

Results
• Policy evaluation: prohibition seemed to have increased mahogany extraction and deforestation in the Brazilian Amazon.– Decrease in forest cover in mahogany munic.– Increase in cattle following prohibition.
• Evidence in support of the hypothesis that logging of high-value timber species is a driving force of larger scale deforestation.