Prospect No. 3 Hydroelectric Project FERC Project No - PacifiCorp

Prospect No. 3 Hydroelectric Project FERC Project No. P-2337
Initial Study Report: Fish Passage Facilities May 2015
Prepared by: Alden Research Laboratory, Inc.
9521 Willows Road NE Redmond, WA 98052
For Public Review
Solving flow problems since 1894
ALDEN Research Laboratory, Inc. 425-881-7700/phone • 425-883-4473/fax 9521 Willows Road NE, Redmond, WA 98052-3422 [email protected] • www.aldenlab.com
Prospect No. 3 Hydroelectric Project FERC Project No. P-2337
Fish Passage Facilities Initial Study Report
Prepared for:
PacifiCorp 925 South Grape Street
Medford, OR 97501

i
TABLE OF CONTENTS 1.0 Introduction ......................................................................................................................... 1
1.1 Background ...................................................................................................................... 1
1.2 Study Description............................................................................................................. 5
1.3 Study Objectives .............................................................................................................. 6
1.4 Upstream (Fish Ladder) and Downstream (Fish Screen) Criteria ................................... 6
2.0 Instrumentation, Measurement, and Methods ................................................................... 11
2.1 Water Surface Elevations ............................................................................................... 11
2.2 Water Depths ................................................................................................................. 12
2.3 Physical Attributes ......................................................................................................... 13
2.4 Jump Heights ................................................................................................................. 14
2.5 Velocities ....................................................................................................................... 14
2.5.1 Weir Notch Velocities............................................................................................. 14
2.5.2 Submerged Orifice Velocities ................................................................................. 15
2.5.3 Fish Return Bypass Entrance Velocity ................................................................... 15
2.5.4 Fish Screen Velocities............................................................................................. 16
2.6 Flows .............................................................................................................................. 18
2.6.1 Fish Ladder Weir Flows.......................................................................................... 18
2.6.2 Fish Return Bypass Flow ........................................................................................ 20
2.7 Energy Dissipation ......................................................................................................... 20
3.0 Test Conditions ................................................................................................................. 21
3.1 Targeted Test Conditions ............................................................................................... 21
3.2 Low Flow Evaluation Conditions .................................................................................. 21
3.3 High Flow Evaluation Conditions ................................................................................. 23
4.0 Structure Performance ...................................................................................................... 29
4.1 Jump Heights ................................................................................................................. 29
4.2 Entrance, Exit, and Weir Notch Velocities .................................................................... 30
4.3 Fish Return Bypass Entrance Velocity .......................................................................... 31
4.4 Weir Notch Depth .......................................................................................................... 31
4.5 Entrance Pool and Jump Pool Depths ............................................................................ 32
4.6 Energy Dissipation ......................................................................................................... 33
ii
4.7 Fish Ladder Exit Flow Rating Curve ............................................................................. 34
4.8 Physical Inspection ........................................................................................................ 35
4.9 Fish Screen Flows .......................................................................................................... 36
4.10 Fish Screen Sweeping Velocity ..................................................................................... 37
4.11 Fish Screen Approach Velocity ..................................................................................... 37
4.12 Ratio of Sweeping to Approach Velocity ...................................................................... 39
4.13 Physical Conditions of the Fish Screen ......................................................................... 39
5.0 Summary, Conclusions, and Recommendations ............................................................... 41
5.1 Summary and Conclusions ............................................................................................ 41
5.1.1 Fish Ladder ............................................................................................................. 41
5.1.2 Fish Screen .............................................................................................................. 45
5.2 Recommendations .......................................................................................................... 45
5.2.1 Fish Ladder ............................................................................................................. 45
5.2.2 Fish Screen .............................................................................................................. 46
6.0 References ......................................................................................................................... 47
iii
List of Tables
Table 1 Description of Physical Fish Ladder Parameters .......................................................... 7
Table 2 Description of Physical Fish Screen Parameters .......................................................... 7
Table 3 Fish Ladder Jump Heights .......................................................................................... 29
Table 4 Weir Notch Velocities ................................................................................................ 30
Table 5 Measured Weir Notch Depths .................................................................................... 32
Table 6 Average Pool Depths .................................................................................................. 33
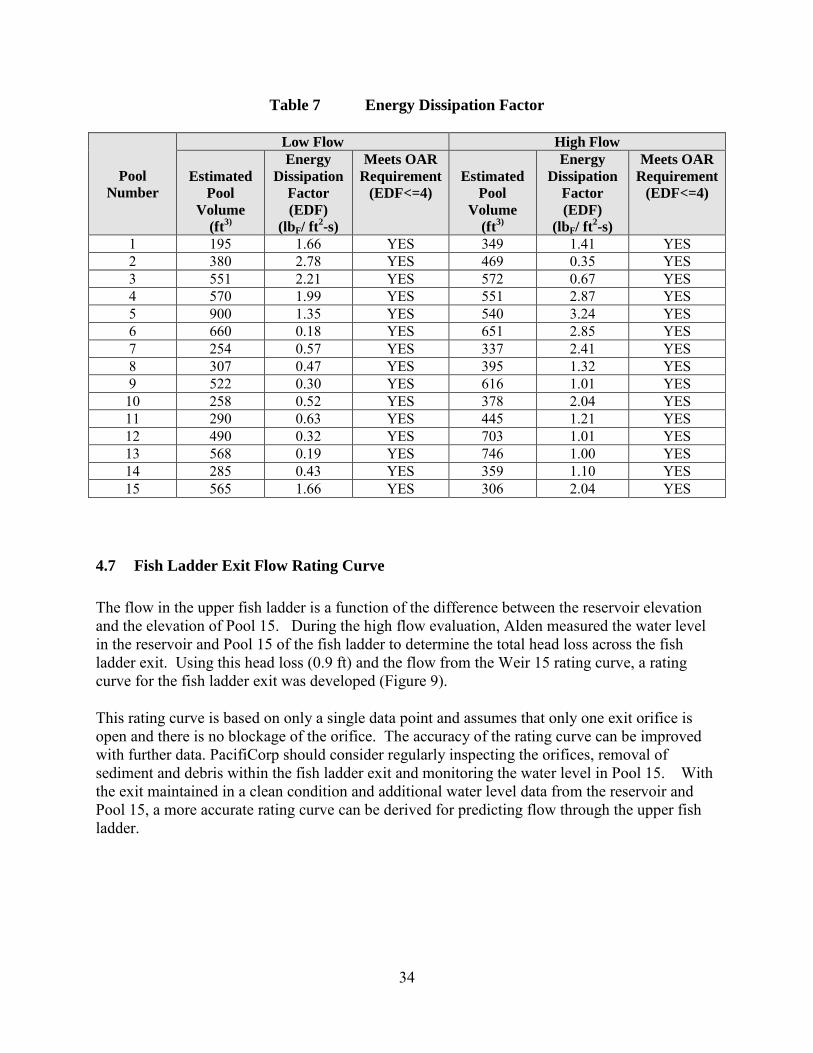
Table 7 Energy Dissipation Factor .......................................................................................... 34
Table 8 Sweeping Velocity Measurements (ft/s) - Low Flow Conditions .............................. 37
Table 9 Sweeping Velocity Measurements (ft/s) - High Flow Conditions ............................. 37
Table 10 Approach Velocity Measurements (ft/s) - Low Flow Conditions .............................. 38
Table 11 Approach Velocity Measurements (ft/s) - High Flow Conditions ............................. 38
Table 12 Ratio of Sweeping to Approach Velocity - High Flow Conditions ............................ 39
Table 13 Summary of Fish Ladder Measurements and OAR Requirements – Low Flow. (Red text is used to highlight where the criteria were exceeded) .......................................................... 43
Table 14 Summary of Fish Ladder Measurements and OAR Requirements – High Flow. (Red text is used to highlight where the criteria were exceeded) .......................................................... 44
iv
List of Figures
Figure 1 Location of Prospect 3 Hydroelectric Project ............................................................... 1
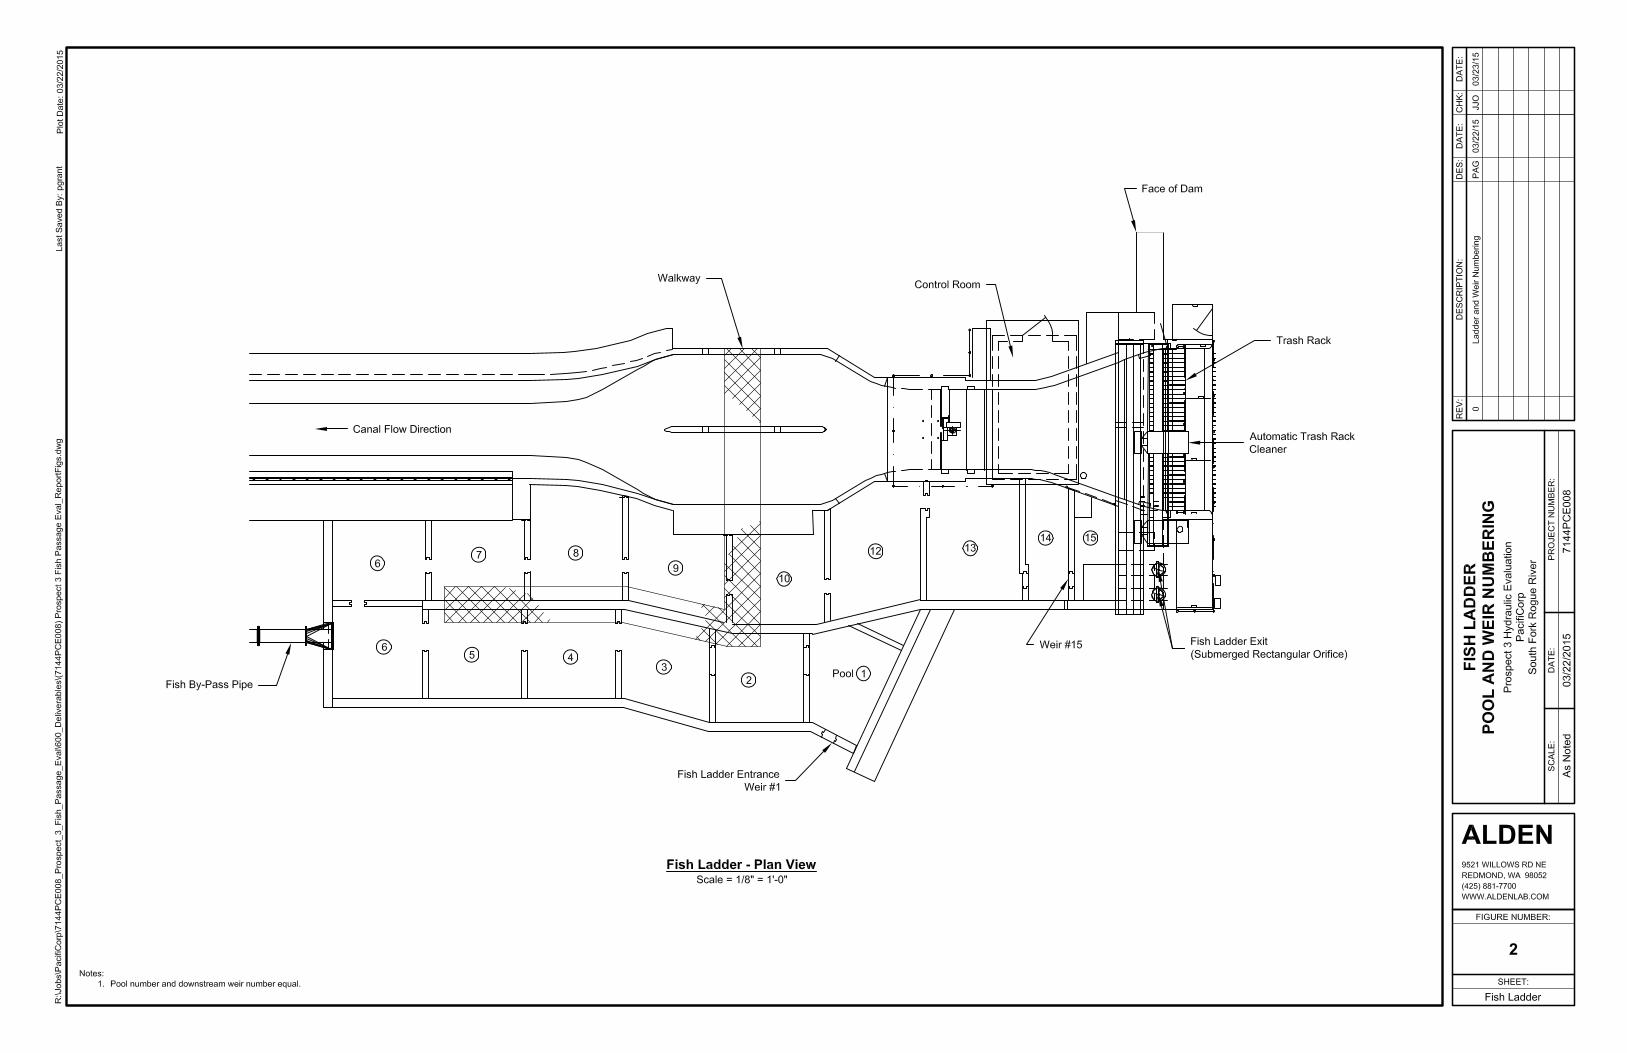
Figure 2 Fish Ladder Pool and Weir Numbering ........................................................................ 8
Figure 3 Fish Screen Measurement Locations During Low Flow .............................................. 9
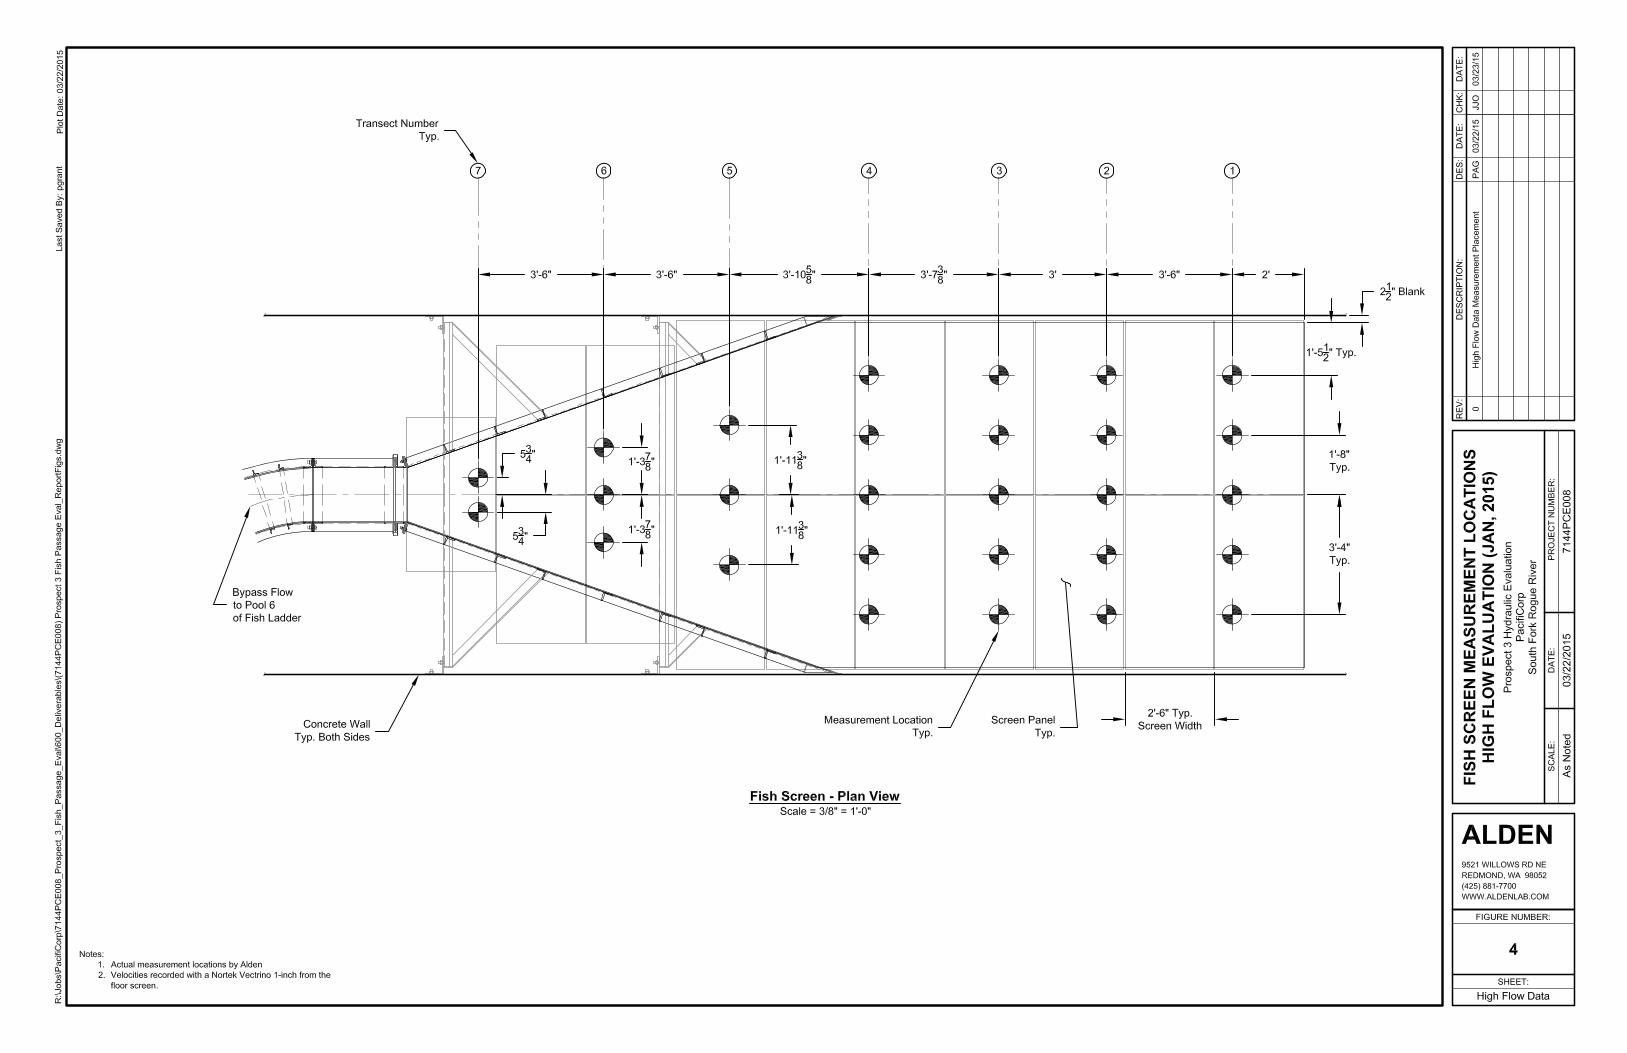
Figure 4 Fish Screen Measurement Locations During High Flow ........................................... 10
Figure 5 Flow Correlation Between Big Butte Creek and South Fork Rogue .......................... 24
Figure 6 Flow Correlation Between Rivers During the High Flow Evaluation........................ 25
Figure 7 South Fork and Bypass Flows During the High Water Measurements ...................... 26
Figure 8 Bypass Design Flow Curve Compared to Measurement ............................................ 28
Figure 9 Fish Ladder Exit Rating Curve ................................................................................... 35
v
List of Photos
Photo 1 Prospect 3 Fish Ladder and Bypass Canal (High Flow) ............................................... 3
Photo 2 Fish Screen (Looking Upstream) in a Dewatered Condition Before Pressure Washing. 4
Photo 3 Fish Screen at High Flow (Looking Downstream) ....................................................... 5
Photo 4 Measurement of Freeboard During the High Flow Evaluation .................................. 11
Photo 5 PLC Display at Peak Flow During the High Flow Evaluation ................................... 12
Photo 6 Measuring Water Depth Over Weir 5 ......................................................................... 13
Photo 7 Weir Notch Velocity Measurement Over Weir 7 ....................................................... 15
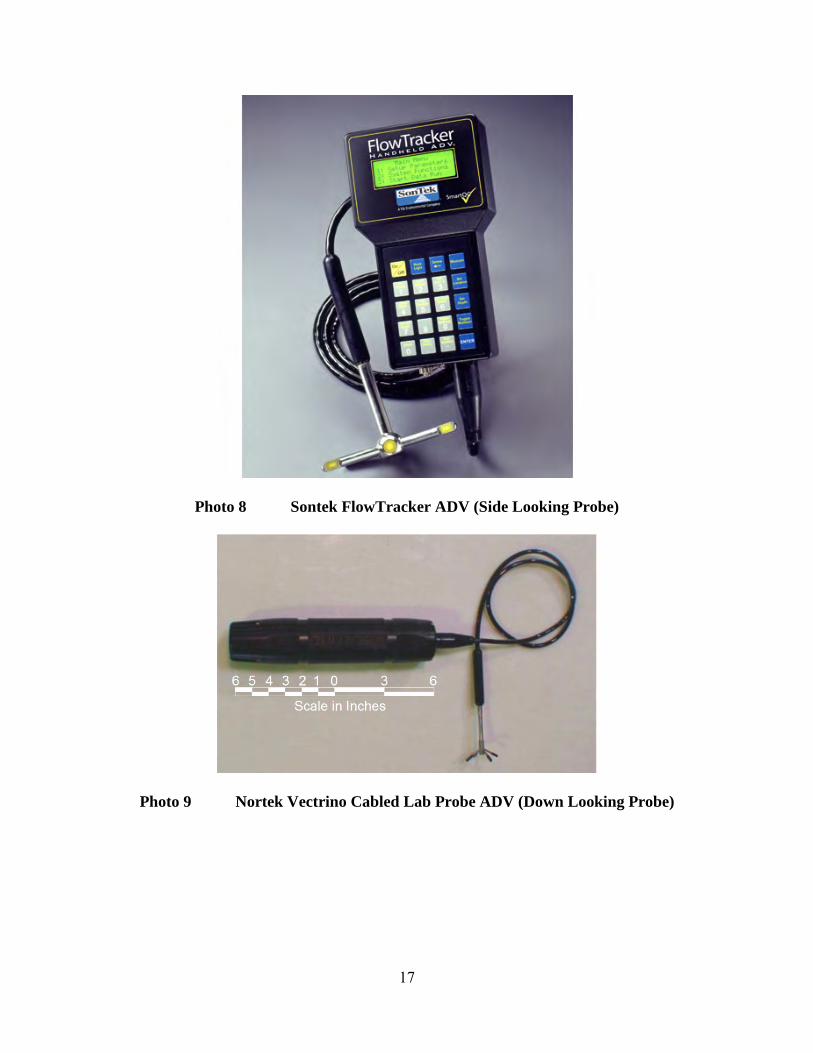
Photo 8 Sontek FlowTracker ADV (Side Looking Probe) ...................................................... 17
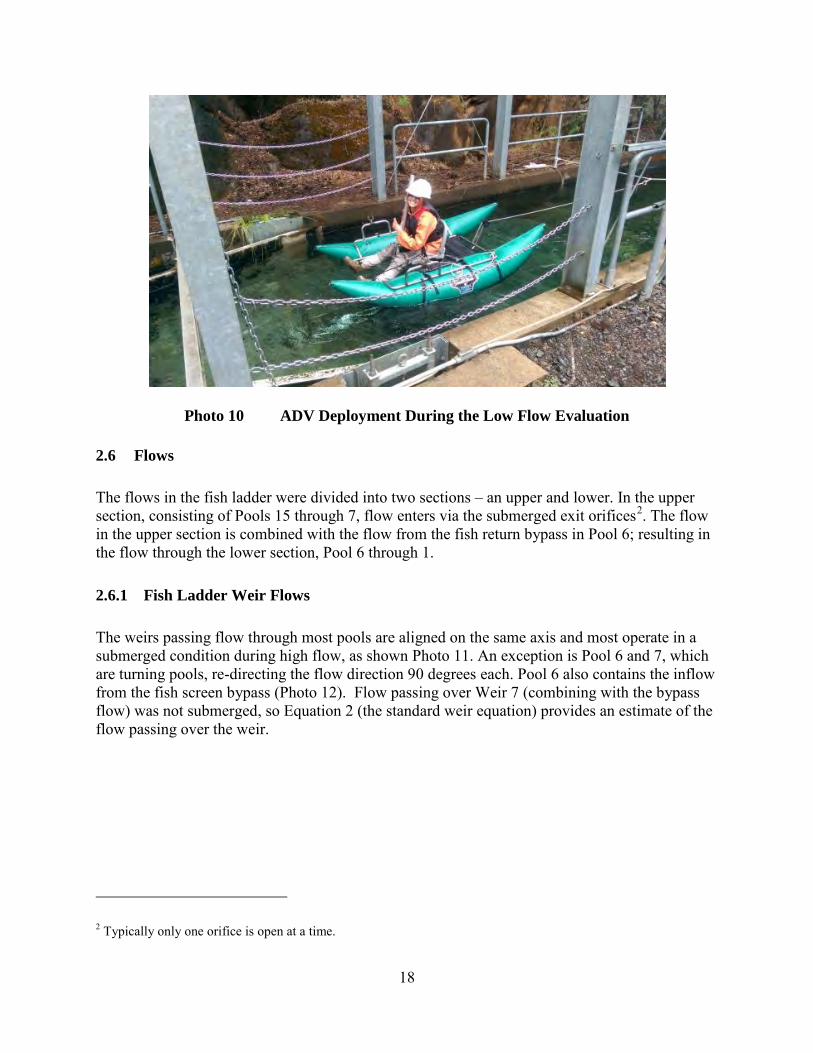
Photo 9 Nortek Vectrino Cabled Lab Probe ADV (Down Looking Probe) ............................ 17
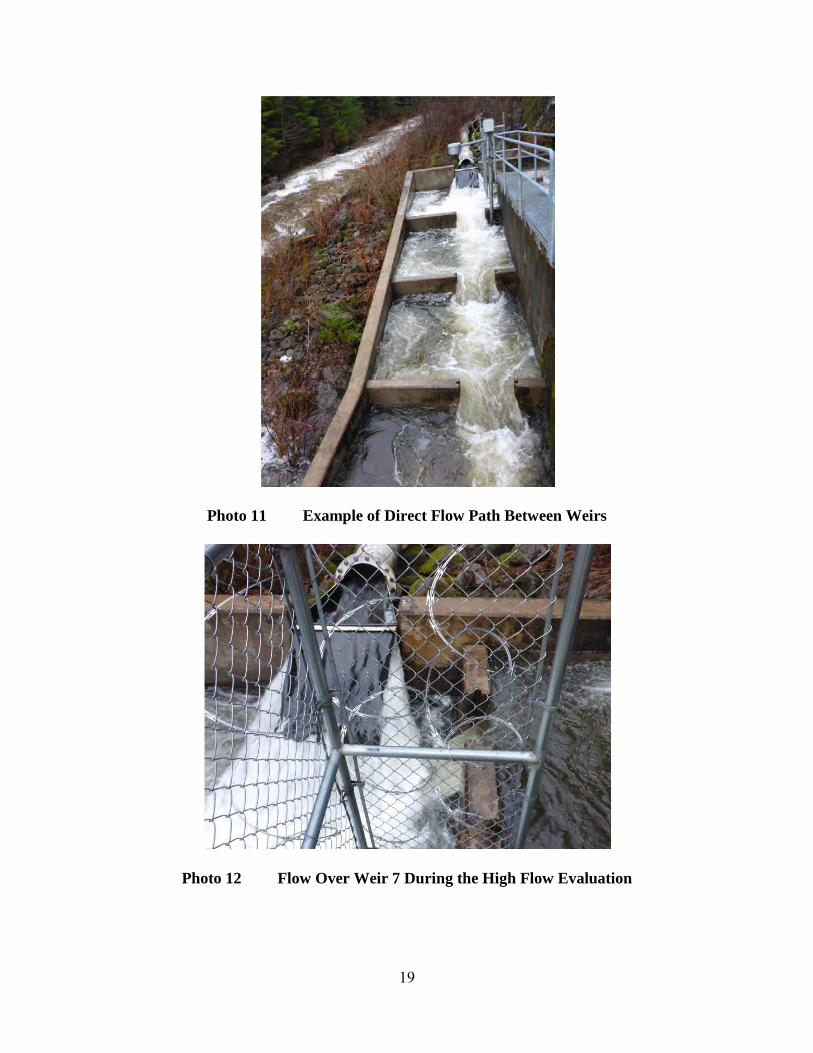
Photo 10 ADV Deployment During the Low Flow Evaluation ................................................. 18
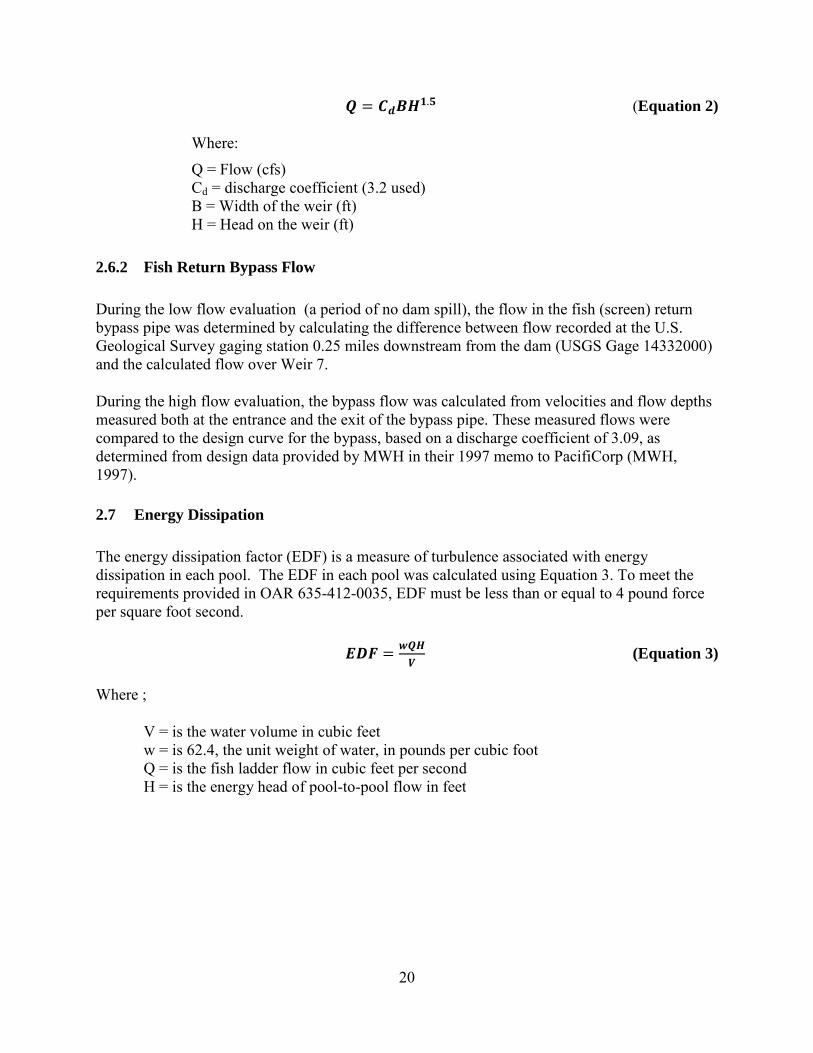
Photo 11 Example of Direct Flow Path Between Weirs ............................................................ 19
Photo 12 Flow Over Weir 7 During the High Flow Evaluation ................................................ 19
Photo 13 No Spill During the Low Flow Evaluation ................................................................. 22
Photo 14 River Conditions During the Low Flow Evaluation (Looking Downstream) ............ 22
Photo 15 Dam Spill and Canal Flow During High Flow Conditions ........................................ 27
Photo 16 River Conditions During High Flow Evaluation (Looking Downstream) ................. 27
Photo 17 Stem Positions During High Flow Measurements ..................................................... 31
Photo 18 Physical Inspection: Weirs 14 and 15......................................................................... 36
Photo 19 Bottom Seal Along Fish Screen.................................................................................. 40
1
1.0 Introduction
PacifiCorp plans to file an application for a new license to continue operating the Prospect No. 3 Hydroelectric Project (Project), Federal Energy Regulatory Commission (FERC or Commission) No. P-2337, on the South Fork River in Jackson County, Oregon. The current license was issued on January 30, 1989 for a period of thirty years, expiring on December 31, 2018. As part of FERC’s Integrated Licensing Process (ILP), a study to assess the effectiveness of the existing fish passage facilities was initiated during the summer of 2014. PacifiCorp personnel conducted a hydraulic assessment of the fish passage facilities under low flow conditions in July-August of 2014. Alden Research Laboratory (Alden) was retained under contract to complete the hydraulic assessment during high flow conditions. The high flow condition measurements were made in January of 2015. The results of both the low and the high water assessments are included in this report.
1.1 Background
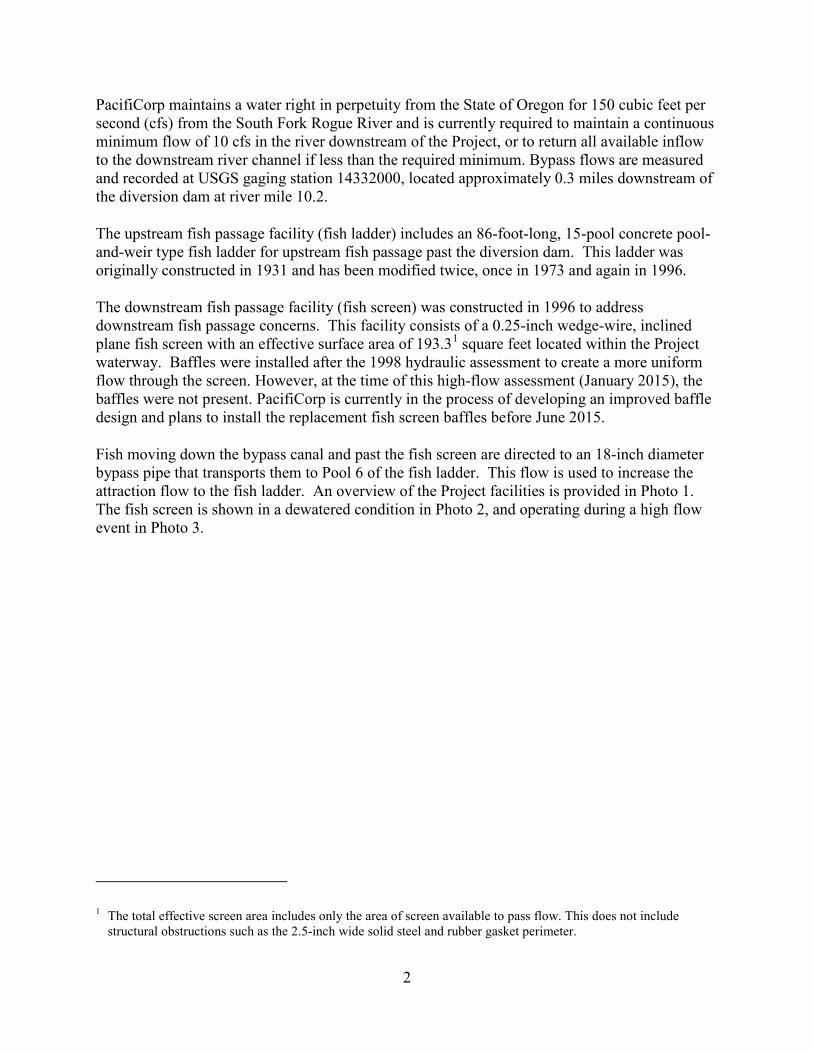
The Project is located at river mile 10.5 on the South Fork Rogue River, east of the unincorporated community of Prospect in northeast Jackson County, Oregon (Figure 1).
Figure 1 Location of Prospect 3 Hydroelectric Project
The Project includes a 172-foot-long, 24-foot-high concrete diversion dam with a 98-foot-long un-gated ogee spillway, and contains both upstream and downstream fish passage facilities. The Project produces 7.2 megawatts (MW) and is operated as a run-of-river hydroelectric facility.
2
PacifiCorp maintains a water right in perpetuity from the State of Oregon for 150 cubic feet per second (cfs) from the South Fork Rogue River and is currently required to maintain a continuous minimum flow of 10 cfs in the river downstream of the Project, or to return all available inflow to the downstream river channel if less than the required minimum. Bypass flows are measured and recorded at USGS gaging station 14332000, located approximately 0.3 miles downstream of the diversion dam at river mile 10.2.
The upstream fish passage facility (fish ladder) includes an 86-foot-long, 15-pool concrete pool-and-weir type fish ladder for upstream fish passage past the diversion dam. This ladder was originally constructed in 1931 and has been modified twice, once in 1973 and again in 1996.
The downstream fish passage facility (fish screen) was constructed in 1996 to address downstream fish passage concerns. This facility consists of a 0.25-inch wedge-wire, inclined plane fish screen with an effective surface area of 193.31 square feet located within the Project waterway. Baffles were installed after the 1998 hydraulic assessment to create a more uniform flow through the screen. However, at the time of this high-flow assessment (January 2015), the baffles were not present. PacifiCorp is currently in the process of developing an improved baffle design and plans to install the replacement fish screen baffles before June 2015.
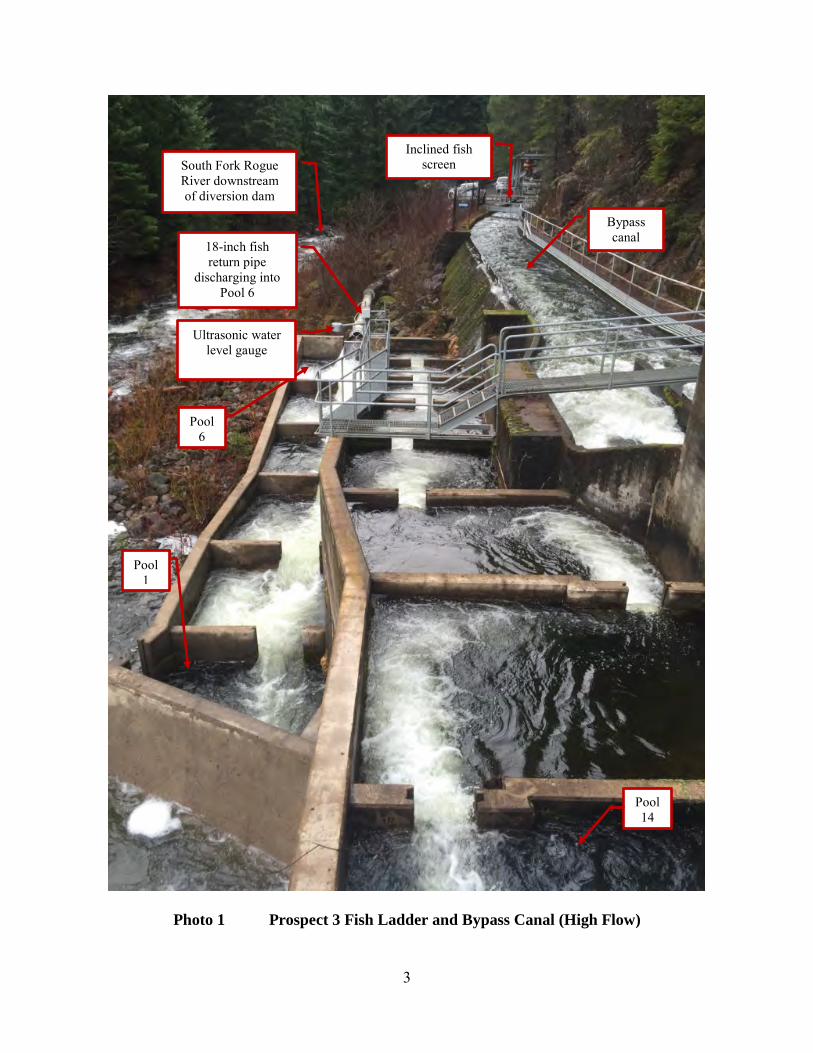
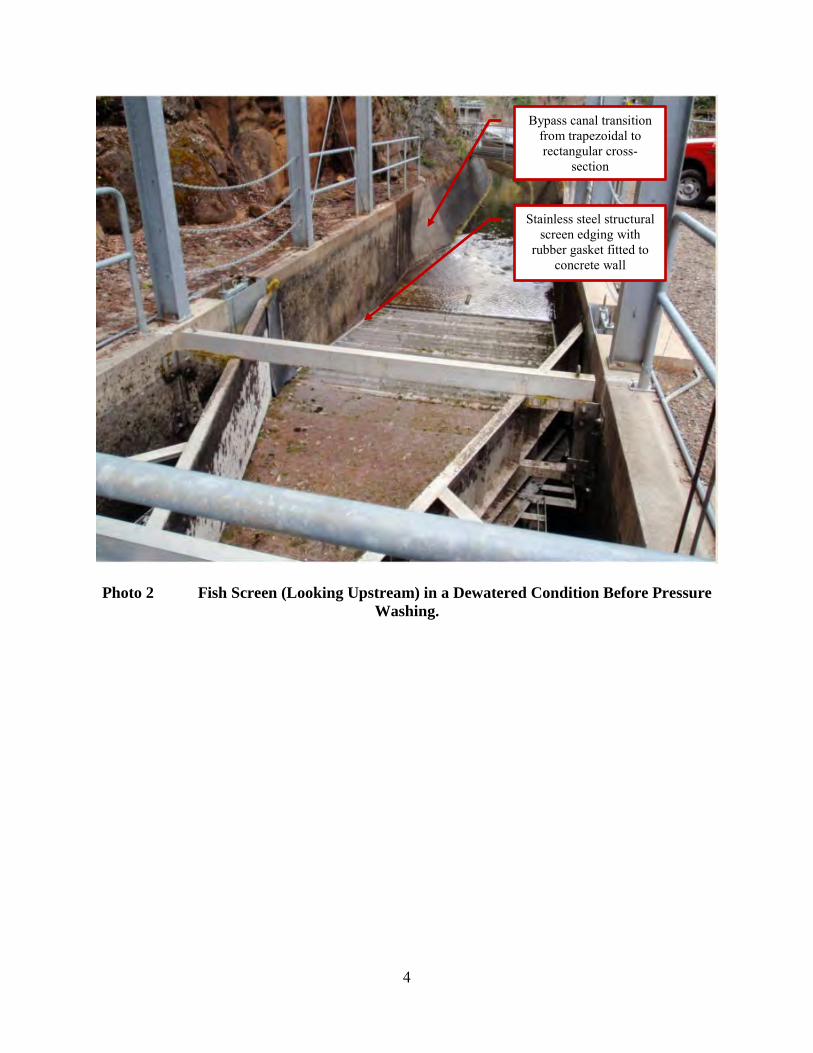
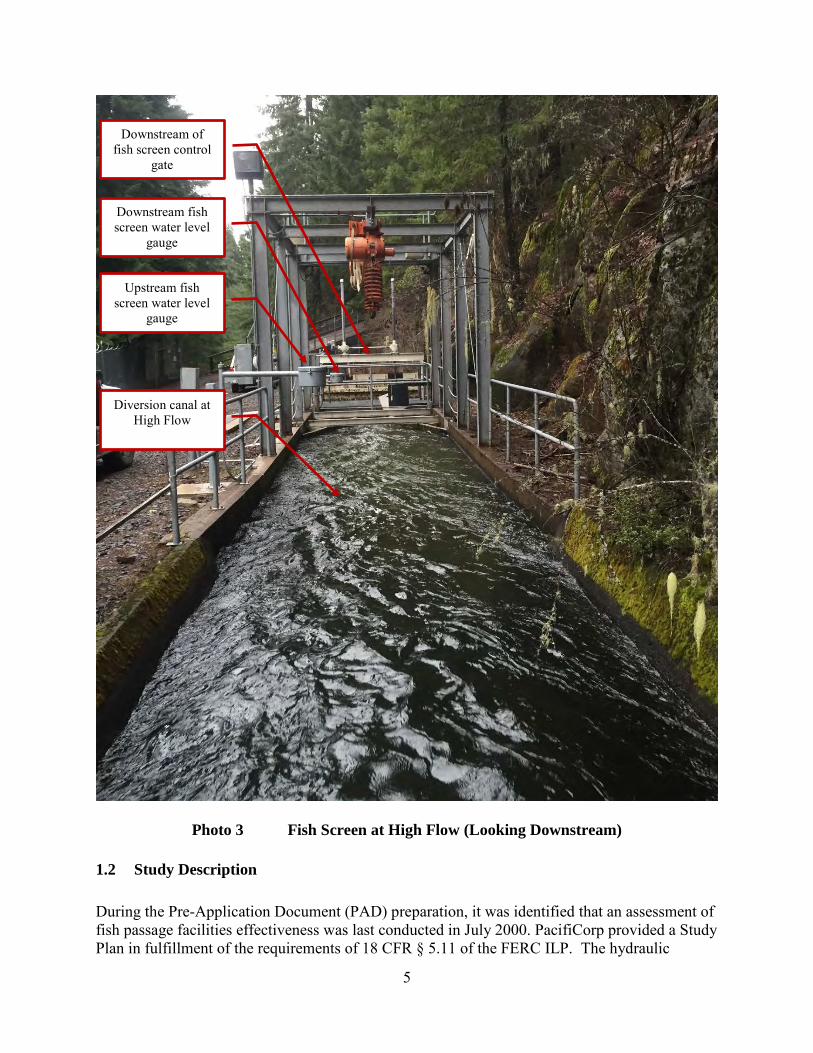
Fish moving down the bypass canal and past the fish screen are directed to an 18-inch diameter bypass pipe that transports them to Pool 6 of the fish ladder. This flow is used to increase the attraction flow to the fish ladder. An overview of the Project facilities is provided in Photo 1. The fish screen is shown in a dewatered condition in Photo 2, and operating during a high flow event in Photo 3.
1 The total effective screen area includes only the area of screen available to pass flow. This does not include structural obstructions such as the 2.5-inch wide solid steel and rubber gasket perimeter.
3
Photo 1 Prospect 3 Fish Ladder and Bypass Canal (High Flow)
Bypass canal
Inclined fish screen South Fork Rogue
River downstream of diversion dam
18-inch fish return pipe
discharging into Pool 6
Pool 1
Pool 6
Pool 14
Ultrasonic water level gauge
4
Photo 2 Fish Screen (Looking Upstream) in a Dewatered Condition Before Pressure Washing.
Bypass canal transition from trapezoidal to rectangular cross-
section
Stainless steel structural screen edging with
rubber gasket fitted to concrete wall
5
Photo 3 Fish Screen at High Flow (Looking Downstream)
1.2 Study Description
During the Pre-Application Document (PAD) preparation, it was identified that an assessment of fish passage facilities effectiveness was last conducted in July 2000. PacifiCorp provided a Study Plan in fulfillment of the requirements of 18 CFR § 5.11 of the FERC ILP. The hydraulic
Upstream fish screen water level
gauge
Downstream fish screen water level
gauge
Diversion canal at High Flow
Downstream of fish screen control
gate
6
assessment of the existing Project fish passage facilities was to be conducted for both the fish ladder (upstream passage) and fish screen (downstream passage) as described in the Study Plan (PacifiCorp, 2014).
The hydraulic parameters of the fish passage facilities vary with river flow, so the assessment was conducted during both low and high flow periods. Per OAR 635-412-0035, fishway design must accommodate fish passage over a range of flows, from the 5th to the 95th percentile exceedance flows, 444 cfs and 60 cfs, respectively for the South Fork Rogue at the Project diversion dam. The flows at the Project are calculated by the summation of the flow in the diversion canal plus the flow measured at the downstream gage (USGS Gage 14332000). Field operations for these studies were planned to correlate as closely as possible to the 5th and 95th percentile exceedance flows.
1.3 Study Objectives
The goal of the study was to evaluate the hydraulics of the existing fish passage facilities as they relate to passage of resident trout upstream and downstream of the Project diversion dam and to determine if key physical parameters are in compliance with Oregon fish passage criteria (ODFW, 2015) The Study Plan objectives were to:
1. Evaluate physical parameters of the upstream passage facility; 2. Evaluate the upstream fish passage hydraulic conditions; 3. Evaluate physical parameters of the downstream passage facility; and 4. Evaluate the screening facility hydraulic conditions.
1.4 Upstream (Fish Ladder) and Downstream (Fish Screen) Criteria PacifiCorp adopted the physical parameters recommended for assessment by ILP participants. These parameters were selected because they are important to effective fish passage. The physical characteristics recommended by ILP participants are summarized in Table 1 and Table 2.
Where direct measurements of the parameters could not be accurately or safely measured, best professional judgment (BPJ) and indirect methods using accepted hydraulic relationships were used. In addition to the hydraulic characteristics of the fish ladder, the physical condition of the fish ladder was evaluated during Alden’s high flow evaluation.
Figure 2 shows a plan view of the fish ladder and illustrates the numbers used to denote the pools and respective weirs. Figure 3 shows a plan view of the fish screen and the measurement locations reported for the low flow evaluation. Figure 4 shows the measurement locations used during the high-flow evaluation.
7
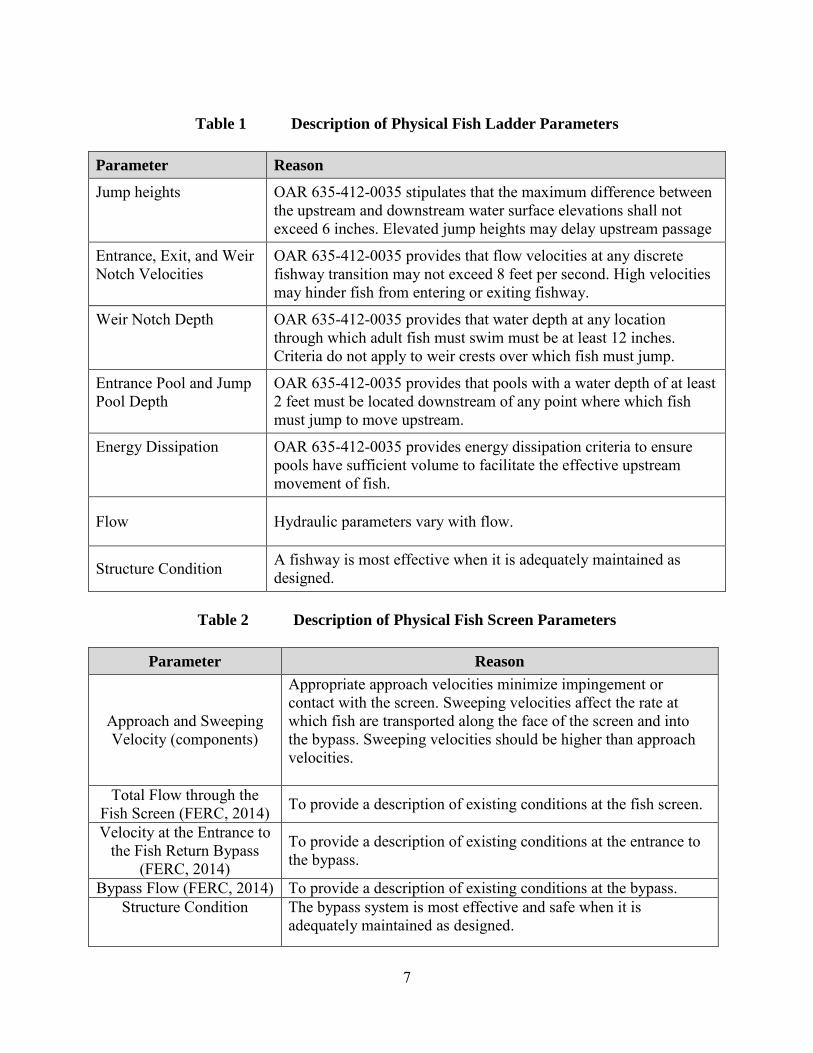
Table 1 Description of Physical Fish Ladder Parameters
Parameter Reason
Jump heights OAR 635-412-0035 stipulates that the maximum difference between the upstream and downstream water surface elevations shall not exceed 6 inches. Elevated jump heights may delay upstream passage
Entrance, Exit, and Weir Notch Velocities
OAR 635-412-0035 provides that flow velocities at any discrete fishway transition may not exceed 8 feet per second. High velocities may hinder fish from entering or exiting fishway.
Weir Notch Depth OAR 635-412-0035 provides that water depth at any location through which adult fish must swim must be at least 12 inches. Criteria do not apply to weir crests over which fish must jump.
Entrance Pool and Jump Pool Depth
OAR 635-412-0035 provides that pools with a water depth of at least 2 feet must be located downstream of any point where which fish must jump to move upstream.
Energy Dissipation OAR 635-412-0035 provides energy dissipation criteria to ensure pools have sufficient volume to facilitate the effective upstream movement of fish.
Flow Hydraulic parameters vary with flow.
Structure Condition A fishway is most effective when it is adequately maintained as designed.
Table 2 Description of Physical Fish Screen Parameters
Parameter Reason
Approach and Sweeping Velocity (components)
Appropriate approach velocities minimize impingement or contact with the screen. Sweeping velocities affect the rate at which fish are transported along the face of the screen and into the bypass. Sweeping velocities should be higher than approach velocities.
Total Flow through the Fish Screen (FERC, 2014) To provide a description of existing conditions at the fish screen.
Velocity at the Entrance to the Fish Return Bypass
(FERC, 2014)
To provide a description of existing conditions at the entrance to the bypass.
Bypass Flow (FERC, 2014) To provide a description of existing conditions at the bypass. Structure Condition The bypass system is most effective and safe when it is
adequately maintained as designed.

11
2.0 Instrumentation, Measurement, and Methods
Determination of the parameters noted in Table 1 and Table 2 requires the physical measurement of water surface elevations, water depths, other physical attributes such as lengths, widths, and depths of walls or screens, and the measurement of water velocities.
2.1 Water Surface Elevations
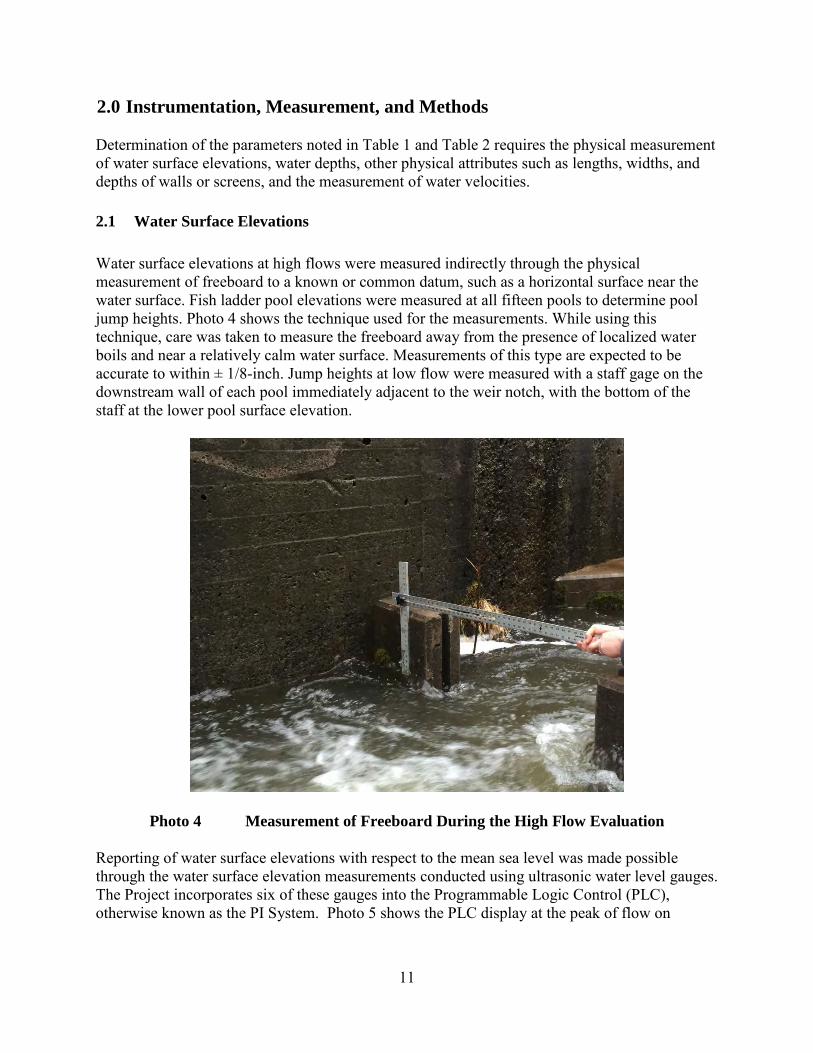
Water surface elevations at high flows were measured indirectly through the physical measurement of freeboard to a known or common datum, such as a horizontal surface near the water surface. Fish ladder pool elevations were measured at all fifteen pools to determine pool jump heights. Photo 4 shows the technique used for the measurements. While using this technique, care was taken to measure the freeboard away from the presence of localized water boils and near a relatively calm water surface. Measurements of this type are expected to be accurate to within ± 1/8-inch. Jump heights at low flow were measured with a staff gage on the downstream wall of each pool immediately adjacent to the weir notch, with the bottom of the staff at the lower pool surface elevation.
Photo 4 Measurement of Freeboard During the High Flow Evaluation
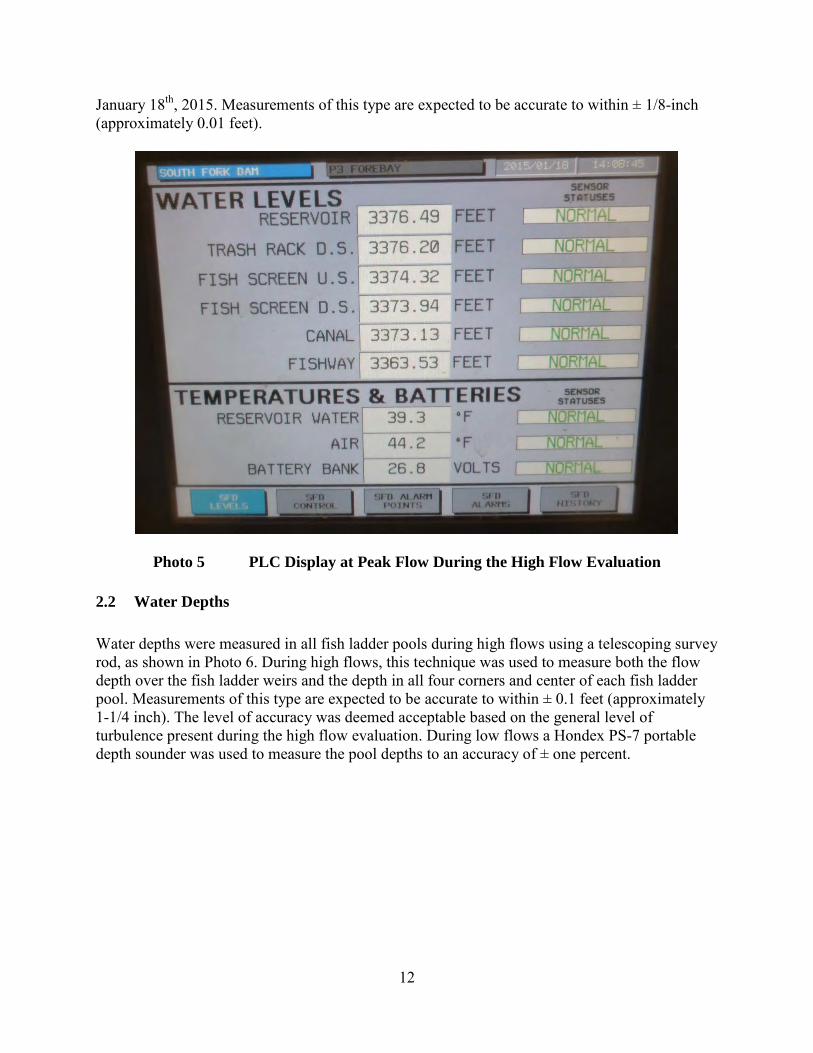
Reporting of water surface elevations with respect to the mean sea level was made possible through the water surface elevation measurements conducted using ultrasonic water level gauges. The Project incorporates six of these gauges into the Programmable Logic Control (PLC), otherwise known as the PI System. Photo 5 shows the PLC display at the peak of flow on
12
January 18th, 2015. Measurements of this type are expected to be accurate to within ± 1/8-inch (approximately 0.01 feet).
Photo 5 PLC Display at Peak Flow During the High Flow Evaluation
2.2 Water Depths
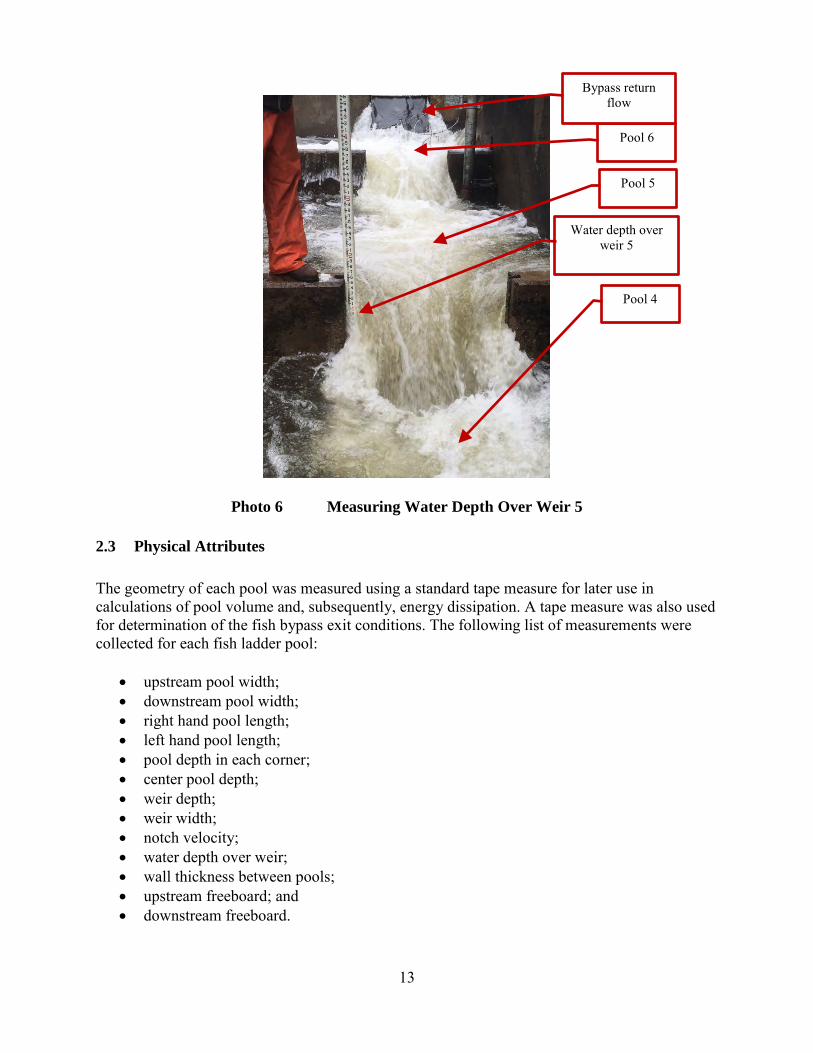
Water depths were measured in all fish ladder pools during high flows using a telescoping survey rod, as shown in Photo 6. During high flows, this technique was used to measure both the flow depth over the fish ladder weirs and the depth in all four corners and center of each fish ladder pool. Measurements of this type are expected to be accurate to within ± 0.1 feet (approximately 1-1/4 inch). The level of accuracy was deemed acceptable based on the general level of turbulence present during the high flow evaluation. During low flows a Hondex PS-7 portable depth sounder was used to measure the pool depths to an accuracy of ± one percent.
13
Photo 6 Measuring Water Depth Over Weir 5
2.3 Physical Attributes
The geometry of each pool was measured using a standard tape measure for later use in calculations of pool volume and, subsequently, energy dissipation. A tape measure was also used for determination of the fish bypass exit conditions. The following list of measurements were collected for each fish ladder pool:
• upstream pool width; • downstream pool width; • right hand pool length; • left hand pool length; • pool depth in each corner; • center pool depth; • weir depth; • weir width; • notch velocity; • water depth over weir; • wall thickness between pools; • upstream freeboard; and • downstream freeboard.
Water depth over weir 5
Pool 5
Pool 6
Pool 4
Bypass return flow
14
2.4 Jump Heights
Jump heights were calculated as the distance between water heights upstream and downstream of the weirs.
2.5 Velocities
Velocities were measured in front of the fish screens, at the entrance to the fish return bypass, and in the ladder over weir notches. Velocities were also calculated by dividing flow rates by flow areas. PacifiCorp will be implementing a replacement fish screen baffling system to improve the velocity distribution in front of the screens. Following implementation of the baffling system, the velocity measurements will be repeated for both low and high flow conditions using Alden’s techniques described in the following sections.
2.5.1 Weir Notch Velocities
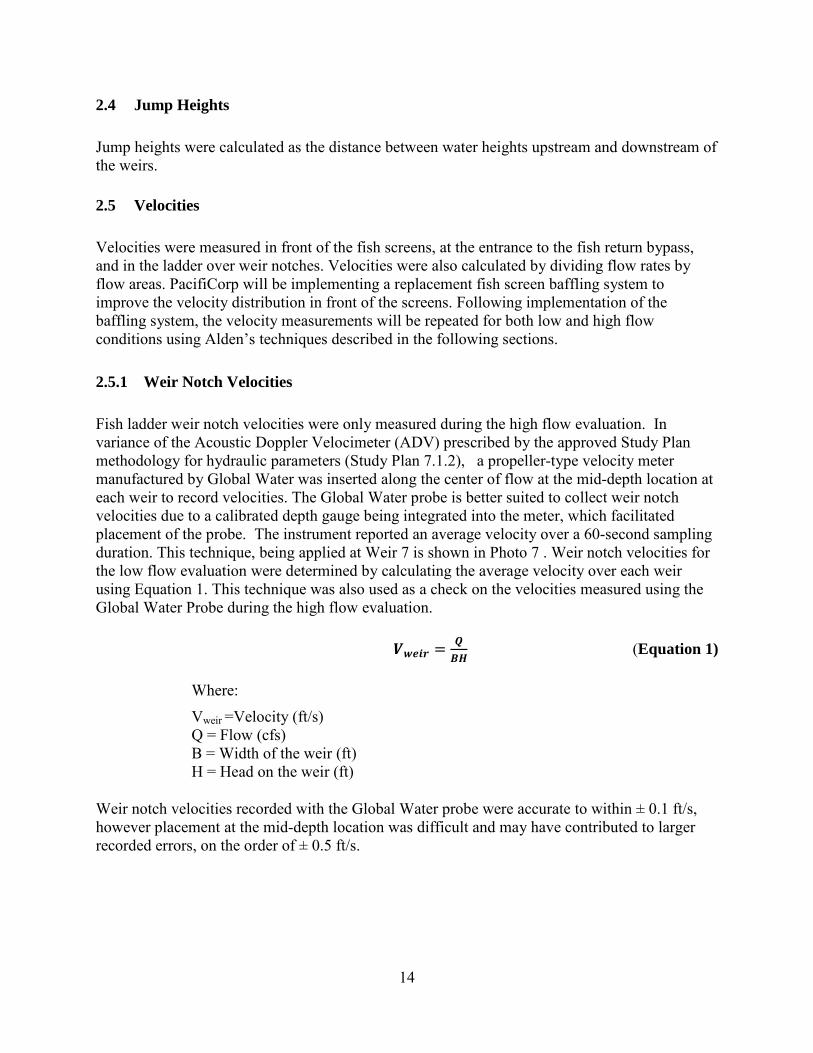
Fish ladder weir notch velocities were only measured during the high flow evaluation. In variance of the Acoustic Doppler Velocimeter (ADV) prescribed by the approved Study Plan methodology for hydraulic parameters (Study Plan 7.1.2), a propeller-type velocity meter manufactured by Global Water was inserted along the center of flow at the mid-depth location at each weir to record velocities. The Global Water probe is better suited to collect weir notch velocities due to a calibrated depth gauge being integrated into the meter, which facilitated placement of the probe. The instrument reported an average velocity over a 60-second sampling duration. This technique, being applied at Weir 7 is shown in Photo 7 . Weir notch velocities for the low flow evaluation were determined by calculating the average velocity over each weir using Equation 1. This technique was also used as a check on the velocities measured using the Global Water Probe during the high flow evaluation.
𝑽𝒘𝒘𝒘𝒘 = 𝑸𝑩𝑩
(Equation 1)
Where:
Vweir =Velocity (ft/s) Q = Flow (cfs) B = Width of the weir (ft) H = Head on the weir (ft)
Weir notch velocities recorded with the Global Water probe were accurate to within ± 0.1 ft/s, however placement at the mid-depth location was difficult and may have contributed to larger recorded errors, on the order of ± 0.5 ft/s.
15
Photo 7 Weir Notch Velocity Measurement Over Weir 7
2.5.2 Submerged Orifice Velocities
The upstream fish ladder exit is a submerged rectangular opening (2.5 ft. x 1.3 ft) oriented near the bottom of the river. The average exit velocity was calculated by dividing the flow through the exit (the same flow as that passing over Weirs 7 through 15 – the upper section) by the open orifice area. For practical considerations, it was assumed that there was negligible blockage of the orifice by debris.
2.5.3 Fish Return Bypass Entrance Velocity
Bypass entrance velocities were recorded with the Global Water probe and are assumed to be accurate to within ± 0.5 ft/s, based on probe placement. The velocity was recorded in the bypass channel at the terminus of the fish screen. Due to practical limitations for probe deployment, repeat measurements were collected within the flow area at the entrance, and engineering judgment was utilized to select the measured velocity representative of the average for the flow. The selected location of the measurement was along the centerline of the channel near mid-depth.
16
2.5.4 Fish Screen Velocities
Fish screen approach (Va) and sweeping (Vs) velocity components were measured using acoustic-Doppler velocimeters (ADVs). PacifiCorp used a Sontek FlowTracker (Photo 8) and Alden used a Nortek Vectrino (Photo 9) during the low and high flow evaluations, respectively. Both evaluations recorded velocities at 28 positions, as previously illustrated in Figure 3 and Figure 4.
Differences in measurement location and distance from the screen were a result of differing deployment techniques. PacifiCorp utilized a vertical rod deployment stanchion, holding the side-looking ADV pointed vertically away from the screen. The deployment rod allowed a near perpendicular placement with respect to the screen face. and placed the measurement volume approximately 5-inches from the screen face. The rod was hand-held from an inflatable boat, which was rigged to a center guide wire (Photo 10).
Alden deployed a down-looking ADV from a stanchion constructed of steel plate and open rectangular tube, such that flow disturbances were minimized. The stanchion had a pivot point located 6-inches from the base which included a foot-pad to rest on the screen face and locate the ADV such that the Z-axis was pointed perpendicular to the screen and the measurement volume was located 1-inch from the floor and approximately 2-inches upstream of the stanchion. The stanchion was hand-braced against a temporary scaffold placed over the channel. In addition to the 28 screen velocities recorded, Alden also measured velocities at 20 equally spaced locations on a grid along a transect approximately 2-feet upstream of the screen to calculate the flow entering the screened portion of the canal.
The ADV measures three components of velocity on a Cartesian coordinate system. Both deployments utilized instrument hardware to orient the Z-axis of the probe with the vector normal to the screen face, thus recording the approach velocity directly. The sweeping velocity was determined as the resultant of the remaining two components. Data recorded for each velocity component were time-based averages over durations sufficient to reach a stabilized average measurement (typically 1-2 minute durations).
17
Photo 8 Sontek FlowTracker ADV (Side Looking Probe)
Photo 9 Nortek Vectrino Cabled Lab Probe ADV (Down Looking Probe)
18
Photo 10 ADV Deployment During the Low Flow Evaluation
2.6 Flows
The flows in the fish ladder were divided into two sections – an upper and lower. In the upper section, consisting of Pools 15 through 7, flow enters via the submerged exit orifices2. The flow in the upper section is combined with the flow from the fish return bypass in Pool 6; resulting in the flow through the lower section, Pool 6 through 1.
2.6.1 Fish Ladder Weir Flows
The weirs passing flow through most pools are aligned on the same axis and most operate in a submerged condition during high flow, as shown Photo 11. An exception is Pool 6 and 7, which are turning pools, re-directing the flow direction 90 degrees each. Pool 6 also contains the inflow from the fish screen bypass (Photo 12). Flow passing over Weir 7 (combining with the bypass flow) was not submerged, so Equation 2 (the standard weir equation) provides an estimate of the flow passing over the weir.
2 Typically only one orifice is open at a time.
19
Photo 11 Example of Direct Flow Path Between Weirs
Photo 12 Flow Over Weir 7 During the High Flow Evaluation
20
𝑸 = 𝑪𝒅𝑩𝑩𝟏.𝟓 (Equation 2)
Where:
Q = Flow (cfs) Cd = discharge coefficient (3.2 used) B = Width of the weir (ft) H = Head on the weir (ft)
2.6.2 Fish Return Bypass Flow
During the low flow evaluation (a period of no dam spill), the flow in the fish (screen) return bypass pipe was determined by calculating the difference between flow recorded at the U.S. Geological Survey gaging station 0.25 miles downstream from the dam (USGS Gage 14332000) and the calculated flow over Weir 7.
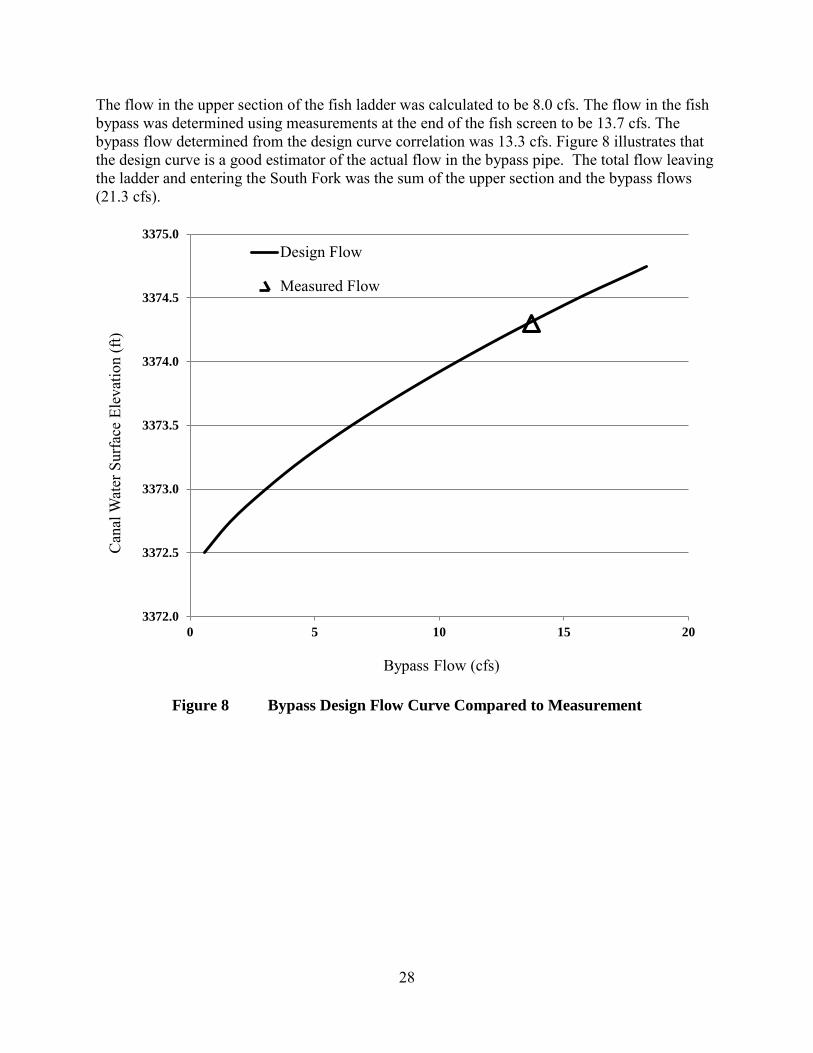
During the high flow evaluation, the bypass flow was calculated from velocities and flow depths measured both at the entrance and the exit of the bypass pipe. These measured flows were compared to the design curve for the bypass, based on a discharge coefficient of 3.09, as determined from design data provided by MWH in their 1997 memo to PacifiCorp (MWH, 1997).
2.7 Energy Dissipation
The energy dissipation factor (EDF) is a measure of turbulence associated with energy dissipation in each pool. The EDF in each pool was calculated using Equation 3. To meet the requirements provided in OAR 635-412-0035, EDF must be less than or equal to 4 pound force per square foot second.
𝑬𝑬𝑬 = 𝒘𝑸𝑩𝑽
(Equation 3)
Where ;
V = is the water volume in cubic feet w = is 62.4, the unit weight of water, in pounds per cubic foot Q = is the fish ladder flow in cubic feet per second H = is the energy head of pool-to-pool flow in feet
21
3.0 Test Conditions
3.1 Targeted Test Conditions
Tests were targeted for periods when the total river flows approximated the 5th and 95th percentile exceedance flows, 444 cfs and 60 cfs respectively. The total river flows are determined by adding the flow in the diversion canal to the flow measured downstream of the Project at the U.S. Geological Survey gaging station 0.25 miles downstream from the dam (USGS Gage 14332000). These flows represent two different operating regimes for the diversion and fish passage facilities.
For the low flow regime the total river flow would enter the diversion, with no flow passing over the project spillway. The diversion canal flow control gates, one upstream and a second downstream of the fish screen, would be manipulated to maintain a minimum of 10 cfs flow in the fish ladder at and below Pool 6 (or the full project inflow if less than 10 cfs). The remaining flow would be passed down the diversion canal downstream from the fish screens up to the maximum water right of 150 cfs.
For the high flow regime, flow in excess of the 150 cfs water right and the minimum 10 cfs in the fish ladder at and below Pool 6, would be passed over the spillway, with minor increases in the fish ladder and screen bypass pipe flows as dictated by the project impoundment water surface elevation and the ladder and bypass operational requirements to deliver safe fish passage conditions.
3.2 Low Flow Evaluation Conditions
The hydraulic analysis of the fish passage facilities under low flow conditions at the Project were measured by PacifiCorp. The targeted 95th-percentile exceedance flow conditions were 10 cfs exiting the ladder and 50 cfs in the canal.
PacifiCorp measured the jump heights in the fish ladder on June 1, 2014 and the remaining hydraulic parameters on July 2, 2014. The hydraulic conditions on these two days were very similar and represent no spill conditions. The total Project flow on July 2, 2014 was 104 cfs, with 14 cfs exiting the ladder and entering the South Fork, while this is greater than the 95th-percentile exceedance flow, the conditions in the fish ladder are expected to be sufficiently similar to the targeted flow condition. The flow at the fish ladder exit was calculated by PacifiCorp to be 2.0 cfs, resulting in 12 cfs in the bypass.
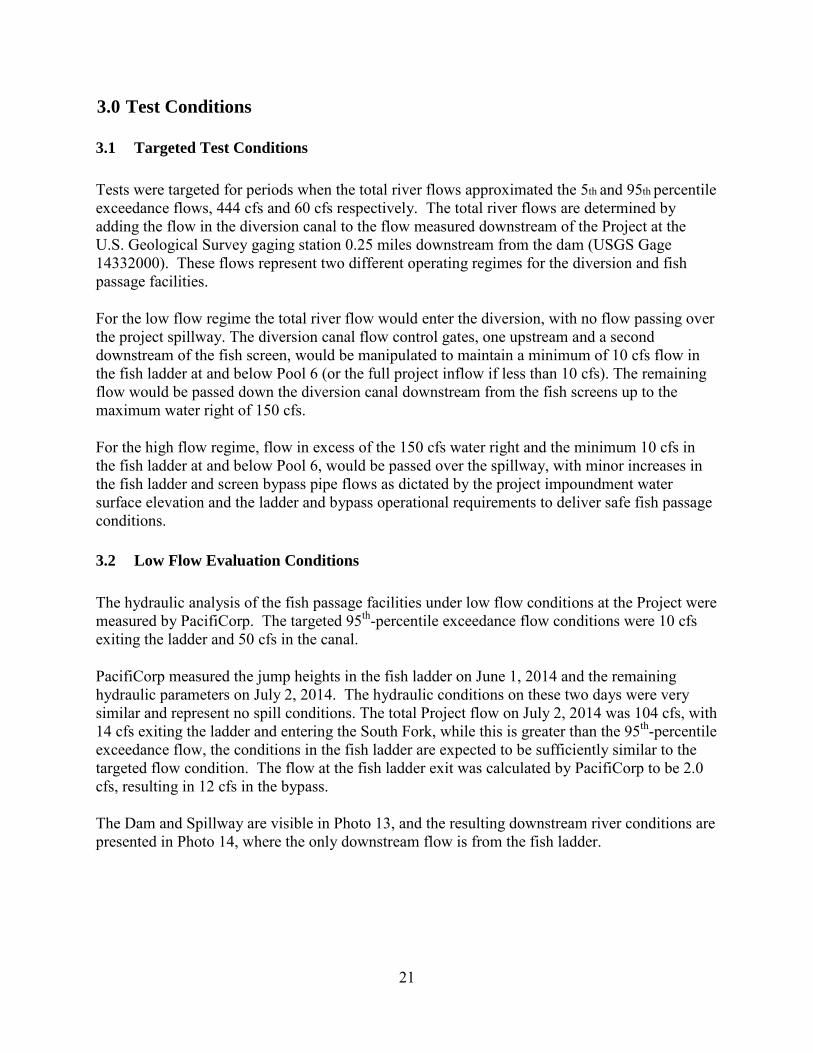
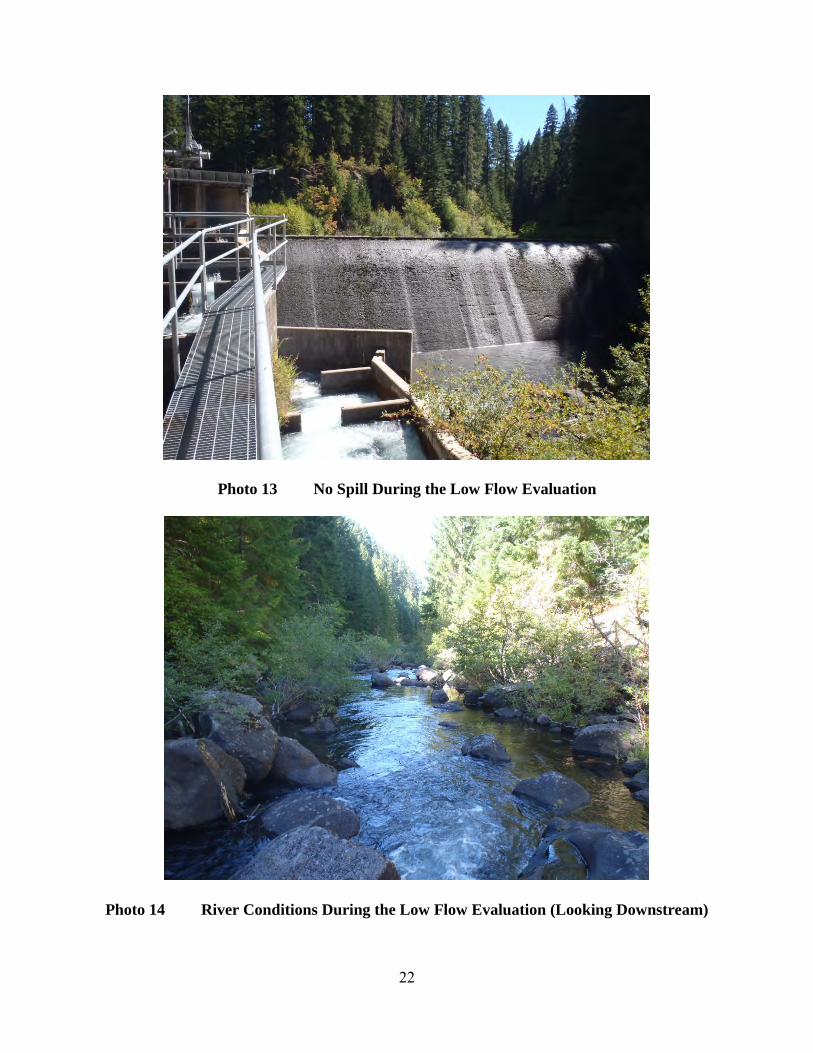
The Dam and Spillway are visible in Photo 13, and the resulting downstream river conditions are presented in Photo 14, where the only downstream flow is from the fish ladder.
22
Photo 13 No Spill During the Low Flow Evaluation
Photo 14 River Conditions During the Low Flow Evaluation (Looking Downstream)
23
The hydraulic conditions in the fish screen were measured on August 20, 2014. The diversion canal flow was 51 cfs and the downstream South Fork River flow exiting the ladder was 16 cfs.
3.3 High Flow Evaluation Conditions
The Study Plan indicates that high flow assessments would occur in May or June when snowmelt runoff contributes to relatively high flows. The FERC study plan determination was received on May 27, 2014, and after that time, flows were already significantly lower than the 5% exceedance flow. Therefore, PacifiCorp sought to target high flow events between January and March 2015 to provide study results and reporting in the first study season (May 2014 to May 2015) as required by the Study Plan.
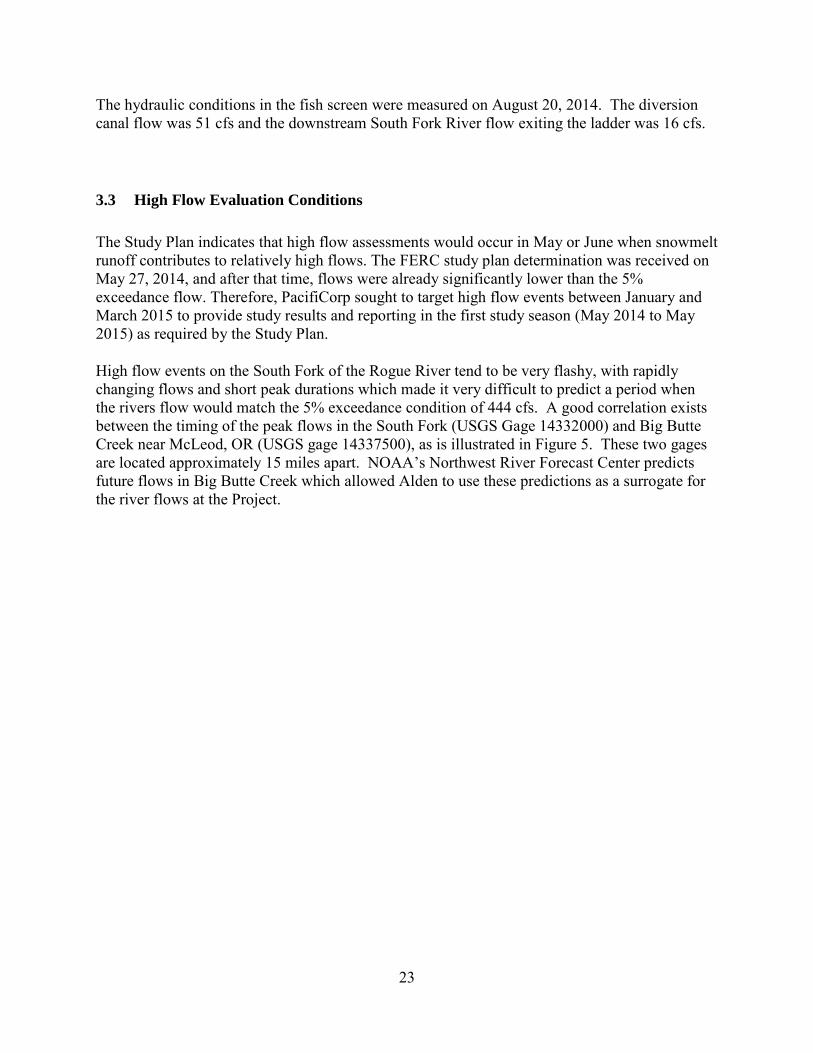
High flow events on the South Fork of the Rogue River tend to be very flashy, with rapidly changing flows and short peak durations which made it very difficult to predict a period when the rivers flow would match the 5% exceedance condition of 444 cfs. A good correlation exists between the timing of the peak flows in the South Fork (USGS Gage 14332000) and Big Butte Creek near McLeod, OR (USGS gage 14337500), as is illustrated in Figure 5. These two gages are located approximately 15 miles apart. NOAA’s Northwest River Forecast Center predicts future flows in Big Butte Creek which allowed Alden to use these predictions as a surrogate for the river flows at the Project.
24
Figure 5 Flow Correlation Between Big Butte Creek and South Fork Rogue
Based on a predicted high flow event for Big Butte, Alden measured the fish screen hydraulics on January 17th and the fish ladder hydraulics on January 18th, 2015. The correlation between rivers during the evaluation period is provided in Figure 6.
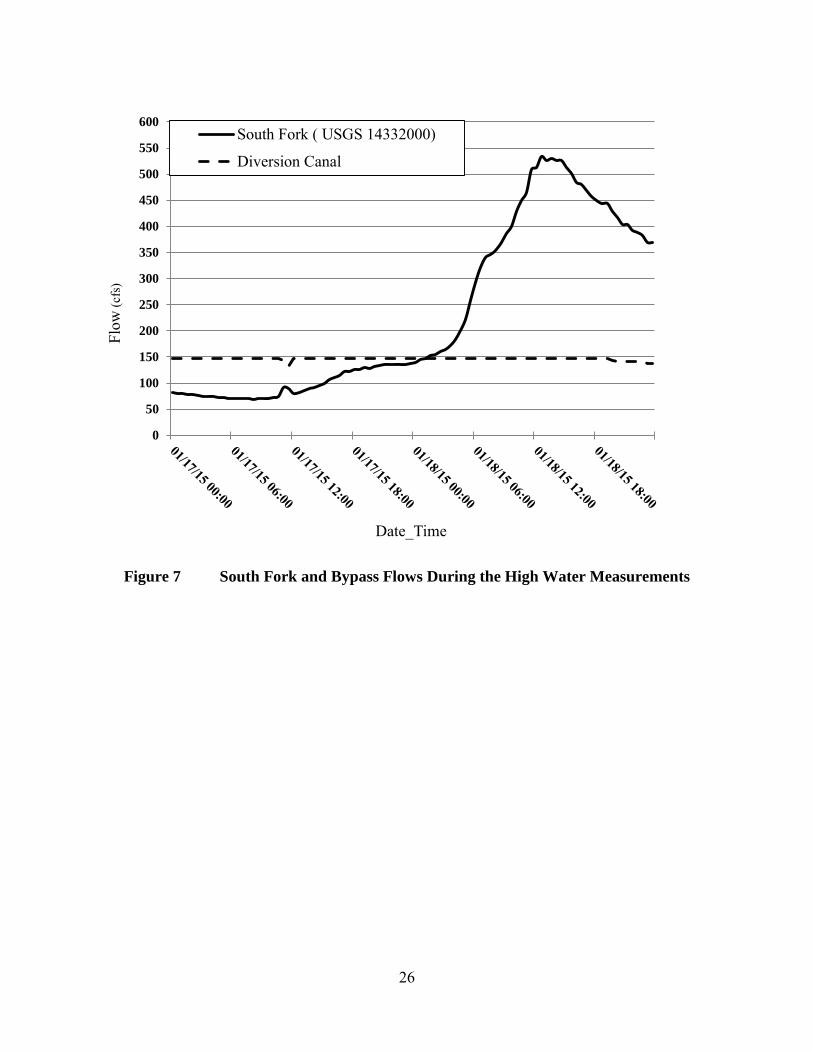
The flows in the South Fork and the diversion canal during the measurement period are shown in Figure 7. During this period the diversion canal flow was held relatively constant at 150 cfs downstream of the fish screens, the maximum permitted diversion. This was the expected diversion canal flow during 5% exceedance flow conditions. A South Fork river flow of 294 cfs as measured at USGS gage 14332000 was needed to reach the 5% exceedance conditions. As can be seen in Figure 7, the flow in the South Fork peaked at over 530 cfs at 2 PM on 01/18/2015.
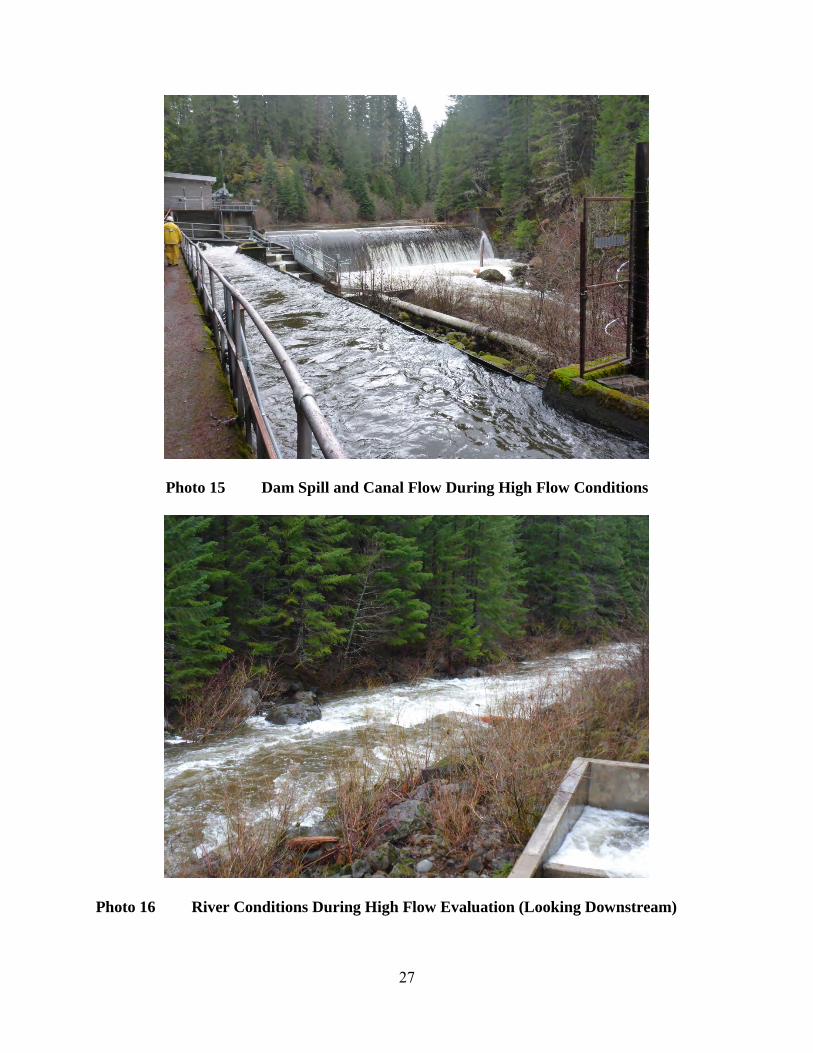
Photo 15 and Photo 16 show the dam, spillway condition, and respective downstream river hydraulics present during the high flow evaluation. White-water was present extending from the base of the spillway beyond view from the Project.
0
100
200
300
400
500
600
700
800
900
1000R
Iver
Flo
w (c
fs)
Date
South Fork (USGS 14332000)Big Butte (USGS 14337500)

25
Figure 6 Flow Correlation Between Rivers During the High Flow Evaluation
0
100
200
300
400
500
600
700
800Fl
ow (c
fs)
Date_Time
South Fork ( USGS 14332000)Big Butte ( USGS 14337500)
26
Figure 7 South Fork and Bypass Flows During the High Water Measurements
0
50
100
150
200
250
300
350
400
450
500
550
600Fl
ow (c
fs)
Date_Time
South Fork ( USGS 14332000)
Diversion Canal
27
Photo 15 Dam Spill and Canal Flow During High Flow Conditions
Photo 16 River Conditions During High Flow Evaluation (Looking Downstream)
28
The flow in the upper section of the fish ladder was calculated to be 8.0 cfs. The flow in the fish bypass was determined using measurements at the end of the fish screen to be 13.7 cfs. The bypass flow determined from the design curve correlation was 13.3 cfs. Figure 8 illustrates that the design curve is a good estimator of the actual flow in the bypass pipe. The total flow leaving the ladder and entering the South Fork was the sum of the upper section and the bypass flows (21.3 cfs).
Figure 8 Bypass Design Flow Curve Compared to Measurement
3372.0
3372.5
3373.0
3373.5
3374.0
3374.5
3375.0
0 5 10 15 20
Can
al W
ater
Sur
face
Ele
vatio
n (f
t)
Bypass Flow (cfs)
Design Flow
Measured Flow
29
4.0 Structure Performance
The following sections compare the measured performance with the OAR requirements.
4.1 Jump Heights
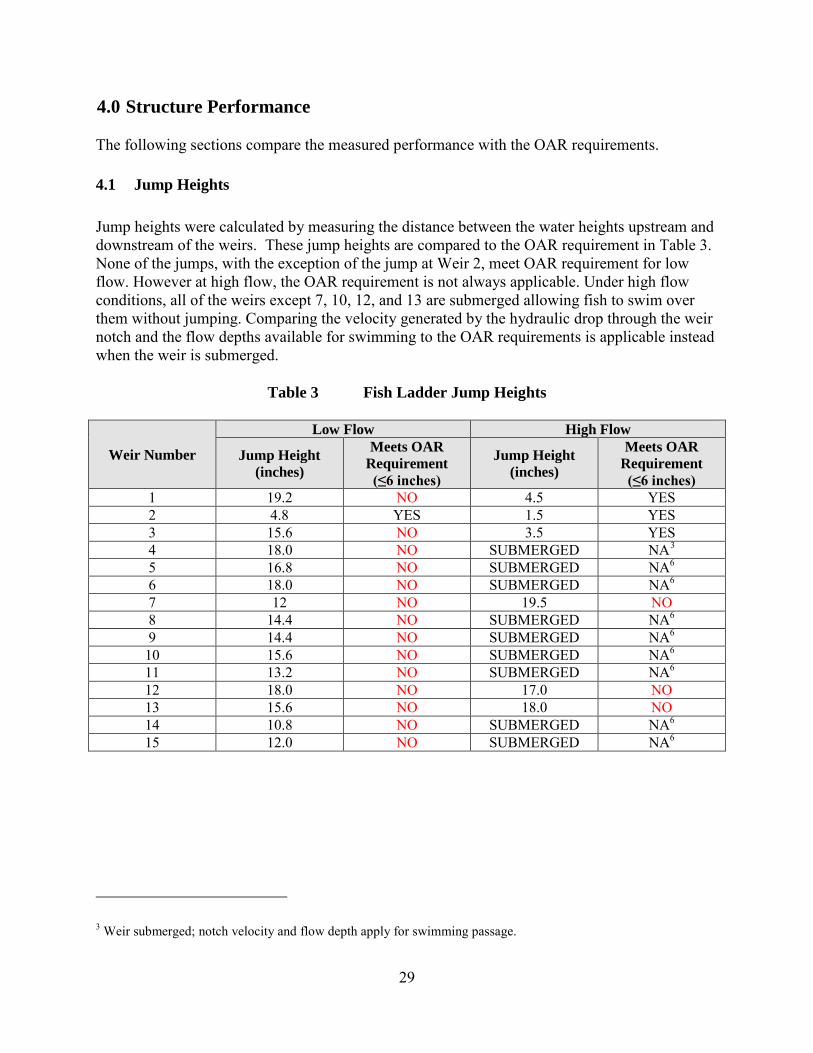
Jump heights were calculated by measuring the distance between the water heights upstream and downstream of the weirs. These jump heights are compared to the OAR requirement in Table 3. None of the jumps, with the exception of the jump at Weir 2, meet OAR requirement for low flow. However at high flow, the OAR requirement is not always applicable. Under high flow conditions, all of the weirs except 7, 10, 12, and 13 are submerged allowing fish to swim over them without jumping. Comparing the velocity generated by the hydraulic drop through the weir notch and the flow depths available for swimming to the OAR requirements is applicable instead when the weir is submerged.
Table 3 Fish Ladder Jump Heights
Weir Number
Low Flow High Flow
Jump Height (inches)
Meets OAR Requirement (≤6 inches)
Jump Height (inches)
Meets OAR Requirement (≤6 inches)
1 19.2 NO 4.5 YES 2 4.8 YES 1.5 YES 3 15.6 NO 3.5 YES 4 18.0 NO SUBMERGED NA3
5 16.8 NO SUBMERGED NA6 6 18.0 NO SUBMERGED NA6 7 12 NO 19.5 NO 8 14.4 NO SUBMERGED NA6 9 14.4 NO SUBMERGED NA6
10 15.6 NO SUBMERGED NA6 11 13.2 NO SUBMERGED NA6 12 18.0 NO 17.0 NO 13 15.6 NO 18.0 NO 14 10.8 NO SUBMERGED NA6 15 12.0 NO SUBMERGED NA6
3 Weir submerged; notch velocity and flow depth apply for swimming passage.
30
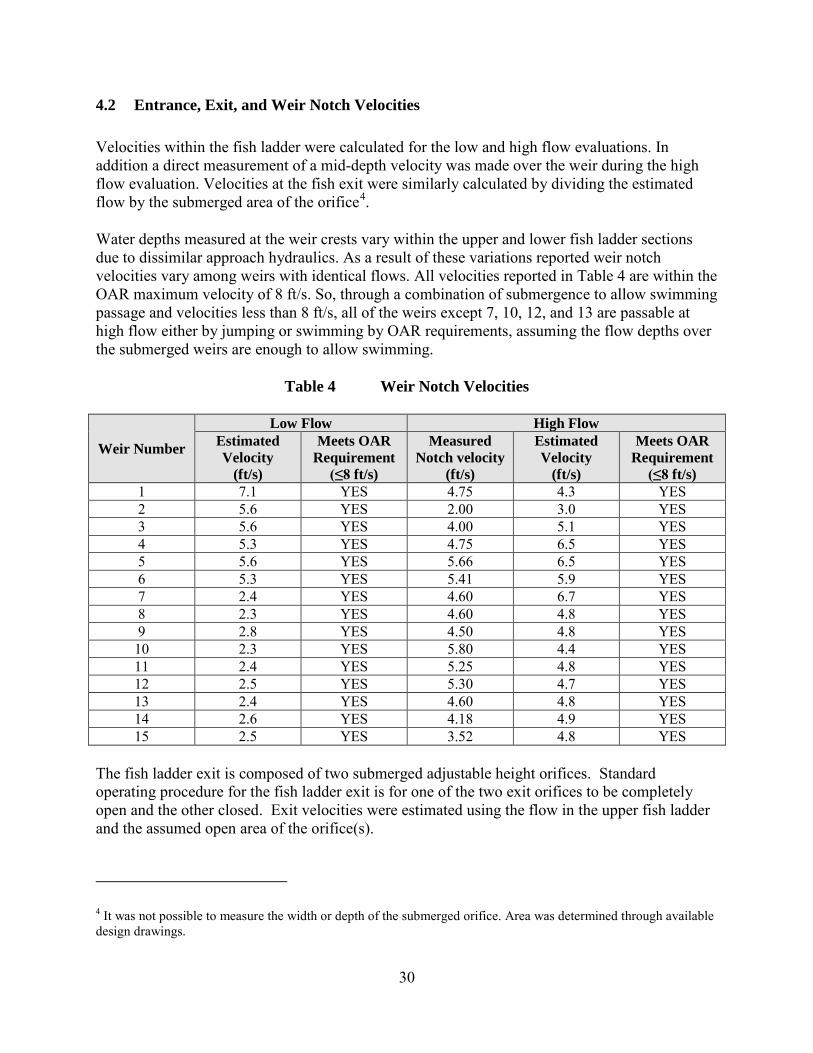
4.2 Entrance, Exit, and Weir Notch Velocities
Velocities within the fish ladder were calculated for the low and high flow evaluations. In addition a direct measurement of a mid-depth velocity was made over the weir during the high flow evaluation. Velocities at the fish exit were similarly calculated by dividing the estimated flow by the submerged area of the orifice4.
Water depths measured at the weir crests vary within the upper and lower fish ladder sections due to dissimilar approach hydraulics. As a result of these variations reported weir notch velocities vary among weirs with identical flows. All velocities reported in Table 4 are within the OAR maximum velocity of 8 ft/s. So, through a combination of submergence to allow swimming passage and velocities less than 8 ft/s, all of the weirs except 7, 10, 12, and 13 are passable at high flow either by jumping or swimming by OAR requirements, assuming the flow depths over the submerged weirs are enough to allow swimming.
Table 4 Weir Notch Velocities
Weir Number
Low Flow High Flow Estimated Velocity
(ft/s)
Meets OAR Requirement
(≤8 ft/s)
Measured Notch velocity
(ft/s)
Estimated Velocity
(ft/s)
Meets OAR Requirement
(≤8 ft/s) 1 7.1 YES 4.75 4.3 YES 2 5.6 YES 2.00 3.0 YES 3 5.6 YES 4.00 5.1 YES 4 5.3 YES 4.75 6.5 YES 5 5.6 YES 5.66 6.5 YES 6 5.3 YES 5.41 5.9 YES 7 2.4 YES 4.60 6.7 YES 8 2.3 YES 4.60 4.8 YES 9 2.8 YES 4.50 4.8 YES
10 2.3 YES 5.80 4.4 YES 11 2.4 YES 5.25 4.8 YES 12 2.5 YES 5.30 4.7 YES 13 2.4 YES 4.60 4.8 YES 14 2.6 YES 4.18 4.9 YES 15 2.5 YES 3.52 4.8 YES
The fish ladder exit is composed of two submerged adjustable height orifices. Standard operating procedure for the fish ladder exit is for one of the two exit orifices to be completely open and the other closed. Exit velocities were estimated using the flow in the upper fish ladder and the assumed open area of the orifice(s).
4 It was not possible to measure the width or depth of the submerged orifice. Area was determined through available design drawings.
31
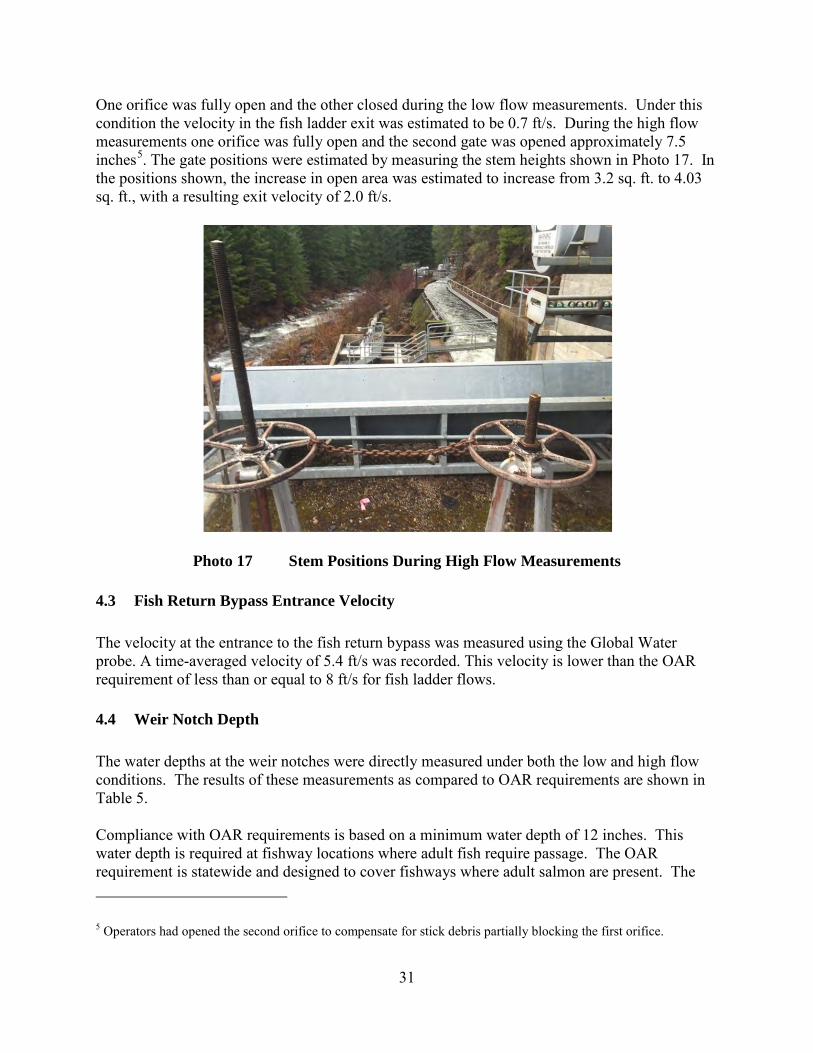
One orifice was fully open and the other closed during the low flow measurements. Under this condition the velocity in the fish ladder exit was estimated to be 0.7 ft/s. During the high flow measurements one orifice was fully open and the second gate was opened approximately 7.5 inches5. The gate positions were estimated by measuring the stem heights shown in Photo 17. In the positions shown, the increase in open area was estimated to increase from 3.2 sq. ft. to 4.03 sq. ft., with a resulting exit velocity of 2.0 ft/s.
Photo 17 Stem Positions During High Flow Measurements
4.3 Fish Return Bypass Entrance Velocity
The velocity at the entrance to the fish return bypass was measured using the Global Water probe. A time-averaged velocity of 5.4 ft/s was recorded. This velocity is lower than the OAR requirement of less than or equal to 8 ft/s for fish ladder flows.
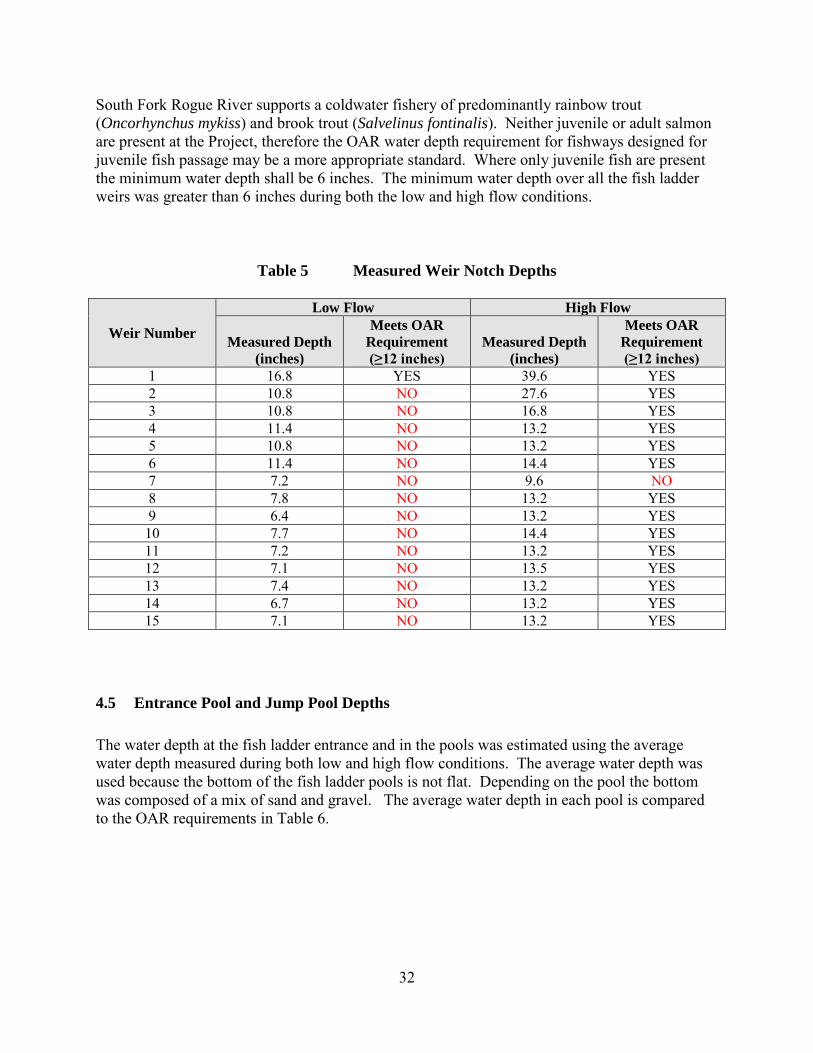
4.4 Weir Notch Depth
The water depths at the weir notches were directly measured under both the low and high flow conditions. The results of these measurements as compared to OAR requirements are shown in Table 5.
Compliance with OAR requirements is based on a minimum water depth of 12 inches. This water depth is required at fishway locations where adult fish require passage. The OAR requirement is statewide and designed to cover fishways where adult salmon are present. The
5 Operators had opened the second orifice to compensate for stick debris partially blocking the first orifice.
32
South Fork Rogue River supports a coldwater fishery of predominantly rainbow trout (Oncorhynchus mykiss) and brook trout (Salvelinus fontinalis). Neither juvenile or adult salmon are present at the Project, therefore the OAR water depth requirement for fishways designed for juvenile fish passage may be a more appropriate standard. Where only juvenile fish are present the minimum water depth shall be 6 inches. The minimum water depth over all the fish ladder weirs was greater than 6 inches during both the low and high flow conditions.
Table 5 Measured Weir Notch Depths
Weir Number
Low Flow High Flow
Measured Depth (inches)
Meets OAR Requirement (≥12 inches)
Measured Depth (inches)
Meets OAR Requirement (≥12 inches)
1 16.8 YES 39.6 YES 2 10.8 NO 27.6 YES 3 10.8 NO 16.8 YES 4 11.4 NO 13.2 YES 5 10.8 NO 13.2 YES 6 11.4 NO 14.4 YES 7 7.2 NO 9.6 NO 8 7.8 NO 13.2 YES 9 6.4 NO 13.2 YES
10 7.7 NO 14.4 YES 11 7.2 NO 13.2 YES 12 7.1 NO 13.5 YES 13 7.4 NO 13.2 YES 14 6.7 NO 13.2 YES 15 7.1 NO 13.2 YES
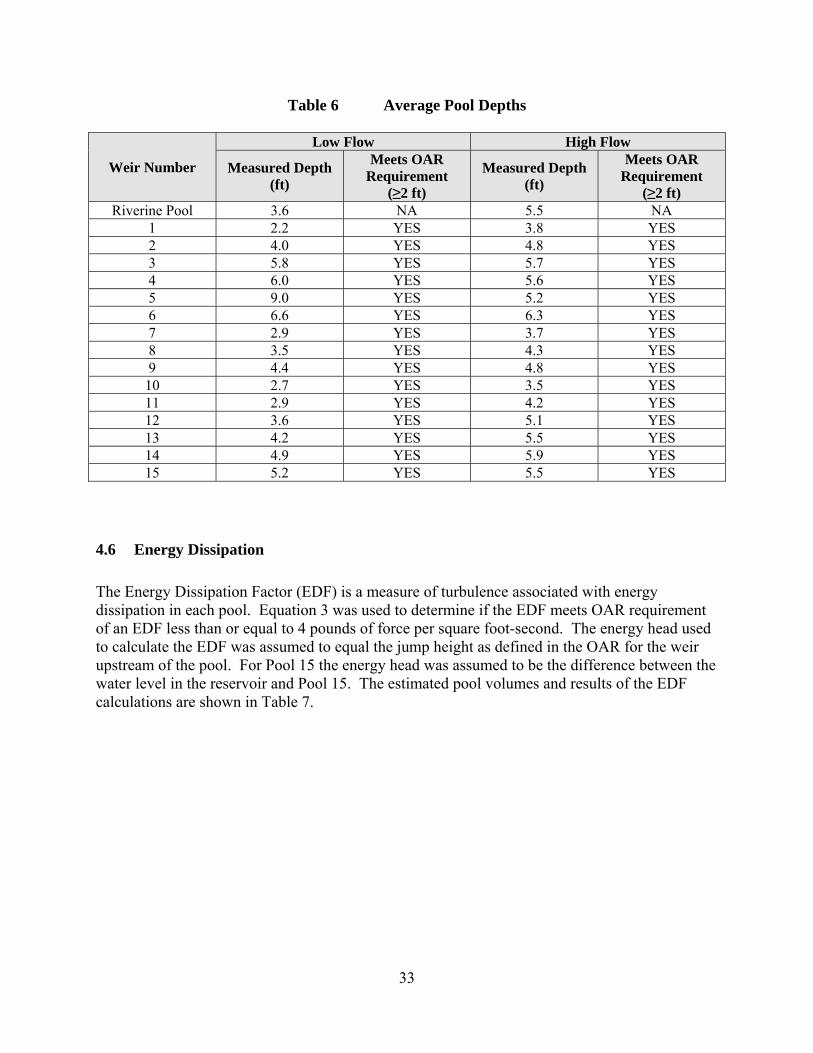
4.5 Entrance Pool and Jump Pool Depths
The water depth at the fish ladder entrance and in the pools was estimated using the average water depth measured during both low and high flow conditions. The average water depth was used because the bottom of the fish ladder pools is not flat. Depending on the pool the bottom was composed of a mix of sand and gravel. The average water depth in each pool is compared to the OAR requirements in Table 6.
33
Table 6 Average Pool Depths
Weir Number
Low Flow High Flow
Measured Depth (ft)
Meets OAR Requirement
(≥2 ft)
Measured Depth (ft)
Meets OAR Requirement
(≥2 ft) Riverine Pool 3.6 NA 5.5 NA
1 2.2 YES 3.8 YES 2 4.0 YES 4.8 YES 3 5.8 YES 5.7 YES 4 6.0 YES 5.6 YES 5 9.0 YES 5.2 YES 6 6.6 YES 6.3 YES 7 2.9 YES 3.7 YES 8 3.5 YES 4.3 YES 9 4.4 YES 4.8 YES 10 2.7 YES 3.5 YES 11 2.9 YES 4.2 YES 12 3.6 YES 5.1 YES 13 4.2 YES 5.5 YES 14 4.9 YES 5.9 YES 15 5.2 YES 5.5 YES
4.6 Energy Dissipation
The Energy Dissipation Factor (EDF) is a measure of turbulence associated with energy dissipation in each pool. Equation 3 was used to determine if the EDF meets OAR requirement of an EDF less than or equal to 4 pounds of force per square foot-second. The energy head used to calculate the EDF was assumed to equal the jump height as defined in the OAR for the weir upstream of the pool. For Pool 15 the energy head was assumed to be the difference between the water level in the reservoir and Pool 15. The estimated pool volumes and results of the EDF calculations are shown in Table 7.
34
Table 7 Energy Dissipation Factor
Pool Number
Low Flow High Flow
Estimated Pool
Volume (ft3)
Energy Dissipation
Factor (EDF)
(lbF/ ft2-s)
Meets OAR Requirement
(EDF<=4) Estimated
Pool Volume
(ft3)
Energy Dissipation
Factor (EDF)
(lbF/ ft2-s)
Meets OAR Requirement
(EDF<=4)
1 195 1.66 YES 349 1.41 YES 2 380 2.78 YES 469 0.35 YES 3 551 2.21 YES 572 0.67 YES 4 570 1.99 YES 551 2.87 YES 5 900 1.35 YES 540 3.24 YES 6 660 0.18 YES 651 2.85 YES 7 254 0.57 YES 337 2.41 YES 8 307 0.47 YES 395 1.32 YES 9 522 0.30 YES 616 1.01 YES
10 258 0.52 YES 378 2.04 YES 11 290 0.63 YES 445 1.21 YES 12 490 0.32 YES 703 1.01 YES 13 568 0.19 YES 746 1.00 YES 14 285 0.43 YES 359 1.10 YES 15 565 1.66 YES 306 2.04 YES
4.7 Fish Ladder Exit Flow Rating Curve
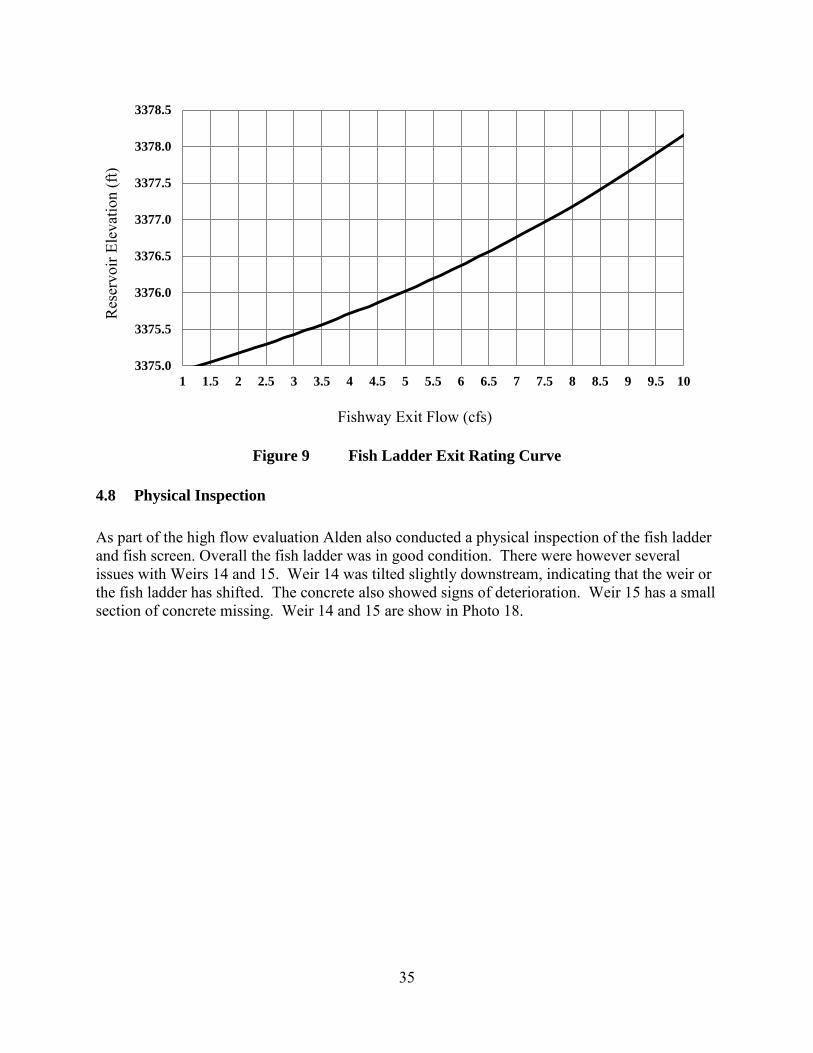
The flow in the upper fish ladder is a function of the difference between the reservoir elevation and the elevation of Pool 15. During the high flow evaluation, Alden measured the water level in the reservoir and Pool 15 of the fish ladder to determine the total head loss across the fish ladder exit. Using this head loss (0.9 ft) and the flow from the Weir 15 rating curve, a rating curve for the fish ladder exit was developed (Figure 9).
This rating curve is based on only a single data point and assumes that only one exit orifice is open and there is no blockage of the orifice. The accuracy of the rating curve can be improved with further data. PacifiCorp should consider regularly inspecting the orifices, removal of sediment and debris within the fish ladder exit and monitoring the water level in Pool 15. With the exit maintained in a clean condition and additional water level data from the reservoir and Pool 15, a more accurate rating curve can be derived for predicting flow through the upper fish ladder.
35
Figure 9 Fish Ladder Exit Rating Curve
4.8 Physical Inspection
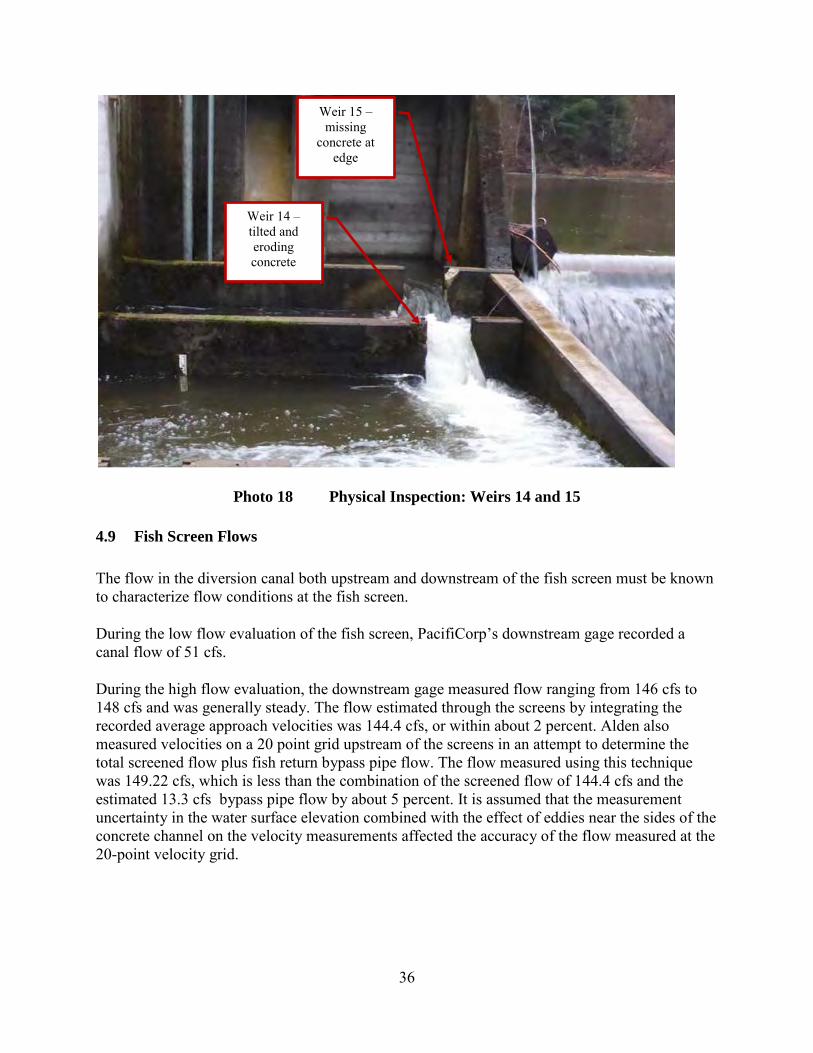
As part of the high flow evaluation Alden also conducted a physical inspection of the fish ladder and fish screen. Overall the fish ladder was in good condition. There were however several issues with Weirs 14 and 15. Weir 14 was tilted slightly downstream, indicating that the weir or the fish ladder has shifted. The concrete also showed signs of deterioration. Weir 15 has a small section of concrete missing. Weir 14 and 15 are show in Photo 18.
3375.0
3375.5
3376.0
3376.5
3377.0
3377.5
3378.0
3378.5
1 1.5 2 2.5 3 3.5 4 4.5 5 5.5 6 6.5 7 7.5 8 8.5 9 9.5 10
Res
ervo
ir El
evat
ion
(ft)
Fishway Exit Flow (cfs)
36
Photo 18 Physical Inspection: Weirs 14 and 15
4.9 Fish Screen Flows
The flow in the diversion canal both upstream and downstream of the fish screen must be known to characterize flow conditions at the fish screen.
During the low flow evaluation of the fish screen, PacifiCorp’s downstream gage recorded a canal flow of 51 cfs.
During the high flow evaluation, the downstream gage measured flow ranging from 146 cfs to 148 cfs and was generally steady. The flow estimated through the screens by integrating the recorded average approach velocities was 144.4 cfs, or within about 2 percent. Alden also measured velocities on a 20 point grid upstream of the screens in an attempt to determine the total screened flow plus fish return bypass pipe flow. The flow measured using this technique was 149.22 cfs, which is less than the combination of the screened flow of 144.4 cfs and the estimated 13.3 cfs bypass pipe flow by about 5 percent. It is assumed that the measurement uncertainty in the water surface elevation combined with the effect of eddies near the sides of the concrete channel on the velocity measurements affected the accuracy of the flow measured at the 20-point velocity grid.
Weir 14 – tilted and eroding concrete
Weir 15 – missing
concrete at edge
37
4.10 Fish Screen Sweeping Velocity
The sweeping velocity (Vs), is the component of the velocity vector parallel to the screen surface and should be greater than the approach velocity (NMFS, 1995 & NMFS, 2011). The sweeping velocity measured at each station during the low and high flow conditions are shown in Table 8 and Table 9, respectively. During the low flow conditions, the average sweeping velocity was 1.06 ft/s. Under the high flow conditions, the average sweeping velocity was 3.16 ft/s – approximately three times higher than during the low flow conditions. The increase in sweeping velocities is proportional to the increase in screened flow between the two conditions.
Sweeping flows along the left-hand-side of the screen are greater than on the right side as a result of the influence of the upstream bend in the canal. In addition, eddies are created by the transition from the trapezoidal to rectangular canal cross-section which contribute to the non-uniformity in flow.
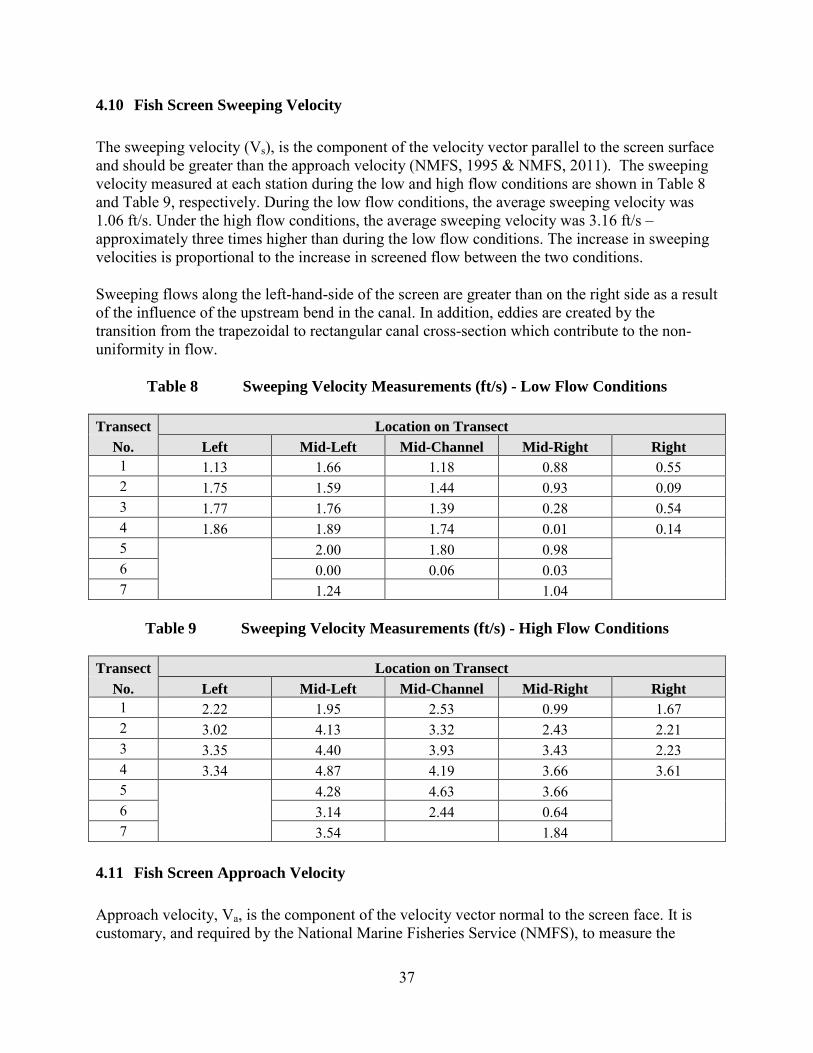
Table 8 Sweeping Velocity Measurements (ft/s) - Low Flow Conditions
Transect Location on Transect No. Left Mid-Left Mid-Channel Mid-Right Right 1 1.13 1.66 1.18 0.88 0.55 2 1.75 1.59 1.44 0.93 0.09 3 1.77 1.76 1.39 0.28 0.54 4 1.86 1.89 1.74 0.01 0.14 5 2.00 1.80 0.98 6 0.00 0.06 0.03 7 1.24 1.04
Table 9 Sweeping Velocity Measurements (ft/s) - High Flow Conditions
Transect Location on Transect No. Left Mid-Left Mid-Channel Mid-Right Right 1 2.22 1.95 2.53 0.99 1.67 2 3.02 4.13 3.32 2.43 2.21 3 3.35 4.40 3.93 3.43 2.23 4 3.34 4.87 4.19 3.66 3.61 5 4.28 4.63 3.66 6 3.14 2.44 0.64 7 3.54 1.84
4.11 Fish Screen Approach Velocity
Approach velocity, Va, is the component of the velocity vector normal to the screen face. It is customary, and required by the National Marine Fisheries Service (NMFS), to measure the
38
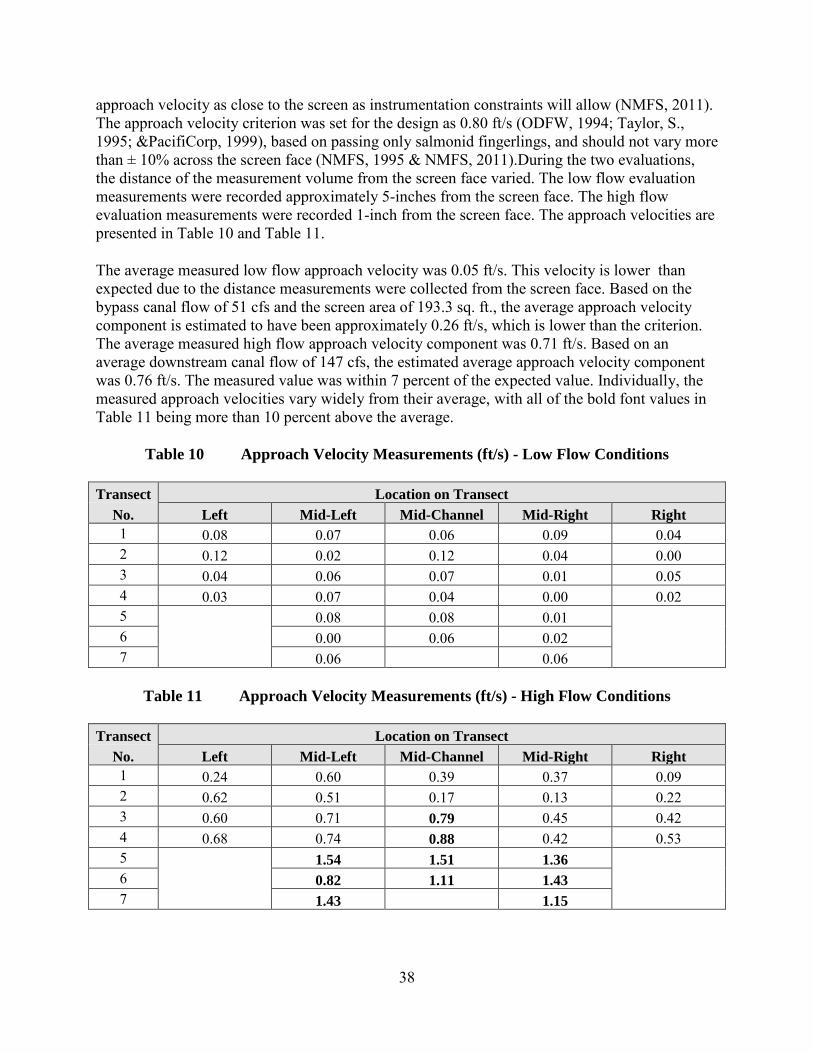
approach velocity as close to the screen as instrumentation constraints will allow (NMFS, 2011). The approach velocity criterion was set for the design as 0.80 ft/s (ODFW, 1994; Taylor, S., 1995; &PacifiCorp, 1999), based on passing only salmonid fingerlings, and should not vary more than ± 10% across the screen face (NMFS, 1995 & NMFS, 2011).During the two evaluations, the distance of the measurement volume from the screen face varied. The low flow evaluation measurements were recorded approximately 5-inches from the screen face. The high flow evaluation measurements were recorded 1-inch from the screen face. The approach velocities are presented in Table 10 and Table 11.
The average measured low flow approach velocity was 0.05 ft/s. This velocity is lower than expected due to the distance measurements were collected from the screen face. Based on the bypass canal flow of 51 cfs and the screen area of 193.3 sq. ft., the average approach velocity component is estimated to have been approximately 0.26 ft/s, which is lower than the criterion. The average measured high flow approach velocity component was 0.71 ft/s. Based on an average downstream canal flow of 147 cfs, the estimated average approach velocity component was 0.76 ft/s. The measured value was within 7 percent of the expected value. Individually, the measured approach velocities vary widely from their average, with all of the bold font values in Table 11 being more than 10 percent above the average.
Table 10 Approach Velocity Measurements (ft/s) - Low Flow Conditions
Transect Location on Transect No. Left Mid-Left Mid-Channel Mid-Right Right 1 0.08 0.07 0.06 0.09 0.04 2 0.12 0.02 0.12 0.04 0.00 3 0.04 0.06 0.07 0.01 0.05 4 0.03 0.07 0.04 0.00 0.02 5 0.08 0.08 0.01 6 0.00 0.06 0.02 7 0.06 0.06
Table 11 Approach Velocity Measurements (ft/s) - High Flow Conditions
Transect Location on Transect No. Left Mid-Left Mid-Channel Mid-Right Right 1 0.24 0.60 0.39 0.37 0.09 2 0.62 0.51 0.17 0.13 0.22 3 0.60 0.71 0.79 0.45 0.42 4 0.68 0.74 0.88 0.42 0.53 5
1.54 1.51 1.36
6
0.82 1.11 1.43 7
1.43
1.15
39
4.12 Ratio of Sweeping to Approach Velocity
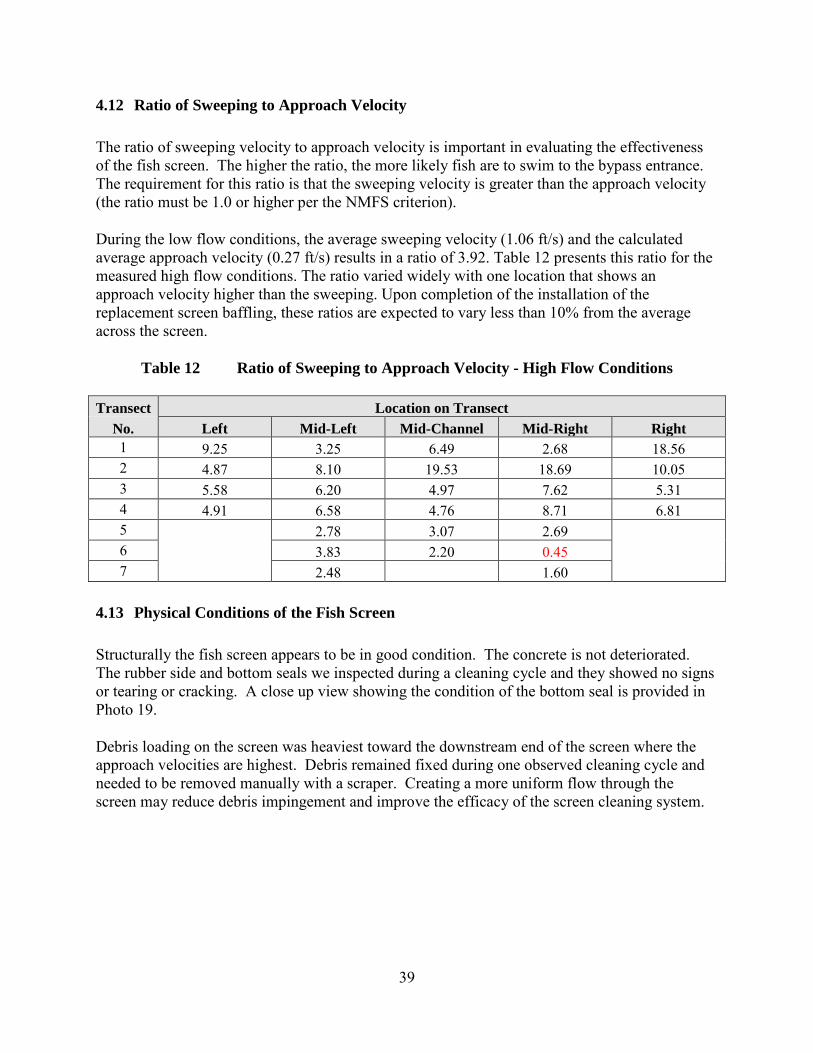
The ratio of sweeping velocity to approach velocity is important in evaluating the effectiveness of the fish screen. The higher the ratio, the more likely fish are to swim to the bypass entrance. The requirement for this ratio is that the sweeping velocity is greater than the approach velocity (the ratio must be 1.0 or higher per the NMFS criterion).
During the low flow conditions, the average sweeping velocity (1.06 ft/s) and the calculated average approach velocity (0.27 ft/s) results in a ratio of 3.92. Table 12 presents this ratio for the measured high flow conditions. The ratio varied widely with one location that shows an approach velocity higher than the sweeping. Upon completion of the installation of the replacement screen baffling, these ratios are expected to vary less than 10% from the average across the screen.
Table 12 Ratio of Sweeping to Approach Velocity - High Flow Conditions
Transect Location on Transect No. Left Mid-Left Mid-Channel Mid-Right Right 1 9.25 3.25 6.49 2.68 18.56 2 4.87 8.10 19.53 18.69 10.05 3 5.58 6.20 4.97 7.62 5.31 4 4.91 6.58 4.76 8.71 6.81 5 2.78 3.07 2.69 6 3.83 2.20 0.45 7 2.48 1.60
4.13 Physical Conditions of the Fish Screen
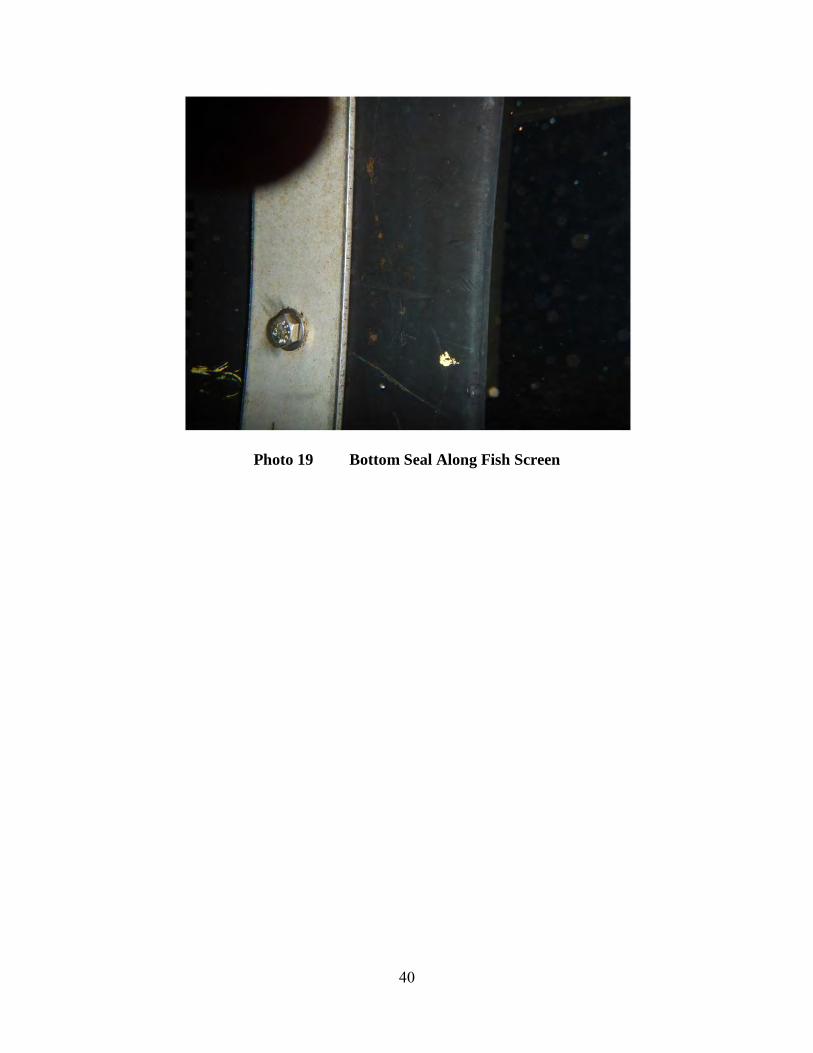
Structurally the fish screen appears to be in good condition. The concrete is not deteriorated. The rubber side and bottom seals we inspected during a cleaning cycle and they showed no signs or tearing or cracking. A close up view showing the condition of the bottom seal is provided in Photo 19.
Debris loading on the screen was heaviest toward the downstream end of the screen where the approach velocities are highest. Debris remained fixed during one observed cleaning cycle and needed to be removed manually with a scraper. Creating a more uniform flow through the screen may reduce debris impingement and improve the efficacy of the screen cleaning system.
40
Photo 19 Bottom Seal Along Fish Screen
41
5.0 Summary, Conclusions, and Recommendations
5.1 Summary and Conclusions
The objectives identified in Study Plan Section 2.0 and Section 1.3 of this Initial Study Report were achieved according to plan. The physical and hydraulic parameters identified in the Study Plan were measured according to the Plan, with the exception of the timing of high flow measurements. High flow measurements were completed in January 2015 instead of May or June 2014 as stated in the Study Plan. Target exceedance flows were present at the time of the measurements, and therefore, the impact of the variance in schedule was negligible to the methods and results.
Biological testing of upstream and downstream passage facilities will proceed in the second study season according to the requirements of the Study Plan. No modifications to the approved Study Plan are proposed at this time.
5.1.1 Fish Ladder
The flow in the upper fish ladder was estimated using the weir rating curves. During low flows the flow in the upper fish ladder was estimated to be 2.2 cfs. At high flows the upper fish ladder flow increased to 8.0 cfs. The bypass flow from the fish screen enters the fish ladder in Pool 6 increasing the flow in the lower fish ladder. During low flow, non-spill conditions, all of the flow in the South Fork bypassed reach below the dam passes through the fish ladder. Based on the flows in the South Fork bypassed reach, the flow in the lower fish way during low flow conditions is 14 cfs. There is flow over the dam during high flow conditions; therefore a flow of 21.3 cfs flow was estimated for the lower fish ladder based on a combination of flow from the upper fish ladder and the fish bypass.
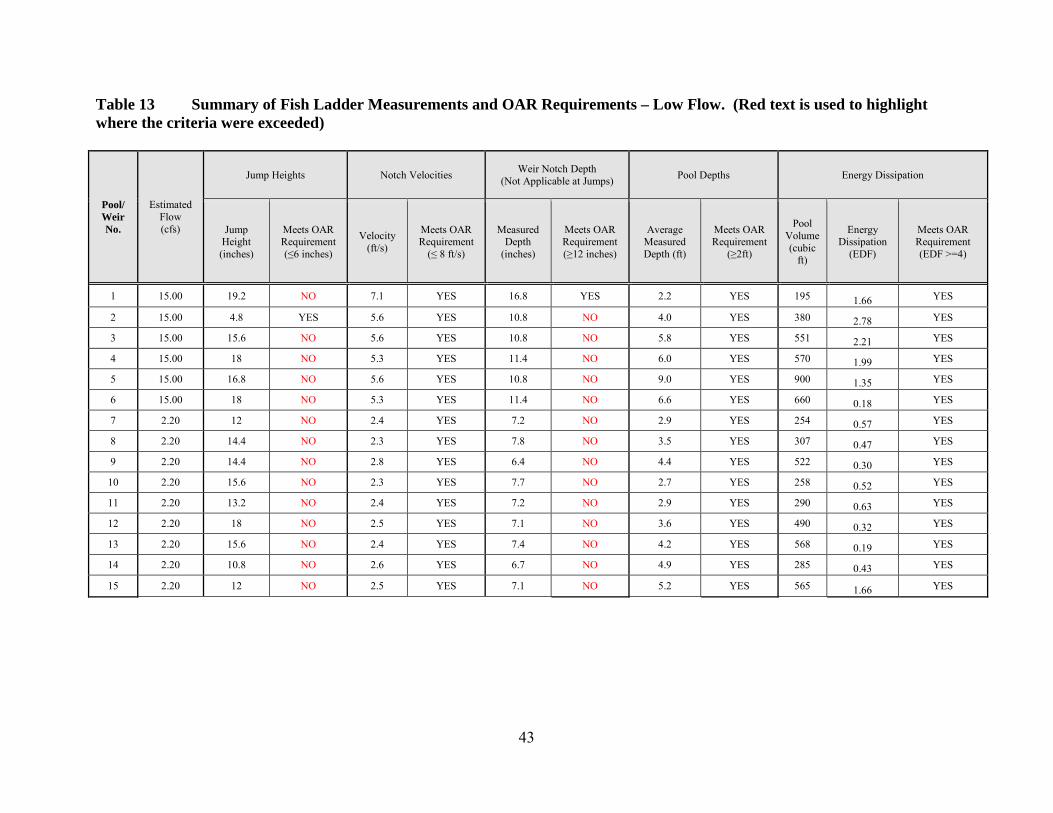
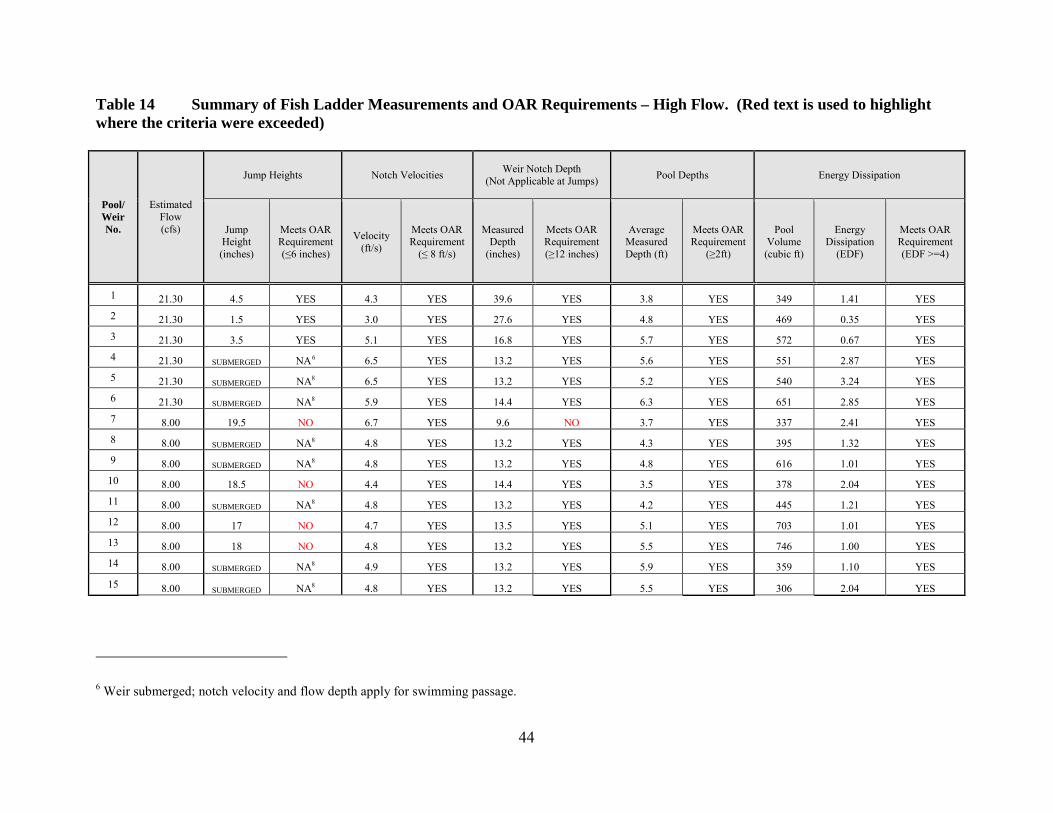
The fish ladder did not meet the OAR requirements for jump height and weir notch depth. The tables below summarize the findings of the fish ladder hydraulic studies, Table 13 for low flow and Table 14 for high flow. Red text is used to highlight where the criteria were exceeded.
The jump heights in Table 13 and Table 14 represent the difference between the water levels upstream and downstream of each weir compared with OAR requirements. At low flow conditions, only Weir 2 meets the jump height requirement. In the Project’s fish ladder, the velocity at the weir crests meets the OAR velocity requirements for all the weirs at both low and high flow conditions. Under high flow conditions all of the weirs except 7, 10, 12, and 13 were submerged and fish could pass them by swimming, not jumping, as the flow depths and velocities available for swimming through the weir notches meet the OAR requirements. In summary, only Weir 2 met all of the OAR passage requirements at low flow, while all weirs but 7, 10, 12, and 13 met the requirements at high flow.
Fish ladder exit velocities were calculated using the flow in the upper fish ladder and the open area of the exit orifice(s). During low flow the calculated exit velocity was 0.7 ft/s. At high flow the velocity increased to 2.0 ft/s. These velocities assume that the fish ladder exit(s) are clean
42
with no debris or sediment buildup and are based on a single measurement. This same assumption was used to develop a rating curve for the upper fish ladder. Additional inspection of the exit(s) and further water level measurements would be required to increase confidence in both the velocity calculations and the rating curve.
The minimum water depth over the fish ladder weirs required by the OAR is 12 inches when adult fish are present. The requirement when only juveniles are present is 6 inches. The juvenile requirement may be more applicable to this fish ladder because adult salmon are not present at the Project, and the species present include rainbow trout (Oncorhynchus mykiss) and brook trout (Salvelinus fontinalis) that are closer in size to juvenile salmon. Based on a 6 inch minimum water depth all the fish ladder weirs would meet the OAR requirements during both the low and high flow conditions.
Overall the fish ladder appeared to be in good physical condition. However, the concrete in Weirs 14 and 15 showed signs of deterioration, and Weir 14 had shifted. A more detailed inspection of the fish ladder is recommended.
43
Table 13 Summary of Fish Ladder Measurements and OAR Requirements – Low Flow. (Red text is used to highlight where the criteria were exceeded)
Pool/ Weir No.
Estimated Flow (cfs)
Jump Heights Notch Velocities Weir Notch Depth (Not Applicable at Jumps) Pool Depths Energy Dissipation
Jump Height (inches)
Meets OAR Requirement (≤6 inches)
Velocity (ft/s)
Meets OAR Requirement
(≤ 8 ft/s)
Measured Depth
(inches)
Meets OAR Requirement (≥12 inches)
Average Measured Depth (ft)
Meets OAR Requirement
(≥2ft)
Pool Volume (cubic
ft)
Energy Dissipation
(EDF)
Meets OAR Requirement (EDF >=4)
1 15.00 19.2 NO 7.1 YES 16.8 YES 2.2 YES 195 1.66 YES
2 15.00 4.8 YES 5.6 YES 10.8 NO 4.0 YES 380 2.78 YES
3 15.00 15.6 NO 5.6 YES 10.8 NO 5.8 YES 551 2.21 YES
4 15.00 18 NO 5.3 YES 11.4 NO 6.0 YES 570 1.99 YES
5 15.00 16.8 NO 5.6 YES 10.8 NO 9.0 YES 900 1.35 YES
6 15.00 18 NO 5.3 YES 11.4 NO 6.6 YES 660 0.18 YES
7 2.20 12 NO 2.4 YES 7.2 NO 2.9 YES 254 0.57 YES
8 2.20 14.4 NO 2.3 YES 7.8 NO 3.5 YES 307 0.47 YES
9 2.20 14.4 NO 2.8 YES 6.4 NO 4.4 YES 522 0.30 YES
10 2.20 15.6 NO 2.3 YES 7.7 NO 2.7 YES 258 0.52 YES
11 2.20 13.2 NO 2.4 YES 7.2 NO 2.9 YES 290 0.63 YES
12 2.20 18 NO 2.5 YES 7.1 NO 3.6 YES 490 0.32 YES
13 2.20 15.6 NO 2.4 YES 7.4 NO 4.2 YES 568 0.19 YES
14 2.20 10.8 NO 2.6 YES 6.7 NO 4.9 YES 285 0.43 YES
15 2.20 12 NO 2.5 YES 7.1 NO 5.2 YES 565 1.66 YES
44
Table 14 Summary of Fish Ladder Measurements and OAR Requirements – High Flow. (Red text is used to highlight where the criteria were exceeded)
Pool/ Weir No.
Estimated Flow (cfs)
Jump Heights Notch Velocities Weir Notch Depth (Not Applicable at Jumps) Pool Depths Energy Dissipation
Jump Height (inches)
Meets OAR Requirement (≤6 inches)
Velocity (ft/s)
Meets OAR Requirement
(≤ 8 ft/s)
Measured Depth
(inches)
Meets OAR Requirement (≥12 inches)
Average Measured Depth (ft)
Meets OAR Requirement
(≥2ft)
Pool Volume (cubic ft)
Energy Dissipation
(EDF)
Meets OAR Requirement (EDF >=4)
1 21.30 4.5 YES 4.3 YES 39.6 YES 3.8 YES 349 1.41 YES 2 21.30 1.5 YES 3.0 YES 27.6 YES 4.8 YES 469 0.35 YES 3 21.30 3.5 YES 5.1 YES 16.8 YES 5.7 YES 572 0.67 YES 4 21.30 SUBMERGED NA6 6.5 YES 13.2 YES 5.6 YES 551 2.87 YES 5 21.30 SUBMERGED NA8 6.5 YES 13.2 YES 5.2 YES 540 3.24 YES 6 21.30 SUBMERGED NA8 5.9 YES 14.4 YES 6.3 YES 651 2.85 YES 7 8.00 19.5 NO 6.7 YES 9.6 NO 3.7 YES 337 2.41 YES 8 8.00 SUBMERGED NA8 4.8 YES 13.2 YES 4.3 YES 395 1.32 YES 9 8.00 SUBMERGED NA8 4.8 YES 13.2 YES 4.8 YES 616 1.01 YES
10 8.00 18.5 NO 4.4 YES 14.4 YES 3.5 YES 378 2.04 YES 11 8.00 SUBMERGED NA8 4.8 YES 13.2 YES 4.2 YES 445 1.21 YES 12 8.00 17 NO 4.7 YES 13.5 YES 5.1 YES 703 1.01 YES 13 8.00 18 NO 4.8 YES 13.2 YES 5.5 YES 746 1.00 YES 14 8.00 SUBMERGED NA8 4.9 YES 13.2 YES 5.9 YES 359 1.10 YES 15 8.00 SUBMERGED NA8 4.8 YES 13.2 YES 5.5 YES 306 2.04 YES
6 Weir submerged; notch velocity and flow depth apply for swimming passage.
45
5.1.2 Fish Screen
The flow in the diversion channel upstream of the fish screen is controlled by two gates: the canal head gate and the backwater gate immediately downstream of the fish screen. Working in conjunction these gates can maintain a constant water level at the fish screen regardless of the flow in the canal. Hydraulic conditions at the fish screen were measured at diversion channel flows of approximately 51 cfs and 147 cfs, which are consistent with the flows expected during 95% (50 cfs) and 5% (150 cfs) exceedance flows in the river.
During low flow conditions, the average sweeping velocity past the screen was 1.06 ft/s. At the high flow condition the average sweeping velocity was 3.16 ft/s. The average sweeping velocity during the high flow condition was approximately three times the low flow sweeping velocity, which was expected because the canal flow was approximate three times greater. The measured sweeping velocities ranged from 0.0 ft/s to 2.0 ft/s and from 0.7 ft/s to 4.9 ft/s during low and high flow conditions, respectively. Eddies were visible along the right wall downstream of the start of the fish screen and near the left wall closer to the bypass entrance.
The average screen approach velocity was calculated for both low and high flow conditions using the flow passing through the fish screen and the effective screen area. During low flow conditions the average approach velocity is estimated to be 0.26 ft/s, which is below the 0.80 ± 10% criterion (ODFW, 1994; Taylor, S, 1995;PacifiCorp, 1999; NMFS, 1995; & NMFS, 2011). At high flows the average approach velocity is estimated to be 0.78 ft/s. Approach velocities were also directly measured along seven transects to quantify the flow distribution through the screens. During high flow measurements approach velocities ranged from 0.09 ft/s to 1.54 ft/s, with an average of 0.71 ft/s, and higher velocities were observed near the downstream end of the screen, where the approach velocity criterion was exceeded. The large variation in velocities results in debris accumulation and the potential for fish impingement near the downstream end of the screen.
5.2 Recommendations
5.2.1 Fish Ladder
The fish ladder does not meet OAR requirements for jump height and weir notch depth at the identified weirs (Tables 13 and 14). PacifiCorp and resource agency representatives should consider alternative standards such as a reduced weir notch depth of greater than or equal to 6-inches, based on the actual hydraulic conditions and species present at the Project. If the results of biological testing of the fish ladder, which is scheduled for the second study season (May 2015 – May 2016), are not acceptable, then PacifiCorp should evaluate fish ladder modifications to meet aquatic resource goals.
If the results of biological testing of the existing fish ladder are acceptable, PacifiCorp may still need to make repairs on the degraded concrete on Weirs 14 and 15. A thorough inspection of Weir 14 is also warranted because the walls of the weir have shifted. If the weir cannot be moved back into position it should be replaced.
46
PacifiCorp should develop a standard maintenance plan including regularly scheduled inspections and methods to remove sticks and other debris in the fish ladder. The fish ladder exit(s) should also be inspected and cleaned.
A water level sensor could be used to monitor Pool 15. This sensor would allow the flow in the upper fish ladder to be monitored and a rating curve to be developed based on the reservoir stage.
5.2.2 Fish Screen
PacifiCorp should implement a system of baffles to balance the flow through the fish screen. This will eliminate high velocity regions and improve the efficiency of the screen backwash cleaning system.
Structurally the fish screen, support structure and rubber seals appear to be in good shape and do not need to be repaired or replaced.

47
6.0 References FERC. (2014). Study Plan Determination for the Prospect No. 3 Hydroelectric Project MWH. (1997). Letter date April 25, 1997 regarding Prospect No. 3 Diversion Dam Fish Screen Project Hydraulic Measurements. National Marine Fisheries Service. (1995). Screen Criteria. NMFS, Northwest Region, Portland Oregon. National Marine Fisheries Service. (2011). Anadromous Salmonid Passage Facility Design. NMFS, Northwest Region, Portland Oregon. ODFW. (1994). Letter dated September 7, 1994 regarding Fish Passage Criteria and Design Selection for Prospect No. 3 Hydroelectric Project. ODFW. (2015) Oregon Administrative Rules, Division 412, Fish Passage. http://www.dfw.state.or.us/OARs/412.pdf PacifiCorp. (1999) Letter date July 30, 1999 regarding Prospect No. 3 (FERC No. 2337-001) Fish Monitoring Plan, update. PacifiCorp. (2014). Prospect No. 3 Hydroelectric Project, FERC Project No. P-2337, Revised Study Plans – Fish Passage Facilities, April 2014. Taylor, S. (1995). Notes from Meeting with PacifiCorp, ODFW, and USFWS on 10-19-95 Regarding Prospect 3 Fish Passage Improvement. Portland: PacifiCorp.