Proposed design chart of mechanical joints on steel-PHC ...
18
ORIGINAL ARTICLE Proposed design chart of mechanical joints on steel-PHC composite piles Yunsup Shin • Myoungmo Kim • Junyoung Ko • Sangseom Jeong Received: 18 December 2012 / Accepted: 9 June 2013 / Published online: 20 June 2013 Ó RILEM 2013 Abstract A fundamental study of a mechanical joint in a steel-PHC composite pile subjected to combined loads was done using three-point bending tests and 3D finite element analyses. The three-point bending tests were conducted to evaluate load-deformation response, strain distribution on the pile, ultimate bending moment and failure mode of the mechanical joint on steel-PHC composite piles. In addition, 3D finite element analysis for the mechanical joint was performed and then, the stress distributions and the maximum load resistances of each parts of the joint were estimated by comparing the calculated stresses to the yielding stresses of the joint materials. The 3D numerical methodology in the present study represents a realistic mechanism of mechanical joints. Through detailed numerical analysis, it is found that the behaviour of mechanical joint of composite piles shows safe side under working load. Based on these results, the design chart for steel-PHC piles has been proposed to be convenient for preliminary design stage which can be used to evaluate the safety of mechanical joints. Keywords Composite pile Mechanical joint Three-point bending test Three-dimensional finite element analysis Design chart 1 Introduction Steel piles are frequently used in civil engineering structures because they have many advantages such as high load-bearing capacity, light weight and outstand- ing workability. However, steel piles are more expen- sive than other materials, and the cost of steel has been rising recently in South Korea. The pretensioned spun high strength concrete pile (PHC pile) is frequently used in engineering practice in Asia. The PHC pile is similar to ICP pile in North America [4]. PHC pile is widely used in various constructions such as plants, buildings, bridges and marine structures. The quality and strength of the PHC pile are generally reliable, because it is prefabricated in factories. Due to economic considerations, PHC pile has been applied in most parts of civil structures. PHC pile overcomes concrete’s weakness in tension compared to the concrete pile. It is used to apply floors, beams or bridges with a longer span than is practical with ordinary concrete pile. Y. Shin Technical Division, GS Engineering and Construction, Seoul 100-722, Republic of Korea M. Kim Department of Civil and Environmental Engineering, Seoul National University, Seoul 151-742, Republic of Korea J. Ko S. Jeong (&) Department of Civil and Environmental Engineering, Yonsei University, Seoul 120-749, Republic of Korea e-mail: [email protected] Materials and Structures (2014) 47:1221–1238 DOI 10.1617/s11527-013-0124-3
Transcript of Proposed design chart of mechanical joints on steel-PHC ...

ORIGINAL ARTICLE
Proposed design chart of mechanical joints on steel-PHCcomposite piles
Yunsup Shin • Myoungmo Kim • Junyoung Ko •
Sangseom Jeong
Received: 18 December 2012 / Accepted: 9 June 2013 / Published online: 20 June 2013
� RILEM 2013
Abstract A fundamental study of a mechanical joint
in a steel-PHC composite pile subjected to combined
loads was done using three-point bending tests and
3D finite element analyses. The three-point bending
tests were conducted to evaluate load-deformation
response, strain distribution on the pile, ultimate
bending moment and failure mode of the mechanical
joint on steel-PHC composite piles. In addition, 3D
finite element analysis for the mechanical joint was
performed and then, the stress distributions and the
maximum load resistances of each parts of the joint
were estimated by comparing the calculated stresses to
the yielding stresses of the joint materials. The 3D
numerical methodology in the present study represents
a realistic mechanism of mechanical joints. Through
detailed numerical analysis, it is found that the
behaviour of mechanical joint of composite piles
shows safe side under working load. Based on these
results, the design chart for steel-PHC piles has been
proposed to be convenient for preliminary design
stage which can be used to evaluate the safety of
mechanical joints.
Keywords Composite pile � Mechanical joint �Three-point bending test � Three-dimensional finite
element analysis � Design chart
1 Introduction
Steel piles are frequently used in civil engineering
structures because they have many advantages such as
high load-bearing capacity, light weight and outstand-
ing workability. However, steel piles are more expen-
sive than other materials, and the cost of steel has been
rising recently in South Korea. The pretensioned spun
high strength concrete pile (PHC pile) is frequently
used in engineering practice in Asia. The PHC pile is
similar to ICP pile in North America [4]. PHC pile is
widely used in various constructions such as plants,
buildings, bridges and marine structures. The quality
and strength of the PHC pile are generally reliable,
because it is prefabricated in factories. Due to
economic considerations, PHC pile has been applied
in most parts of civil structures. PHC pile overcomes
concrete’s weakness in tension compared to the
concrete pile. It is used to apply floors, beams or
bridges with a longer span than is practical with
ordinary concrete pile.
Y. Shin
Technical Division, GS Engineering and Construction,
Seoul 100-722, Republic of Korea
M. Kim
Department of Civil and Environmental Engineering,
Seoul National University, Seoul 151-742,
Republic of Korea
J. Ko � S. Jeong (&)
Department of Civil and Environmental Engineering,
Yonsei University, Seoul 120-749, Republic of Korea
e-mail: [email protected]
Materials and Structures (2014) 47:1221–1238
DOI 10.1617/s11527-013-0124-3

Steel-PHC composite piles are often used as a
viable replacement for steel piles or PHC piles because
of their lower cost and their excellent load-bearing
capacity. No research has been conducted to study
steel-PHC composite piles.
In general, composite piles are defined as piles
consisting of two or more materials. Composite piles
were first used in the United States in the late 1980s as
replacements for timber fender piles at the port of Los
Angeles [6]. A prototype composite pile first used in
1987 was composed of a composite steel pipe encased
in recycled plastic [7]. Since the first application of
composite piles, several types of composite piles, such
as fiber-reinforced plastic (FRP) piles, concrete-filled
steel tube pile (CFST) and steel–concrete (SC) piles,
have been used in many structures.
Composite piles have been studied by many
researchers. Several empirical and numerical methods
for the analyzing the behaviour of composite piles
have been investigated. Although previous studies
have considered several types of composite piles, the
types of piles considered can generally be classified
into three groups: (1) concrete-filled FRP piles [1–3, 8,
11–13, 18], (2) CFST piles [14, 16, 17, 20], and (3)
steel–concrete piles [10]. However, less is known
about the steel-PHC composite pile.
Steel-PHC composite piles, also called hybrid
composite piles, have been used in some construction
projects in South Korea. A hybrid composite pile is
composed of steel and PHC pile. To investigate the
behaviour of steel-PHC composite piles, several pile
load tests and numerical analyses of their welded
joints have been performed [10]. However, welding
methods have some limitations, such as dependence
on weather, wind speed and skilled workers. On the
other hand, many engineers have been working in the
past few years to develop various types of non-welded
joints based on assembly mechanisms that overcome
the weaknesses of welded joints.
A rigorous numerical approach of the mechanical
joint is computationally expensive and time consum-
ing because of the 3D nature of the problem.
Therefore, a simplified design method is more suitable
for the preliminary design stage.
The overall objective of this study was to investi-
gate the behaviour of steel-PHC composite pile under
combined loadings. A series of three-point bending
tests and 3D FE analyses of the behaviour of
mechanical joints in steel-PHC composite piles were
performed. The design chart for mechanical joint has
been proposed to be convenient for preliminary design
stage. The design chart for mechanical joint on the
basis of both experimental test results and detailed
numerical analysis is proposed. The proposed chart is
shown to be capable of predicting the behaviour of
mechanical joint under combined loadings.
Fig. 1 The steel-PHC composite pile
1222 Materials and Structures (2014) 47:1221–1238

2 Background theory of steel-PHC composite piles
2.1 Composite piles
Steel-PHC composite piles are representative of
typical composite piles that are used in South Korea.
Steel-PHC composite piles are composed of different
pile materials, the upper part being steel pile and the
lower part being PHC pile. A schematic representation
of a steel-PHC composite pile is shown in Fig. 1.
The connection methods used with composite piles
can generally be classified into two categories: weld-
ing methods and non-welding methods. In general,
steel-PHC composite piles are connected using weld-
ing methods [10]. Pile load tests and 3D FE analysis of
the welding joint have been performed to verify the
pile behaviour by some researchers. In the case of a
steel-PHC composite pile, the drivability and integrity
of the pile should be confirmed.
The dynamic behaviour of steel-PHC composite
piles embedded in weathered rock has been tested
using a pile driving analyzer. Lateral pile load tests
have been carried out to analyze the response of a
steel-PHC pile to lateral loads. The instrumented pile
used in those tests was 500 mm in diameter and
23.2 m length. The pile consisted of a 4.2 m steel pile
and a 19.0 m PHC pile connected by typical welding.
Along with this steel-PHC pile, a steel pile 46.0 m in
length, was also tested at a nearby site to compare the
results for the two piles [10].
Although several investigators have examined the
behaviour of the longitudinal composite piles, very
Fig. 2 Mechanical joint of
the steel-PHC composite
pile
Fig. 3 Schematic structure
diagram of three-point
bending test pile
Materials and Structures (2014) 47:1221–1238 1223

little information and test data exist on the driveability,
and axial and lateral behaviour of composite piles,
such as steel-PHC composite piles. More research
should be conducted to confirm the findings of
previous studies concerning the effect of the different
thicknesses of steel and PHC piles on the axial and
lateral behaviour of the joint between the two piles.
The composite pile behaviour might also depend on
the location of the joint and the method of connection.
In the early 1990s, some countries developed a
special type of pile-connecting method for use without
welding. However, no design methods or specifica-
tions have been developed for steel-PHC composite
piles.
2.2 Mechanical joints
Mechanical joints, also referred to as non-welded
composite pile joints, are composed of a three-piece
side plate and 12 bolts fitting both the upper pile toe
and the lower pile top. To install the joint, the upper
pile is placed on top of the lower pile. These are
connected to the three-piece side plate with bolt holes
to make a single connected pile. As shown in Fig. 2,
the mechanical joints consist of four parts: the
connection rib, the three-piece side plate, the 12 bolts,
and the PHC pile bend.
The mechanical joint transmits bending moments
and shear stresses through the upper pile bottom to the
side connecting panel at the joint, and downward to the
lower pile head. Because of this loading-bearing
mechanism, the mechanical joint becomes capable of
producing a bearing capacity against the bending
moments and shear stresses that is greater than that of
the original pile body. In addition, mechanical joints
offer more consistent quality and easier installation
and maintenance than welding joints. Mechanical
joints have good workability in all weather and offer
the economic benefits of composite piles, especially
for large-diameter piles. However, there are few case
histories and little research data available for mechan-
ical joints of composite piles, so verification of the
behaviour of mechanical joints of composite piles,
using field pile load tests and numerical analyses is
warranted.
3 Experimental program
3.1 Three-point bending test
The bending moments and shear stresses imposed by
lateral loads on piles can be estimated using the three-
point bending test. In this study, three-point bending
tests were conducted to investigate the behaviour of
mechanical joints subjected to lateral loads. The
behaviour of pile under lateral loading is generally
dominated by the bending moment. Therefore, the
testing in a flexural mode is performed to reflect the
behaviour of pile under lateral loading. The testing
was conducted based on the Korean Industrial Stan-
dards (KS) F 4306 ‘‘Pretensioned spun high strength
concrete piles’’. The simply supported test method was
Table 1 Configuration of three-point bending test pile
Test pile no. Pile type Diameter
(mm)
Thickness
(mm)
Section area
(m2)
Crack bending
moment (kN-m)
Failure bending
moment (kN-m)
Strain gage
Pile no. 1 Steel pile 500 12 0.0184 – – No
PHC pile 500 80 0.1056 103.0 155.0
Pile no. 2 Steel pile 500 12 0.0184 – – Yes
PHC pile 500 80 0.1056 103.0 155.0
0
50
100
150
200
250
300
0 10 20 30 40 50
Deformation at midspan (mm)
App
lied
load
(kN
)
Cycle1 : No crackCycle2 : No crackCycle3 : No crackCycle4 : CrackCycle5 : FailureCycle6 : Failure
Cycle 5 (140kN)
Cycle 4 (120kN)
Cycle 6 (160kN)
Fig. 4 Load-deformation response of test pile No. 1
1224 Materials and Structures (2014) 47:1221–1238

selected to simplify the experimental setup. A steel-
PHC composite pile was supported at the butt and the
tip, and a load was applied at the centre. The span
length (Ls) between the two end supports was 6.0 m,
and the total length (L) of the pile was 10.0 m. Each
steel support had a roller mounted on a triangular
moving block, which provided enough space under the
pile to accommodate deflection. Cyclic loads were
applied with a hydraulic actuator. Figure 3 shows a
schematic diagram of the three-point bending test. The
configuration of a three-point bending test pile is
summarized in Table 1.
The testing was conducted in controlled-load mode
at a constant loading rate. The peak or maximum load
was anticipated based on the standard for pile capac-
ity. Loading was applied in cycles of increasing
amplitude to assess residual deformation. Load cycles
that represented 40, 60 and 80 % of the expected
failure load were applied to each pile. The pile was
loaded up to 200 % of the standard crack bending
moment of pile capacity. Finally, the pile was loaded
to failure, which is defined by the peak load.
The bending moment and shear force of a simply
supported beam with a concentrated load at the mid
span can be illustrated by a diagram equivalent to that
for a cantilever beam with one-half the span length and
one-half the applied tip load. Therefore, the three-
point bending test procedure can be adopted to test the
(a) Cycle 1 (60kN) (b) Cycle 2 (80kN)
(c) Cycle 3 (100kN) (d) Cycle 4 (120kN)
(e) Cycle 5 (140kN) (f) Cycle 6 (over 160kN)
Fig. 5 Failure mode of test
pile No. 1 with load
increments
Materials and Structures (2014) 47:1221–1238 1225

response of a pile subjected to lateral loads. Two types
of tests were performed: (1) simple load-deformation
tests; and (2) load-deformation tests with strain
gauges. The load-deformation response, strain distri-
bution, ultimate bending moment capacity and mode
of failure of the mechanical joint were evaluated.
Because the ultimate bending moment of a PHC
pile is smaller than that of a steel pile in a composite
pile, the material capacity of the PHC pile should be a
criterion in the stability analysis of a composite pile.
The loading at the point when cracks are created in a
PHC pile is calculated from the following equation. In
a conservative analysis, bending moments generated
by the self-weight of the pile can be ignored. When the
0
50
100
150
200
250
0 10 20 30 40 50
Deformation at midspan (mm)
App
lied
load
(kN
)
Cycle1 : No crackCycle2 : No crackCycle3 : No crackCycle4 : CrackCycle5 : FailureCycle6 : Failure
Cycle 4 (100kN)
Cycle 5 (120kN)
Cycle 6 (140kN)
Fig. 6 Load-deformation response of test pile No. 2
(a) Cycle 1 (60kN) (b) Cycle 2 (80kN)
(c) Cycle 3 (82.6N) (d) Cycle 4 (100kN)
(e) Cycle 5 (120kN) (f) Cycle 6 (140kN)
Fig. 7 Failure mode of test
pile No. 2 with load
increments
1226 Materials and Structures (2014) 47:1221–1238

external load is 82.4 kN, cracking in the PHC pile can
be predicted based on the Eq. (1):
Mload ¼P
2� x ¼ 82:4
2� 2:5
¼ 103 kN � m� 103 kN � mðcrack bending
moment of the PHC pile) ð1Þ
where Mload is the bending moments due to an external
load (kN m), P is the external load (kN), and x is the
distance from the mid span to the support (m).
3.2 Test results and discussion
In the case of pile No. 1, three-point bending tests
were conducted to evaluate the load-deformation
response, ultimate bending moment and failure mode
to verify the intactness of the mechanical joint of the
steel-PHC composite pile. Figures 4 and 5 illustrate
the deformation and failure mode, respectively, of the
test pile as a function of the load increment. The
results indicated no signs of cracking in the PHC pile
for loads of 60–100 kN, applied in increments. Under
a loading of 120 kN, however, a partial crack was
observed in the reinforcing band of the PHC pile.
Under a loading of 140 kN, a 100 mm-long tensile
crack was generated in the PHC pile. When loads of
160 kN and more were applied, a tensile crack
approximately 350 mm-long and a diagonal crack
nearly 150 mm-long were created, at which point the
joint finally failed.
In the case of pile No. 2, three-point bending tests
were conducted to evaluate the load-deformation
response, ultimate bending moment, failure mode and
strain distribution. Figures 6 and 7 show the deformation
and failure mode, respectively, of the test pile as a
function of the load increment. The results indicated no
signs of cracking in the PHC pile for loads of 60–82.6
kN, applied in increments. Under a loading of 100 kN,
however, a partial crack was observed in the reinforcing
band of the PHC pile. Under a loading of 120 kN,
a 150 mm-long tensile crack was generated in the PHC
Fig. 8 Strain gauges
location for three-point
bending test
Fig. 9 Strain-time response
of three-point bending test
Materials and Structures (2014) 47:1221–1238 1227
pile. When loads of 140 kN and more were applied,
tensile cracks approximately 300 mm-long cracks were
generated in PHC pile. When an external load is 82.4 kN
equivalent to the crack bending moment of PHC pile, no
cracks were generated in the mechanical joint. When
loads of 140 kN and more were applied, cracking was
generated in the PHC pile, while no cracks were
generated in the mechanical joint. Therefore, the
0
20
40
60
80
100
120
140
-1400 -1200 -1000 -800 -600 -400 -200 0 200 400 600
Strain (micro strain)
App
lied
Loa
d (k
N)
Strain gage-1Strain gage-2Strain gage-3Strain gage-4Strain gage-5Strain gage-6Strain gage-7Strain gage-8Strain gage-9Strain gage-10
Strain gauge-1Strain gauge-2Strain gauge-3Strain gauge-4Strain gauge-5Strain gauge-6Strain gauge-7Strain gauge-8Strain gauge-9Strain gauge-10Strain gauge-11
Fig. 10 Applied load–
strain relation of three-point
bending test
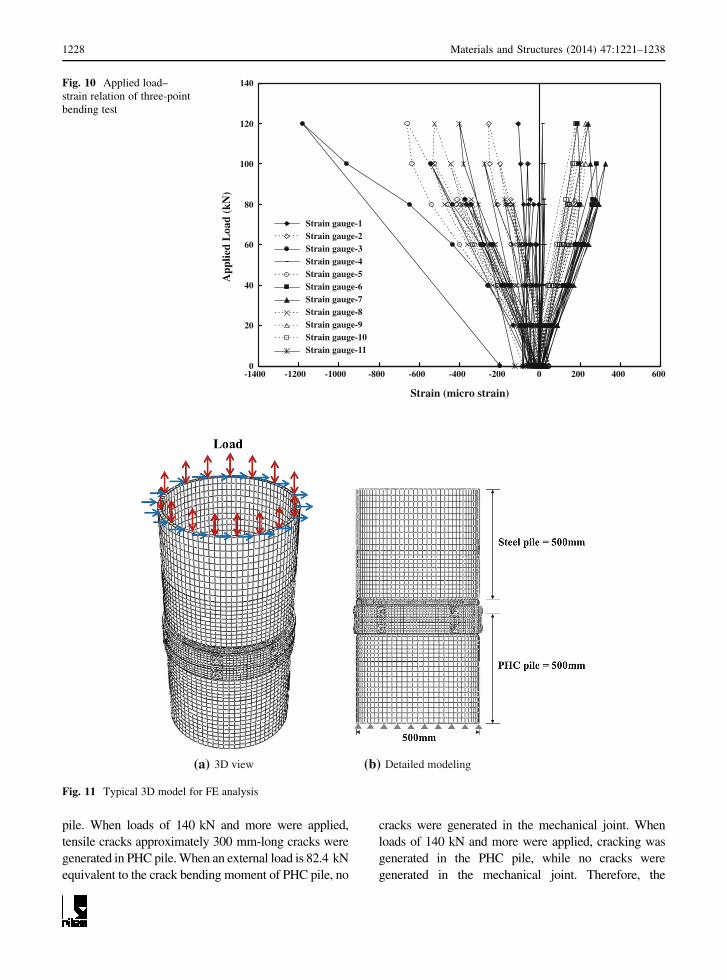
(a) 3D view (b) Detailed modeling
Fig. 11 Typical 3D model for FE analysis
1228 Materials and Structures (2014) 47:1221–1238

mechanical joint was not damaged before the pile
materials of piles were damaged. Test pile No. 2 also
exhibited an ultimate bending moment higher than the
standard bending moment specification of PHC piles.
The strains at the mid span of the steel-PHC
composite pile were monitored during the three-point
bending tests for pile No. 2. The purpose of monitoring
using strain gauges was to confirm the stability and
strength of the mechanical joint.
As Fig. 8 shows, strain gauges were bonded to the
top and bottom of the pile. Gauges 1 and 2 were
bonded inside of the steel pile and the PHC pile, and
the others were attached outside the pile. The load-
strain distributions for the steel-PHC composite pile
)dnebelipCHP(2-traP(b))birnoitcennoc(1-traP(a)
)elipCHP(4-traP(d))etalpedis(3-traP(c)
)tlob(6-traP(f))elipleets(5-traP(e)
Fig. 12 Detailed modeling of mechanical joint of steel-PHC composite pile
Materials and Structures (2014) 47:1221–1238 1229

are presented in Figs. 9 and 10. The compressive and
tensile strains of the PHC pile were monitored by the
gauges 3, 6 and 7. The strains in the steel pile were
recorded by gauges 5, 9 and 10. In addition, the steel
side plate was monitored by gauges 4, 11 and 8.
Loading was applied in six cycles at amplitudes that
increased from 60 to 140 kN. Until the third cycle at
82.6 kN, there was no sign of cracks or any damages to
the pile, while ?280 microstrain was measured at the
bottom and -413 micro strain was measured at the top
of the pile. During the fourth loading cycle, at 100 kN,
the axial strains reached peak values of ?320 micro-
strain (gauge 7) at the bottom of the PHC pile and
?208 micro strain (gauge 9) at the bottom of the steel
pile. During this fourth loading cycle, a partial crack
was observed in the reinforcing band of the PHC pile.
During the fifth and sixth loading cycles, after cracks
and damages had occurred in the pile, the tension
value did not increase any more, and the compression
value increased rapidly, reaching a peak value of
-1,580 microstrain (gauge 3) at the top of the PHC
pile. Thus, the PHC pile subjected to bending failed in
tension at the mid span location where the load was
applied. The standard ultimate strain of the PHC and
steel pile can be calculated as follows;
econ ¼ r=E ¼ 80=35; 000 ¼ 2; 300� 10�6
concrete compressionð Þ ð2Þ
econ ¼ r=E ¼ 5:66=35; 000 ¼ 160� 10�6
concrete bendingð Þ ð3Þ
esteel ¼ r=E ¼ 240=200; 000 ¼ 1; 200� 10�6
steel compressionð Þ ð4Þ
Through tests, the tested pile satisfied the standard
of design criteria in material capacity. As the results, it
is found that the mechanical joint body is relatively
stronger than any other parts of steel-PHC piles, and
thus represents to confirm safety of mechanical joint.
4 Numerical analysis
4.1 3D finite-element modeling
This section describes the ABAQUS-based numerical
analyses performed on the mechanical joint of the
steel-PHC composite pile. The analyses included
examining stresses generated in the joint under axial,
lateral, and tensile loading for the purpose of evalu-
ating the level of stability of the joint. In the numerical
analyses conducted using the ABAQUS program,
stresses generated in the joint under a specific type of
loading were investigated, and the maximum loads
experienced by the joint were estimated.
The typical 3D FE mesh used to analyze the
mechanical joint of the steel-PHC composite pile is
shown in Fig. 11. The outer boundary of the mesh was
fixed against displacements. As for the boundary
conditions of the joint, only the bottom surface of the
Table 2 Material properties used for FE analysis
Part no. Type Model c(kN/m3)
Elastic
modulus
(MPa)
l
Part 1 Connection
rib
L.E.* 72.0 210,000 0.20
Part 2 PHC bend L.E. 72.0 210,000 0.20
Part 3 Side plate L.E. 72.0 210,000 0.20
Part 4 PHC pile L.E. 27.4 35,000 0.25
Part 5 Steel pile L.E. 72.0 210,000 0.20
Part 6 Bolts L.E. 72.0 210,000 0.20
* L.E. linear-elastic model
Table 3 Loading conditions for numerical analysis (Unit: kN)
Load types 1 step 2 step 3 step 4 step 5 step 6 step 7 step 8 step
Axial load 500 1,000 1,500 2,000 2,500 3,000 3,500 4,000
Lateral load 60 80 100 120 140 160 180 200
Tensile load 100 150 200 250 300 350 400 500
Axial ? lateral load aA-250 A-500 A-750 A-1,000 A-1,250 A-1,500 A-1,750 A-2,000bL-60-200 L-60-200 L-60-200 L-60-200 L-60-200 L-60-200 L-60-200 L-60-200
a A axial loadb L lateral load
1230 Materials and Structures (2014) 47:1221–1238

PHC pile was fixed with respect to the x, y, and z axes,
while the joint, the steel pile, and the PHC pile were
free to move with respect to all axes, which allowed
the displacement and rotation. As Fig. 12 shows, the
mechanical joint is composed of (a) connection rib,
(b) the PHC pile bend, (c) side plates (three units),
(d) the PHC pile, (e) the steel pile, and (f) bolts (12
units). The mechanical joint can be divided into three
sections: the top, the bottom, and the side. The top
includes the steel pile and the connection rib. The
bottom includes the PHC pile and the PHC pile band.
The side includes the side plate and bolts. The top
section includes part-1 (the connection rib) and part-5
(the steel pile). The bottom section includes part-2 (the
PHC pile bend) and part-4 (the PHC pile). The side
section includes part-3 (the side plates) and part-6 (the
bolts).
To obtain detailed information by 3D FE analysis, a
1.0 m-long section of steel-PHC composite pile
around the joint was selected. Each element of the
joint was partially generated and assembled to repre-
sent the complete joint which was used to analyze the
behaviour of the joint under loading. The properties
and constitutive model using analysis were summa-
rized in Table 2. ‘‘The interface element modeled by
the Coulomb’s frictional model is employed to
simulate the interface of different materials. This
model is available in ABAQUS ver 6.8 [9]. The shear
behaviour in the interface is that elastic behaviour has
going on until critical shear stress (scrit) in Eq. (5)
Table 4 Material properties
Part no. Type Size (mm) Elastic
modulus (MPa)
Yielding
stress (MPa)
Allowable
stress (MPa)
10 % increased
allowable stress (MPa)
Part 1 Connection rib – 210,000 240 140 154
Part 2 PHC bend – 210,000 240 140 154
Part 3 Side plate 14t 210,000 240 140 154
Part 4 PHC pile A-type 35,000 80 20 22
Part 5 Steel pile 500 9 12t 210,000 240 140 154
Part 6 Bolts M14 9 25 210,000 900 530 583
0
25
50
75
100
125
150
175
200
0 100 200 300 400 500
Strain (micro strains)
App
lied
Ben
ding
Mom
ent
(kN
-m)
Strain gage-6 (PHC)
Strain gage-7 (PHC)
Strain gage-6 (after crack)
Strain gage-7 (after crack)
ABAQUS result
Cycle4(100kN)
Cycle 1~3(0~82.6kN)
Cycle5(120kN)
Cycle6(140kN)
Strain gauge-6 (PHC)
Strain gauge-7 (PHC)
Strain gauge-6 (after crack)
Strain gauge-7 (after crack)
ABAQUS result
Fig. 13 Comparison of moment-strain relation on PHC pile
0
25
50
75
100
125
150
175
200
-100 0 100 200 300 400 500
Strain (micro strains)
App
lied
Ben
ding
Mom
ent
(kN
-m)
Strain gage-9 (Steel pile)
Strain gage-10 (Steel pile)
Strain gage-9 (after crack)
Strain gage-10 (after crack)
ABAQUS result
Cycle4(100kN)
Cycle1~3(0~82.6kN)
Cycle5(120kN
Strain gauge-9 (Steel pile)
Strain gauge-10 (Steel pile)
Strain gauge-9 (after crack)
Strain gauge-10 (after crack)
ABAQUS result
Fig. 14 Comparison of moment-strain relation on steel pile
Materials and Structures (2014) 47:1221–1238 1231

reached and after that only shear displacement
increases without increase of shear stress.
scrit ¼ l� p ð5Þ
where, l is friction coefficient and p is contact
pressure.
The interface friction coefficients (l) for steel on
steel were generally ranges from 0.70 to 0.74 [5, 19].
In addition, the interface friction coefficients (l) for
steel on concrete were generally ranges from 0.57 to
0.70 [15]. In this study, the interface friction
coefficients are adopted as 0.7 for steel–steel inter-
face and 0.6 for concrete–steel interface, respec-
tively.
To evaluate the stability of the mechanical joint,
several relevant types of loads were applied to the joint,
and the stresses and displacements generated in the joint
by each type of load were estimated. Table 3 shows the
loads applied to the joint, i.e., axial loads, lateral loads,
tensile loads and combined loads (axial and lateral load).
Each load was applied in increments for each step to
check the interaction between the joint and the stress.
Based on the results of the numerical analyses, the
stress generated in each element of the mechanical
joint was calculated and compared to the yielding or
allowable stress of each material to determine the
yielding state of the pile materials. The yielding and
allowable stresses of each element were estimated as
shown in Table 4. The magnitude of each stress was
indicated in terms of the von Mises stress which, in a
tri-axial state of stress, is defined as follows:
where, rx, ry and rz = the normal stresses in the x, y
and z axes, respectively and sxy, syz and szx = the
shear stresses in the x, y and z axes, respectively.
The results of the numerical analyses showed that
the stresses generated in each element of the mechan-
ical joint included simple tensile and shear stresses as
well as tri-axial stress. By comparing these stresses to
the yield stress of the material, the maximum stress
that each material can support without experiencing
plastic deformation can be estimated. This maximum
Table 5 Maximum stress values by axial loads at mechanical joint
Part no. Allowable
stress (MPa)
Maximum stress values by axial loads (Von Mises, MPa)
500 kN 1,000 kN 1,500 kN 2,000 kN 2,500 kN 3,000 kN 3,500 kN 4,000 kN
Part 1 154 35 68 103 138 172 207 242 301
Part 2 154 30 52 77 100 124 148 171 194
Part 3 154 18 25 37 52 68 85 103 121
Part 4 22 7 14 21 28 35 42 49 56
Part 5 154 32 62 93 124 155 185 216 246
Part 6 583 15 19 27 36 43 51 58 66
Fig. 15 Stress distribution of mechanical joint under axial
loads
rVonMises ¼1ffiffiffi
2p �
ffiffiffiffiffiffiffiffiffiffiffiffiffiffiffiffiffiffiffiffiffiffiffiffiffiffiffiffiffiffiffiffiffiffiffiffiffiffiffiffiffiffiffiffiffiffiffiffiffiffiffiffiffiffiffiffiffiffiffiffiffiffiffiffiffiffiffiffiffiffiffiffiffiffiffiffiffiffiffiffiffiffiffiffiffiffiffiffiffiffiffiffiffiffiffiffiffiffiffiffiffiffiffiffiffiffiffiffi
rx � ry
� �2þ ry � rz
� �2þ rz � rxð Þ2þ6 s2xy þ s2
yz þ s2zx
� �
r
ð6Þ
1232 Materials and Structures (2014) 47:1221–1238

stress refers to the stress corresponding to the occur-
rence of permanent deformation in the material and
can be viewed as an approximate value of the elastic
limit.
When designing a steel-PHCcomposite pile, however,
uncertainty involving the site and the safety factor of the
pile material needs to be considered. By comparing von
Mises stress generated in the material to the additional
allowable stress, the stability of the material can be
evaluated. In this study, the following design criterion
was used to evaluate the stability of the mechanical joint:
rVonMises� 1:1�1:2ð Þ � rallowable. . .:OK ð7ÞWhen evaluating the stability of a pile joint by
comparing von Mises stress to the allowable stress, an
extra 10–20 % stress can be added to the allowable
stress. In this study, 10 % increased allowable stress
was applied considering a margin of safety in the
analytical data. Table 4 shows the allowable stress for
each material or element of the joint.
4.2 Validation of the 3D FEM with three-point
bending test result
The three-point bending tests were conducted to evaluate
bending moment-strain relation with verifying the results
of ABAQUS analyses. Testing was carried out in 6 cycles
with increasing amplitude of load. As the results of strain
distribution on the PHC pile (gauge 6 and 7), the moment-
strain relation shows the linear-elastic behaviour until the
third cycles. After cracks and damages on the PHC pile,
the moment-strain curves present the characteristics of
non-linear behaviour. ABAQUS analyses are conducted
by using linear-elastic model. Therefore the moment-
strain curve analyzed by ABAQUS can be compared with
the bending test curves which are the moment-strain
relation under the third cycles with no damage. As shown
Fig. 13, the moment–strain relations resulted from the
bending test and ABAQUS analyses are presented to the
almost same results.
Lastly, as the results of strain distribution on the steel
pile (gauge 9 and 10), the moment-strain relation shows
the linear-elastic behaviour. And the slopes of the
moment-strain curves are steeper than those of PHC pile.
Until the 6th cycle of peak load with 140 kN, there was no
yielding sign or damages on the steel pile showing ?235
micro strains (gauge 9) on the bottom and -690 micro
strains (gauge 5) on the top of the pile. The moment-strain
curve analyzed by ABAQUS can be compared with the
bending test curves. As shown Fig. 14, the moment-strain
relations resulted from the bending test and ABAQUS
analyses are presented to the almost same results.
4.3 Stress transfer at the mechanical joints
For compressive stress, numerical analyses were
carried out at a total of eight axial load levels, ranging
Table 6 Maximum stress values by lateral loads at mechanical joint
Part no. Allowable
stress (MPa)
Maximum stress values by axial loads (Von Mises, MPa)
60 kN 80 kN 100 kN 120 kN 140 kN 160 kN 180 kN 200 kN
Part 1 154 152 196 241 277 312 346 380 430
Part 2 154 67 97 125 143 160 178 194 210
Part 3 154 141 184 226 253 286 324 362 396
Part 4 22 7 9 11 13 15 17 19 21
Part 5 154 24 32 40 48 56 64 72 80
Part 6 583 118 156 192 228 265 301 337 368
Fig. 16 Stress distribution of mechanical joint under lateral
loads
Materials and Structures (2014) 47:1221–1238 1233

from 500 to 4,000 kN, in increments of 500 kN. Based
on the analytical data, the maximum von Mises stress
was estimated for each of the joint elements. The
maximum compressive stresses the joint could endure
were then calculated by comparing the maximum von
Mises stress applied at the joint to the allowable stress
of each material.
Table 5 and Fig. 15 summarize the magnitudes of
the von Mises stresses generated in each element of the
joint for axial loads of 500–4,000 kN. The ABAQUS
analysis results indicate that the largest stresses were
generated in the PHC pile (Part-4), the connection rib
(Part-1), and the steel pile (Part-5). Comparisons
between the stresses generated and the allowable
stresses of the materials showed that the stresses
generated exceeded the allowable stress in the PHC
pile (Part-4) when the maximum axial load transferred
to the joint was 1,600 kN or more.
For bending stress, numerical analyses were carried
out for a total of eight lateral load levels from 60 to
200 kN in increments of 20 kN. Based on the results,
the maximum von Mises stress was estimated for each
joint element. The maximum bending stresses that the
joint can endure were calculated by comparing the
maximum von Mises stress applied to the joint to the
allowable stress of each material.
Table 6 and Fig. 16 summarize the magnitudes of
the von Mises stresses generated in each element of the
joint for lateral loads of 60–200 kN. The ABAQUS
analysis results indicate that the largest stresses were
generated in the side plate (Part-3), and the connection
rib (Part-1). Comparisons between the stresses gener-
ated and the allowable stresses of the materials showed
that the stresses generated exceeded the allowable
stress at the connection rib (Part-1) when the maxi-
mum lateral load transferred to the joint was 62 kN or
more.
For tensile stress, numerical analyses were carried
out for a total of eight load levels from 100 to 500 kN
in increments of 50 kN. Based on the results, the
maximum von Mises stress was estimated for each of
the joint elements. The maximum tensile stresses the
joint can endure were calculated by comparing the
maximum von Mises stress applied to the joint to
the allowable stress of each material.
Table 7 and Fig. 17 summarize the magnitudes
of the von Mises stresses generated in each element of
the joint for tensile loads from 100 to 500 kN. The
ABAQUS analysis results indicate that the largest
stress was generated in the side plate (Part-3).
Comparisons between the stresses generated and the
allowable stresses of the materials showed that the
generated stresses exceeded the allowable stress at
the side plate (Part-3) when the maximum tensile load
transferred to the joint was 245 kN or more.
In most practical situations, the loads applied to a
pile include both axial and lateral loads. Therefore,
this study analyzed combined loads as well. Under
Table 7 Maximum stress values by tensile loads at mechanical joint
Part no. Allowable
stress (MPa)
Maximum stress values by axial loads (Von Mises, MPa)
100 kN 150 kN 200 kN 250 kN 300 kN 350 kN 400 kN 500 kN
Part 1 154 43 55 67 78 90 101 113 137
Part 2 154 26 37 49 61 72 83 94 117
Part 3 154 77 109 133 156 181 212 245 305
Part 4 22 3 4 5 6 7 9 10 12
Part 5 154 6 9 12 16 19 22 25 31
Part 6 583 32 43 53 63 72 83 92 110
Fig. 17 Stress distribution of mechanical joint under tensile
loads
1234 Materials and Structures (2014) 47:1221–1238

axial loads varying from 250 to 2,000 kN, lateral loads
were increased from 60 to 200 kN as von Mises stress
was calculated. Table 8 and Fig. 18 summarize the
magnitude of the von Mises stresses generated in each
element of the joint. The ABAQUS analysis results
indicate that the largest stress was generated in the side
plate (part-3), connection rib (part-1), and bolts (part-
6). Comparisons between the stresses generated and
the allowable stresses showed that the generated
stresses exceeded the allowable stress at the side plate
(Part-3) when the maximum lateral load transferred to
the joint was 112 kN or more.
4.4 Design chart for mechanical joints
A rigorous numerical approach of the mechanical joint
is computationally expensive and time consuming
because of the 3D nature of the problem. Therefore, a
simplified design method is more suitable for the
preliminary design stage. A design chart based on the
results of numerical analysis, in which pile joint
stability is considered, can be proposed for the design
method of steel-PHC composite piles.
The magnitude of stress that the mechanical joint
can endure under axial, lateral, tensile, and combined
loading was predicted. The analytical results can be
verified using the results of the three-point bending
tests with strain gauges measurements. Based on the
aforementioned results of the numerical analyses, the
stress transfer can be calculated for each element of
the mechanical joint under the combined loadings.
The mechanical joint is composed of six elements,
namely, the connection rib (part-1), the PHC pile bend
(part-2), the side plates (part-3), the PHC pile (part-4),
the steel pile (part-5), and the bolts (part-6).
In Fig. 19, the stress transfer and distribution at
each element of the mechanical joint are shown for
axial loads of 0–2,000 kN and lateral loads of
0–200 kN. The stress distributions at parts-1, 2, 3,
and 6 tend to increase or decrease depending on the
scale of the axial and lateral loads. Those of parts-4
and 5 have a tendency to increase almost linearly as
the axial and lateral loads increase. Analysis of the
stress distributions can be used to analyze the causes of
joint failure and to reinforce the stability of the
mechanical joint with greater ease.
Based on the stress transfer and distribution, the
maximum load resistance values of the mechanical
joint can be estimated by comparing the von Mises
stresses with the allowable stresses of the pile
material, as shown Fig. 20. In the case of steel
elements, such as parts-1, 2, 3, 5, and 6, the maximum
lateral resistances tend to increase as the maximum
axial resistance increases but start to decrease beyond
a certain point of axial resistance. However, in the case
of concrete elements, such as part-4, the maximum
lateral resistance tends to decrease as the axial
resistance increases.
Table 8 Maximum stress values by combined loads at mechanical joint (axial load = 500 kN)
Part no. Allowable
stress (MPa)
Maximum stress values by axial loads (Von Mises, MPa)
60 kN 80 kN 100 kN 120 kN 140 kN 160 kN 180 kN 200 kN
Part 1 154 59 77 103 141 186 247 311 367
Part 2 154 47 53 60 68 78 103 136 167
Part 3 154 74 86 121 170 228 293 345 393
Part 4 22 11 13 15 17 19 21 23 25
Part 5 154 43 49 56 63 70 78 85 92
Part 6 583 45 63 87 113 144 185 230 269
Fig. 18 Stress distribution of mechanical joint under combined
load (axial load 500 kN and lateral loads)
Materials and Structures (2014) 47:1221–1238 1235

Based on the results of the detailed numerical
analyses, the design chart for mechanical joint, which
is possible to achieve the preliminary design stage,
can be developed. Figure 21 shows the proposed
design chart for mechanical joint. The design chart is
classified into four different zones such as (1) the
stable zone, (2) the unstable steel zone, (3) the unstable
concrete zone, and (4) the failure zone. The proposed
0
100
200
300
400
500
0 500 1,000 1,500 2,000 2,500
Axial Load (kN)
Stre
ss (
Von
Mis
es, M
Pa)
Lateral - 0kNLateral - 60kNLateral - 80kNLateral - 100kNLateral - 120kNLateral - 140kNLateral - 160kNLateral - 180kNLateral - 200kN
0
100
200
300
400
500
Axial Load (kN)
Stre
ss (
Von
Mis
es, M
Pa)
Lateral - 0kNLateral - 60kNLateral - 80kNLateral - 100kNLateral - 120kNLateral - 140kNLateral - 160kNLateral - 180kNLateral - 200kN
0
100
200
300
400
500
Axial Load (kN)
Stre
ss (
Von
Mis
es, M
Pa)
Lateral - 0kNLateral - 60kNLateral - 80kNLateral - 100kNLateral - 120kNLateral - 140kNLateral - 160kNLateral - 180kNLateral - 200kN
0
20
40
60
80
100
Axial Load (kN)
Stre
ss (
Von
Mis
es, M
Pa)
Lateral - 0kNLateral - 60kNLateral - 80kNLateral - 100kNLateral - 120kNLateral - 140kNLateral - 160kNLateral - 180kNLateral - 200kN
0
50
100
150
200
250
300
Axial Load (kN)
Stre
ss (
Von
Mis
es, M
Pa)
Lateral - 0kNLateral - 60kNLateral - 80kNLateral - 100kNLateral - 120kNLateral - 140kNLateral - 160kNLateral - 180kNLateral - 200kN
0
100
200
300
400
500
Axial Load (kN)
Stre
ss (
Von
Mis
es, M
Pa)
Lateral - 0kNLateral - 60kNLateral - 80kNLateral - 100kNLateral - 120kNLateral - 140kNLateral - 160kNLateral - 180kNLateral - 200kN
(a) Part-1 (connection rib) (b) Part-2 (PHC pile bend)
(c) Part-3 (side plate) (d) Part-4 (PHC pile)
(e) Part-5 (steel pile) (f) Part-6 (bolt)
0 500 1,000 1,500 2,000 2,500
0 500 1,000 1,500 2,000 2,500
0 500 1,000 1,500 2,000 2,5000 500 1,000 1,500 2,000 2,500
0 500 1,000 1,500 2,000 2,500
Fig. 19 Load-stress relations of mechanical joint under combine load with axial and lateral loads
1236 Materials and Structures (2014) 47:1221–1238

design chart can be adopted and utilized for designing
and evaluating the stability of the mechanical joint.
Curve-1: y1 ¼ 66:81e0:001x ð8Þ
Curve-2: y2 ¼ �6� 10�5x2 � 0:02xþ 201:5 ð9Þ
Curve-3: y3 ¼ �5� 10�8x3 � 1� 10�4x2 � 0:113x
þ 298:45
ð10ÞFigure 21 shows that zone-1 is the stable zone in
which all of the elements of the mechanical joint are
stable. Zone-2 is the zone in which the mechanical
joint is partially unstable because the stresses in the
steel elements exceed the allowable stress of steel.
Zone-3 is also a zone of partial instability in which the
stresses in the concrete elements exceed the allowable
stress of concrete. Each zone can be indicated as
follows.
Zone-1 is the stable zone in which the area of the
maximum axial resistance x and the maximum lateral
resistance y are as follows:
0� x \ 795; y \ y1 and
795� x \ 1680; y \ y2 ð11Þ
Zone-2 is the unstable steel zone in which the area
of the maximum axial resistance x and the maximum
lateral resistance y are as follows:
0� x \ 795; y1� y \ y1 ð12ÞZone-3 is the unstable concrete zone in which the
area of the maximum axial resistance x and the
maximum lateral resistance y are as follows:
795� x\1190; y2� y\y1 and
1190� x\2200; y2� y\y3 ð13Þ
Zone-4 is the failure zone in which the remaining
area is as follows:
0� x\795; y� y2 and
795� x\1190; y� y1 and
1190� x\2200; y� y3 ð14Þ
The estimated von Mises stress and the allowable
stress of each pile material were compared to estimate
the maximum stress endured by each element. Based
on these results, design chart for the mechanical joint
is proposed, with three curve equations and four zones
(the stable zone, the unstable steel zone, the unstable
concrete zone, and the failure zone). The proposed
design chart can be used to evaluate the safety of a
mechanical joint.
5 Summary and conclusions
The main objective of this study was to propose design
chart for mechanical joints in steel-PHC composite
piles for various loading conditions. Three-point
bending tests were conducted to investigate the
behaviour of the mechanical joint. In addition, the
3D finite element analysis for the mechanical joint was
performed. Based on these results, the design chart for
mechanical joint has been proposed to be convenient
for preliminary design stage. On the basis of the
findings of this study, the following conclusions are
drawn:
0
100
200
300
400
500
0 500 1,000 1,500 2,000 2,500 3,000
Max. Axial Resistance (kN)
Max
. Lat
eral
Res
ista
nce
(kN
) Part-1 Part-2Part-3 Part-4Part-5 Part-6
1
2
3
4
5
6
Fig. 20 Evaluation of maximum axial and lateral resistance
values at each element of mechanical joint
Fig. 21 Design chart for mechanical joint
Materials and Structures (2014) 47:1221–1238 1237

1. Three-point bending tests were conducted to
evaluate the load-deformation response, strain
distribution on the pile, ultimate bending moment
and failure mode of mechanical joints in steel-
PHC piles. The tests showed that the mechanical
joints body is relatively stronger than any other
parts of steel-PHC piles, and thus represents to
confirm safety of mechanical joint.
2. A rigorous numerical approach of the mechanical
joint is computationally expensive and time
consuming because of the 3D nature of the
problem. Therefore, a simplified design method
is more suitable for the preliminary design stage.
The design chart for mechanical joint needs to be
proposed in preliminary design stage.
3. The 3D numerical methodology in the present
study represents a realistic mechanism of mechan-
ical joints. The stress distribution and maximum
load resistance of each part of the joint were
estimated by comparing the calculated stresses to
the yield stresses of the joint materials. Through
detailed numerical analysis, it is found that a
mechanical joint of steel-PHC composite piles has
more reliable than any other parts of piles under
working load.
4. Based on the results of the detailed numerical
analyses, design chart for mechanical joints,
which is possible to achieve the preliminary
design stage, can be developed. The proposed
design chart is classified into four different zones
such as (1) the stable zone, (2) the unstable steel
zone, (3) the unstable concrete zone, and (4) the
failure zone. The proposed design chart can used
to evaluate the safety of mechanical joints.
Acknowledgments This work was supported by the National
Research Foundation of Korea (NRF) grant funded by the Korea
government (MSIP) (No. 2011-0030842).
References
1. Carlsson LA, Gillespie JW, Zweben CH (1989) Delaware
composites design encyclopedia. Technomic Publish Co,
Lancaster
2. Fam AZ, Rizkalla SH (2000) Concrete-filled FRP tubes
for flexural and axial compression. In: Proceedings of 3rd
international conference on advanced composite materials
in bridge and structures, pp 315–322
3. Fam AZ, Rizkalla SH (2002) Flexural behavior of concrete-
filled fiber-reinforced polymer circular tubes. J Comps
Constr 6(2):123–132
4. Fellenius B, Kim S, Chung S (2009) Long-term monitoring
of strain in instrumented piles. J Geotech Geoenviron Eng
135(11):1583–1595
5. Grigoriev IS, Meilikhov EZ (1996) CRC handbook of
physical quantities. CRC Press, Baca Raton, pp 145–156
6. Heinz R (1993) Plastic piling. Civ Eng Mag 63(4):63–65
7. Horeczko G (1995) Marine application of recycled plastics.
In: Proceedings of 13th structural congress. Restructuring
America and Beyond, ED. Sanayei M, ASCE, Reston,
pp 834–837
8. Karbahari VM, Eckel DA (1993) Strengthening of concrete
column stubs through resin infused composite wraps.
J Thermoplast Compos Mater 6(2):92–107
9. Karlsson, Sorensen (2008) ABAQUS user’s manual, ver-
sion 6.8. Rawtucket
10. Lee CT, Bak SY (2007) Application of a composite pile in
local practice. In: Proceedings of Korea association of pro-
fessional engineers in geotechnical engineering, pp 237–246
11. Mirmiran A, Shahawy M, Samaan M (1999) Strength and
ductility of hybrid FRP concrete beam-columns. J Struct
Eng 125(10):1085–1093
12. Mirmiran A, Shao Y, Shahawy M (2002) Analysis and field
tests on the performance of composite tubes under pile
driving impact. Compos Struct 55:127–135
13. Moran DA, Pntelides CP (2002) Variable strain ductility
ratio for fiber-reinforced polymer-confined concrete.
J Compos Constr 6(4):224–232
14. Prion HG, Boehme J (1994) Beam-column behaviour of
steel tubes filled with high strength concrete. Can J Civ Eng
21:207–218
15. Rabbat BG, Russell HG (1985) Friction coefficient of steel
on concrete and grout. J Struct Eng 111(3):505–515
16. Sakino K, Nakahara H, Morino S, Nishiyama I (2004)
Behavior of centrally loaded concrete-filled steel-tube short
columns. J Struct Eng 130(2):180–188
17. Schneider S (1998) Axially loaded concrete-filled steel
tubes. J Struct Eng 124(10):1125–1138
18. Shehata IA, Cameiro LAV (2002) Strength of short concrete
columns confined with CFRP sheets. Mater Struct 35:50–58
19. Sulivan James F (1988) Technical physics. Wiley, New
York, p 204
20. Varma AH, Ricles JM, Sause R, Lu LW (2002) Seismic
behaviour and modelling of high-strength composite con-
crete-filled steel tube (CFT) beam-columns. J Constr Steel
Res 58(5–8):725–758
1238 Materials and Structures (2014) 47:1221–1238