Proposal for a Sustainable Urban Transport Index (SUTI) for cities in ...
38
Proposal for a Sustainable Urban Transport Index (SUTI) for cities in the Asia-Pacific region Henrik Gudmundsson, Chief Advisor, CONCITO EGM on Planning and Assessment of Urban Transportation Systems, 22-23 September 2016, Kathmandu, Nepal
-
Upload
duongtuong -
Category
Documents
-
view
215 -
download
0
Transcript of Proposal for a Sustainable Urban Transport Index (SUTI) for cities in ...

Proposal for a Sustainable Urban Transport Index (SUTI) for cities
in the Asia-Pacific region
Henrik Gudmundsson, Chief Advisor, CONCITO
EGM on Planning and Assessment of Urban Transportation Systems,
22-23 September 2016, Kathmandu, Nepal

• Background and purpose of the SUTI index
• Methodology
• Framework
• Indicator selection (macro and micro)
• Index design
• Exemplification
• Summary
Overview

• Current transport trends pose major challenges for cities, for people living and working there, and for the local and global environment
• There is need for ways to measure, monitor and assess urban transport in the context of the Sustainable Development agenda, and thereby to support sustainable urban transport planning
• The purpose of this effort is to explore a concept for a Sustainable Urban Transport Index (SUTI) for cities in Asia
• This presentation may hopefully inform a discussion whether and how a SUTI index could be developed and applied
Background and Purpose
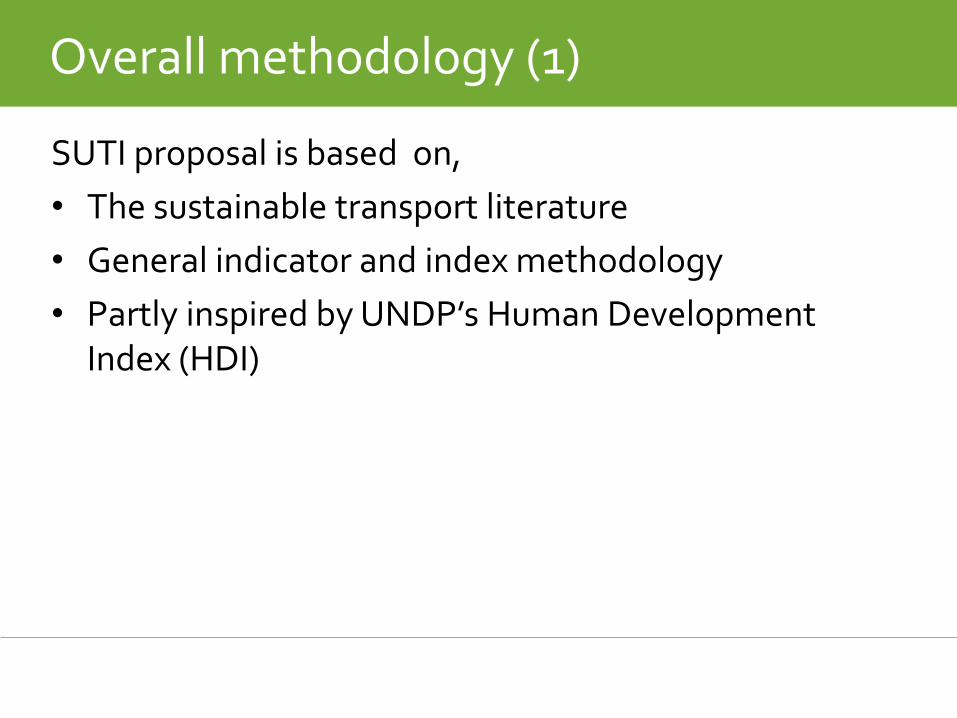
SUTI proposal is based on,
• The sustainable transport literature
• General indicator and index methodology
• Partly inspired by UNDP’s Human Development Index (HDI)
Overall methodology (1)

• HDI published by UNDP annually since 1990
• Used to rank countries
• Three dimensions with sub-index and four indicators
• Methodology has been modified along the way to make HDI more robust
Human Development Index
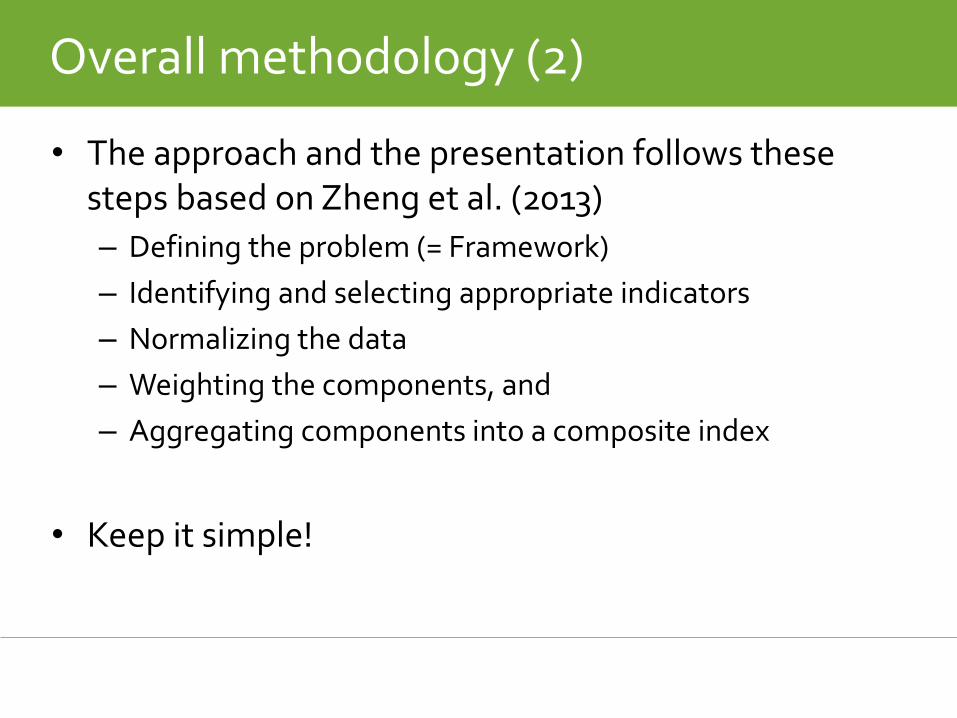
• The approach and the presentation follows these steps based on Zheng et al. (2013)
– Defining the problem (= Framework)
– Identifying and selecting appropriate indicators
– Normalizing the data
– Weighting the components, and
– Aggregating components into a composite index
• Keep it simple!
Overall methodology (2)

• Framework for measuring sustainable urban transport should as a minimum reflect,
– The three Sustainable Development dimensions (environmental social, economic ,impacts of transport)
– The SDG’s of relevance to urban transport
– The ‘Sustainable Mobility Paradigm’ (Banister 2008), according to which cities seek to promote clean, safe and efficient access, and to ‘avoid’, ‘shift’ and ‘improve’ transport as appropriate
Framework

SDG’s Targets 3. Ensure healthy lives and promote well-being for
all at all ages (Road Safety)
3.6 By 2020, halve the number of global deaths and injuries from
road traffic accidents
7. Ensure access to affordable, reliable,
sustainable and modern energy for all (Energy
efficiency)
7.3 By 2030, double the global rate of improvement in energy
efficiency
9. Build resilient infrastructure, promote inclusive
and sustainable industrialization and foster
innovation (Sustainable infrastructure)
9.1 Develop quality, reliable, sustainable and resilient
infrastructure, including regional and trans-border infrastructure,
to support economic development and human well-being, with a
focus on affordable and equitable access for all
11. Make cities and human settlements inclusive,
safe, resilient and sustainable (Sustainable (urban)
transport for all)
11.2 By 2030, provide access to safe, affordable, accessible and
sustainable transport systems for all, improving road safety,
notably by expanding public transport, with special attention to the
needs of those in vulnerable situations, women, children, persons
with disabilities and older persons
Target 11.7 By 2030, provide universal access to safe, inclusive
and accessible, green and public spaces, in particular for women
and children, older persons and persons with disabilities
11.6 By 2030, reduce the adverse per capita environmental impact
of cities, including by paying special attention to air quality and
municipal and other waste management
12. Ensure sustainable consumption and
production patterns (Fuel subsidies)
12.c. Rationalize inefficient fossil-fuel subsidies that encourage
wasteful consumption by removing market distortions, in
accordance with national circumstances
Key SDG targets for urban transport

• Review of literature to identify indicators and indices for sustainable urban transport in existing reports
• 25 reports and papers considered with 420 individual indicators (many overlapping) put in excel sheet
• Priority given to indicators:
– with clear reference to sustainability aspects (framework)
– defined methodology
– reported in several studies
– used in one or more cities (preferably in Asia)
• Reduced to the most common and suitable 20/24
Indicator ‘macro-selection’

Indicator references considered
Nr REFERENCES
STI indicator/index
TYPE SCALE SCOPE APPLICATION # INDIC
ATORS
APPLIED
Sustainable Transport indicator/index
1 WBCSD 2016 Indicators Urban Internal Worldwide 19 6 cities
2 A.D. Little 2014 Index Urban Comparative World 19 84 cities
3 KOTI 2015 Index Urban Comparative Korea 24 Multiple cities
4 Siemens 2008 Index Urban Comparative World 15 Multiple cities
5 Shiau et al 2013 Index National Internal Taiwan 16 1 country
6 Marzieh 2015 Index Urban Academic Melbourne 9 1 city
7 Reddy et al 2013 Index Urban Comparative India/World 7 5 cities
8 Bachok 2015 indicators Urban Internal Malaysia 17 Not yet
9 ECOMOBILITY 2013 Indicators Urban Internal Europe 20 Several cities
10 Ahangari 2015 index National Comparative OECD 11 Several count
11 CIVITAS (May) 2016 Indicators Urban Internal Europe 28 Partly
12 Zheng et al. 2013 Index State Comparative US 24 Several states
13 Zito 2011 Index Urban Comparative Europe 12 Multiple
14 Georgouli 2015 Index Urban Academic Copenhagen 11 1 city
15 SLoCaT 2014 Indicators General (Open) World 14 No
16 Litman 2016 Indicators General Academic World/Us 20 No
17 Bongardt et al 2011 Indicators General (Open) World 10 No
18 Steenberghen 2013 Indicators Urban Comparative Europe 6 No
19 Olofsson 2016 Indicators Urban Internal Sweden 21 1 city
20 Castillo 2010 Index Urban Academic UK 15 Partly
21 Gilbert et al 2002 indicators National Internal Canada 14 1 country
General set or index with transport as a domain/section (#indicators refer to transport only)
22 SDG-IAEG 2016 Indicators Global Multiple World 6 Not yet
23 HABITAT 2016 Indicators Urban Multiple World 3 Not yet
24 GCIF 2015 Indicators Urban Multiple? World 9 Several cities
25 Global City Rep 2015 Index Urban Comparative World 3 60 cities

UN Habitat (2016) • Suggests indicators to measure SDG
goal 11, incl. target 11.2 on Urban transport (+IAEG-SDG 2016)
WBCSD (2016) Sustainable Mobility 2.0 • Selects 19 urban transport indicators • Applied in six cities, three in Asia • Detailed methodology
Arthur D Little/UITP (2014) • Selects 19 urban transport indicators. • 84 cities are covered, 30 in Asia • Less detail, wider coverage
Most important references

• Limit number of indicators and complexity of index to max 8 indicators in four domains,
– Social dimension
– Environmental dimension
– Economic dimension
– Transport system performance
• The 20 candidate indicators subjectively scored using two sets of criteria (Castillo and Pitfield, 2010):
– Relevance for Sustainable Transport framework
– Methodological quality
Indicator ‘micro-selection’

A) Sustainable Transport framework
• Relevance for each of the 4 domains
• Relevance for ‘avoid’, ‘shift’ or ‘improve’ strategy
• Relevance for each of the key SGD targets
B) Methodological quality
• Definition and concept available in existing reports
• Has been applied in practice in several cities
• Data regularly available or readily produced
• Clear interpretation possible
• Scale to normalize indicator for index easy to define
• Relevant and actionable for cities
Detailed scoring criteria

Proposed indicators for SUTI index
Domain Indicator
System Extent to which transport plans cover public transport,
intermodal facilities, and infrastructure for active modes
Modal share of active and public transport in
commuting
Social Convenient access to public transport service
Traffic fatalities per 100.000 inhabitants
Economic Affordability – travel costs as part of income
Investment in public transportation systems
Environmental Air quality (pm10/ pm2.5)
Greenhouse gas emissions from transport

• Indicator relevance for sustainable transport framework
• Proposed definition
• Unit of measurement
• Interpretation
• Minimum and maximum values of indicator scale to use in the index construction
• Sources in the literature
• Examples of where the indicators have been applied in practice
• Comments on data availability
• Other comments
• Summary: Main challenges
For each indicator is described…

Definition Extent to which transport plans cover public transport,
intermodal facilities, and infrastructure for active modes
Unit Measured in qualitative categories based on assessment of most recent transport plan with regard to how it addresses each of the four aspects, considered equal: a) walking networks, b) cycling networks, c) intermodal transfer facilities and d) expansion of public transport modes. For each aspect, four category levels are assessed: 0) 'no coverage', 1) 'limited coverage', 2) 'extensive coverage', or 3) 'full coverage'. The scores are added. The minimum score will therefore be 0 (=the case that none of the four aspects are covered). The maximum score is 12 (=the case that all four aspects are fully covered, 4*3).
Interpretation Clear-cut. Increasing score is positive
Min / Max 0 / 12
Data issues Not immediately available. To be produced for each city
Comments The proposed scoring method above is an example. Assessment could be done by an expert panel
1: Extent to which transport plans cover soft & public modes

Definition Percentage of commuters using a travel mode to work other than a personal motorized vehicle.
Unit Percentage of trips for commuters not by personal motorized vehicle
Interpretation Clear-cut. Increasing is positive.
Min / Max 10 / 90 (GCIF 2015 and other sources)
Data issues Most cities consider modal split data. The methodology to measure modal split often differ, but the ISO 37120 standard could be basis. The best source of data is a regularly updated travel survey at the local level
Comments Main challenge: Comparability issues The unit can be trips, or (more advanced) pkm which is useful for calculating other indicators such as fuel efficiency and emissions. Two-wheelers?
2: Modal share of active and public transport in commuting

Definition Proportion of the population that has convenient access to public transport, defined as living 500 meters or less from a public transport stop with minimum 20 minute service. ‘Public transport’ is a shared passenger transport service available to the general public, excluding taxis, car pools, hired buses and para-transit
Unit Percentage of population.
Interpretation Clear-cut. Increasing is positive.
Min / Max 20 / 100 (WBCSD 2016,0/100)
Data issues Not directly available. Need to make estimates at city level. Easiest done with GIS tools available.
Comments The indicator is the one proposed by SDG-IEAG for SDG target 11.2. Does not necessarily reflect all aspects of the SDG target 11.2 Possible to differentiate between stops according to quality of service, e.g. larger buffers than around rail stations (1 km) than bus stops (500 m), or according to frequency of services at the stop. Main Challenge: Data availability and collection
3: Convenient access to public transport service

Definition Fatalities in traffic (road; rail, etc.) in the urban areas per 100.000 inhabitants.
Unit Number of persons deceased as related to a traffic accident if it occurs within 30 days after the accident
Interpretation Clear-cut, Decreasing is positive
Min / Max 35 / 0 (WBCSD 2016)
Data issues WHO maintains and updates database over traffic fatalities in member states based on annual national reporting. Some data is available at city level, although not universally
Comments Injuries are mentioned as well in the DGSDG target, but the definition and data collection is not as standardized Could be limited to road fatalities for simplification Main challenge: Data availability at city level
4:Traffic fatalities per 100.000 inh.
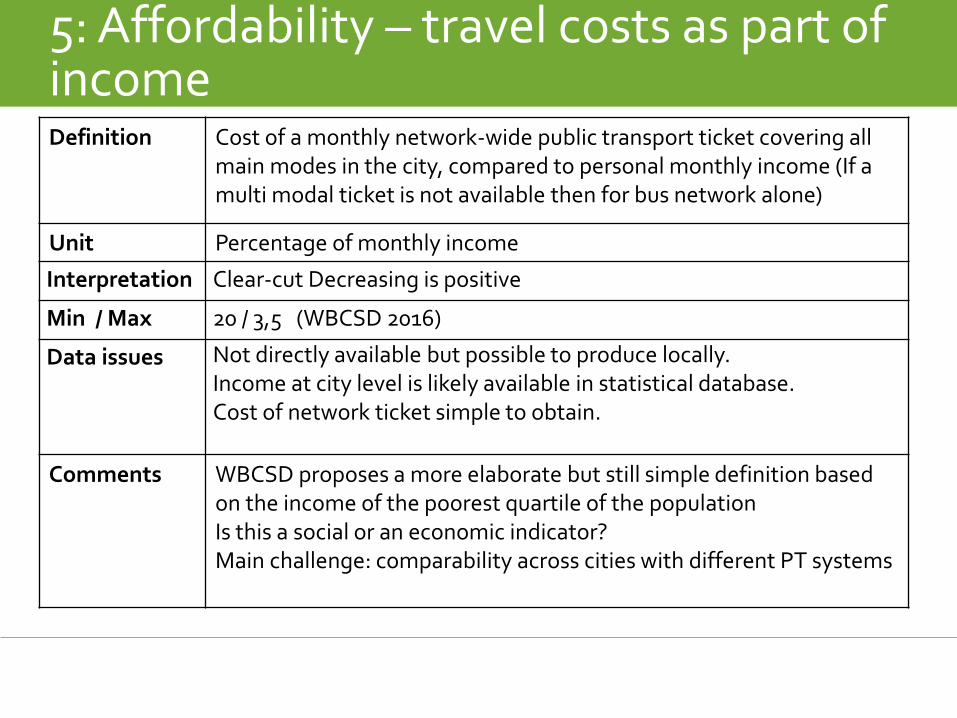
Definition Cost of a monthly network-wide public transport ticket covering all main modes in the city, compared to personal monthly income (If a multi modal ticket is not available then for bus network alone)
Unit Percentage of monthly income
Interpretation Clear-cut Decreasing is positive
Min / Max 20 / 3,5 (WBCSD 2016)
Data issues Not directly available but possible to produce locally. Income at city level is likely available in statistical database. Cost of network ticket simple to obtain.
Comments WBCSD proposes a more elaborate but still simple definition based on the income of the poorest quartile of the population Is this a social or an economic indicator? Main challenge: comparability across cities with different PT systems
5: Affordability – travel costs as part of income

Definition Share of all transport investments made by the city that is directed to public transport
Unit % of transport investment spending It is proposed to average over three or five years because annual investments tend to fluctuate much over time
Interpretation Relatively clear-cut; Increasing is positive (generally)
Min / Max O / 50% (not based on observation)
Data issues Data not generally available. Cities could likely extract the data from public expenditure accounts. Which average to use, e,g 3 or 5 or other?
Comments The indicator is possibly not immediately found in any of major studies on urban indicators How about investments in soft modes? Private investments could matter as well?
6: Investment in public transportation systems

Definition Annual mean levels of fine particulate matter (PM10 or PM2.5) in the air (population weighted) compared to threshold
Unit Micrograms per cubic meter (μg/m3)
Interpretation Clear-cut: Decreasing is positive.
Min / Max 150 / 10 (μg/m3) (Reddy 2013)
Data issues WHO has a database of measurements from now over 1.600 cities worldwide and growing More cities are covered for PM10 whereas PM2.5 is more accurate as health indicator How often are the WHO data updated?
Comments Air quality is not only affected by transport. Other local sources could influence it without a change in transport How does ‘population weighting’ apply at city level? Possible alternative is to calculate total emissions from transport (WBCSD 2016 suggests method)
7: Air quality (PM10 or PM2.5)

Definition CO2 equivalent emissions from transport by urban residents per annum per capita
Unit Ton CO2 equivalent/capita
Interpretation Clear-cut: Decreasing is positive
Min / Max 2.75 / 0 (WBCSD 2016)
Data issues Data typically not immediately available. Emissions from the transport system of a city need to be calculated based on data for transport flows, vehicle types, and fuel consumption data. Using a transport model and/or data from a household travel survey will be very helpful. (WBCSD 2016 proposes detailed methodology
Comments Main challenge: Can be relatively demanding to produce More and more cities worldwide are committed to reduce their GHG emissions More simple alternative could be monitoring the uptake of zero- or low carbon emission vehicles in the vehicle fleet or bus fleet
8: Greenhouse gas emissions

Index to be constructed from four domains (sub-index) with two indicators per domain
Key elements in construction are:
• Normalization
• Weighing
• Calculation method for aggregation
Index

• Indicators on different scales need to be normalized
• The method used is linear rescaling to scale of 1-100
• Common approach in composite indicator used for several sustainable transport index
• Z is the normalized indicator X for topic i and city c.
• Xmin is the ‘worst’ value of the indicator in actual units, whereas Xmax is the ‘best’ value
Normalization for SUTI (1)

• Min and max defined as lowest and highest value found in real cities for each indicator
• Mostly based on real performance information in literature
• Desired target level (e.g. zero fatalities) used in a few cases
• Relative ranking (without predefined min/max) not chosen because this would make tracking performance over time less meaningful
Normalization for SUTI (2) Min-Max

• Necessary to decide how to weigh each indicator and domain (sub-index).
• Weight can be determined by political or subjective choice, or by expert knowledge.
• In this case ‘equal weight’ to each indicator and sub-index is applied
• Justification is to allow equal importance to three sustainability dimensions + system dimension
• ‘Equal weight’ is also a weighting choice!
• Could be reconsidered by expert panel /AHP
Weighing (1)
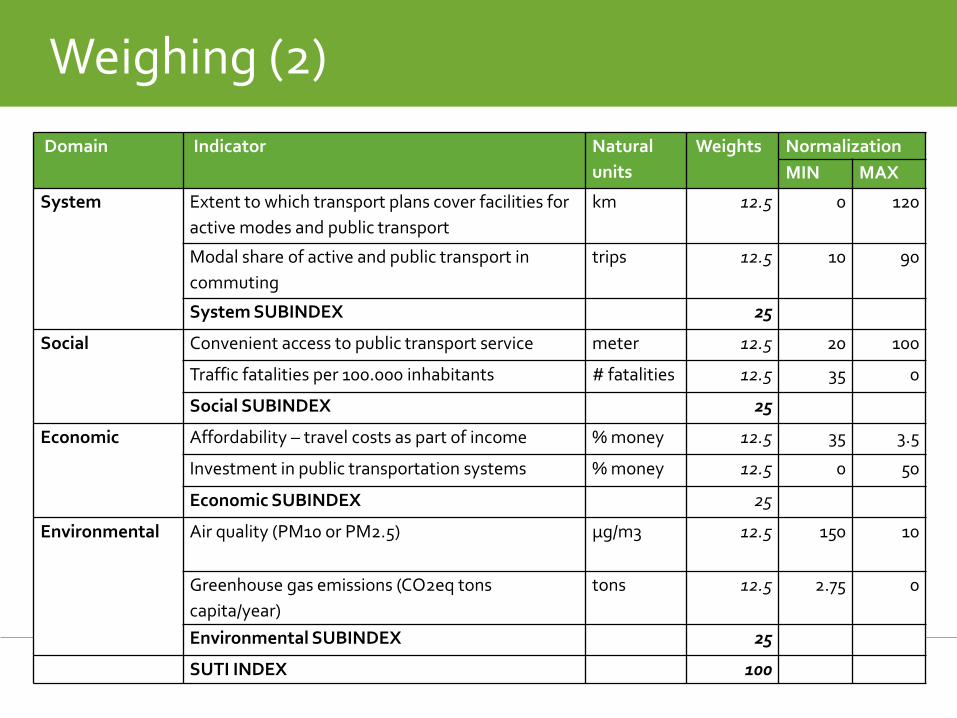
Weighing (2)
Domain
Indicator Natural
units
Weights Normalization
MIN MAX
System
Extent to which transport plans cover facilities for
active modes and public transport
km 12.5 0 120
Modal share of active and public transport in
commuting
trips 12.5 10 90
System SUBINDEX 25
Social
Convenient access to public transport service meter 12.5 20 100
Traffic fatalities per 100.000 inhabitants # fatalities 12.5 35 0
Social SUBINDEX 25
Economic
Affordability – travel costs as part of income % money 12.5 35 3.5
Investment in public transportation systems % money 12.5 0 50
Economic SUBINDEX 25
Environmental
Air quality (PM10 or PM2.5) μg/m3 12.5 150 10
Greenhouse gas emissions (CO2eq tons
capita/year)
tons 12.5 2.75 0
Environmental SUBINDEX 25
SUTI INDEX 100

• Two aggregation methods are considered arithmetic (additive) (A), or geometric (multiplicative) (B)
• Arithmetic mean assumes linear substitution
• Abandoned in HDI for this and other reasons
• Geometric mean is proposed for SUTI , but both are applied
Calculation method
(A)
(B)

Exemplification
Domain Indicators DATA (cities)
1 2 3 4 5 6 7 8
System Extent to which transport
plans cover facilities for active
modes and public transport 1 3 2 11 11 9 2 8
Modal share of active and
public transport in commuting 65 73 56 50 57 60 81 52
Social Convenient access to public
transport service 53 88 46 83 89 77 44 66
Traffic fatalities per 100.000
inhabitants 16.42 3.3 9.4 1.6 1.1 11 22 13
Economic Affordability – travel costs as
part of budget 30 28 21 7 9 18 25 18
Investment in public
transportation systems 18 12 24 45 33 35 15 32
Environmental Air quality (PM10 or PM2.5)
100 132 90 31 25 50 75 74
Greenhouse gas emissions
(CO2eq tons capita/year) 0.48 0.33 0.55 1.1 0.9 0.8 0.4 0.6

Exemplification (normalized)
Domain Indicators DATA (cities)
1 2 3 4 5 6 7 8
System Extent to which transport
plans cover facilities for active
modes and public transport 8.33 25.00 16.67 91.67 91.67 75.00 16.67 66.67
Modal share of active and
public transport in commuting 68.75 78.75 57.50 50.00 58.75 62.50 88.75 52.50
Social Convenient access to public
transport service 38.96 48.54 34.58 70.83 75.21 51.25 50.21 40.00
Traffic fatalities per 100.000
inhabitants 41.25 85.00 32.50 78.75 86.25 71.25 30.00 57.50
Economic Affordability – travel costs as
part of budget 53.09 90.57 73.14 95.43 96.86 68.57 37.14 62.86
Investment in public
transportation systems 36.00 24.00 48.00 90.00 66.00 70.00 30.00 64.00
Environmental Air quality (PM10 or PM2.5)
15.87 22.22 44.44 88.89 82.54 53.97 31.75 53.97
Greenhouse gas emissions
(CO2eq tons capita/year) 98.98
100.1
4 97.02 11.86 58.75 55.12 99.32 62.71

Results (SUB-INDEX level)
ENVIRONMENT SUB-INDEX SOCIAL SUB-INDEX
City 5 78.28 City 5 91.55
City 4 72.50 City 2 87.79
City 6 71.17 City 4 87.09
City 7 69.51 City 6 69.91
City 8 66.23 City 8 60.18
City 3 61.43 City 3 52.82
City 1 59.13 City 1 47.17
City 2 50.43 City 7 33.57

Results SUTI level
ARITHMETIC GEOMETRIC
City 4 79.97 City 5 79.54
City 5 79.83 City 4 79.53
City 6 67.95 City 6 67.86
City 8 61.24 City 8 61.18
City 2 53.30 City 3 48.56
City 3 49.39 City 2 48.00
City 7 46.67 City 7 44.14
City 1 42.69 City 1 40.86

0102030405060708090
100
Extent to which transport plans cover facilities for active modes
and public transport
Modal share of active and public transport in commuting
Convenient access to public transport service
Traffic fatalities per 100.000 inhabitants
Affordability – travel costs as part of budget
Investment in public transportation systems
Air quality (PM10 or PM2.5)
Greenhouse gas emissions (CO2eq tons capita/year)
Comparing cities all indicators
City 1 City 2 City 3 City 4 City 5 City 6 City 7 City 8

• A SUTI Index was demonstrated in principle
• Guided by overall considerations:
– Sustainable development concerns relevant to urban transport planning (including SDG 11.2 etc.)
– Methodological soundness
– Simplicity and transparency
• Results could be informative and stimulate efforts
• Key obstacles for actual application
– Data availability for most indicators
– Comparability across cities/countries for some indicators
– Same SUTI relevant for all cities/regions?
Summary

• Literature consultation was limited
• ‘Macro-selection’ of indicators was conservative
• ‘Micro-selection’ of indicators was subjective
• Data availability was not systematically reviewed
Considerations and limitations

• Proceed with development of SUTI
• Critical discussion by city experts of all aspects
• Define precise purpose and scope
• Consider using expert panels to,
– Identify candidate indicators
– Redefine and apply indicator selection criteria
– Refine index methodology
– Operate index in practice
Personal recommendations