Properties of cryogenic insulants - bnl.gov of cryogenic insulants: J. Gerhold Figure 1 Breakdown...
19
Cryogenics 38 (1998) 1063–1081 1998 Elsevier Science Ltd. All rights reserved Printed in Great Britain PII: S0011-2275(98)00094-0 0011-2275/98/$ - see front matter Properties of cryogenic insulants J. Gerhold Technische Universitat Graz, Institut fur Electrische Maschinen und Antriebestechnik, Kopernikusgasse 24, A-8010 Graz, Austria Received 27 April 1998; revised 18 June 1998 High vacuum, cold gases and liquids, and solids are the principal insulating materials for superconducting apparatus. All these insulants have been claimed to show fairly good intrinsic dielectric performance under laboratory conditions where small scale experiments in the short term range are typical. However, the insulants must be inte- grated into large scaled insulating systems which must withstand any particular stress- ing voltage seen by the actual apparatus over the full life period. Estimation of the amount of degradation needs a reliable extrapolation from small scale experimental data. The latter are reviewed in the light of new experimental data, and guidelines for extrapolation are discussed. No degradation may be seen in resistivity and permit- tivity. Dielectric losses in liquids, however, show some degradation, and breakdown as a statistical event must be scrutinized very critically. Although information for break- down strength degradation in large systems is still fragmentary, some thumb rules can be recommended for design. 1998 Elsevier Science Ltd. All rights reserved Keywords: dielectric properties; vacuum; fluids; solids; power applications; supercon- ductors The dielectric insulation design of any superconducting power apparatus must be based on the available insulators. It is mandatory to have a deep knowledge of the properties of insulants in order to meet the required withstand voltage of a system. Standardized voltages and field configurations are common practice in laboratory experiments where the stressed size and stressing time must be limited due to cost reasons. A kind of intrinsic performance can eventually be extrapolated from these experiments. However, all insulants show degradation in the labora- tory performance, where well controlled conditions can be maintained, when used in a practical application. The degradation amount in a system depends on various factors such as stressed size, stressing time, voltage shape, con- taminants, voids. System performance can only be esti- mated from the ideal performance when the particular degradation characteristics are known. Unfortunately, infor- mation about multiple stress degradation is incomplete in the low temperature domain; only tendencies for some dis- tinct degradation effects may be defined. The present paper gives a survey of the cryogenic insulator performances which have been measured under laboratory conditions around the world; degradation characteristics are discussed whenever information is available. There are three pillars for cryogenic insulants: 1. high vacuum; 2. gases and liquids; 3. solids. Cryogenics 1998 Volume 38, Number 11 1063 Of special interest for normal operation are the resis- tivity, the permittivity, and the dielectric losses. No break- down can be allowed at all in order to prevent system dam- age. Breakdown is a statistical event, and the particular withstand voltage has to be evaluated in accordance with a extremely low breakdown probability, in order to meet the needs for the definite design method 1 . Figure 1 gives a survey of the breakdown strength of various insulants being relevant in applications 2,3 . There are a sufficient num- ber of cryogenic insulators which match thermal and mech- anical performance, and which may support high voltage stress 4 . A list of papers dealing with cryogenic insulation materials and techniques can be found in a review of CIGRE WG-TF 15.06.01 5 . High vacuum insulation Vacuum technology is very common in cryogenic systems for thermal insulation. It may be near at hand to utilize vacuum as a dielectric insulation medium, and great efforts have been made in the past to establish practical vacuum- based insulation systems. No problems with thermomech- anical mismatch are involved. Application success in the field of cryogenics is limited to the medium voltage range hitherto. Current flow and breakdown in vacuum at room tempera- ture is reproduced at cryogenic temperatures at somewhat higher voltage in general 6 . An ideal vacuum gap may be assumed at first to insulate perfectly. No avalanching is
Transcript of Properties of cryogenic insulants - bnl.gov of cryogenic insulants: J. Gerhold Figure 1 Breakdown...

Cryogenics38 (1998) 1063–1081 1998 Elsevier Science Ltd. All rights reserved
Printed in Great BritainPII: S0011-2275(98)00094-0 0011-2275/98/$ - see front matter
Properties of cryogenic insulantsJ. Gerhold
Technische Universitat Graz, Institut fur Electrische Maschinen und Antriebestechnik,Kopernikusgasse 24, A-8010 Graz, Austria
Received 27 April 1998; revised 18 June 1998
High vacuum, cold gases and liquids, and solids are the principal insulating materialsfor superconducting apparatus. All these insulants have been claimed to show fairlygood intrinsic dielectric performance under laboratory conditions where small scaleexperiments in the short term range are typical. However, the insulants must be inte-grated into large scaled insulating systems which must withstand any particular stress-ing voltage seen by the actual apparatus over the full life period. Estimation of theamount of degradation needs a reliable extrapolation from small scale experimentaldata. The latter are reviewed in the light of new experimental data, and guidelines forextrapolation are discussed. No degradation may be seen in resistivity and permit-tivity. Dielectric losses in liquids, however, show some degradation, and breakdownas a statistical event must be scrutinized very critically. Although information for break-down strength degradation in large systems is still fragmentary, some thumb rulescan be recommended for design. 1998 Elsevier Science Ltd. All rights reserved
Keywords: dielectric properties; vacuum; fluids; solids; power applications; supercon-ductors
The dielectric insulation design of any superconductingpower apparatus must be based on the available insulators.It is mandatory to have a deep knowledge of the propertiesof insulants in order to meet the required withstand voltageof a system. Standardized voltages and field configurationsare common practice in laboratory experiments where thestressed size and stressing time must be limited due to costreasons. A kind of intrinsic performance can eventually beextrapolated from these experiments.
However, all insulants show degradation in the labora-tory performance, where well controlled conditions can bemaintained, when used in a practical application. Thedegradation amount in a system depends on various factorssuch as stressed size, stressing time, voltage shape, con-taminants, voids. System performance can only be esti-mated from the ideal performance when the particulardegradation characteristics are known. Unfortunately, infor-mation about multiple stress degradation is incomplete inthe low temperature domain; only tendencies for some dis-tinct degradation effects may be defined. The present papergives a survey of the cryogenic insulator performanceswhich have been measured under laboratory conditionsaround the world; degradation characteristics are discussedwhenever information is available.
There are three pillars for cryogenic insulants:
1. high vacuum;2. gases and liquids;3. solids.
Cryogenics 1998 Volume 38, Number 11 1063
Of special interest for normal operation are the resis-tivity, the permittivity, and the dielectric losses. No break-down can be allowed at all in order to prevent system dam-age. Breakdown is a statistical event, and the particularwithstand voltage has to be evaluated in accordance witha extremely low breakdown probability, in order to meetthe needs for the definite design method1. Figure 1 givesa survey of the breakdown strength of various insulantsbeing relevant in applications2,3. There are a sufficient num-ber of cryogenic insulators which match thermal and mech-anical performance, and which may support high voltagestress4. A list of papers dealing with cryogenic insulationmaterials and techniques can be found in a review ofCIGRE WG-TF 15.06.015.
High vacuum insulation
Vacuum technology is very common in cryogenic systemsfor thermal insulation. It may be near at hand to utilizevacuum as a dielectric insulation medium, and great effortshave been made in the past to establish practical vacuum-based insulation systems. No problems with thermomech-anical mismatch are involved. Application success in thefield of cryogenics is limited to the medium voltagerange hitherto.
Current flow and breakdown in vacuum at room tempera-ture is reproduced at cryogenic temperatures at somewhathigher voltage in general6. An ideal vacuum gap may beassumed at first to insulate perfectly. No avalanching is

Properties of cryogenic insulants: J. Gerhold
Figure 1 Breakdown strength of typical solid, cryogenic liquids, and vacuum insulation under d.c. voltage stress in a uniform field
possible within the stressed volume. However, electrons areemitted from a cathode surface at field strengths abovesome 107 V m−1, which may equal 108 V m−1 at local sur-face protrusions. The prebreakdown current caused by elec-tron moving across the gap with spacingd produces heatthat must be removed by the refrigerator. At a sufficientlyhigh emission level, breakdown becomes likely. This is dueto the free fall of electrons through the gap voltageV beforeimpinging on the anode. The high electron energy causessecondary emission effects. Surface conditions, therefore,are crucial for the performance of vacuum gaps. The veryfast recovery, i.e. within nanoseconds, of a vacuum gapafter breakdown should be especially emphasized7.
Prebreakdown current flow
Figure 2 illustrates the current flow across a planar vacuumgap with clean electrode surfaces vs stressing field strengthE for various electrode materials and temperatures, respect-ively. The emission current density which depends on thecathode material and surface condition of course is con-siderably lowered at cryogenic temperatures8,9. However,the amount of heat production per unit surface can easilycome up to a level which is comparable to a.c. losses in asuperconductor. These prebreakdown currents also definethe amount of ‘dielectric losses’ in case of a.c. voltagestress. Electrode surface contamination, e.g. by adsorbatelayers, can cause considerably higher prebreakdown cur-rents, which may pulsate in a statistical manner10. Prebreak-down currents also may affect surface condition with time,i.e. cause either an improving or an impairing condition-ing effect.
Breakdown
Increasing the stress results in an increasing current density.Secondary processes, e.g. photon and microparticle detach-ment2,6,7, become more and more likely since the emittedelectrons impinge on the anode with a kinetic energyaccording to the gap voltageV 5 E·d. Careful conditioningmay shift the breakdown voltage to higher levels, but thisis not very reliable in practice; memory effects in vacuum
1064 Cryogenics 1998 Volume 38, Number 11
Figure 2 Predischarge current flow in a vacuum gap vs tem-perature. ——— copper electrodes, a.c. voltage8; - - - niobiumelectrodes, d.c. voltage9
gaps are indeed a very complex phenomenon11,12. Break-down is stress dominated at low spacing, but voltage domi-nated for large spacing2. The breakdown voltageVb in auniform field gap rises approximately with the square rootof the spacing13, i.e.
Vb 5 √K·d (1)
where the constantK depends on the actual electrode sur-

Properties of cryogenic insulants: J. Gerhold
face condition, but also on the surface areaA. The storedelectrostatic energy being fed very rapidly into a beginningdischarge has been claimed to be an important parameter.HenceK~A−b, with b depending on the cathode materialand surface state14. For low temperature gaps of laboratorysize, e.g. planes of a few cm2 area,K may range within1012 and 1013 V2 m−1 in case of short term d.c. and a.c.voltage breakdown. Non-uniform field gaps yield a totalvoltage effect, as can be seen inFigure 315.
Impulse voltage stress may be even more adverse whenno conditioning is being involved; considerably lowerbreakdown voltages than with d.c. or a.c. stress are theresult11. Degradation by adsorbed gas layers on a cold elec-trode surface, e.g. in case of a leak, can be dangerous andmust be controlled. Statistical scattering of breakdown isan important fact with standard deviations as high as 25%,for instance11,16; the particular probability distributions maybe quite complex. Mixed distributions have been found insome cases, according to more than one distinct breakdowninitiating mechanism. It may also be very difficult to main-tain stable conditions in a vacuum gap over extended per-iods. Extrapolation to a very low breakdown probability inorder to define a withstand level is not very straightforward,so high safety factors must be included in practice. Residualgas molecules, for instance, may be present in any practicalvacuum system. Avalanching in an inadequate vacuum, forinstance, caused by a helium leak, is the most critical kindof degradation in cryogenic vacuum systems; there is nostabilizing effect at all, and discharge paths become very
Figure 3 Breakdown in a non-uniform field vacuum gap; a.c.voltage with copper electrodes
Cryogenics 1998 Volume 38, Number 11 1065
long with preference. Magnetic fields can have a verystrong impact in addition, as can be seen inFigure 4; thetrajectories of electrons are considerably elongated and ion-izing collisions with residual molecules become morelikely. This effect must be taken into account with super-conducting magnets where very high magnetic fields arequite usual1,17. Figure 5 illustrates the breakdown courseschematically.
According to all these adverse environmental conditionsthere is little chance to reliably withstand much more than100 kV as a safe engineering limit in a single low tempera-ture vacuum gap.
Cryogenic fluids
Helium and nitrogen are excellent insulating fluids forclassical low critical temperature superconductors (LTS)and high critical temperature superconductors (HTS),respectively. Almost no problems with thermomechanicalmismatch are involved. Many insulation systems in LTSapplications are based on helium 4, either in its liquid state,in its supercritical state, or simply using the cold gas. Gase-ous or liquid nitrogen, respectively, will be used in futureHTS applications. Neon may eventually find some interestfor HTS machines provided supply can be guaranteed at areasonable price. Dielectric data for neon are scarce atpresent, and the performance can only be predicted in termsof analogy3.
All these fluids are self healing after discharge occur-rence in so far as the respective atoms and molecules arechemically inactive. Moreover, a complete fluid exchangemay often take place, e.g. in a cooling circuit where thefluid is completely reprocessed. Genuine fluid memoryeffects thus are not relevant in most applications, and nohazardous byproducts can be produced by discharges outof the fluid. However, a discharge may cause irreversibledamage to adjacent electrodes and solid insulators, respect-ively.
Current flow
The fluids are normally free from charge carriers. Leakagecurrents can be caused only by ionizing radiation, whichmay be reduced inside a cryostat. Non self-maintained dis-charge current densities are below 10−9 A m−2. Extremelyhigh resistivity values have been found in the liquids, e.g. >1016 V m−1 in liquid helium. Leakage currents are oftennot detectable unless charge carriers are emitted from theelectrodes; this needs a high local field strength of morethan 108 V m−1.
Permittivity
The molecules of cryogenic fluids are non-polar. The Clau-sius-Mosotti formula can be used in order to evaluate therelative permittivity er for any particular thermodynamicstate3. Data for the molecular polarizability to the permit-tivity of space ratio,ai/3eo, which does not depend on thefluid state, are indicated inTable 1. Relative permittivitiesin the gaseous state are very close to unity. In the liquidstate, however, the fluid density number becomes extremelylarge. There is a strong correlation between the liquid per-mittivity erL and the normal boiling temperatureTnbp; thisis because the internal Van der Waals forces which are

Properties of cryogenic insulants: J. Gerhold
Figure 4 Electron motion in uniform electric field E in a perpendicular magnetic field B
Figure 5 Conceptual characteristics of vacuum breakdownvoltage vs magnetic field
Table 1 Polarizability and permittivity of crogenic fluids
Fluid ai/3e0 (m3) erL Tnbp (K)
Helium 8.6 10−31 1.05 4.2Neon 16 10−31 1.19 27.2Nitrogen 72.5 10−31 1.44 77.3
responsible for condensation are due to fluctuating dipolemoments3. This also can be seen inTable 1. The permit-tivity is an almost ideal intrinsic fluid parameter.
Liquids may be inhomogeneous when bubbles arepresent. Any stressing electrical field is enhanced withinthe bubble from its bulk value by an order oferL/1. Thiseffect must be born in mind, especially since vaporizationis easy in cryogenic liquids. A moderate field distortion alsois caused by frozen foreign gas particles. Accommodationwith solids is difficult due to the much higher permittivityof the latter, i.e. two up to more than five. Thus, solid con-taminants such as dust particles can result in a serious localfield enhancement. These particles are pulled to high stresspoints by dielectrophoretic forces, and can initiate dis-charges there.
1066 Cryogenics 1998 Volume 38, Number 11
Dielectric losses
Dielectric losses may be expected to be extremely low atpower frequencies. Dielectric absorption is not relevantthen. In fact, no losses could ever be found in any cold gas.However, surprisingly high losses have been measured inthe liquids, even at power frequencies.Figure 6 gives asurvey about the loss order of magnitude in liquid nitrogenand liquid helium, respectively18,19. Losses have been foundto vary with time. The loss level cannot be taken as anintrinsic liquid property thus. Predischarges have beenclaimed sometimes to be the origin of losses, but these canbe excluded definitely in liquid nitrogen for instance. The
Figure 6 Dielectric losses in liquids near the normal boilingpoint at power frequency: 1, 2, 3 5 liquid nitrogen18; 4 5liquid helium19

Properties of cryogenic insulants: J. Gerhold
most probable loss source may be foreign impurity par-ticles, or electrode-adjacent phenomena which show a dis-tinct memory effect18. However, the liquid nitrogen losslevel ranging in between curve 1 and 2, for instance, maybe quite compatible with the needs for a low loss dielectricsystem at 80 K operating temperature.
Dielectric strength
Discharge onset begins when the rate at which free elec-trons are produced exceeds the rate of removing them sub-stantially. An exponentially growing avalanche up to a con-ducting path, i.e. a streamer, then is formed which finallymay turn into an arc. Such a catastrophic event has to beprevented safely by a proper design.
Gas breakdown
Breakdown in uncontaminated gases at a not too high stressis a near-intrinsic function of the gas state.Figure 7 showsthe nitrogen Paschen curve, i.e. the breakdown voltageVb
versus the density number times spacing productNvd20,21.Scattering right of the Paschen minimum and in the farbreakdown region right of it is extremely low, and no sizeeffect normally is involved. The Paschen curve for neon asa monatomic noble gas is included for comparison3; a dis-tinct shift against the nitrogen Paschen curve is obvious.The former wide scattering range of helium gas break-down21 has been considerably confined for the far rightregion down to the Paschen minimum by very careful newexperiments22, seeFigure 8.
The formative breakdown time lags may range below 1ms20. The excess of pulse breakdown over the static break-down voltage, which is a statistical phenomenon in timesince there is a statistical time lag, is utilized with benefitin air via the so called impulse factor in the statisticaldesign method. However, superconducting apparatusshould be designed by the definite design method1. Hencethe breakdown probability must be close to zero, and noimpulse factor related to the statistical time lag should beused.
To break down a gas, the stressing fieldE must intersecta critical number of gas molecules. Electron multiplication
Figure 7 Paschen curve for nitrogen and neon
Cryogenics 1998 Volume 38, Number 11 1067
along the gap lengthd must reach a critical amountk ofthe order of unity in helium, and of 107 in nitrogen, respect-ively. Breakdown initiation thus can be formulated as23
expH Ed
x 5 0
a[x]·dxJ 5 k (2)
wherea[x] is the first Townsend ionization coefficient; itdepends strongly on the field strength courseE[x] withinthe gap. None of the cryogenic gases is electron attaching.This simple equation relates to the far right part of thePaschen curve. The gas temperature has practically noinfluence on breakdown24,25. The amount of impact ioniz-ationa is correlated with the density number and the ioniz-ation voltage of the particular gas. This can be written asa·N−1
v 5 fhVi,E·N−1v j. Figure 9 indicates the respective
characteristics.
Uniform field breakdown. Equation (2) reads simplyexp(a·d) 5 k in a uniform field whereE 5 constant acrossthe gap. This implies a constanta-value. The generalPaschen law claims that the breakdown voltageVb, is apure and monovalent function of the density number timesspacing product,Nv·d, for any particular gas21. Hence
Vb 5 f hNv·dj (3)
This has already been illustrated inFigures 7 and 8.Helium and neon as monatomic noble gases are the weakestof all gaseous insulators at a corresponding density number,and the relative electrical strength (RES) at ambient con-ditions of helium (RES5 1/12) and neon (RES5 1/4) islow in comparison with air. Nitrogen gas on the other handshows an RES of almost unity21,26. The correctness of Equ-ation (3) in the cryogenic temperature domain has beenconfirmed experimentally in nitrogen and helium, respect-ively, by many workers in the field. Cooling down to thesaturated vapour density yields a quite similar vapourstrength for nitrogen and helium far right of the Paschenminimum, seeFigure 10. The different amount in concen-tration is almost offset by the different ionization amount24.

Properties of cryogenic insulants: J. Gerhold
Figure 8 Paschen curve for4 helium. - - - boundaries of CIGRE Paschen curve scattering; ——— fit curve for ambient temperatureand low temperature data; I discharges in semivacuum at low temperature; s discharges in semivacuum at ambient temperature
Figure 9 Impact ionization, a/Nv, vs the density number to field strength ratio, Nv/E, in nitrogen, neon, and helium gas
Hence, a cold vapour will show a reasonable dielectricstrength. Neon may be not so a favourable candidate forcryogenic dielectric insulation, since its extrapolated vap-our strength remains considerably below the nitrogen andhelium level. No experimental low temperature breakdowndata, however, are known for neon gas.
Breakdown voltages remain below the Paschen level ifthe field strength at the cathode exceeds 107 V m−1. Thisis typical for high gas densities which come out automati-cally when cooling down a pressurized gas to low tempera-ture. Additional electron emission or micro-gas dischargesmay be responsible21. The effect is well known in variousgases at ambient temperature.Figure 11shows the generaltrend in cold helium gas. Breakdown then is not an intrinsicgas parameter at high stress. Increasing statistical scatteringalso must be encountered. Of course, actual electrode sur-face quality becomes an important an extrinsic parameter.
A significant breakdown voltage reincrease occurs forvery low density numbers in the near breakdown domain,i.e. left of the Paschen minimum where the electrons cannot
1068 Cryogenics 1998 Volume 38, Number 11
be ‘thermalized’. This regime provides a steady transitionto vacuum breakdown; it is called a ‘semivacuum’ now andthen, as having already been indicated inFigure 7. It mustbe pointed out that any transition from vacuum via the farleft Paschen curve, e.g. in cases of a leak into a voltagestressed vacuum space, has been claimed to become adangerous scenario for superconducting magnets. Thebreakdown then follows with preference the largest dis-charge path within the stressed vacuum chamber; any pre-diction of a withstand voltage may be arbitrary22,27. Experi-ments in this domain normally reveal a very large scatteringof data; the semivacuum range should be avoided in anypractical insulation system. Strong magnetic fields mayshift the low Paschen minimum voltage region considerablyto the left1 unless special geometrical configurations areused17.
Non-uniform field discharges. Discharges in astrongly non-uniform field must not end directly in break-down, but often yield a stable current flow, i.e. a corona.

Properties of cryogenic insulants: J. Gerhold
Figure 10 Breakdown voltage, Vb, vs spacing in nitrogen, neon, and helium vapour close to the normal boiling point
Figure 11 High stress breakdown in cold helium gas. ———Paschen curve; high stress breakdown at constant spac-ing
High stress points normally are shielded by ions whichform a space charge at a not too low density number. Nitro-gen, neon and helium are non-attaching gases, i.e. electronscannot be caught easily by the molecules. However, nega-tive ions of limited lifetime can occur, and negative ionclouds can shield high stress regions in a non-uniform gap,for instance a point electrode. Helium on the other handbuilds up no negative ions at all, and negative space chargeshielding normally is impossible.
Cryogenics 1998 Volume 38, Number 11 1069
The current flow caused by ion moving produces coronalosses which heat up the stressed gas and decrease the localgas density; gas thinning may be moderate at ambient tem-perature since heat diffusion is very effective. Thinning ofthe surrounding gas is much more severe at low tempera-tures since heat diffusion is weak, and the corona lossesmust be cooled by a refrigerator. Thus, corona must beeliminated in normal operation; it may be tolerable to someextent, i.e. with a safe limit against breakdown, in case oftransient overvoltages, or in case of a quench in a supercon-ducting apparatus. Corona onset can be calculated in gen-eral from Equation (2) with the ionization parameterahxjfound in accordance to the local field strength courseEhxj;k may be derived from uniform field breakdown data.Fig-ure 12 illustrates measured divergent field corona andbreakdown in cold helium gas, andFigure 13 in gas nitro-gen gas, respectively23,28. A higher gas density leads tohigher voltages. However, corona onset voltagesVc oftenshow a distinct saturation for larger gap lengths. The break-down voltages increase regularly with gap length when thepoint is positive. In case of a negative point, a delayedincrease is found in a near-saturated vapour. This effectmay be attributed to electron trapping. Little is knownabout low temperature breakdown statistics.
Liquid breakdown
The dielectric strength of liquids is never a pure materialsfunction. Any ‘intrinsic strength’ is fictitious in the strongsense. However, it can be taken as a kind of asymptoticapproximation. Breakdown or discharge voltages can onlybe measured as a function of the overall electrode/liquidsystem; extrinsic parameters have an important effect, andstatistical scattering can be considerable. These phenomenaare quite similar to any other insulating liquid29.
Quoted strength. The quoted breakdown strengthEb
usually is defined by the almost uniform field breakdownvoltage to gap length ratio,Vb/d. Very high quoted break-down fields (d.c. or a.c. voltage) of the order of 40–100MV/m in non-boiling liquid helium, and 70 up to > 200MV/m in non-boiling liquid nitrogen, have been claimedin the mid seventies to be typical under well controlled

Properties of cryogenic insulants: J. Gerhold
Figure 12 Corona onset voltage, Vc, and sparking voltage, Vb, in a point to plane gap; gaseous helium. (a) Nv 5 2.0 1026 m−3 at 40K; point negative. (b) Nv 5 2.7 1027 m−3 at 4.2 K; point negative. (c) Nv 5 2.0 1026 m−3 at 40 K; point positive. (d) Nv 5 2.7 1027 m−3
at 4.2 K; point positive
laboratory conditions29,33. Liquid neon data are very scarce;a quite similar strength of almost 70 MV/m has been meas-ured at 100mm spacing, however30. All these high strengthvalues can only be found as short term breakdown at lowspacing and with small-scaled polished electrodes. Anysevere degradation has to be prevented in order to guaranteea high strength level at d.c. or a.c. stress: careful filteringout of field distorting particles should be provided forinstance. The liquids must not be accepted with the arbi-trary ‘technical purity’ from the supplier. However, thequoted strength takes no account for any size effect, i.e. thestressed liquid volume and stressed electrode area, respect-ively. The stressing time also can have a significant influ-ence.
Commercial liquids. A pure liquid without any degra-dation may be a fiction in practical applications. Breakdownunder technical conditions is weak-link dominated in a stat-istical sense. Near-uniform field short term breakdown volt-ages close to the normal boiling point may be estimatedfrom31
Vb 5 C·d0.8 (4)
where C 5 21.5 kV mm−0.8 for ‘technical grade’ liquidhelium, and 29 kV mm−0.8 for ‘technical grade’ liquid nitro-gen, respectively. This engineering formula relates to thestatistical mean breakdown voltage and indicates onlyorders of magnitude.
Size effect. The inherent size effect must be taken intoaccount. Increasing the stressed size, i.e. the number of
1070 Cryogenics 1998 Volume 38, Number 11
stressed unit cells, increases the probability for the occur-rence of active sites for streamer initiation. A quite simpleengineering order of magnitude estimation may relyonto31,35–37
Eb1 5 Eb2·SS1
S2D−1/m
(5)
(Eb1: mean breakdown field strength with stressed sizeS1,i.e. N1 stressed unit cells;Eb2: mean breakdown fieldstrength with stressed sizeS2, i.e. N2 stressed unit cells).The exponent 1/mcan be evaluated from the experimentallyfound relative standard deviationsv, according to Weibull35,seeFigure 14. Standard deviations up to 20% have beenfound often, but less than 10% may be taken as an upperlimit in larger gap systems. The occurrence of a size effectmust be anticipated, according to many experimental find-ings.
Prediction of the size effect by means of statistical datafrom small scaled experiments seems to be enticing. Adetailed statistical evaluation could be carried out recentlyfor short term liquid helium breakdown37. The total gapvoltage in a moderately non-uniform field gap configurationas given by the field strength courseE(x), i.e. V 5
ed
oE(x)dx, causes a maximum breakdown stressEb at the
electrode surface. This allowable maximum stress is relatedto the stressed size via Equation (5); a stressed regionwhere the field strength exceeds< 80% of the nominalfield strengthEb seems to be relevant. Unfortunately, nodistinct correlation between statistics and size effect could

Properties of cryogenic insulants: J. Gerhold
Figure 13 Corona onset voltage, Vc, and sparking voltage, Vb, in a point to plane gap; gaseous nitrogen at 78 K. (a) Nv 5 2.3 1025
m−3; point negative. (b) Nv 5 9.1 1025 m−3; point negative. (c) Nv 5 2.3 1025 m−3; point positive. (d) Nv 5 9.1 1025 m−3; point positive
Figure 14 Size effect parameter, 1/m, vs relative standard deviation, sv
be defined in case of d.c. or a.c. stress, respectively. How-ever, the occurrence of a genuine area effect has been madeobvious in case ofms pulse voltage stress in liquid helium.This area effect coincides well with the fitted Weibull prob-ability distribution38. It seems that no activation of initiatingsites in the bulk liquid can take place in a very short time.
Data for short term a.c. voltage breakdown in ‘technicalgrade’ liquid nitrogen are somewhat non-uniform. Standard
Cryogenics 1998 Volume 38, Number 11 1071
deviations of the order of 10–25% have been communi-cated in small sized gaps39; the mean breakdown stressbeing surprisingly low, i.e. 11 kV/mm (rms), which maybe partly due to vapour bubble occurrence in the stressedregion. Lower standard deviations of the order of 11% onthe other hand have been measured at the normal boilingpoint with a mean breakdown stress of 20 kV/mm at 50cm2 stressed area, but only 7% at 0.2 MPa pressure with

Properties of cryogenic insulants: J. Gerhold
Figure 15 Volume effect in liquid helium breakdown. ——— fit from ref. 36; - - - data from ref. 31; $ near zero breakdown probabilityestimation from ref. 37
45 kV/mm40; the related exponent 1/m in Equation (5) thenmay be of an order of 0.1 and 0.05, respectively. A largerstandard deviation of< 20% has been found in some otherexperiments carried out in a normal boiling liquid nitrogenfilled coaxial gap of 1 mm spacing and almost 80 cm2
stressed area; the mean rms breakdown voltage then wasof the order of 20 kV41. These data suggest a surprisinglylarge exponent 1/m close to 0.2. More recent breakdownexperiments in boiling liquid nitrogen finally yielded a 1/mfigure decreasing with size from 0.1 down to 0.07 for anaverage rms breakdown strength ranging in between 17down to 12 kV/mm42.
However, there may be some general objection againsta statistical evaluation of the size effect. Any experimentalbreakdown statistics can only overlap a limited probabilityinterval of course; test expenditure would be excessiveotherwise. The usual fitting procedures—although oftenvery sophisticated—can give no proof that the evaluatedprobability function is the full truth at all; all fits yield amost likely approximation. Thus, a more satisfying engin-eering approach may be to rely onto directly measured sizeeffect characteristics.Figure 15 indicates d.c. breakdownin liquid helium vs the stressed volumev as the relevant
Figure 16 Breakdown strength–time characteristics at power frequency in a coaxial cylindrical electrode system; spacing 4.5 mm,cylinder [ 42.5 mm, cylinder length 100 mm
1072 Cryogenics 1998 Volume 38, Number 11
size parameter; the volume was claimed to result in a betterapproximation to experimental data in non-boiling liquidthan the stressed electrode area36. The volume effectexponent 1/m in Equation (5) was found close to 0.1; avery similar figure covers breakdown data in supercriticalhelium36, and also fits well to a.c. breakdown data31. Theremay be a parallel shift of stress downwards to 1/3 in caseof adverse cathode conditions, e.g. surface roughness > 10mm32,34. Extremely low d.c. voltage breakdown valueswhich are hard to believe in have been communicatedrecently for liquid helium43. However, no electrode surfacespecification is specified.
A somewhat higher volume effect slope with 1/m < 0.14for a.c. voltage breakdown in saturated liquid nitrogen hasbeen communicated in Okuboet al.31. This figure is withinthe range having already been estimated from the data inother work39–41.
Some authors still insist that the stressed electrode area isthe breakdown controlling parameter instead of the stressedvolume38,40,44. Although this idea may be correct in uncon-taminated liquids under well controlled experimental con-ditions, it neglects any direct spacing effect; the latter iscommonly accepted in insulating liquids. The spacing

Properties of cryogenic insulants: J. Gerhold
Figure 17 Mutual interference of breakdown field strength and statistical time lag in near-saturated liquid helium
effect can be understood by interference with the stressedliquid volume. A mutual interaction of area and volumeeffect, respectively, may be the most probable overallmechanism. It has been made obvious in a.c. voltage break-down of boiling liquid nitrogen45. Breakdown then waspartly attributed to bubbles occurring within the stressedgap.
Great caution must be applied in general when makingany extrapolation out of the range being directly coveredby experiments in order to define a withstand voltage inthe definite design method, according to all these uncer-tainties. A near-zero breakdown probability must be esti-mated for the definite design method. In non-boiling liquidhelium with smooth electrodes for instance, a volume effectcharacteristics with 1/m < 0.05 has been recommendedrecently37; this almost zero breakdown probability seems infact to remain below almost any known breakdown data.The corresponding characteristics is indicated inFigure 15.A competing evaluation for liquid nitrogen should be car-ried out very soon, in order to meet the needs for designingfuture HTS system insulation.
Long term degradation. Weak link activation also is atime dependent phenomenon. In fact, liquid breakdown
Figure 18 Contour plot of uniform field d.c. breakdown voltages in helium; 1 mm gap, stressed area 28 cm2
Cryogenics 1998 Volume 38, Number 11 1073
cannot be given in terms of gap configuration and stressedsize without referring to the stressing timet46. Only fewmedium term (up to one hour) a.c. breakdown data in nor-mal boiling liquid helium and liquid nitrogen, respectively,are available and can give an impression about the possibletendency. These characteristics are shown inFigure 1631,and suggest the usual life equation46
Ebhtj·t1/n 5 constant (6)
Whether the long term degradation is due to any memoryeffects of the electrode–liquid system, or is merely a stat-istical phenomenon, cannot be decided yet. In any way,chemical reactions on electrode surfaces may occur18.
Very limited information about the simultaneous degra-dation in size and stressing time is known. Pulse voltagebreakdown experiments in thems range, both in normalboiling liquid helium I38 and saturated superfluid heliumII44, revealed no memory effect at all; the data fairly wellfitting into Laue plots46. Some idea about the mutual inter-action can be get fromFigure 17. The breakdown fieldstrength depends on the stressed area times the mean stat-istical time lag, which can be explained in a consistent man-ner by means of the probability for the occurrence of initiat-

Properties of cryogenic insulants: J. Gerhold
Figure 19 Uniform field d.c. breakdown strength of saturated LHe II near 2.0 K vs spacing. (1) dia. 25 mm stainless steel spheres45;(2) [ 9.5 mm aluminum sphere-to-stainless steel plane49
ing electron emission from the cathode. The data may beused to evaluate the withstand voltage in a particular gapconfiguration by introducing the pulse duration as the rel-evant time lag. The pulse withstand voltages are consider-ably higher compared to the corresponding d.c. or a.c. volt-age level. An appropriate safety margin must beincorporated however: the statistical time lags are groupedaround the mean time lag following a Weibull distributionfunction. An almost zero breakdown probability onlycomes out when the pulse duration is below the formativetime lag of course.
Pressurized liquids. Liquid pressure allows a wide vari-ation of thermodynamic states, and has a strong impact onbreakdown. The steady transition from gas breakdown toliquid and supercritical liquid breakdown has especiallybeen investigated in gaseous, liquid and supercriticalhelium, due to practical needs for data, but also since thesestates could be easily maintained in the experiments34. Fig-ure 18 shows an iso-breakdown voltage diagram versushelium pressure and density number, which has originally
Figure 20 Normalized breakdown strength, Ebp/Eb0, vs liquid nitrogen pressure
1074 Cryogenics 1998 Volume 38, Number 11
presented by Meats47 for carefully controlled experimentalconditions. However, liquid helium II has become of spe-cial interest due to its fascinating cooling performance. Thenear-saturated liquid can be assumed with a uniform fieldbreakdown strength in the liquid helium I range34,44,48,49, ascan be seen inFigure 19; the saturated vapour bubblestrength however may be lower by an order of magnitude34.A high pressure can yield a considerable higher strength:up to two times the strength as being indicated inFigure19 has been found at 0.1 MPa for instance44. Considerablylower pressurized LHe II breakdown values, i.e. an orderof only 10 kV/mm at almost ambient pressure, have beencommunicated in reference43.
There is no corresponding diagram for liquid nitrogen,but the general trend of the near uniform field breakdownstrength increase with increasing pressurep is illustrated inFigure 2045. A kind of saturation can be observed. Of spe-cial interest may be the initial slope of the relative break-down field strength against the pressure rise
∂S EbhpjEbh0.1 MPajD/∂p just around 0.1 MPa, versus the
Properties of cryogenic insulants: J. Gerhold
Figure 21 Initial slope of Ebp/Eb0 vs stressed liquid nitrogen vol-ume
stressed volumev, as shown inFigure 21. Volume effectdegradation may be offset to some extent when relying ontoa high pressure in liquid nitrogen.
Non-uniform field breakdown. Highly non-uniformfields are not very favourable to withstand high voltages incryogenic liquids. Point electrode gap configurations shouldbe suppressed at best in practice. For a point to plane con-figuration (spacingd in mm; Vb in kV)
Vb 5 7d0.4 (7)
has been found to indicate breakdown in normal boilingliquid helium. In case of normal boiling liquid nitrogenthe relation
Vb 5 18d0.26 (8)
may be used3. These formulas may be relevant up tod , 10
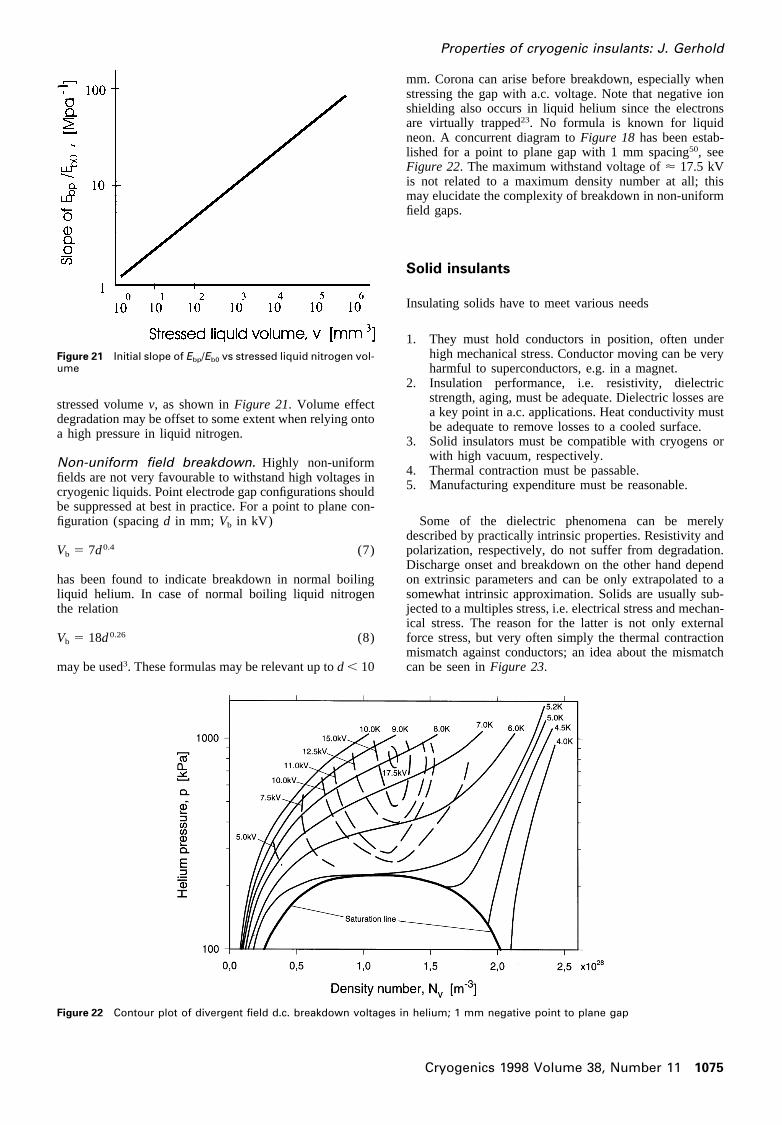
Figure 22 Contour plot of divergent field d.c. breakdown voltages in helium; 1 mm negative point to plane gap
Cryogenics 1998 Volume 38, Number 11 1075
mm. Corona can arise before breakdown, especially whenstressing the gap with a.c. voltage. Note that negative ionshielding also occurs in liquid helium since the electronsare virtually trapped23. No formula is known for liquidneon. A concurrent diagram toFigure 18 has been estab-lished for a point to plane gap with 1 mm spacing50, seeFigure 22. The maximum withstand voltage of< 17.5 kVis not related to a maximum density number at all; thismay elucidate the complexity of breakdown in non-uniformfield gaps.
Solid insulants
Insulating solids have to meet various needs
1. They must hold conductors in position, often underhigh mechanical stress. Conductor moving can be veryharmful to superconductors, e.g. in a magnet.
2. Insulation performance, i.e. resistivity, dielectricstrength, aging, must be adequate. Dielectric losses area key point in a.c. applications. Heat conductivity mustbe adequate to remove losses to a cooled surface.
3. Solid insulators must be compatible with cryogens orwith high vacuum, respectively.
4. Thermal contraction must be passable.5. Manufacturing expenditure must be reasonable.
Some of the dielectric phenomena can be merelydescribed by practically intrinsic properties. Resistivity andpolarization, respectively, do not suffer from degradation.Discharge onset and breakdown on the other hand dependon extrinsic parameters and can be only extrapolated to asomewhat intrinsic approximation. Solids are usually sub-jected to a multiples stress, i.e. electrical stress and mechan-ical stress. The reason for the latter is not only externalforce stress, but very often simply the thermal contractionmismatch against conductors; an idea about the mismatchcan be seen inFigure 23.

Properties of cryogenic insulants: J. Gerhold
Figure 23 Thermal contraction domains of various solids
Resistivity
Although no net free charges do exist in an ideal insulator,some ions or electrons may move across an imperfect lat-tice. The corresponding conduction currents often decreasedrastically at low temperatures, e.g. with exp(2 b/T)where b is a materials constant andT the temperature51.The currents decrease with time in general. This indicatesa kind of long term polarization.
A high electrical stress may inject additional electrons.An exponential current/voltage relationship often is foundat ambient temperature. Space charges can build up in thesolid, thereby modifying the internal stress considerably.Very little is known in general about resistivity and spacecharge build-up at cryogenic temperatures.Figure 24, how-ever, indicates the course of resistivityr vs temperature fora polyester varnish52. Similar orders have been communi-cated for glass fibre reinforced epoxies for instance. How-ever,r > 10 18 V m has often been claimed for temperatures
Figure 24 Resistivity of polyester varnish vs temperature
1076 Cryogenics 1998 Volume 38, Number 11
, 50 K. In fact, such a high resistivity is hard to be meas-ured. Nevertheless, this does not mean that charge movingis completely out of question. The situation is analogous toa superconducting wire where a critical current has to bedefined by a resistivity criterion for instance, without a dis-tinct limit for genuine superconductivity. Therefore, longterm space charge build-up in a cold insulator cannot beexcluded completely, and degradation or aging must beencountered with d.c. application. Time constantstr 5 eo
er r can be extremely long, which can result in quiteunusual voltage gradients. These phenomena can result inlong term failure of a solid insulator.
Surface conduction, which often gives rise to severeproblems at ambient temperature, is of less concern in thecryogenic domain. The causal humidity traces are com-pletely frozen, and ions are immobilized. However, longterm d.c. stress may again accumulate surface chargeswhich can affect the original surface voltage gradient con-siderably. This impairs surface flashover for instance.

Properties of cryogenic insulants: J. Gerhold
Figure 25 Principal course of complex permittivity (a, b); relax-ation time constant is scattered around a central value with adistribution as shown by the shaded area at the bottom (c)
Impurity particles in a cryogen may be the primary sourcefor charge accumulation
Permittivity and dielectric losses
Movement of bound charges in a solid insulator is restric-ted. Polarization is the net outcome of the charge displace-ments when an external field is switched on. A relativemovement of electrons and nuclei of atoms occurs in all
Figure 26 Dielectric loss factor (a), and mechanical loss factor (b), in epoxy (Cy221/Hy979)
Cryogenics 1998 Volume 38, Number 11 1077
materials. It is an atomic phenomenon and not influencedby the temperature at all. A relative permittivity of abouttwo is typical for this mechanism. A ionic or partly ioniccrystal may show an additional displacement moving ofpositive and negative ions. Again, temperature often is oflittle concern. The permittivity range is near five or more.A lot of ceramics belong in this class. Various commonplastic materials embody in addition dipolar groups whichare turned under electrical stress as a special kind of polar-ization. Thermal agitation impedes turning, so this polariz-ation increases with the reciprocal of temperature unless aglass–rubber transition freezes the dipoles. Permittivitymay be high when polar dipoles are involved. However,there is a strong influence of frequencyf51.
Permittivity and dielectric loss characteristics ofmaterials are usually described by means of a complex per-mittivity er 5 er9 2 jer0. The dielectric dissipation factor isdefined by tand 5 er0/er9. Dipolar polarization incorporatesa relaxation time constantte which may increase consider-ably at low temperature. The imaginary parter9 shows asharp maximum just around 2pf·te 5 1 in simple materialswith only one distinct dipole type. Most solid insulators arecomposed of various dipolar groups in contrast to this.Hence an extended time constant spectrum must be sus-pected, and the complex permittivity course is considerablywidened around the maximum region51. This is sche-matically illustrated inFigure 25.
A correlation between dielectric losses and mechanicaldamping has been made evident by the way53. This is illus-trated for an epoxy inFigure 26. Figure 27 illustrates thetypical course of the dielectric loss number vs temperaturein a partly polar dielectric which has been used for bushinginsulators, for instance54; the dielectric losses are pro-portional to the dielectric loss numberer·tand. The charac-teristics of some other materials can be found inFigures28and2952. The mutual interactions in practical solid insul-ants becomes evident, and the relaxation time constantspectrum may be rather complex. A survey chart formaterials of special interest in cryogenics is given inFig-ures 30and 3152.
The dielectric losses which rise with the square of the

Properties of cryogenic insulants: J. Gerhold
Figure 27 Relative permittivity and dielectric loss number of PERTINAX 100R at power frequency vs temperature. - - - relative permit-tivity er; ——— loss number ertand
Figure 28 Relative permittivity and dielectric loss number atpower frequency vs temperature in dry Kraft paper. - - - relativepermittivity er; ——— loss number ertand
stressing voltage have to be removed out of the solid byheat conduction. A thermal instability can even arise atcryogenic temperatures where heat conductivity often isextremely low. The losses may increase when a temperaturerise starts, and a final heat breakdown could occur in a thickinsulator with a high stressing voltage.
Not only bulk insulators, but also tape materials may beof special interest for a.c. voltage insulation systems.Table2 lists materials which have been investigated for use insuperconducting a.c. power cables55.
1078 Cryogenics 1998 Volume 38, Number 11
Figure 29 Relative permittivity and dielectric loss number atpower frequency vs temperature in various polymers. - - - rela-tive permittivity er; ——— loss number ertand; (a) polyimide; (b)polypropylene; (c) polytetrafluorethylene
Breakdown
A discharge-free arrangement is the first prerequisite whensearching for near intrinsic dielectric breakdown, eventhough a true intrinsic strength has been questioned. Stresslevel as well as stress duration have a significant influ-ence50. As an order of magnitude, some 100 kV mm−1 canbe assumed for most insulators for the intrinsic strength.This is considerably higher than in cryogenic liquids. Tem-perature has limited effect between 300 K and 4 K unless

Properties of cryogenic insulants: J. Gerhold
Figure 30 Permittivity and dielectric loss number of various solid insulators at 50 Hz; temperature 4.2 K
Figure 31 Permittivity and dielectric loss number of various solid insulators at 50 Hz; temperature 80 K
Table 2 Properties of various insulators55
Temperature 293 K Temperature 77 K Temperature 4.2 K
Elastic Yield Elastic Yield Elastic Yield ContractionGeneric tand tand tander modulus strength modulus strength modulus strength from 293 Kmaterial (mrad) (mrad) (mrad)(Mpa) (Mpa) (Mpa) (Mpa) (Mpa) (Mpa) (%)
Low density 2.3 200 93 2.1 25 3700 100 15 5500 150 2.7polyethyleneOriented 2.3 100 890 3.9 30 3900 93 20 4200 125 1.7polyethyleneBiaxiallyoriented 2.3 200 1900 22 50 1500 180 21 1400 210 0.6polypropylenePolysulphone 3.1 800 1900 40 2400 67 60 4500 110 1.2Polycarbonate 3.0 2100 2150 37 3400 93 55 4100 170 0.5Polyethylene- 3.1 2000 5000 65 800 9300 170 200 10 000 190 1.2terephthalatePolyimide 3.1 1700 2900 44 600 4900 110 90 5500 155 0.9
Cryogenics 1998 Volume 38, Number 11 1079

Properties of cryogenic insulants: J. Gerhold
Figure 32 Intrinsic dc breakdown field strength of polymers vs temperature. (1) Low-density polyethylene; (2) ethylene-propylenerubber
a glass–rubber transition occurs.Figure 32shows the mea-sured breakdown strength characteristics for two polymerfilms56. Although near intrinsic breakdown is of course astatistical phenomenon, no detailed information is availablein the cryogenic domain for the size/long term effectdegradation.
Almost one order of magnitude in degradation of bulksolids must be accepted in practice, see for instanceFigure1. The withstand strength of some not fully matching solidinsulators may in fact be lower than that of liquids. Selectedpolymers may be classified on the other hand as a kind ofcryogenic ‘Super Electrical Insulants’ (SEI) for reasons ofthe very exciting performance under ideal environmentalconditions57. Extruded Polyethylene and Ethylene Propy-lene Rubber are top candidates at present.
External effects can be harmful in any way. Breakdownstrength in solids suffers considerably from environmentaldegradation. There are a lot of imperfections in practice.Interface phenomena, for instance, are especially crucialwhen local high stress points occur where a cryogenic fluid,or a vacuum insulant, is overstressed and partial dischargesoccur. Treeing in polymers also occurs at cryogenic tem-peratures, but tree starting voltages may be considerablyhigher than at ambient temperature57. Internal voids as wellas electrode adjacent voids are another source for degra-dation. Apart from manufacturing defects, cracking duringcooldown must be envisaged with bulk solids. Glass fibrereinforced epoxies are a well known example. There is noself healing of damaged solids at cryogenic temperatures,so any discharges must be eliminated in normal operation.Partial discharges cause aging of the solid, which often hasbeen found more distinct than at ambient temperatures; theexponent 1/n in the life Equation (6) possibly ranging downto 1/10058. Thus, even short term high stress in course ofa temporary overvoltage can be dangerous, and can affectthe lifetime of a cryogenic insulating system considerably,especially when using polymers. No detectable partial dis-charges may be allowed in normal operation. Only shortpulse overvoltages leading to partial discharges may be tol-erable; pulse breakdown withstand voltages in general aremuch higher than long term withstand voltages.
1080 Cryogenics 1998 Volume 38, Number 11
Conclusions
A broad variety of insulating materials is available in thecryogenic temperature domain. All these insulants showfairly good intrinsic properties, i.e. may perform very wellunder carefully controlled laboratory test conditions insmall scale, short term experiments. However, supercon-ducting power apparatus are rather large and must have ausual life of an order of 30 years. Hence, the insulant per-formance must be extrapolated to large dimensions andlong term stress in order to define conditions for a nearzero failure probability. Although knowledge about extra-polation often is still fragmentary, some matching thumb-rules may be established to come to a satisfying withstandvoltage estimation without being forced to introduceexcessive safety factors.
References
1. Hara, M. and Gerhold, J., Electrical insulation specification anddesign method for superconducting power equipment.Cryogenics,1998,38, this issue.
2. Trump, J. G., Insulation strength of high-pressure gases and of vac-uum. InDielectric Materials and their Applications, ed. A. von Hip-pel. The MIT Press, Cambridge, MA, 1954, pp. 147-156.
3. Gerhold, J., Dielectric properties of cryogens. InHandbook ofApplied Superconductivity, Vol. 1/Part D Cooling Technology forSuperconductors, ed. B. Seeber. Institute of Physics, Bristol, 1998.
4. Gerhold, J., Electrical insulation in superconducting power systems.IEEE Electrical Insulation Magazine, 1992,8, 14–20.
5. Krahenbuhl, F., Bernstein, B., Danikas, M., Densley, J., Kadotani,K., Kahle, M., Kosaki, M., Mitsui, H., Nagao, M., Smit, J. andTanaka, T., Properties of electrical insulating materials at cryogenictemperatures: a literature review.IEEE Electrical Magazine, 1994,10, 10–22.
6. Fengnian, H. and Weihan, W., Electrical breakdown of vacuum insu-lation at cryogenic temperature.IEEE Transactions on ElectricalInsulation, 1990,25(3), 557–562.
7. Thompson, J. E., Vacuum insulation, conduction, recovery, andapplication: a review.6th ISH, New Orleans/LA, 1989, pp.48.01/1-01/10.
8. Bobo, J. C., Poitevin, J. and Nithart, H., Tenue die´lectrique des isol-ants a4,2 K. CIGRE-Symposium S05-87, Vienna/Austria, 1987, pp.100-04/1-04/4.
9. Looms, J.S.T., Meats, R.J. and Swift, D.A., Vacuum insulation

Properties of cryogenic insulants: J. Gerhold
between very cold niobium electrodes.Brit. J. Appl. Phys. (J. Phys.D), 1968,1(2), 377–379.
10. Halbritter, J., Dynamical enhanced electron emission and dischargesat contaminated surfaces.Appl. Phys. A, 1986,39, 49–57.
11. Schauer, F., U¨ ber die Anwendung von Hochvakuum zur thermischenund elektrischen Isolierung elektrischer Hochspannungseinrich-tungen bei tiefen Temperaturen. Doctorate thesis, Technical Univer-sity Graz, Austria, 1979.
12. Batrakov, A.V., Nazarov, D.S., Ozur, G.E., Popov, S.A., Proskurov-sky, D.I. and Rotshtein, V.P., Increasing the electric strength of vac-uum insulation by irradiating the electrodes with a low-energy high-current electron beam.IEEE Transactions on Dielectrics and Electri-cal Insulation, 1997,4(6), 857–862.
13. Farall, G.A., Electrical breakdown in vacuum.IEEE Transactionson Electrical Insulation, 1985,20(5), 815–841.
14. Mazurek, B. and Cross, J.D., An energy explanation of the areaeffect in electrical breakdown in vacuum.IEEE Transactions onElectrical Insulation, 1987,22(3), 341–346.
15. Schmidt, B. D., Influence of electrode curvature on breakdown volt-age of high vacuum gaps.8th Int. Symp. on Discharges and Electri-cal Insulation in Vacuum, Albuquerque, USA, 1978.
16. Osmokrovic, P. and Djogo, G., Applicability of simple expressionsfor electrical breakdown probability in vacuum.IEEE Transactionson Electrical Insulation, 1989,24(6), 943–947.
17. Hara, M. and Suehiro, J., Improvement of dielectric performance ofelectrically and magnetically stressed vacuum gaps by controllingelectron moving.6th ISH, New Orleans, USA, 1989, pp. 48.08/1-48.08/4.
18. Gerhold, J. and Hara, M., Insulation of high critical temperaturesuperconducting power equipment with liquid nitrogen.Proc. 10thISH, vol. 2, Montreal, Canada, 1997, pp. 125-128.
19. Nelson, R.L., Dielectric loss of liquid helium.Cryogenics, 1974,14,345–346.
20. Cooke, C.M. and Cookson, A.H., The nature and practice of gasesas electrical insulators.IEEE Transactions on Electrical Insulation,1978,13(4), 239–247.
21. Dakin, T. W., Gerhold, J., Krasucki, Z., Luxa, G., Oppermann, G.,Vigreux, J., Wind, G. and Winkelnkemper, H., Breakdown of gasesin uniform fields. In CIGRE Working Group15.03 Paris, France,1977.
22. Gerhold, J., Hubmann, M. and Telser, E., Discharges in cold heliumgas near the Paschen-minimum region.Proc. 11th Int. Conf. on GasDischarges and their Applications, Tokyo/Japan, 1995, pp. II/76-79.
23. Hara, M., Suehiro, J. and Matsumoto, H., Breakdown characteristicsof cryogenic gaseous helium in uniform electric field and spacecharge modified non-uniform field.Cryogenics, 1990,30, 787–794.
24. Gerhold, J., Dielectric strength of gaseous and liquid insulants at lowtemperatures.CIGRE-Symposium S05-87, Vienna, Austria, 1987, pp.100-011-016.
25. Gerhold, J., Dielectric breakdown of cryogenic gases and liquids.Cryogenics, 1979,19, 571–584.
26. Vijh, A.K., Some physico-chemical factors determining the relativeelectric strength of gases.Materials Chemistry, 1982,7, 57–70.
27. Gerhold, J., Hubmann, M. and Telser, E., Near Paschen-minimumdischarge phenomena in helium gas.Proc. 12th Int. Conf. on GasDischarges and their Applications, Greifswald, Germany, 1997, pp.252-255.
28. Hara, M., Suehiro, J. and Matsumoto, H., Breakdown characteristicsof cryogen gaseous nitrogen and estimation of its electrical insulationproperties.IEEE Transactions on Electrical Insulation, 1989,24(4),609–617.
29. Gallagher, T. J.,Simple Dielectric Liquids. Clarendon Press,Oxford, 1975.
30. Yoshino, K., Ohseko, K., Shiraishi, M., Terauchi, M. and Inuit, Y.,Dielectric breakdown of cryogenic liquids in terms of pressure,polarity, pulse width and impurity.Journal of Electrostatics, 1982,12, 305–314.
31. Okubo, H., Goshima, H., Hayakawa, N. and Hikita, M., High voltageinsulation of superconducting power apparatus.Proc. 9th ISH,Graz/Austria, 1995, pp. 9007/1-9007/12.
32. Gerhold, J., Liquid helium breakdown as function of temperatureand electrode roughness.IEEE Transactions on Dielectrics and Elec-trical Insulation, 1994,1(1), 432–439.
Cryogenics 1998 Volume 38, Number 11 1081
33. Peier, D., Breakdown of LN2 by field induced microbubbles.Journalof Electrostatics, 1979,7, 113–122.
34. Gerhold, J., Breakdown phenomena in liquid helium.IEEE Trans-actions on Electrical Insulation, 1989,24(2), 155–166.
35. Weibull, W., A statistical theory of the strength of materials.Ingenorsvetneskapsakadmiens HandlingasNr. 151, Stockholm,Sweden, 1939.
36. Gerhold, J., Hubmann, M. and Telser, E., Gap size effect on liquidhelium breakdown.Cryogenics, 1994,34, 579–586.
37. Gerhold, J., Hubmann, M. and Telser, E., Breakdown probabilityand size effect in liquid helium.IEEE Transactions on Dielectricsand Electrical Insulation, 1998,5, 321–333.
38. Suehiro, J., Ohno, K., Takahashi, T., Miyama, M. and Hara, M., Sizeeffect and statistical characteristics of dc and pulsed breakdown ofliquid helium.IEEE Transactions on Dielectrics and Electrical Insu-lation, 1996,3(4), 507–514.
39. Delucchi, M., Girdino, P., Liberti, G. and Molinari, G., A statisticalanalysis of the ac dielectric strength of liquid nitrogen with IECspherical electrodes under controlled conditions.Journal of Electro-statics, 1982,12, 315–322.
40. Kawashima, A., Electrode area effect on the electric breakdown ofliquid nitrogen.Cryogenics, 1974,14, 217–219.
41. Centurioni, L., Molinari, G. and Viviani, A., Study of the dielectricbehaviour of flowing liquid nitrogen.RGE, 1975,84, 583–586.
42. Goshima, H., Hayakawa, N., Hikita, M. and Okubo, H., Weibullstatistical analysis of area and volume effects on the breakdownstrength in liquid nitrogen.IEEE Transactions on Dielectrics andElectrical Insulation, 1995,2(3), 385–393.
43. Wu, J.L., Cryogenic dielectric testing performed for the SMES-ETMprogram.Adv. Cryog. Eng., 1996,41, 1843–1850.
44. Suehiro, J., Ohno, K., Takahashi, T., Miyama, M. and Hara, M.,Statistical characteristics of electrical breakdown in saturated super-fluid helium.Conf. Record 12th Int. Conf. on Conduction and Break-down in Dielectric Liquids, Rome, Italy, 1996, pp. 320-323.
45. Hayakawa, N., Sakakibara, H., Goshima, H., Hikita, M. and Okubo,H., Breakdown mechanism of liquid nitrogen viewed from area andvolume effects.IEEE Transactions on Dielectrics and ElectricalInsulation, 1997,4(1), 127–134.
46. Dissado, L.A., Fothergill, J.C., Wolfe, S.V. and Hill, R.M., Weibullstatistics in dielectric breakdown; theoretical basis, applications andimplications. IEEE Transactions on Electrical Insulation, 1984,19(3), 227–233.
47. Meats, R.J., Pressurized-helium breakdown at very low temperatures.Proc. IEE, 1972,119, 760–766.
48. Hwang, K. F., Dielectric strength of helium vapour and liquid attemperatures between 1.4 and 4.2 K.Adv. Cryog. Eng., 1977, 8,110-117.
49. Hara, M., Suehiro, J., Tachibana, Y., Takeo, M., Kosaki, M., Hosh-ino, M., Satow, T., Yamamoto, J., Motojima, O., Breakdown charac-teristics of pressurized superfluid He II.Proc. 8th ISH, vol. 2, Yoko-hama, Japan, 1993, pp. 559-562.
50. Hara, M., Electrical insulations in superconducting apparatus.Cryog.Eng. Japan, 1989,24, 72–81.
51. Sillars, R. W.,Electrical Insulating Materials and their Applications.Peter Peregrinus, Stevenage, 1973.
52. Gerhold, J., Dielectric properties. InHandbook of Applied Supercon-ductivity, Vol. 1/part F Materials at low Temperatures, ed. B. Seeber.Institute of Physics, Bristol, 1998.
53. Hartwig, G. and Schwarz, G., Correlation of dielectric and mechan-ical damping.Adv. Cryog. Eng., 1984,30, 61–70.
54. Schauer, F., A capacitance-graded cryogenic high voltage bushingfor vertical or horizontal mounting.Cryogenics, 1984,24, 90–96.
55. Forsyth, E.B., The dielectric insulation of superconducting powercables.Proc. IEEE, 1991,79, 31–40.
56. Mizuno, Y., Nagao, M., Kosaki, M., Shimizu, N. and Horii, K.,Evaluation of Ethylene-Propylene rubber as electrical insulatingmaterials for a superconducting cable.IEEE Transactions on Electri-cal Insulation, 1992,27(6), 1108–1117.
57. Kosaki, M., Nagao, M., Shimizu, N. and Mizuno, Y., Solid insulationand its deterioration.Cryogenics38, 1998 (this issue).
58. Bulinski, A., Densley, J. and Sudarshan, T.S., The ageing of electri-cal insulation at cryogenic temperatures.IEEE Transaction on Elec-trical Insulation, 1980,15(2), 83–88.