Propensity score matching with clustered data in Stata · 2018-12-04 · Bruno Arpino Spanish Stata...
37
Arpino, Mattei SESM 2013 - Barcelona Propensity score matching with clustered data in Stata Bruno Arpino Pompeu Fabra University [email protected] https://sites.google.com/site/brunoarpino 11 th Spanish Stata Conference 2018 Barcelona, 24 de octubre de 2018
Transcript of Propensity score matching with clustered data in Stata · 2018-12-04 · Bruno Arpino Spanish Stata...
Arpino, Mattei
SESM 2013 - Barcelona
Propensity score matching
with clustered data in Stata
Bruno ArpinoPompeu Fabra University
https://sites.google.com/site/brunoarpino
11th Spanish Stata Conference 2018
Barcelona, 24 de octubre de 2018

Bruno Arpino
Spanish Stata meeting 2018
Outline
• Brief intro to Propensity Score Matching (PSM) for
estimation of causal effects in observational studies
• PSM with clustered (multilevel, hierarchical) data
• PSM in Stata
– Available routines
– How to implement PSM with clustered data
Do-file and dataset to replicate the analyses in these slides can be
found at: https://sites.google.com/site/brunoarpino/software

Bruno Arpino
Spanish Stata meeting 2018
Motivating case study (1/3)
• Goal: estimating the causal effect of doing homeworks on
mathematical proficiency
• We use a subset of the National Education Longitudinal
Study of 1988 (NELS-88), a nationally representative,
longitudinal study of 8th graders in 1988 in the US
• Our data is a subsample of the original full NELS-88
dataset provided by Kraft and de Leeuw (1998)

Bruno Arpino
Spanish Stata meeting 2018
Motivating case study (2/3)
• Treatment: T = 1 for students that spend at least 1 hour
doing math homeworks per week; 0 otherwise
• Outcome: Y, is the score on a math test
• The dataset contains 260 students from 10 schools and
several potential confounders on both students (X) and
schools (Z)

Bruno Arpino
Spanish Stata meeting 2018
Motivating case study (3/3)
• Selection mechanism: what are the factors influencing
time spent doing homework (that may also influence math
proficiency)? For the sake of illustration we only consider:
• Individual-level: ses (a standardised continuous measure
of family socio-economic status), male (1 = male; 0 =
female) and white (1 = white; 0 = other race)
• School-level: public (1 = public schools; 0 = private)

Bruno Arpino
Spanish Stata meeting 2018
Potential outcome framework
• Let T be the binary treatment indicator:
= 1 at least 1 hour doing math homeworks per week;
= 0 otherwise
• Let Y(1) and Y(0) denote the potential outcomes, i.e. math
score we would observe if students were assigned to the
treatment or control group, respectively
• Causal estimand of interest: ATT = E[Y(1) - Y(0) | T = 1]
• Y(0) is always unobserved for treated students (T = 1)

Bruno Arpino
Spanish Stata meeting 2018
Propensity score (PS) methods
• Identifying assumptions:
– Y(1), Y(0) ⊥ T | X, Z (unconfoundedness)
– 0 < P (T=1| X, Z) < 1 (overlap)
• PS: e(X) ≡ Pr{T = 1|X, Z} = E{T|X, Z}.
• Rosenbaum and Rubin (1983):
– the propensity score is a balancing score, i.e., X, Z ⊥T | e(X, Z)
– if unconfoundedness holds, then Y(1), Y(0) ⊥ T | e(X, Z)
• These results justify matching / stratification / weighting on
e(X, Z) instead than on (X, Z)

Bruno Arpino
Spanish Stata meeting 2018
PSM as a two-step procedure
• Design phase: match similar treated and control
individuals to make them as similar as possible in terms of
(X, Z)
• Outcome phase: estimate causal effects on the matched
data
• It reduces model dependence (extrapolation; Drake, 1993)
• It increses objective causal inference (Rubin, 2008)
• Matching as a data pre-processing (Ho et al., 2007)
Bruno Arpino
Spanish Stata meeting 2018
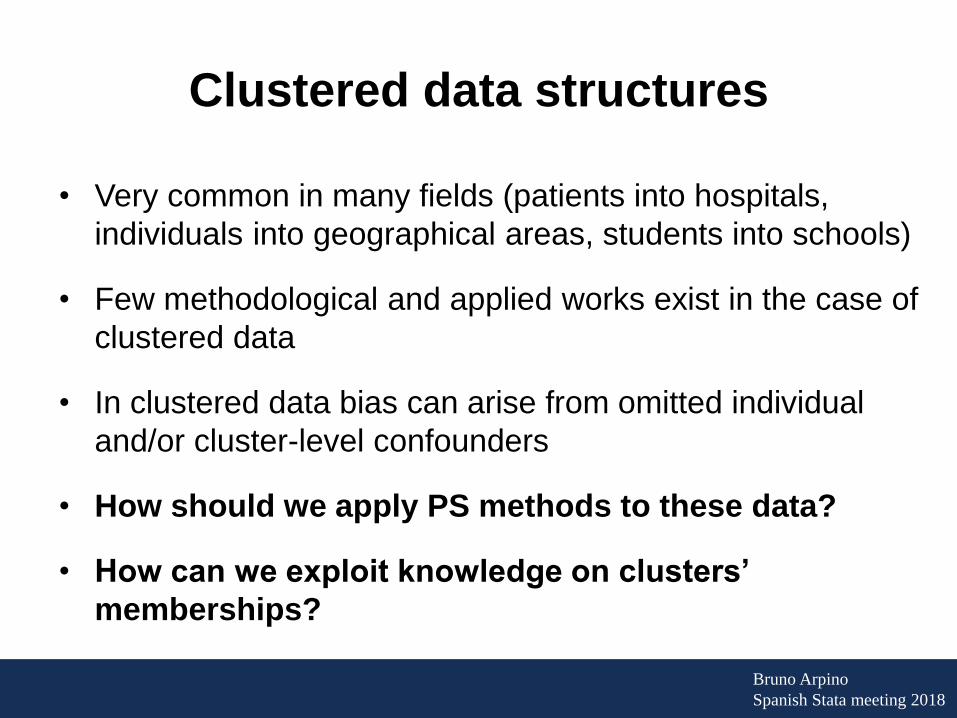
Clustered data structures
• Very common in many fields (patients into hospitals,
individuals into geographical areas, students into schools)
• Few methodological and applied works exist in the case of
clustered data
• In clustered data bias can arise from omitted individual
and/or cluster-level confounders
• How should we apply PS methods to these data?
• How can we exploit knowledge on clusters’
memberships?

Bruno Arpino
Spanish Stata meeting 2018
Existing studies with clustered data
• Arpino and Mealli (2011)
– Show the benefit of using random or fixed effects models for the
estimation of the propensity score to reduce the bias due to
unmeasured cluster-level variables in PS matching (PSM)
– Focus on high number of small clusters
• Thoemmes and West (2011) and Li et al (2013)
considered stratification and re-weighting using PS,
respectively

Bruno Arpino
Spanish Stata meeting 2018
Arpino and Cannas (2016)
• Unbalanced data structure with both big and small
clusters
• We compare different approaches:
• R package: CMatching
Approaches PS model Matching
Naïve (NV) Single-level logit Pooled
Within (W) Single-level logit Within-cluster
Preferential (PW) Single-level logit “Preferential” within-cluster
Random-effects (RE) Random-effect logit Pooled
Fixed-effects (RE) Fixed-effect logit Pooled

Bruno Arpino
Spanish Stata meeting 2018
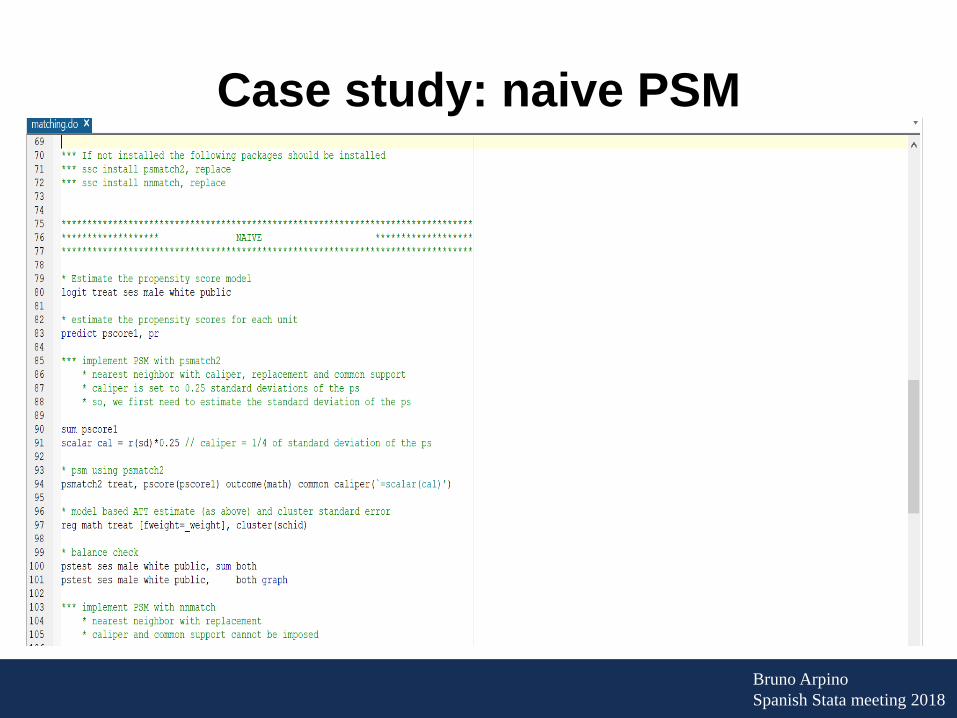
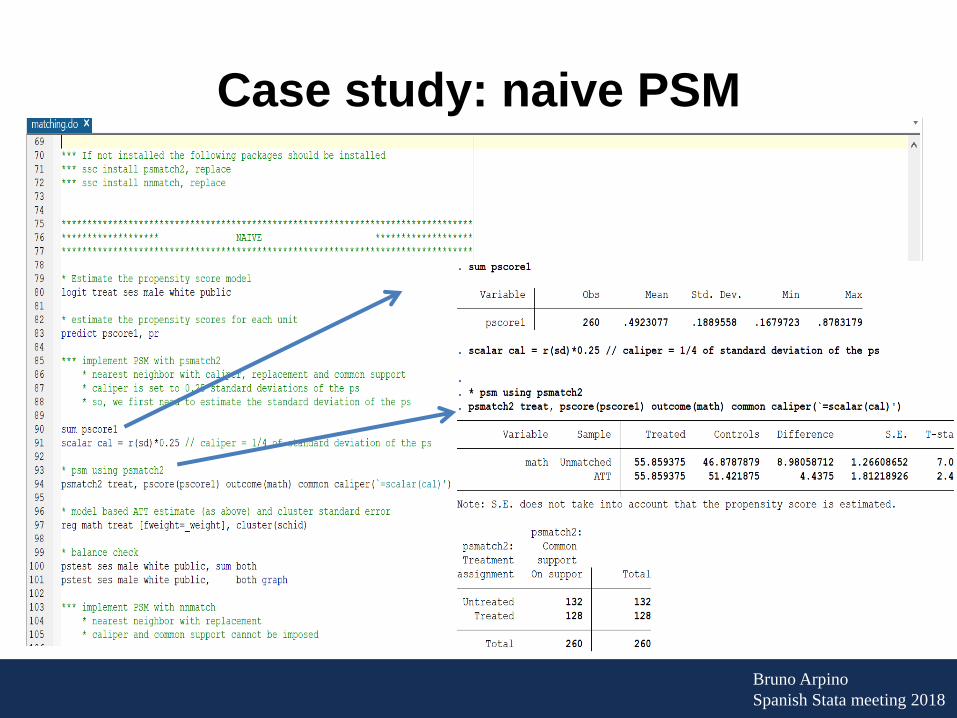
«Naïve» approach
• It ignores the clustered structure in both PS estimation:
• and matching
• We use one-to-one nearest neighbor matching within a
caliper of 0.25 standard deviations of the estimated PS
(with replacement)
(2) }ˆ25.0ˆˆminˆ:{0
0 ejkrjIjk
jkrj eeeIjkA −==
(1) )(logit 0 ijij Xe +=

Bruno Arpino
Spanish Stata meeting 2018
Estimating the ATT
• The matched dataset is built as the subset of treated and
control units that have been matched:
• and the ATT is estimated on this set using:
(3) }:{
= rj
rjrj AArjM
( ) (4) ,)(
1ˆ
1
−=
MIrj jk
jkrj jkrjwYYMcard
TTA
Bruno Arpino
Spanish Stata meeting 2018
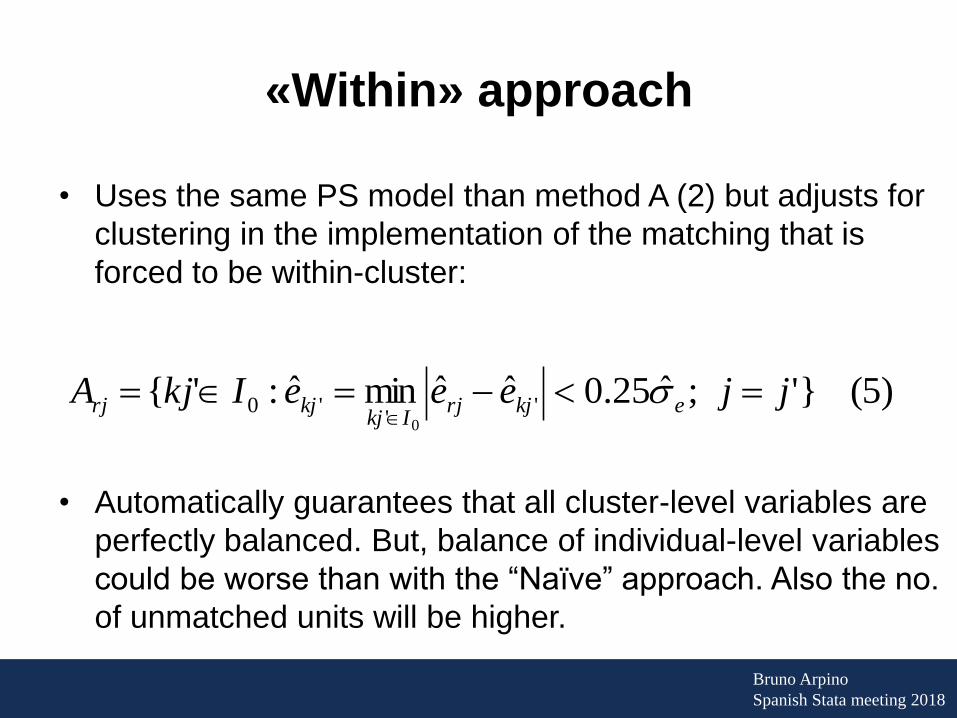
«Within» approach
• Uses the same PS model than method A (2) but adjusts for
clustering in the implementation of the matching that is
forced to be within-cluster:
• Automatically guarantees that all cluster-level variables are
perfectly balanced. But, balance of individual-level variables
could be worse than with the “Naïve” approach. Also the no.
of unmatched units will be higher.
(5) }' ;ˆ25.0ˆˆminˆ:'{ ''
'00
jjeeeIkjA ekjrjIkj
kjrj =−==

Bruno Arpino
Spanish Stata meeting 2018
«Preferential» approach
• Tries to combine the benefits of the previous two
approaches (“Naïve” and “Within”).
• Starts by searching control units within-cluster (according to
(5)). If none is found, control units are searched in other
clusters (according to (2)).
• It is expected to improve the balancing of cluster-level
variables with respect to the “Naïve” approach and reduces
the loss of units compared to the “Within” approach.

Bruno Arpino
Spanish Stata meeting 2018
«Random-effects» and «Fixed-
effects» approaches
• They keep clustering into account in the estimation of the
propensity score:
by estimating cluster-specific random or fixed intercepts,
respectively (Arpino and Mealli, 2011).
(6) )(logit ijjij Xe +=

Bruno Arpino
Spanish Stata meeting 2018
Simulation results (1/2)

Bruno Arpino
Spanish Stata meeting 2018
Simulation results (2/2)
Note: βZ, overall sampe size, etc. are kept fixed. Z is unobserved.

Bruno Arpino
Spanish Stata meeting 2018
• psmatch2 (Leuven and Sianesi 2003)
– PSM and covariate matching
– severalalgorithms (nn and caliper matching (with and w/o replacement), kernel, radius, local linear matching
– common support plots (psgraph) and covariate imbalance testing (pstest)
– standard errors obtained using bootstrap methods or variance approximation
• nnmatch (Abadie, Drukker, Herr, and Imbens 2004)
– nearest neighbour matching with different distance metrics (replacement allowed)
– allows exact matching (or as close as possible) on a subset of variables
– allows for bias correction
– sample or population variance, with or w/o assuming a constant treatment effects
Implementing matching in Stata
Bruno Arpino
Spanish Stata meeting 2018
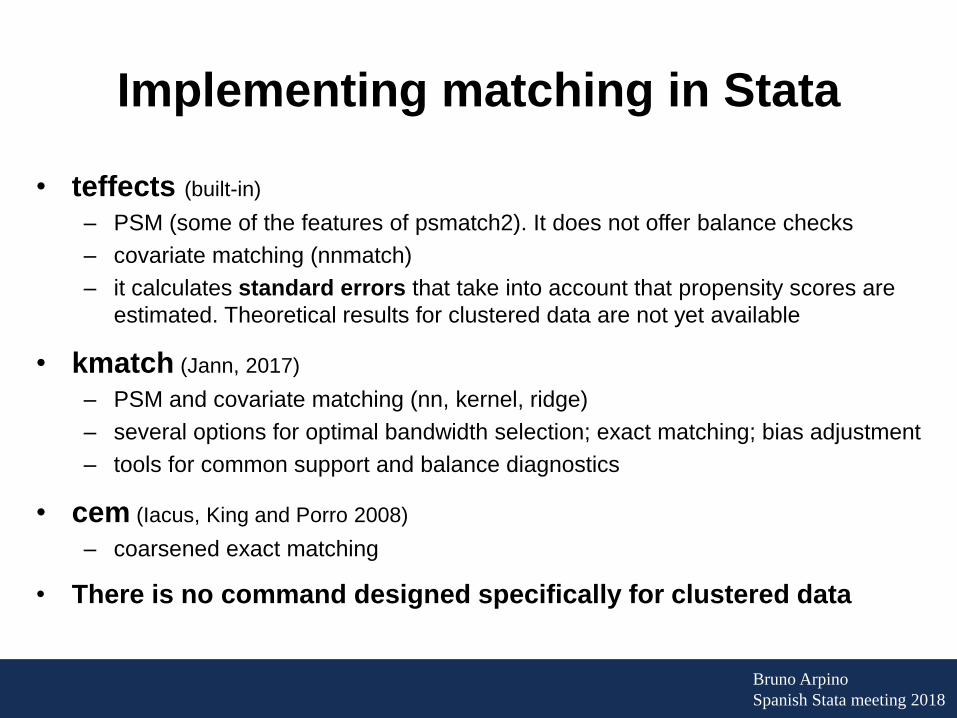
• teffects (built-in)
– PSM (some of the features of psmatch2). It does not offer balance checks
– covariate matching (nnmatch)
– it calculates standard errors that take into account that propensity scores are
estimated. Theoretical results for clustered data are not yet available
• kmatch (Jann, 2017)
– PSM and covariate matching (nn, kernel, ridge)
– several options for optimal bandwidth selection; exact matching; bias adjustment
– tools for common support and balance diagnostics
• cem (Iacus, King and Porro 2008)
– coarsened exact matching
• There is no command designed specifically for clustered data
Implementing matching in Stata

Bruno Arpino
Spanish Stata meeting 2018
PSM in Stata with clustered data
Approaches PS model Matching
Naïve (NV) Single-level logit
(logit)
Pooled
(psmatch2; nnmatch)
Within (W) Single-level logit
(logit)
Within-cluster
(cycle on psmatch2;
nnmatch with exact option)
Preferential (PW) Single-level logit
(logit)
“Preferential” within-cluster
(ad hoc procedure based on
psmatch2 or nnmatch)
Random-effects (RE) Random-effect logit
(e.g., xtmelogit)
Pooled
(psmatch2; nnmatch)
Fixed-effects (RE) Fixed-effect logit
(e.g., logit +
clusters' dummies)
Pooled
(psmatch2; nnmatch)
Outcome analysis should account for clustering (robust se)
Bruno Arpino
Spanish Stata meeting 2018
Case study: naive PSM
Bruno Arpino
Spanish Stata meeting 2018
Case study: naive PSM

Bruno Arpino
Spanish Stata meeting 2018
Case study: naive PSM

Bruno Arpino
Spanish Stata meeting 2018
Case study: naive PSM

Bruno Arpino
Spanish Stata meeting 2018
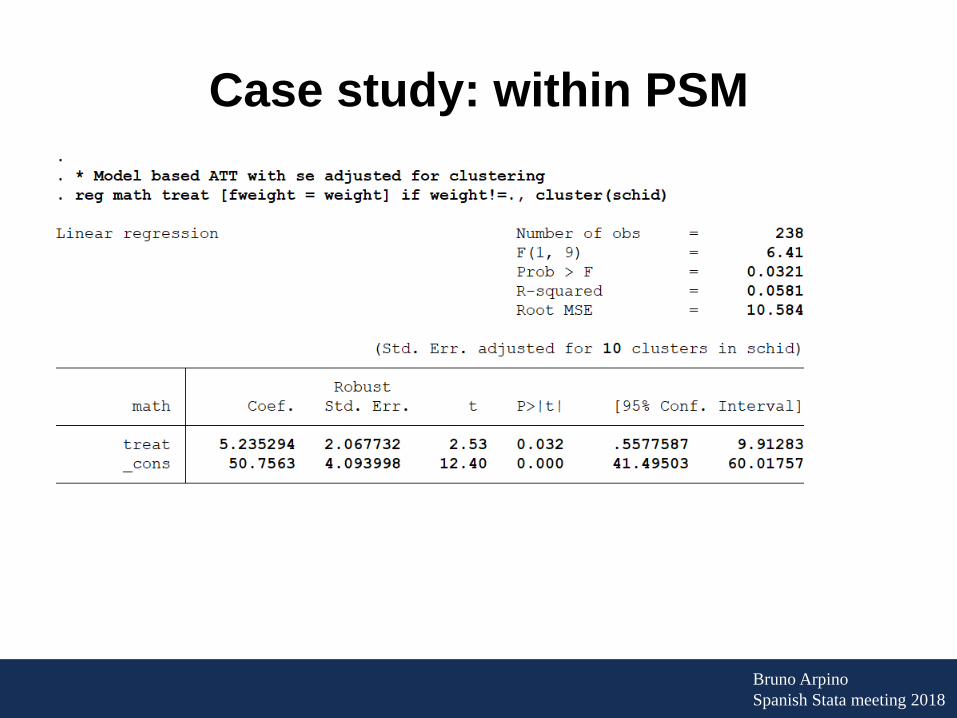
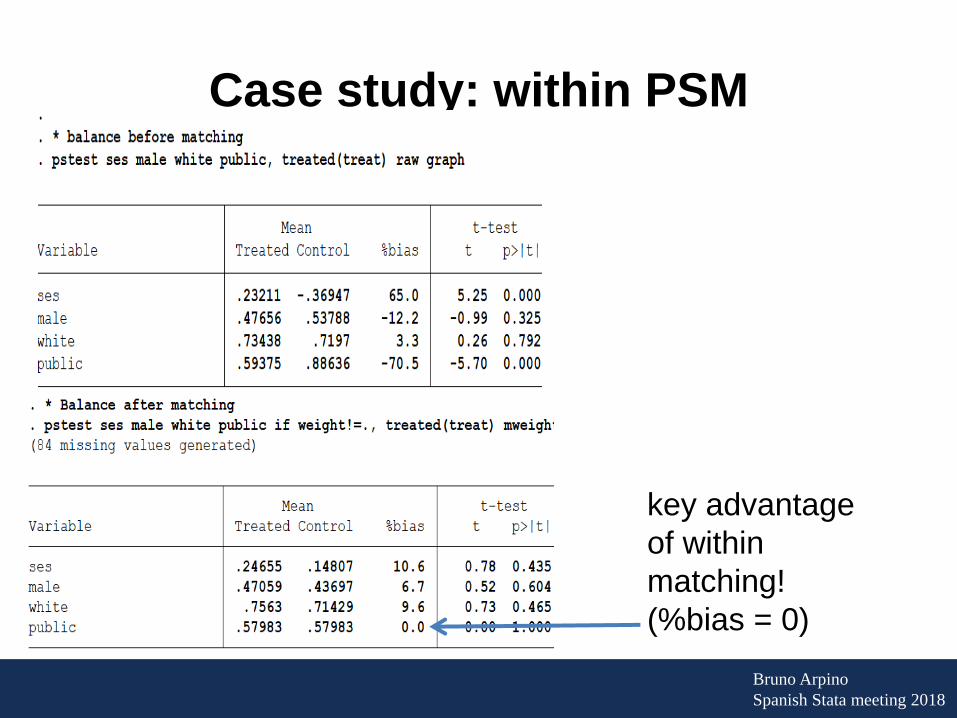
Case study: within PSM
Bruno Arpino
Spanish Stata meeting 2018
Case study: within PSM
Bruno Arpino
Spanish Stata meeting 2018
Case study: within PSM
key advantage
of within
matching!
(%bias = 0)

Bruno Arpino
Spanish Stata meeting 2018
Comparing balance:
naive vs within PSM
naive within
Bruno Arpino
Spanish Stata meeting 2018
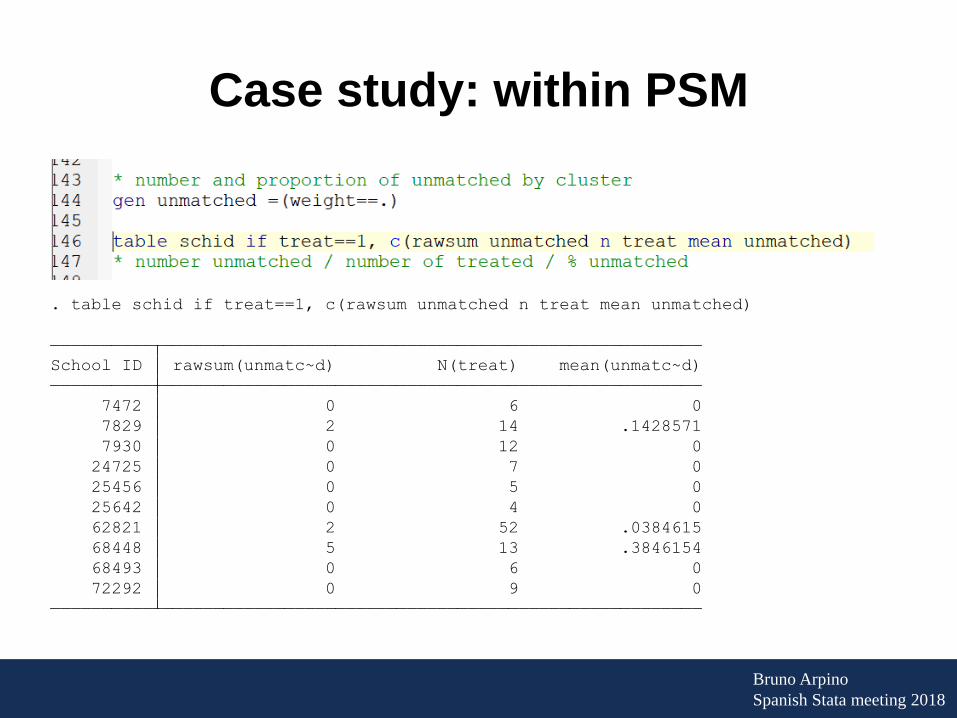
Case study: within PSM
72292 0 9 0
68493 0 6 0
68448 5 13 .3846154
62821 2 52 .0384615
25642 0 4 0
25456 0 5 0
24725 0 7 0
7930 0 12 0
7829 2 14 .1428571
7472 0 6 0
School ID rawsum(unmatc~d) N(treat) mean(unmatc~d)
. table schid if treat==1, c(rawsum unmatched n treat mean unmatched)
Bruno Arpino
Spanish Stata meeting 2018
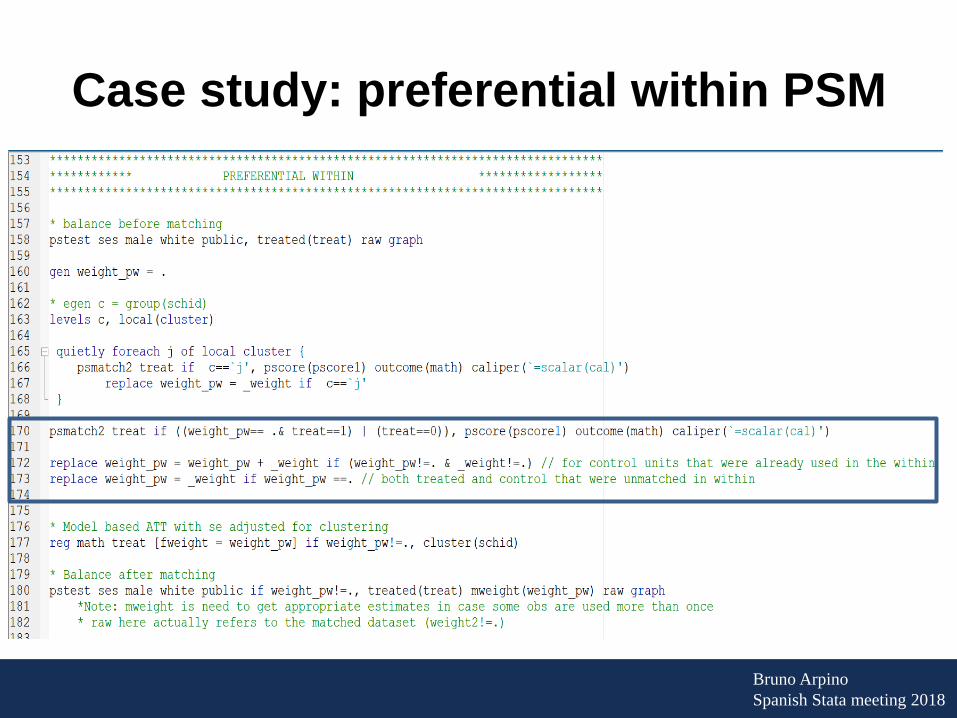
Case study: preferential within PSM

Bruno Arpino
Spanish Stata meeting 2018
Case study: preferential within PSM

Bruno Arpino
Spanish Stata meeting 2018
Comparing balance: within vs
preferential within PSM
public .59375 .60938 -3.5 -0.25 0.799 .
white .73438 .69531 8.8 0.69 0.491 .
male .47656 .41406 12.5 1.00 0.316 .
ses .23211 .15266 8.3 0.65 0.516 1.02
Variable Treated Control %bias t p>|t| V(C)
Mean t-test V(T)/
(71 missing values generated)
. pstest ses male white public if weight_pw!=., treated(treat) mweight(weight_pw) raw graph
. * Balance after matching
preferentialwithin

Bruno Arpino
Spanish Stata meeting 2018
Case study: preferential within PSM
72292 0 9 0
68493 0 6 0
68448 0 13 0
62821 0 52 0
25642 0 4 0
25456 0 5 0
24725 0 7 0
7930 0 12 0
7829 0 14 0
7472 0 6 0
School ID rawsum(unmatc~w) N(treat) mean(unmatc~w)
. table schid if treat==1, c(rawsum unmatched_pw n treat mean unmatched_pw)

Bruno Arpino
Spanish Stata meeting 2018
Concluding remarks
• In the presence of clustered data several approaches can be
followed to implement PSM
• “Within” matching works well with big clusters
• “Preferential” within matching is an attractive alternative
when all or some clusters are small
• Available routines in Stata can be adapted to clustered data
• Future developments:
– Standard errors accounting for estimation of PS (as in teffects
psmatch2)
– Within-cluster balance
Bruno Arpino
Spanish Stata meeting 2018
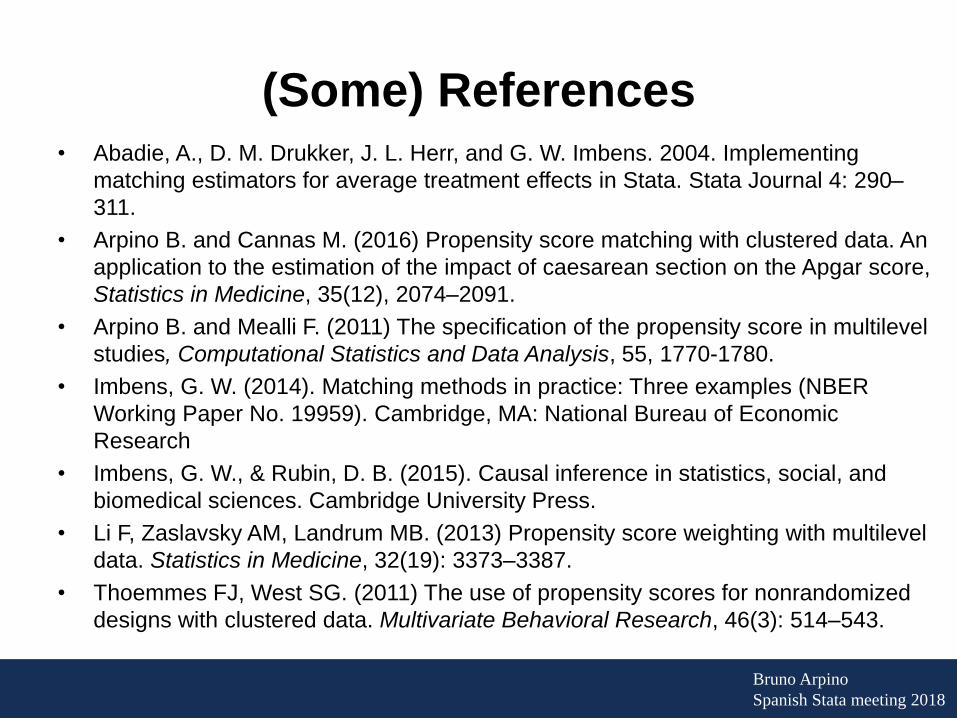
(Some) References• Abadie, A., D. M. Drukker, J. L. Herr, and G. W. Imbens. 2004. Implementing
matching estimators for average treatment effects in Stata. Stata Journal 4: 290–
311.
• Arpino B. and Cannas M. (2016) Propensity score matching with clustered data. An
application to the estimation of the impact of caesarean section on the Apgar score,
Statistics in Medicine, 35(12), 2074–2091.
• Arpino B. and Mealli F. (2011) The specification of the propensity score in multilevel
studies, Computational Statistics and Data Analysis, 55, 1770-1780.
• Imbens, G. W. (2014). Matching methods in practice: Three examples (NBER
Working Paper No. 19959). Cambridge, MA: National Bureau of Economic
Research
• Imbens, G. W., & Rubin, D. B. (2015). Causal inference in statistics, social, and
biomedical sciences. Cambridge University Press.
• Li F, Zaslavsky AM, Landrum MB. (2013) Propensity score weighting with multilevel
data. Statistics in Medicine, 32(19): 3373–3387.
• Thoemmes FJ, West SG. (2011) The use of propensity scores for nonrandomized
designs with clustered data. Multivariate Behavioral Research, 46(3): 514–543.

Bruno Arpino
Spanish Stata meeting 2018
Bruno ArpinoPompeu Fabra University
https://sites.google.com/site/brunoarpino