
Propellant Charring in Pulsed Plasma Thrusters - Deep Blue: Home
7
JOURNAL OF PROPULSION AND POWER Vol. 20, No. 6, November–December 2004 Propellant Charring in Pulsed Plasma Thrusters Michael Keidar ∗ and Iain D. Boyd † University of Michigan, Ann Arbor, Michigan 48109 Erik L. Antonsen ‡ University of Illinois at Urbana–Champaign, Urbana, Illinois 61801 and Frank S. Gulczinski III § and Gregory G. Spanjers ¶ U.S. Air Force Research Laboratory, Edwards Air Force Base, California 93524 The Teflon TM ablation in a micro-pulsed plasma thruster is studied with the aim of understanding the charring phenomenon. Microscopic analysis of the charred areas shows that it contains mainly carbon. It is concluded that the carbon char is formed as a result of carbon flux returned from the plasma. A simplified model of the current layer near the Teflon surface is developed. The current density and the Teflon surface temperature have peaks near the electrodes that explain preferential ablation of these areas, such as was observed experimentally. Comparison of the temperature field and the ablation rate distribution with photographs of the Teflon surface shows that the area with minimum surface temperature and ablation rate corresponds to the charring area. This finding suggests that the charring may be related to a temperature effect. Nomenclature B = magnetic field C = capacitance e = elementary (electron) charge I p = current peak j = current density L = circuit inductance n = electron density Q F = heat flux due to the particle convection Q j = Joule heat Q r = radiation heat flux R = equivalent circuit resistance r = radial distance T e = electron temperature U o = initial voltage on the capacitor V = plasma velocity µ = permittivity σ = plasma (Spitzer) conductivity ωτ = Hall parameter I. Introduction P ULSED plasma thrusters (PPTs) have been investigated since the early 1960s and were among the first of various electri- cal propulsion concepts accepted for space flight, mainly due to their simplicity and high reliability. 1 However, the PPT has a low efficiency of 10% (Ref. 2) and therefore several ways of improv- ing it have been suggested. 3 Currently, PPTs are considered an at- Received 15 May 2003; revision received 2 April 2004; accepted for pub- lication 27 March 2004. Copyright c 2004 by the American Institute of Aeronautics and Astronautics, Inc. All rights reserved. Copies of this paper may be made for personal or internal use, on condition that the copier pay the $10.00 per-copy fee to the Copyright Clearance Center, Inc., 222 Rose- wood Drive, Danvers, MA 01923; include the code 0748-4658/04 $10.00 in correspondence with the CCC. ∗ Research Scientist, Department of Aerospace Engineering; keidar@ engin.umich.edu. Senior Member AIAA. † Professor, Department of Aerospace Engineering. Associate Fellow AIAA. ‡ Undergraduate Student, Department of Aerospace and Aeronautics. Student Member AIAA. § Researcher, Electric Propulsion Laboratory, Propulsion Directorate. Member AIAA. ¶ Program Manager, Electric Propulsion Laboratory, Propulsion Direc- torate; currently Program Manager, Space Vehicles Directorate, Kirtland AFB, NM, 87117. Member AIAA. tractive propulsion option for stationkeeping and drag makeup pur- poses for mass- and power-limited satellites. 4,5 An electromagnetic PPT was successfully operated for pitch axis control on the EO- 1 spacecraft. 6,7 Recently, a micro-PPT has been designed at the Air Force Research Laboratory (AFRL) for delivery of very small impulses. 8,9 This is a simplified, miniaturized version of a conven- tional PPT with a thrust in the 10-µN range and energy level of about 1–10 J (∼1-Hz repetition rate) designed to provide attitude control and stationkeeping for microsatellites. Complete assessment of the spacecraft integration effects requires characterization of the plasma-plume exhaust of a PPT. Previously we have developed an end-to-end model of the PPT and its plume with application to electrothermal 10,11 and electromagnetic PPTs. 12 It became clear that the plasma distribution in the plume field depends heavily on upstream boundary conditions. Therefore the model of plasma generation in these devices becomes a very im- portant aspect of accurate plasma-plume simulation. In the present paper we will focus on a micro-PPT. Inspection of the micro-PPT propellant surface after firing indicated signs of charring and pref- erential ablation near the electrodes. 8,9,13 It was identified that char formation is the main failure mechanism in the case of low energy- to-thruster-radius ratio. 13 In this paper we present results of mi- croscopic analyses of the charred areas and propose a mechanism of char formation. To understand this phenomenon, a model of the plasma layer near the Teflon TM surface is developed. In addition, the solution of the model provides boundary conditions for simulating the plasma plume. II. Micro-Pulsed Plasma Thruster The AFRL MicroPPT uses a three-electrode configuration. 8,9 A small-diameter rod (center electrode) is encased in a small-diameter annulus of Teflon, which is then encased in a relatively small- diameter tube, which acts as the intermediate electrode. This con- struction is then encased in a second, larger-diameter annulus of Teflon, which is then encased in a large-diameter outer electrode. The MicroPPT is fired by a low-energy breakdown between the in- termediate and central electrodes. This discharge provides enough seed ionization to make possible a higher-energy conduction break- down between the intermediate and outer electrodes. The discharge between the intermediate and central electrodes is referred to as the trigger discharge. The discharge between the intermediate and outer electrodes is referred to as the “main discharge.” Although a wide range of parameters are tested in various MicroPPT configurations, typically the trigger discharge will consume about 1/50 the energy of 978
Transcript of Propellant Charring in Pulsed Plasma Thrusters - Deep Blue: Home

JOURNAL OF PROPULSION AND POWER
Vol. 20, No. 6, November–December 2004
Propellant Charring in Pulsed Plasma Thrusters
Michael Keidar∗ and Iain D. Boyd†
University of Michigan, Ann Arbor, Michigan 48109Erik L. Antonsen‡
University of Illinois at Urbana–Champaign, Urbana, Illinois 61801and
Frank S. Gulczinski III§ and Gregory G. Spanjers¶
U.S. Air Force Research Laboratory, Edwards Air Force Base, California 93524
The TeflonTM ablation in a micro-pulsed plasma thruster is studied with the aim of understanding the charringphenomenon. Microscopic analysis of the charred areas shows that it contains mainly carbon. It is concluded thatthe carbon char is formed as a result of carbon flux returned from the plasma. A simplified model of the currentlayer near the Teflon surface is developed. The current density and the Teflon surface temperature have peaks nearthe electrodes that explain preferential ablation of these areas, such as was observed experimentally. Comparisonof the temperature field and the ablation rate distribution with photographs of the Teflon surface shows that thearea with minimum surface temperature and ablation rate corresponds to the charring area. This finding suggeststhat the charring may be related to a temperature effect.
NomenclatureB = magnetic fieldC = capacitancee = elementary (electron) chargeIp = current peakj = current densityL = circuit inductancen = electron densityQF = heat flux due to the particle convectionQ j = Joule heatQr = radiation heat fluxR = equivalent circuit resistancer = radial distanceTe = electron temperatureUo = initial voltage on the capacitorV = plasma velocityµ = permittivityσ = plasma (Spitzer) conductivityωτ = Hall parameter
I. Introduction
P ULSED plasma thrusters (PPTs) have been investigated sincethe early 1960s and were among the first of various electri-
cal propulsion concepts accepted for space flight, mainly due totheir simplicity and high reliability.1 However, the PPT has a lowefficiency of 10% (Ref. 2) and therefore several ways of improv-ing it have been suggested.3 Currently, PPTs are considered an at-
Received 15 May 2003; revision received 2 April 2004; accepted for pub-lication 27 March 2004. Copyright c© 2004 by the American Institute ofAeronautics and Astronautics, Inc. All rights reserved. Copies of this papermay be made for personal or internal use, on condition that the copier paythe $10.00 per-copy fee to the Copyright Clearance Center, Inc., 222 Rose-wood Drive, Danvers, MA 01923; include the code 0748-4658/04 $10.00 incorrespondence with the CCC.
∗Research Scientist, Department of Aerospace Engineering; [email protected]. Senior Member AIAA.
†Professor, Department of Aerospace Engineering. Associate FellowAIAA.
‡Undergraduate Student, Department of Aerospace and Aeronautics.Student Member AIAA.
§Researcher, Electric Propulsion Laboratory, Propulsion Directorate.Member AIAA.
¶Program Manager, Electric Propulsion Laboratory, Propulsion Direc-torate; currently Program Manager, Space Vehicles Directorate, KirtlandAFB, NM, 87117. Member AIAA.
tractive propulsion option for stationkeeping and drag makeup pur-poses for mass- and power-limited satellites.4,5 An electromagneticPPT was successfully operated for pitch axis control on the EO-1 spacecraft.6,7 Recently, a micro-PPT has been designed at theAir Force Research Laboratory (AFRL) for delivery of very smallimpulses.8,9 This is a simplified, miniaturized version of a conven-tional PPT with a thrust in the 10-µN range and energy level ofabout 1–10 J (∼1-Hz repetition rate) designed to provide attitudecontrol and stationkeeping for microsatellites.
Complete assessment of the spacecraft integration effects requirescharacterization of the plasma-plume exhaust of a PPT. Previouslywe have developed an end-to-end model of the PPT and its plumewith application to electrothermal10,11 and electromagnetic PPTs.12
It became clear that the plasma distribution in the plume fielddepends heavily on upstream boundary conditions. Therefore themodel of plasma generation in these devices becomes a very im-portant aspect of accurate plasma-plume simulation. In the presentpaper we will focus on a micro-PPT. Inspection of the micro-PPTpropellant surface after firing indicated signs of charring and pref-erential ablation near the electrodes.8,9,13 It was identified that charformation is the main failure mechanism in the case of low energy-to-thruster-radius ratio.13 In this paper we present results of mi-croscopic analyses of the charred areas and propose a mechanismof char formation. To understand this phenomenon, a model of theplasma layer near the TeflonTM surface is developed. In addition, thesolution of the model provides boundary conditions for simulatingthe plasma plume.
II. Micro-Pulsed Plasma ThrusterThe AFRL MicroPPT uses a three-electrode configuration.8,9 A
small-diameter rod (center electrode) is encased in a small-diameterannulus of Teflon, which is then encased in a relatively small-diameter tube, which acts as the intermediate electrode. This con-struction is then encased in a second, larger-diameter annulus ofTeflon, which is then encased in a large-diameter outer electrode.The MicroPPT is fired by a low-energy breakdown between the in-termediate and central electrodes. This discharge provides enoughseed ionization to make possible a higher-energy conduction break-down between the intermediate and outer electrodes. The dischargebetween the intermediate and central electrodes is referred to as thetrigger discharge. The discharge between the intermediate and outerelectrodes is referred to as the “main discharge.” Although a widerange of parameters are tested in various MicroPPT configurations,typically the trigger discharge will consume about 1/50 the energy of
978
KEIDAR ET AL. 979
the main discharge. In this fashion, the MicroPPT has demonstratedthe ability to initiate a surface-breakdown discharge across outerpropellant diameters as large as 1
4 in. using a relatively low voltage,below 3000 V, without external trigger. Without the three-electrodeconfiguration, up to 40 kV would be required to initiate the dis-charge across a 1
4 in.-diam gap, which would place excessive designrequirements on the power-processing unit and on the spacecraftEMI shielding.
In this work, research is performed on two-electrode MicroPPTconfigurations as shown in Fig. 1. The discharge occurs betweenan inner cathode rod and an outer anode tube, across a Teflon an-nulus. Understanding the physical processes in this simplified ge-ometry has proven beneficial in advancing the optimization of theMicroPPT by separating the requirements for the trigger and maindischarges. Research13 on small-diameter two-electrode designs,generally between 1 and 3 mm, is applicable to the trigger discharge.Research8,9,14 on larger-diameter two-electrode designs, typicallybetween 3 and 7 mm, is more applicable to the main discharge.
III. Microscopic Analyses of the Teflon SurfaceMicroPPT propellant samples with two electrodes and different
anode diameters were analyzed. These samples represent a fullycharred, a partially charred, and an uncharred Teflon surface. Theexperiments were conducted under a base pressure of 10−6 torr. Mi-croscopic analyses were performed on the environmental scanningelectron microscope available at the Electron Microbeam AnalysesLaboratory at the University of Michigan. X-ray energy-dispersivespectroscopy (XEDS) makes it possible to identify the chemical el-ements. We present some characteristic images taken from the fullycharred sample.
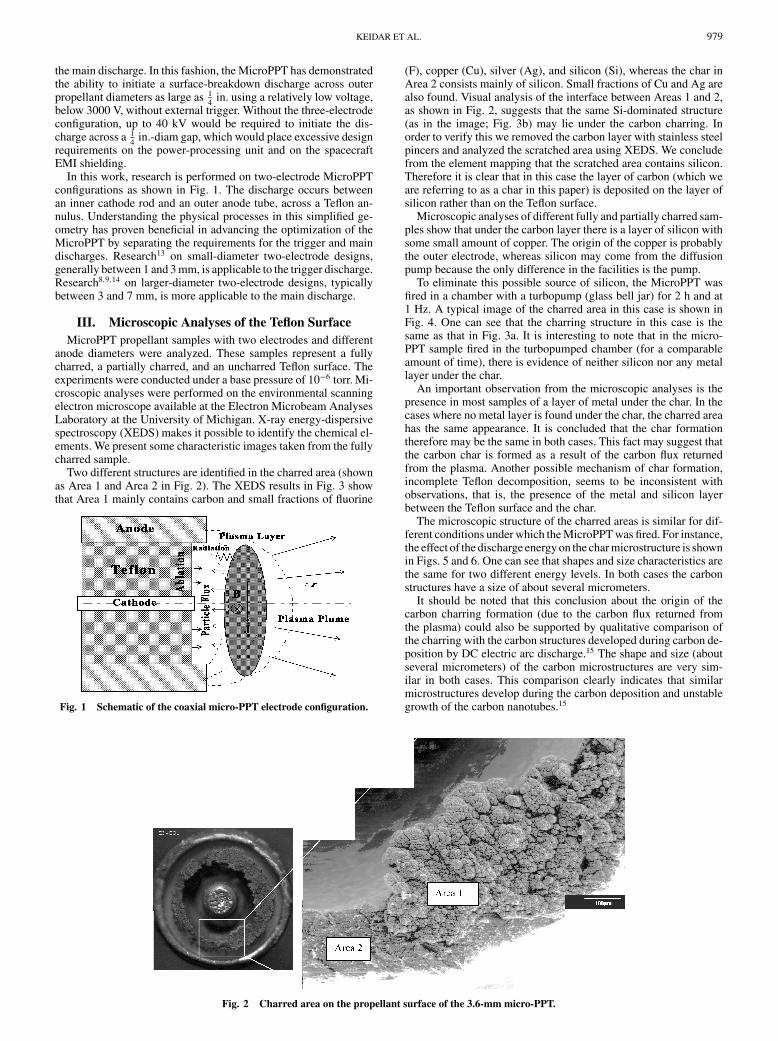
Two different structures are identified in the charred area (shownas Area 1 and Area 2 in Fig. 2). The XEDS results in Fig. 3 showthat Area 1 mainly contains carbon and small fractions of fluorine
Fig. 1 Schematic of the coaxial micro-PPT electrode configuration.
Fig. 2 Charred area on the propellant surface of the 3.6-mm micro-PPT.
(F), copper (Cu), silver (Ag), and silicon (Si), whereas the char inArea 2 consists mainly of silicon. Small fractions of Cu and Ag arealso found. Visual analysis of the interface between Areas 1 and 2,as shown in Fig. 2, suggests that the same Si-dominated structure(as in the image; Fig. 3b) may lie under the carbon charring. Inorder to verify this we removed the carbon layer with stainless steelpincers and analyzed the scratched area using XEDS. We concludefrom the element mapping that the scratched area contains silicon.Therefore it is clear that in this case the layer of carbon (which weare referring to as a char in this paper) is deposited on the layer ofsilicon rather than on the Teflon surface.
Microscopic analyses of different fully and partially charred sam-ples show that under the carbon layer there is a layer of silicon withsome small amount of copper. The origin of the copper is probablythe outer electrode, whereas silicon may come from the diffusionpump because the only difference in the facilities is the pump.
To eliminate this possible source of silicon, the MicroPPT wasfired in a chamber with a turbopump (glass bell jar) for 2 h and at1 Hz. A typical image of the charred area in this case is shown inFig. 4. One can see that the charring structure in this case is thesame as that in Fig. 3a. It is interesting to note that in the micro-PPT sample fired in the turbopumped chamber (for a comparableamount of time), there is evidence of neither silicon nor any metallayer under the char.
An important observation from the microscopic analyses is thepresence in most samples of a layer of metal under the char. In thecases where no metal layer is found under the char, the charred areahas the same appearance. It is concluded that the char formationtherefore may be the same in both cases. This fact may suggest thatthe carbon char is formed as a result of the carbon flux returnedfrom the plasma. Another possible mechanism of char formation,incomplete Teflon decomposition, seems to be inconsistent withobservations, that is, the presence of the metal and silicon layerbetween the Teflon surface and the char.
The microscopic structure of the charred areas is similar for dif-ferent conditions under which the MicroPPT was fired. For instance,the effect of the discharge energy on the char microstructure is shownin Figs. 5 and 6. One can see that shapes and size characteristics arethe same for two different energy levels. In both cases the carbonstructures have a size of about several micrometers.
It should be noted that this conclusion about the origin of thecarbon charring formation (due to the carbon flux returned fromthe plasma) could also be supported by qualitative comparison ofthe charring with the carbon structures developed during carbon de-position by DC electric arc discharge.15 The shape and size (aboutseveral micrometers) of the carbon microstructures are very sim-ilar in both cases. This comparison clearly indicates that similarmicrostructures develop during the carbon deposition and unstablegrowth of the carbon nanotubes.15

980 KEIDAR ET AL.
Fig. 3a Image and XEDS results for Area 1. The main peak corre-sponds to carbon.
Fig. 3b Image and XEDS results for Area 2. The main peak corre-sponds to silicon.
Fig. 4 Charred area image and XEDS results. The main peaks corre-spond to carbon and flourine.
IV. Model of the Plasma Layer Nearthe Ablated Surface
In this section we describe a model of the plasma layer near theevaporating surface, with application to a micro-PPT that is shownschematically in Fig. 1. During the discharge, the plasma densitynear the propellant face is large (on the order of 1023–1024 m−3,Refs. 16, 17) and therefore a fluid approach can be used. The plasma-layer model includes the following features: Teflon ablation, plasmaenergy balance, heat transfer from the plasma to the Teflon, currentspreading in the near field, and an equivalent resistance–inductance–capacitance (RLC) electrical circuit model. Mechanisms of energytransfer from the plasma column to the wall of the Teflon includeheat transfer by particle convection and by radiation. It is assumedthat within the plasma layer all parameters vary in the radial direc-tion r . The electron-energy-balance equation can be written in theform,16,17
3
2n
dTe
dt= Q J − Qr − QF (1)
The one-dimensional time-dependent model of the plasma layeris considered and Eq. (1) depends on the coordinate r alongthe propellant face (see Fig. 1). The radiation heat flux Qr andparticle-convection heat flux QF depend on the plasma density andtemperature.16,17 The one-dimensional time-dependent model of theplasma layer is considered and Eq. (1) depends on the coordinate ralong the propellant face (see Fig. 1). The radiation heat flux Qr andparticle-convection heat flux QF depend on the plasma density andtemperature.16,17 According to Ref. 18, the radiation in continuumfrom a C + 2F plasma in the considered parameter range provides

KEIDAR ET AL. 981
a)
b)
Fig. 5 Charred area image. Effect of the discharge energy: a) 1 J andb) 3 J.
the main contribution. The radiation energy flux Qr includes the ra-diation for a continuum spectrum based on a theoretical model.19,20
In the expression for Qr = AZ 2i neT 1/2
e (1 + χg), the coefficient Ais a constant (1.6 × 10−38 in SI units) and χg = Eg/Te, with Eg asthe energy of the lowest excited state. The particle convection fluxQF includes energy associated with electron and ion fluxes to theTeflon and out of the plume, which lead to plasma cooling. The in-puts for the model are thruster geometry, Teflon material properties,and Teflon equilibrium-pressure dependence on the surface temper-ature. More details about the model and computational methods canbe found elsewhere.21
The Teflon surface temperature is calculated from the heat-transfer equation with boundary conditions that take into accountvaporization heat, surface radiation, and heat conductivity. Calcu-lations show that surface radiation is negligibly small in the caseconsidered. The solution of this equation is considered for limitingcases of substantial and small ablation rates very similar to thosedescribed in Refs. 16 and 17. The change of the Teflon surfaceproperties due to char formation was not taken into account.
The Teflon ablation computation is based on a recently devel-oped kinetic ablation model.22,23 In the transition region betweenthe plasma and the ablated surface, two different layers are distin-guished: (1) a kinetic nonequilibrium layer adjusted to the surfacewith a thickness of about one mean free path; and (2) a collision-dominated layer with thermal and ionization nonequilibrium. Thesolution for these two layers is coupled with the quasi-neutral plasmathat allows the calculation of the ablation rate. The energy input inEq. (1) depends upon the current density distribution near the ab-
a)
b)
Fig. 6 Charred area image (high magnification). Effect of the dis-charge energy: a) 1 J and b) 3 J.
lated surface. In order to calculate the current density, the magneticfield distribution in the thruster near field is obtained. The mag-netic field in the near-field plasma plume is calculated from themagnetic transport equation in the following form:
∂B∂t
= ∇2B(σµ)
− ∇ ×(
j × B(en)
)+ ∇ × (V × B) (2)
We assume that the magnetic field has only an azimuthal componentand neglect the displacement current. Various terms on the right-hand side of Eq. (2) may have importance in different regions ofthe plasma plume and therefore a general end-to-end plasma-plumeanalysis requires keeping all terms in the equation. In the case ofthe near plume of the micro-PPT, with a characteristic scale lengthof about 1 cm, the magnetic Reynolds number Rem = µσ LV � 1(where V is the characteristic velocity ∼104 m/s) and therefore thelast term can be neglected. Our estimate also shows that the Hallparameter ωτ � 1 if the plasma density near the Teflon surfacen > 1023 m−3. Therefore in the case considered the second term canalso be neglected and Eq. (2) can be reduced to a magnetic diffusionequation having the following form:
∂B∂t
= 1
(σµ)∇2B (3)
The current-density distribution was then calculated from the mag-netic field distribution. This allows calculation of the Teflon tem-perature distribution from the energy input in Eq. (1). More detailsabout the current and magnetic field distributions in the near fieldare presented in a parallel paper.21

982 KEIDAR ET AL.
Fig. 7 Current-density distribution (normalized) in the near field ofthe 3.6-mm-diam micro-PPT. Electrode geometry is shown for reference.
Fig. 8 Teflon surface-temperature (K) temporal and radial (betweenelectrodes) variation for micro-PPT design with diameter 3.6 mm.
V. Teflon Surface Temperature and Ablation RateThe calculated current density distribution near the Teflon surface
in the r–z plane is shown in Fig. 7. One can see that the currentdensity has a minimum in the middle between electrodes due to thecurrent spreading in the r–z plane. According to the energy balance[Eq. (1)] and the heat-transfer equation at the Teflon surface,16,17
the surface temperature should depend on the current density. Thespatial and temporal variation of the Teflon surface temperature isshown in Fig. 8. One can see that the Teflon surface temperature isnonuniform in the radial direction. It can be seen that in the 3.6-mm-diam thruster, the temperature has a minimum at radial distances of1.1–1.3 mm.
Because the Teflon ablation rate grows nonlinearly with the sur-face temperature,22,23 the model predicts a lower rate of ablation inthe areas where the surface temperature has a minimum. By takingthis into account, the effect of the temperature distribution may berelated to the preferential charring of the Teflon surface observedexperimentally, as shown in Fig. 9. It is interesting to note that com-parison of the calculated temperature field and ablation rate with thephotograph of the Teflon surface (Fig. 9) shows that the area withsurface temperature and ablation rate minimum corresponds to thecharred area in the case of the 3.6-mm-diam thruster.
VI. Effect of Discharge EnergyIn this section we investigate the effect of the discharge energy
on ablation and char formation. In the model it is assumed that the
Fig. 9 Teflon surface photograph and the ablation rate (kg/m2s) in thecase of a 3.6-mm-diam micro-PPT.
Fig. 10 Ablation rate temporal variation (in the midway between elec-trodes) for discharge energies of 1, 3, and 6 J for 6.3-mm-diam two-electrode MicroPPT.
current is produced by an underdamped RLC circuit and has theform
I (t) = Ip sin(αt) · exp(−βt)
where α = (1/LC − β2), β = R/2L , and Ip = Uo/(Lα). From thecomparison of I (t) with the experimental current waveform in thecase of C = 0.3 µF it is estimated that R = 0.3 � and L = 3.6 ×10⁻⁷ H.
We consider the effect of the discharge energy 0.5(CU 2o ) on the
Teflon surface temperature and the Teflon ablation rate. These resultsare shown in Fig. 10. One can see that with energy increase, theTeflon ablation rate increases as shown in Fig. 10. The total ablationrate is also shown and compared with measured value. It can be seenthat generally good agreement is found. These results suggest thatincreasing the discharge energy for constant capacitance leads toenhanced Teflon ablation (and carbon char ablation) and thereforeprevents char formation.
It was shown experimentally that the energy level affects theTeflon ablation. These experiments were conducted in a glass belljar under a pressure of 10−6 torr. The char patterns for three differentenergies are shown in Fig. 11 after continuous firing for 2 h at 1 Hz.There have been no experimental observations of cases where char

KEIDAR ET AL. 983
Fig. 11 Photograph of the micro-PPT propellant surface for discharge energies of 1, 3, and 6 J for 6.3-mm-diam two-electrode MicroPPT.
appeared, only to be cleaned up by subsequent discharges at the sameenergy. (Cleaning of the char formation by firing at higher dischargeenergies has been observed experimentally but is not consideredwithin the context of this effort.) For these tests a 1
4 -in.-diam two-electrode MicroPPT was energized using a 2.94-µF capacitor. Thecharge voltage ranged from 823 V for the 1.0-J case to 2016 V forthe 6.0-J case. Clearly these voltages are insufficient to cause thesurface breakdown needed for MicroPPT discharge initiation acrossa 1
4 -in.-diameter. Rather than complicate the test setup by using thethree-electrode MicroPPT configuration,8,9 an auxiliary sparkplug,fired at 0.5 J, was used to initiate the discharge on command. Anauxiliary sparkplug effect on char formation was not observed.
One can see that in the case of small energy, charring is observedin the area between the electrodes, while in the case of large energy,there is no charring. The middle-energy case shows a level of charbetween the two extrema. This effect can be partially explained interms of our model, which shows that higher discharge energy leadsto higher Teflon surface temperature and higher ablation rate.
VII. SummaryA microscopic analysis of the charred areas showed that they
mainly contained carbon. In some cases, metal and silicon layerswere found under the carbon char. The metal deposition originatedfrom electrode erosion, whereas the silicon is assumed to comefrom the diffusion pump. In fact, when a turbopumping system wasused, no silicon was obtained on the Teflon surface. In those caseswhere no metal layer was found under the char, the charred areahad the same appearance. It is concluded that the char formationtherefore may be the same in both cases, independent of the metallayer formed between the Teflon surface and the carbon char. In ad-dition, particle simulation of the near-field plasma plume predicts asubstantial population of ions having negative axial velocity up toabout 10 km/s (Refs. 12 and 21). This ion population creates back-flow contamination that flows mainly onto the thruster itself.12,21
The carbon ions have a larger negative velocity due to their highermobility, which results in their domination in the backflux to thethruster. More details about these simulations can be found in aparallel publication.21 Based on our observations and particle sim-ulation it can be suggested that the carbon char is formed as a resultof the carbon flux returned from the plasma rather than from incom-plete decomposition of the Teflon.
A model of the plasma layer near the Teflon surface of a micro-PPT was developed that allows self-consistent calculation of theTeflon surface temperature and ablation rate. It was found that thepropellant size had an important effect on the Teflon surface tem-perature distribution and the ablation rate. Generally we found thatthe Teflon surface temperature is nonuniform in the radial direc-tion. For instance, in the 3.6-mm-diam thruster, the temperaturehas a minimum at radial distances of 1.1–1.3 mm. The compari-son of the temperature field and the ablation-rate distribution witha photograph of the Teflon surface shows that the area with surfacetemperature and ablation rate minima corresponded to the charredarea in the case of the 3.6-mm thruster. This suggests that the char-
ring may be related to the temperature effect. An analysis of theeffect of the discharge energy E on the temperature distributionshowed that the Teflon surface temperature and the ablation ratecan be increased by increasing E . At the same time, an increase incapacitance leads generally to a smaller ablation rate, though thiseffect can be considered to be marginal.
AcknowledgmentsThe first two authors gratefully acknowledge the partial fi-
nancial support of the Air Force Office of Scientific Researchthrough Grant F49620-02-1-0084. The AFRL authors were alsopartially supported through the Air Force Office of Scientific Re-search with Mitat Birkan as Program Manager. We also acknowl-edge John Mansfield, Chris Palenik, Joe Lohrum, and Frances NSkomurski from the University of Michigan for help with scan-ning electron microscopy analyses. The authors also acknowledgeR. L. Burton (University of Illinois at Urbana–Champaign), I. I.Beilis (Tel Aviv University), and R. Aharonov (IonBond LLC) forvaluable discussions.
References1Burton, R. L., and Turchi, P. J., “Pulsed Plasma Thruster,” Journal of
Propulsion and Power, Vol. 14, No. 5, 1998, pp. 716–735.2Vondra, R. J., and Thomassen, K. I., “Flight Qualified Pulsed Plasma
Thruster for Satellite Control,” Journal of Spacecraft and Rockets, Vol. 11,No. 9, 1974, pp. 613–617.
3Turchi, P. J., “Directions for Improving PPT Performance,” Proceedingsof the 25th International Electric Propulsion Conference, Vol. 1, The ElectricPropulsion Society, Worthington, OH, 1998, pp. 251–258.
4Choueiri, E. Y., “System Optimization of Ablative Pulsed PlasmaThruster for Stationkeeping,” Journal of Spacecraft and Rockets, Vol. 33,No. 1, 1996, pp. 96–100.
5Spores, R. A., Cohen, R. B., and Birkan, M., “The USAF ElectricPropulsion Program,” Proceedings of the 25th International Electric Propul-sion Conference, Vol. 1, The Electric Propulsion Society, Worthington, OH,1998, 1997, p. 1.
6Dunning, J. W., Benson, S., and Oleson, S., “NASA’s Electric Propul-sion Program,” IEPC Paper 01-002, The Electric Propulsion Society,Worthington, OH, Oct. 2001.
7Zakrzwsky, C., Benson, S., Sanneman, P., and Hoskins, A., “On-OrbitTesting of the EO-1 Pulsed Plasma Thruster,” AIAA Paper 2002-3973, July2002.
8Spanjers, G. G., White, D., Schilling, J., Bushman, S., Lake, J., andDulligan, M., “AFRL MicroPPT Development for the TEchSat21 Flight,”IEPC Paper 2001-166, The Electric Propulsion Society, Worthington, OH,Oct. 2001.
9Spanjers, G. G., Bromaghim, D. R., Lake, C. J., Dulligan, M., White,D., Schilling, J. H., Bushman, S. S., Antonsen, E. L., Burton, R. L., Keidar,M., and Boyd, I. D., “AFRL Micro-PPT Development for Small SpacecraftPropulsion,” AIAA Paper 2002-3974, July 2002.
10Boyd, I. D., Keidar, M., and McKeon, W., “Modeling of a Pulsed PlasmaThruster from Plasma Generation to Plume Far Field,” Journal of Spacecraftand Rockets, Vol. 37, No. 3, 2000, pp. 399–407.
11Keidar, M., and Boyd, I. D., “Device and Plume Model of an Elec-trothermal Pulsed Plasma Thruster,” AIAA Paper 2000-3430, July 2000.
12Keidar, M., and Boyd, I. D., “Electromagnetic Effects in the Near FieldPlume Exhaust of a Pulsed Plasma Thruster,” AIAA Paper 2001-3638, July2001.

984 KEIDAR ET AL.
13Gulczinski, F., Dulligan, M., Lake, J., and Spanjers, G. G.,“Micropropulsion Research at AFRL,” AIAA Paper 2000-3255, July2000.
14Antonsen, E., Burton, R., and Spanjers, G. G., “High Resolution LaserDiagnostics in Millimeter-Scale Micro Pulsed Plasma Thrusters,” IEPCPaper 2001-157, The Electric Propulsion Society, Worthington, OH,Oct. 2001.
15Ajayan, P. M., Redlich, Ph., and Ruhle, M., “Balance of GraphiteDeposition and Multi-Shell Carbon Nanotube Growth in the CarbonArc Discharge,” Journal of Materials Research, Vol. 12, No. 1, 1997,pp. 244–252.
16Keidar, M., Boyd, I. D., and Beilis, I. I., “Electrical Discharge in theTeflon CAvity of a Co-Axial Pulsed Plasma Thruster,” IEEE Transactionson Plasma Science, Vol. 28, No. 2, 2000, pp. 376–385.
17Keidar, M., Boyd, I. D., and Beilis, I. I., “Model of an ElectrothermalPulsed Plasma Thruster,” Journal of Propulsion and Power, Vol. 19, No. 3,2003, pp. 424–430.
18Zemskov, A. I., Prut, V. V., and Khrabrov, V. A., “Pulsed Discharge
in Dielectric Chamber,” Soviet Physics—Technical Physics, Vol. 17, 1972,pp. 285–289.
19Kozlov, G. I., Kuznetsov, V. A., and Masyukov, V. A., “Radia-tive Losses by Argon Plasma and the Emissive Model of a Continu-ous Optical Discharge,” Soviet Physics—JETP, Vol. 39, No. 3, 1974,pp. 463–468.
20Raizer, Y. P., Gas Discharge Physics, Moscow, Nauka, 1987 [inRussian], p. 229.
21Keidar, M., Boyd, I. D., Antonsen, E. L., and Spanjers, G. G., “Elec-tromagnetic Effects in the Near Field Plume Exhaust of a Micro-PulsedPlasma Thruster,” Journal of Propulsion and Power, Vol. 20, No. 4, 2004,pp. 961–969.
22Keidar, M., Fan, J., Boyd, I. D., and Beilis, I. I., “Vaporization of HeatedMaterials into Discharge Plasmas,” Journal of Applied Physics, Vol. 89,No. 6, 2001, pp. 3095–3098.
23Keidar, M., Boyd, I. D., and Beilis, I. I., “On the Model of Teflon Ab-lation in an Ablation-Controlled Discharge,” Journal of Physics D: AppliedPhysics, Vol. 34, June 2001, pp. 1675–1677.


![INDEX [] · Chemical rocket propellant performance analysis, 40, 41, 160-196 Choked flow condition, 58 Chugging combustion instability, 349 Classification of: electric thrusters,](https://static.fdocuments.net/doc/165x107/5ec26f65ed7ffe3176421607/index-chemical-rocket-propellant-performance-analysis-40-41-160-196-choked.jpg)


![Pinot-G · Pinot – Type G - 01 Number of Thrusters 4 Number of Tanks 2 Propellant HNP225 Inlet Pressure Range [MPa] 0.3 – 2.4 Wet Mass [kg] 10 Usable Propellant [kg] 0.4 Dimensions](https://static.fdocuments.net/doc/165x107/601bcd77a3ae075ed0510d28/pinot-g-pinot-a-type-g-01-number-of-thrusters-4-number-of-tanks-2-propellant.jpg)

