Promise of new imaging technologies for assessing ovarian ... fileSpectral, color-flow and power...
29
Animal Reproduction Science 78 (2003) 371–399 Promise of new imaging technologies for assessing ovarian function Jaswant Singh a , Gregg P. Adams a , Roger A. Pierson b,∗ a Veterinary Biomedical Sciences, Western College of Veterinary Medicine, University of Saskatchewan, 52 Campus Drive, Saskatoon, Saskatchewan, Canada S7N 5B4 b Obstetrics Gynecology and Reproductive Sciences, Royal University Hospital, University of Saskatchewan, 103 Hospital Drive, Saskatoon, Saskatchewan, Canada S7N 0W8 Abstract Advancements in imaging technologies over the last two decades have ushered a quiet revolution in research approaches to the study of ovarian structure and function. The most significant changes in our understanding of the ovary have resulted from the use of ultrasonography which has enabled sequential analyses in live animals. Computer-assisted image analysis and mathematical modeling of the dynamic changes within the ovary has permitted exciting new avenues of research with readily quantifiable endpoints. Spectral, color-flow and power Doppler imaging now facilitate physiologic interpretations of vascular dynamics over time. Similarly, magnetic resonance imaging (MRI) is emerging as a research tool in ovarian imaging. New technologies, such as three-dimensional ultrasonography and MRI, ultrasound-based biomicroscopy and synchrotron-based techniques each have the potential to enhance our real-time picture of ovarian function to the near-cellular level. Collectively, information available in ultrasonography, MRI, computer-assisted image analysis and mathematical modeling heralds a new era in our understanding of the basic processes of female and male reproduction. © 2003 Elsevier Science B.V. All rights reserved. Keywords: Follicle development; Folliculodynamics; Image analysis; MRI; Three-dimensional ultrasonography; Ultrasonography; Ultrasound 1. Introduction Since the time of de Graaf, studies of follicle development involved data gathered from gross and histologic examination of excised ovaries (Jocelyn and Setchell, 1972). Even the most detailed studies of static specimens have excluded the fundamental processes of ∗ Corresponding author. Tel.: +1-306-966-4458; fax: +1-306-966-8796. E-mail address: [email protected] (R.A. Pierson). 0378-4320/03/$ – see front matter © 2003 Elsevier Science B.V. All rights reserved. doi:10.1016/S0378-4320(03)00100-3
Transcript of Promise of new imaging technologies for assessing ovarian ... fileSpectral, color-flow and power...
Animal Reproduction Science 78 (2003) 371–399
Promise of new imaging technologies forassessing ovarian function
Jaswant Singha, Gregg P. Adamsa, Roger A. Piersonb,∗a Veterinary Biomedical Sciences, Western College of Veterinary Medicine, University of Saskatchewan,
52 Campus Drive, Saskatoon, Saskatchewan, Canada S7N 5B4b Obstetrics Gynecology and Reproductive Sciences, Royal University Hospital, University of Saskatchewan,
103 Hospital Drive, Saskatoon, Saskatchewan, Canada S7N 0W8
Abstract
Advancements in imaging technologies over the last two decades have ushered a quiet revolutionin research approaches to the study of ovarian structure and function. The most significant changesin our understanding of the ovary have resulted from the use of ultrasonography which has enabledsequential analyses in live animals. Computer-assisted image analysis and mathematical modelingof the dynamic changes within the ovary has permitted exciting new avenues of research with readilyquantifiable endpoints. Spectral, color-flow and power Doppler imaging now facilitate physiologicinterpretations of vascular dynamics over time. Similarly, magnetic resonance imaging (MRI) isemerging as a research tool in ovarian imaging. New technologies, such as three-dimensionalultrasonography and MRI, ultrasound-based biomicroscopy and synchrotron-based techniques eachhave the potential to enhance our real-time picture of ovarian function to the near-cellular level.Collectively, information available in ultrasonography, MRI, computer-assisted image analysis andmathematical modeling heralds a new era in our understanding of the basic processes of female andmale reproduction.© 2003 Elsevier Science B.V. All rights reserved.
Keywords:Follicle development; Folliculodynamics; Image analysis; MRI; Three-dimensional ultrasonography;Ultrasonography; Ultrasound
1. Introduction
Since the time of de Graaf, studies of follicle development involved data gathered fromgross and histologic examination of excised ovaries (Jocelyn and Setchell, 1972). Eventhe most detailed studies of static specimens have excluded the fundamental processes of
∗ Corresponding author. Tel.:+1-306-966-4458; fax:+1-306-966-8796.E-mail address:[email protected] (R.A. Pierson).
0378-4320/03/$ – see front matter © 2003 Elsevier Science B.V. All rights reserved.doi:10.1016/S0378-4320(03)00100-3
372 J. Singh et al. / Animal Reproduction Science 78 (2003) 371–399
life and the mechanisms controlling them. Although knowledge gained from the study oftissue samples ex vivo has been considerable, a deeper understanding of structure–functionrelationships was obscured by the static nature of examination and considerable confusionabout kinetics of ovarian follicle growth and development prevailed. During the 1980s aperiod of enlightenment in ovarian biology began with the introduction of real-time, B-modeultrasonography. The ability to visualize changes in structure in a serial fashion, withoutinterruption or distortion of function, has revitalized the study of ovarian biology. Therehas been a paradigm shift in our approaches to hypothesis testing and our understanding offolliculogenesis in domestic animals. It is now commonplace in ovarian research to includeultrasonographic imaging to monitor daily patterns of follicle growth and regression, andthe ovarian response to experimental or therapeutic treatments.
Ultrasonography has heralded the way in medical imaging as a tool for ovarian research.Concurrently, continuous and rapid evolution of computer technology and medical electron-ics have created exciting new experimental and diagnostic capabilities in the analysis ofvisual data. The purpose of this manuscript is to provide an overview of imaging techniquesthat have been used in the study of ovarian function during the last two decades and tointroduce emerging techniques that hold future promise. We begin with real-time B-modeultrasonography and then venture through discussions of computer-assisted image anal-ysis, three-dimensional imaging, vascular imaging, ultrasound biomicroscopy, magneticresonance imaging (MRI), and synchrotron-based soft tissue X-ray imaging.
2. Ultrasonographic techniques in ovarian research
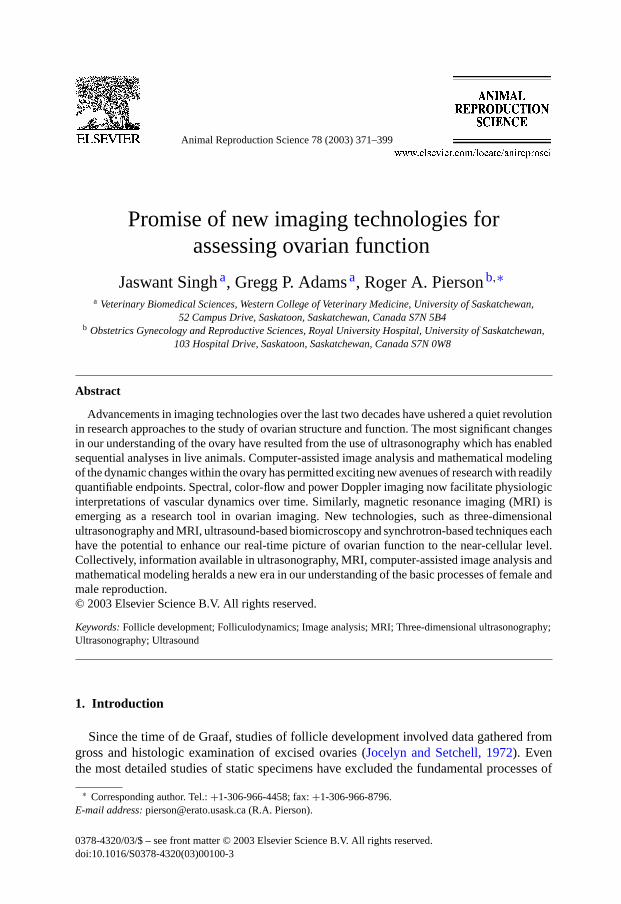
Gray-scale diagnostic ultrasonography is the most profound technological advance inthe field of large-animal research and clinical reproduction since the introduction of tran-srectal palpation and radioimmunoassay of circulating hormones(Ginther, 1986). Nowherehave the effects of imaging been more evident than in the changes in our understanding ofovarian physiology. Changes in the number of peer-reviewed publications involving ovarianultrasound imaging over the last 8 years illustrates widespread use of the technique for bothresearch and clinical applications (Fig. 1). The technique has been used most extensivelyin humans and the bovine species, however, the emphasis of the ultrasound studies done inhumans and animals is strikingly different. The distribution of studies in humans reflectsa preoccupation with the use of ultrasonography as a tool for clinical diagnosis (i.e. detec-tion and characterization of ovarian pathology), whereas the emphasis in animal studies ison ovarian physiology. More studies have been published on ovulation and follicular- andluteal-dynamics using the bovine model than in all other species combined. Interestingly,the use of ultrasonography has been reported frequently in both humans and animals forthe study of follicular stimulation and ovulation induction, but use of the technique foroocyte retrieval has attracted more attention in animal studies even though transvaginalultrasound-guided oocyte aspiration is the standard of practice in human assisted reproduc-tion programs (Fig. 1).
One of the best examples of the impact of imaging on our understanding of reproductivefunction is that of ultrasonography and the proof of the wave-phenomenon of folliculo-genesis. The wave theory of ovarian follicular development was originally proposed from
J. Singh et al. / Animal Reproduction Science 78 (2003) 371–399 373
Fig. 1. Demographics of publications on ultrasound-based ovarian research in human, cattle, horse and otherdomestic species over the last 8 years. Data were obtained by searching for keywords—(ultrasound or ultrasonog-raphy) and (ovary or follicle or corpus luteum) in Agricola, Medline and CAB databases for human, cattle andother species (sheep, goat, mare, camlids, pig). Based on the title and year of publication, number of publicationsfor each species were categorized into (i) folliculodynamics and luteal development, (ii) disease, (iii) assistedreproduction/IVF/superstimulation and (iv) other studies.
observations made in the bovine species (Rajakoski, 1960). It was based on gross and his-tologic evaluation of ovaries obtained from cows slaughtered on known days of the estrouscycle. From his detailed studies, Rajakoski concluded that two waves of antral folliclegrowth occurred during the estrous cycle. Others refuted the concept of wave phenom-ena and supported the notion that follicular growth is continuous and independent of thephases of the cycle (reviewed inSpicer and Echternkamp, 1986). Controversy surroundedthe wave theory for nearly three decades, until the first ultrasonographic study of the bovineovaries was reported in 1984 (Pierson and Ginther, 1984). Initial studies involved daily ultra-sonography to monitor changes in follicle populations in different size categories (Piersonand Ginther, 1986, 1987a,b, 1988a). Results of these studies supported the wave theorybut the population technique was not designed to monitor individually identified follicles;hence, the passage of an individual follicle from one size category to another could notbe detected, and detailed characteristics of wave emergence and follicle selection were
374 J. Singh et al. / Animal Reproduction Science 78 (2003) 371–399
inaccessible. Hallmark studies documenting the capability of monitoring individually iden-tified follicles soon followed (Ginther et al., 1989a,b; Knopf et al., 1989; Pierson and Ginther,1988b; Savio et al., 1988; Sirois and Fortune, 1988). This new capability created a flurryof interest and led to a series of advancements in our understanding of folliculogenesis andthe development of methods to control ovarian function in cattle and other species (Adams,1994, 1998, 1999; Fortune, 1993; Ginther et al., 1996, 2001). One of the most importantadvantages arising from the use of individual identity methods or the “non-identity” method(Ginther and Bergfelt, 1992) is the ability to normalize or centralize follicular and hormonaldata about a specific point of reference (e.g. ovulation, wave emergence, follicle selection).This capability led to the development of a conceptual model of the generic follicular wavethat provided an explanation of temporal relationships between endocrine and structuralchanges (Adams and Pierson, 1995). Incorporation of the wave concept has become an in-herent part of experimental design in studies of ovarian function ranging from the molecularlevel to the whole-animal and herd level.
The bovine model, derived from studies in mature non-pregnant cows, has since beenextended to other reproductive states and other species. The first study of follicular dynamicsduring pregnancy and the post-partum period in any species was in cattle (Pierson andGinther, 1986; Ginther et al., 1989c; Savio et al., 1990). The first study of follicle dynamicsduring the neonatal and pre-pubertal periods in any species also was in cattle in 1993(Adams et al., 1993; Evans et al., 1994a). Studies in other species soon followed, wavepatterns of follicle development were documented in each: camelids in 1990 (Adams et al.,1990), horses in 1993 (Bergfelt and Ginther, 1993), sheep and goats in 1994 (Ginther andKot, 1994; Ravindra et al., 1994), muskoxen—the first wild species in 1997 (Hoare et al.,1997), elk in 2001 (McCorkell et al., 2001, 2002), and most recently in humans (Baerwaldet al., 2002a,b, 2003). Despite the wide range of reproductive patterns represented by thesedifferent species (i.e. polyestrous, seasonally polyestrous, single and multiple ovulators,spontaneous and induced ovulators, distinct luteal and follicular phases), the fundamentalwave pattern of follicle development appears to be a widely preserved biologic phenomenon.
Ultrasound imaging technology has also revolutionized the study of the corpus luteum andhas led to a greater understand of the interactions between luteogenesis and folliculogenesis.For instance, it is now clear that luteal production of progesterone has a suppressive effecton the growth of the dominant follicle of a wave (Adams et al., 1992; Stock and Fortune,1993), and the magnitude of a luteal phase (progesterone concentration and duration) has animportant impact on the interwave interval, follicular health, oocyte competence and subse-quent luteal gland development. It has been shown that the luteal gland does not necessarilypass through a hemorrhagicum stage in mares (Pierson and Ginther, 1985; Ginther, 1995b).In addition, approximately 70% of bovine CL possess a fluid-filled cavity, the size of whichchanges during its lifespan (Kastelic et al., 1990b). In ultrasonographic studies, luteal tissuearea (Kastelic et al., 1990a) and echotexture (Singh et al., 1997) was directly related tocirculating and glandular concentrations of progesterone, and the presence of a fluid-filledcavity did not influence luteal function (Kastelic et al., 1990b). Ultrasonographic studieshave resulted in the characterization of short luteal phases during the peri-pubertal period(Evans et al., 1994b), post-partum period (Rajamahendran and Taylor, 1990), and duringseasonal recrudescence in sheep (Bartlewski et al., 1998) and elk (Adams, 1999). Luteal per-sistence has also been documented in relation to embryonic mortality (Kastelic and Ginther,
J. Singh et al. / Animal Reproduction Science 78 (2003) 371–399 375
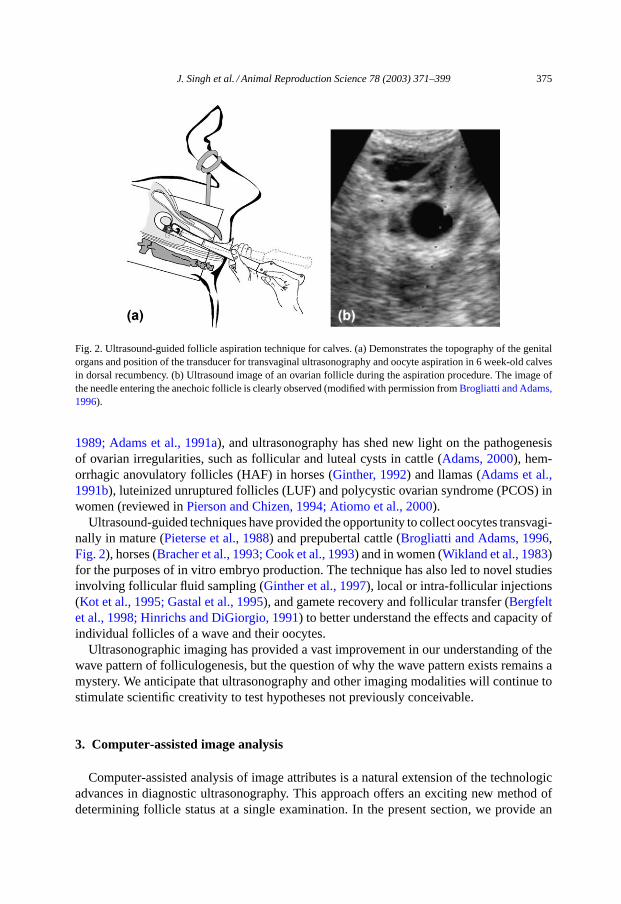
Fig. 2. Ultrasound-guided follicle aspiration technique for calves. (a) Demonstrates the topography of the genitalorgans and position of the transducer for transvaginal ultrasonography and oocyte aspiration in 6 week-old calvesin dorsal recumbency. (b) Ultrasound image of an ovarian follicle during the aspiration procedure. The image ofthe needle entering the anechoic follicle is clearly observed (modified with permission fromBrogliatti and Adams,1996).
1989; Adams et al., 1991a), and ultrasonography has shed new light on the pathogenesisof ovarian irregularities, such as follicular and luteal cysts in cattle (Adams, 2000), hem-orrhagic anovulatory follicles (HAF) in horses (Ginther, 1992) and llamas (Adams et al.,1991b), luteinized unruptured follicles (LUF) and polycystic ovarian syndrome (PCOS) inwomen (reviewed inPierson and Chizen, 1994; Atiomo et al., 2000).
Ultrasound-guided techniques have provided the opportunity to collect oocytes transvagi-nally in mature (Pieterse et al., 1988) and prepubertal cattle (Brogliatti and Adams, 1996,Fig. 2), horses (Bracher et al., 1993; Cook et al., 1993) and in women (Wikland et al., 1983)for the purposes of in vitro embryo production. The technique has also led to novel studiesinvolving follicular fluid sampling (Ginther et al., 1997), local or intra-follicular injections(Kot et al., 1995; Gastal et al., 1995), and gamete recovery and follicular transfer (Bergfeltet al., 1998; Hinrichs and DiGiorgio, 1991) to better understand the effects and capacity ofindividual follicles of a wave and their oocytes.
Ultrasonographic imaging has provided a vast improvement in our understanding of thewave pattern of folliculogenesis, but the question of why the wave pattern exists remains amystery. We anticipate that ultrasonography and other imaging modalities will continue tostimulate scientific creativity to test hypotheses not previously conceivable.
3. Computer-assisted image analysis
Computer-assisted analysis of image attributes is a natural extension of the technologicadvances in diagnostic ultrasonography. This approach offers an exciting new method ofdetermining follicle status at a single examination. In the present section, we provide an
376 J. Singh et al. / Animal Reproduction Science 78 (2003) 371–399
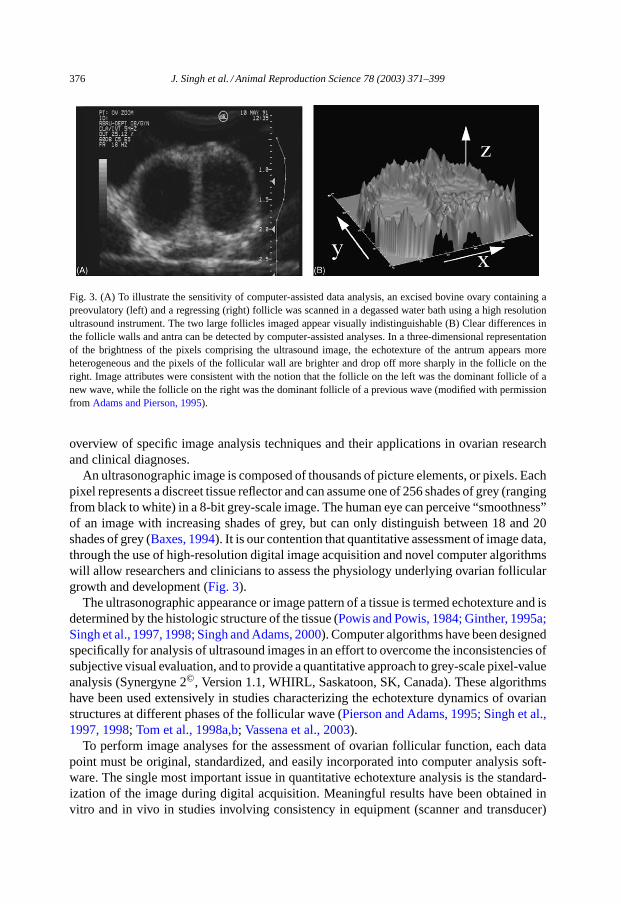
Fig. 3. (A) To illustrate the sensitivity of computer-assisted data analysis, an excised bovine ovary containing apreovulatory (left) and a regressing (right) follicle was scanned in a degassed water bath using a high resolutionultrasound instrument. The two large follicles imaged appear visually indistinguishable (B) Clear differences inthe follicle walls and antra can be detected by computer-assisted analyses. In a three-dimensional representationof the brightness of the pixels comprising the ultrasound image, the echotexture of the antrum appears moreheterogeneous and the pixels of the follicular wall are brighter and drop off more sharply in the follicle on theright. Image attributes were consistent with the notion that the follicle on the left was the dominant follicle of anew wave, while the follicle on the right was the dominant follicle of a previous wave (modified with permissionfrom Adams and Pierson, 1995).
overview of specific image analysis techniques and their applications in ovarian researchand clinical diagnoses.
An ultrasonographic image is composed of thousands of picture elements, or pixels. Eachpixel represents a discreet tissue reflector and can assume one of 256 shades of grey (rangingfrom black to white) in a 8-bit grey-scale image. The human eye can perceive “smoothness”of an image with increasing shades of grey, but can only distinguish between 18 and 20shades of grey (Baxes, 1994). It is our contention that quantitative assessment of image data,through the use of high-resolution digital image acquisition and novel computer algorithmswill allow researchers and clinicians to assess the physiology underlying ovarian folliculargrowth and development (Fig. 3).
The ultrasonographic appearance or image pattern of a tissue is termed echotexture and isdetermined by the histologic structure of the tissue (Powis and Powis, 1984; Ginther, 1995a;Singh et al., 1997, 1998; Singh and Adams, 2000). Computer algorithms have been designedspecifically for analysis of ultrasound images in an effort to overcome the inconsistencies ofsubjective visual evaluation, and to provide a quantitative approach to grey-scale pixel-valueanalysis (Synergyne 2©, Version 1.1, WHIRL, Saskatoon, SK, Canada). These algorithmshave been used extensively in studies characterizing the echotexture dynamics of ovarianstructures at different phases of the follicular wave (Pierson and Adams, 1995; Singh et al.,1997, 1998; Tom et al., 1998a,b; Vassena et al., 2003).
To perform image analyses for the assessment of ovarian follicular function, each datapoint must be original, standardized, and easily incorporated into computer analysis soft-ware. The single most important issue in quantitative echotexture analysis is the standard-ization of the image during digital acquisition. Meaningful results have been obtained invitro and in vivo in studies involving consistency in equipment (scanner and transducer)
J. Singh et al. / Animal Reproduction Science 78 (2003) 371–399 377
and machine settings (near-field, far-field, and overall gain) for multiple examinations ofthe same structures over many days (Singh et al., 1997, 1998; Tom et al., 1998a,b). It isimperative that automatic post-processing image manipulations (e.g. frame correlation) areturned off during digital acquisition. Post-acquisition image normalization of pixel valuesinvolves re-scaling the pixel values of each image to span the entire scale of 0 (black)to 255 (white), and is done to correct for inconsistencies in image digitization spanningmany days (Singh et al., 1998). However, the image normalization procedure cannot cor-rect for inconsistencies in scanner settings. It is also critical that the computer graphicsfiles are saved in a non-destructive and uncompressed format. Some file saving and filecompression algorithms (for example, JPEG and GIF formats) approximate (i.e. lose) orig-inal data. Although such compression does not affect human perception of subtle tones ofgrey, it renders images unsuitable for echotexture analysis. Once the computer has dig-itally acquired an ultrasound image, it may be manipulated like any other graphics file.In our research institute, we use a series of digital processing steps that allows us to ex-tract numerical data (spot and line analyses), enhance visual interpretation (region analy-sis and time-series analysis), and automate analysis of visual data (wavelet analysis andmathematical modeling).
3.1. Spot analysis
The simplest quantitative method to analyze the pixels comprising an ultrasound imageis to select one or multiple small circular areas of interest (Fig. 4A). The computer canreadily determine the precise values of all of the pixels (black= 0, white = 255) withinthe selected spot and provide an average value (mean pixel value) and a standard deviationvalue (pixel heterogeneity). This simple technique is conceptually similar to spot meteringtechniques in photography and may be used to compare the pixel values in various portionsof the image or among images at different time points. For example, portions of the follicleantrum and wall from sequential images may be evaluated to detect changes characteristicof follicular dominance, growth, atresia, impending ovulation, or luteal development andregression (Pierson and Adams, 1995; Singh et al., 1997, 1998; Tom et al., 1998a,b; Vassenaet al., 2003).
3.2. Line analysis
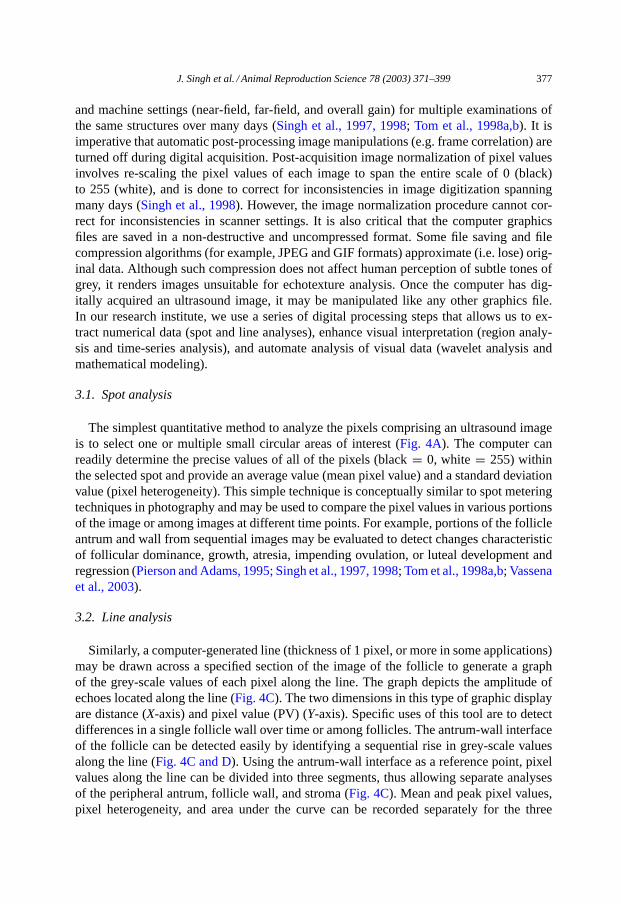
Similarly, a computer-generated line (thickness of 1 pixel, or more in some applications)may be drawn across a specified section of the image of the follicle to generate a graphof the grey-scale values of each pixel along the line. The graph depicts the amplitude ofechoes located along the line (Fig. 4C). The two dimensions in this type of graphic displayare distance (X-axis) and pixel value (PV) (Y-axis). Specific uses of this tool are to detectdifferences in a single follicle wall over time or among follicles. The antrum-wall interfaceof the follicle can be detected easily by identifying a sequential rise in grey-scale valuesalong the line (Fig. 4C and D). Using the antrum-wall interface as a reference point, pixelvalues along the line can be divided into three segments, thus allowing separate analysesof the peripheral antrum, follicle wall, and stroma (Fig. 4C). Mean and peak pixel values,pixel heterogeneity, and area under the curve can be recorded separately for the three
378 J. Singh et al. / Animal Reproduction Science 78 (2003) 371–399
Fig. 4. (A, B) Computer-assisted analysis of ultrasound image of an ovarian follicle. Portion of the follicle wall frompart A is enlarged in part B to display the picture-elements (pixels) forming the ultrasound image. Spot-analysis ofthe antrum is performed to measure the pixel value (black= 0, white= 255) and pixel heterogeneity by placingthe measuring circle at four different locations (a, b, c, d) over the follicle antrum to cover approximately 20% ofthe area in each quadrant. (C) Line-analysis of the peripheral antrum, follicle wall and stroma was performed byplacing a computer-generated line on the ultrasonographic image at 10 and 2 o’clock positions (e, f on part A, eon part B) and plotting the gray-scale values of pixels along the line. The pixel value graph was divided into threesegments (peripheral antrum, follicle wall, stroma). The antrum-wall interface was used as a reference point. (D)Pixel value (PV), pixel heterogeneity (Hetero), and the intercept and slope of the regression line of each segmentis recorded separately (modified with permission fromSingh et al., 1998).
segments. In addition, pixel values along the line may be used to obtain intercept and slopevalues of a regression line for each of the three segments separately (Fig. 4D). To increasethe precision and accuracy of analyses, numerical data may be averaged across multiplereadings by placing the line-tool repeatedly across the wall of same follicle. It is important tonote that care must be exercised to place the line in a region of the image free of artifacts (e.g.enhanced thorough transmission, shadowing, specular echoes, refraction, and beam-widthartifacts;Kremkau, 1989; Ginther, 1995a; Heller and Jehle, 1995).
3.3. Region analysis
Region analysis of a follicle involves overlaying a pixel-by-pixel “mesh” onto a selectedarea (Fig. 5A) for recording pixel values at the points of intersection and generating athree-dimensional framework (Fig. 5B) or a wire-frame model. A computer generated “skin”
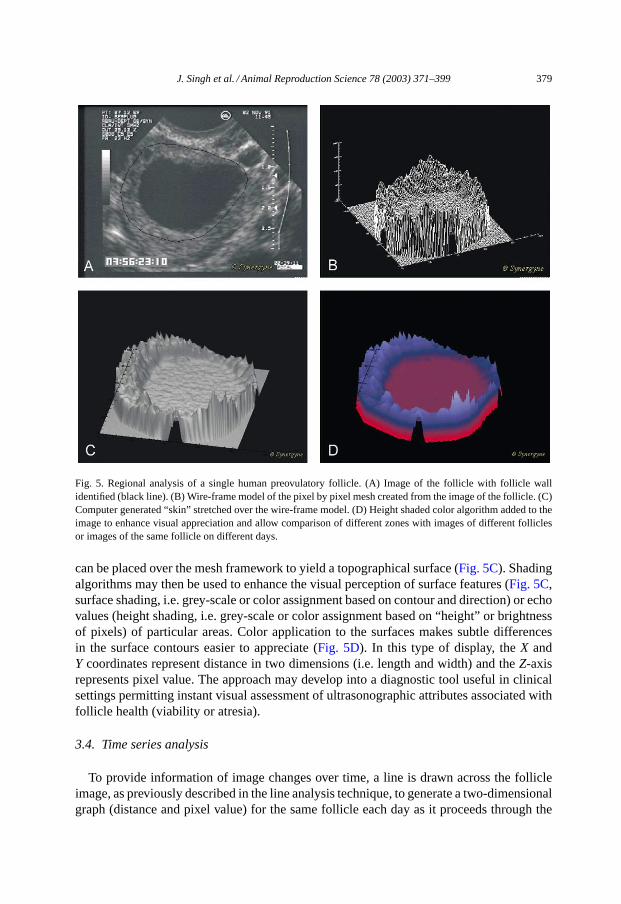
J. Singh et al. / Animal Reproduction Science 78 (2003) 371–399 379
Fig. 5. Regional analysis of a single human preovulatory follicle. (A) Image of the follicle with follicle wallidentified (black line). (B) Wire-frame model of the pixel by pixel mesh created from the image of the follicle. (C)Computer generated “skin” stretched over the wire-frame model. (D) Height shaded color algorithm added to theimage to enhance visual appreciation and allow comparison of different zones with images of different folliclesor images of the same follicle on different days.
can be placed over the mesh framework to yield a topographical surface (Fig. 5C). Shadingalgorithms may then be used to enhance the visual perception of surface features (Fig. 5C,surface shading, i.e. grey-scale or color assignment based on contour and direction) or echovalues (height shading, i.e. grey-scale or color assignment based on “height” or brightnessof pixels) of particular areas. Color application to the surfaces makes subtle differencesin the surface contours easier to appreciate (Fig. 5D). In this type of display, theX andY coordinates represent distance in two dimensions (i.e. length and width) and theZ-axisrepresents pixel value. The approach may develop into a diagnostic tool useful in clinicalsettings permitting instant visual assessment of ultrasonographic attributes associated withfollicle health (viability or atresia).
3.4. Time series analysis
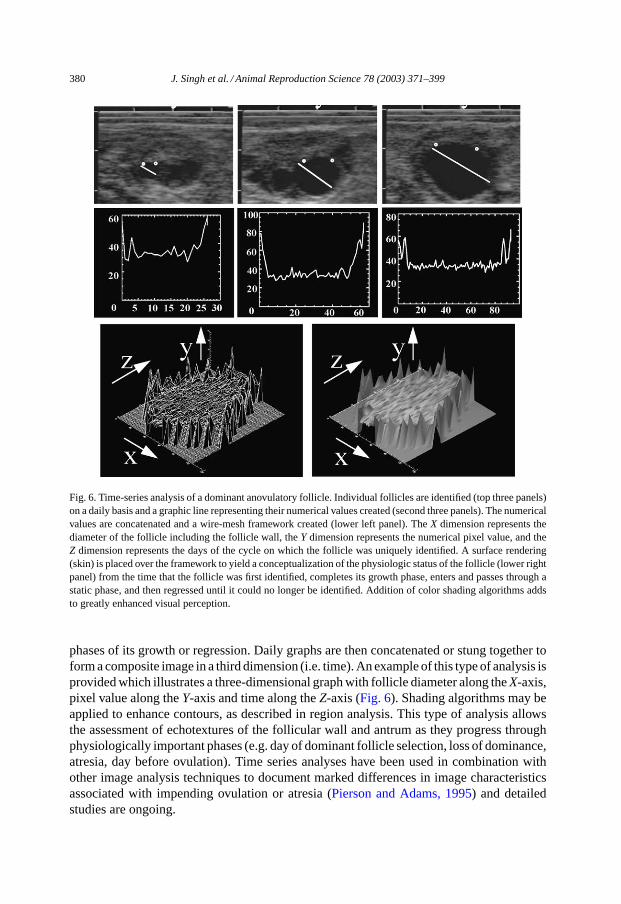
To provide information of image changes over time, a line is drawn across the follicleimage, as previously described in the line analysis technique, to generate a two-dimensionalgraph (distance and pixel value) for the same follicle each day as it proceeds through the
380 J. Singh et al. / Animal Reproduction Science 78 (2003) 371–399
Fig. 6. Time-series analysis of a dominant anovulatory follicle. Individual follicles are identified (top three panels)on a daily basis and a graphic line representing their numerical values created (second three panels). The numericalvalues are concatenated and a wire-mesh framework created (lower left panel). TheX dimension represents thediameter of the follicle including the follicle wall, theY dimension represents the numerical pixel value, and theZ dimension represents the days of the cycle on which the follicle was uniquely identified. A surface rendering(skin) is placed over the framework to yield a conceptualization of the physiologic status of the follicle (lower rightpanel) from the time that the follicle was first identified, completes its growth phase, enters and passes through astatic phase, and then regressed until it could no longer be identified. Addition of color shading algorithms addsto greatly enhanced visual perception.
phases of its growth or regression. Daily graphs are then concatenated or stung together toform a composite image in a third dimension (i.e. time). An example of this type of analysis isprovided which illustrates a three-dimensional graph with follicle diameter along theX-axis,pixel value along theY-axis and time along theZ-axis (Fig. 6). Shading algorithms may beapplied to enhance contours, as described in region analysis. This type of analysis allowsthe assessment of echotextures of the follicular wall and antrum as they progress throughphysiologically important phases (e.g. day of dominant follicle selection, loss of dominance,atresia, day before ovulation). Time series analyses have been used in combination withother image analysis techniques to document marked differences in image characteristicsassociated with impending ovulation or atresia (Pierson and Adams, 1995) and detailedstudies are ongoing.
J. Singh et al. / Animal Reproduction Science 78 (2003) 371–399 381
3.5. Automated and semi-automated follicle recognition
A series of specialized algorithms for isolating images of follicles and follicle walls fromsurrounding ovarian tissues has been developed and implemented experimentally (Sartyet al., 1997; Sarty et al., 1998; Krivanek et al., 1998). This advance illustrates the potentialfor automated image analysis and data interpretation in ovarian biology. Study of ovarianimaging is particularly well-suited to automated analysis because of the magnitude of theinterface between the follicular fluid and that of the soft tissues of the follicle wall. It ishoped that this approach may obviate the need for operator image interpretation and allowa standardized approach to interpreting ovarian and follicular physiology.
3.6. Wavelet packet texture analysis
Analysis of ultrasound images can be automated by wavelet packet texture recognitionto allow clinicians to discriminate between healthy and atretic follicles. The techniqueinvolves convolve/decimate transformations (Misiti et al., 1996) of pixel values within theregion of interest. In one study (Manivannan et al., 1999), the image of the follicular antrumwas transformed into 85 wavelet images using three scale-levels. Wavelet classification offollicular status (healthy or atretic) appeared to be more accurate through the use of energyand standard deviation texture statistics than Euclidean minimum distance values. Althoughin the early stages of development, energy texture measurements based on three levels ofwavelet packet transform, with or without further pure-scale transformations, hold potentialas a diagnostic tool for classifying follicles.
3.7. Mathematical modeling
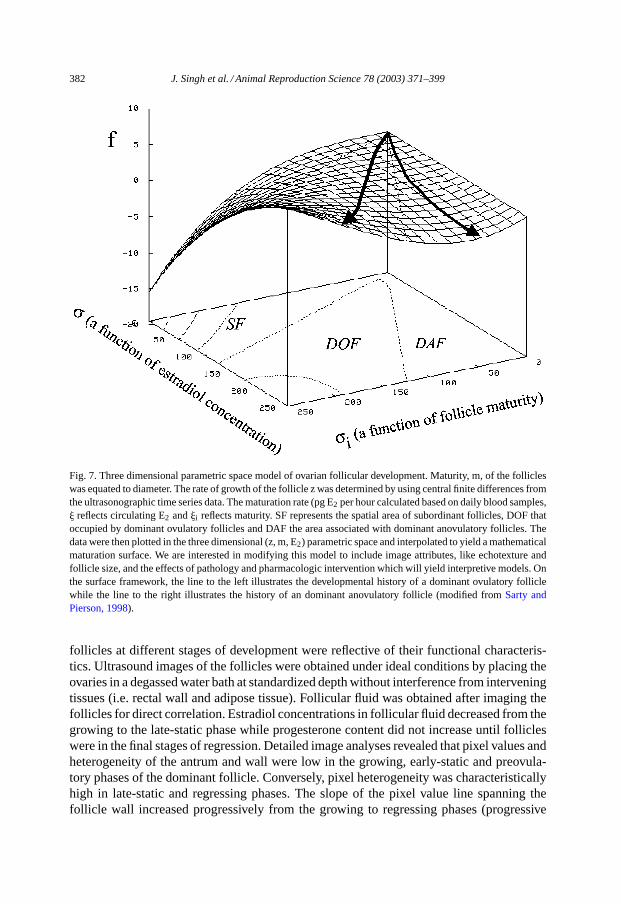
An interpretive mathematical approach may allow inference of hormone levels calculatedfrom image data and thereby obviate the need for routine hormonal analyses. The procedureinvolves the integration of pixel-value image attributes into a comprehensive model whichincludes a mathematical description of the growth and regression of ovarian follicles in acompetitive environment under the influence of FSH, LH, estradiol and other hormones(Sarty and Pierson, 1998, Fig. 7). In the model’s simplest form, the growth of every follicleis governed by a first order, non-linear differential equation where the follicle maturity ismeasured by intrafollicular or circulating estradiol concentrations and image attributes (e.g.ultrasonography, MRI). Successful development of this type of modeling would provide thecapability of assessing status on the basis of a single examination (diagnosis) and predictingthe imminence of events (e.g. ovulation or the ovulatory potential of a follicle, optimal timefor oocyte retrieval for IVF, optimal superstimulatory treatment regimen).
3.8. Physiological correlates of image attributes
In an initial characterization study, high-resolution ultrasound images of bovine follicleswere obtained from ovaries excised at specific phases of follicular development (i.e. growth,early-static, late-static and regressing phases;Singh et al., 1998). The objective of the studywas to determine whether quantitative changes in echotexture of dominant and subordinate
382 J. Singh et al. / Animal Reproduction Science 78 (2003) 371–399
Fig. 7. Three dimensional parametric space model of ovarian follicular development. Maturity, m, of the follicleswas equated to diameter. The rate of growth of the follicle z was determined by using central finite differences fromthe ultrasonographic time series data. The maturation rate (pg E2 per hour calculated based on daily blood samples,� reflects circulating E2 and�i reflects maturity. SF represents the spatial area of subordinant follicles, DOF thatoccupied by dominant ovulatory follicles and DAF the area associated with dominant anovulatory follicles. Thedata were then plotted in the three dimensional (z, m, E2) parametric space and interpolated to yield a mathematicalmaturation surface. We are interested in modifying this model to include image attributes, like echotexture andfollicle size, and the effects of pathology and pharmacologic intervention which will yield interpretive models. Onthe surface framework, the line to the left illustrates the developmental history of a dominant ovulatory folliclewhile the line to the right illustrates the history of an dominant anovulatory follicle (modified fromSarty andPierson, 1998).
follicles at different stages of development were reflective of their functional characteris-tics. Ultrasound images of the follicles were obtained under ideal conditions by placing theovaries in a degassed water bath at standardized depth without interference from interveningtissues (i.e. rectal wall and adipose tissue). Follicular fluid was obtained after imaging thefollicles for direct correlation. Estradiol concentrations in follicular fluid decreased from thegrowing to the late-static phase while progesterone content did not increase until follicleswere in the final stages of regression. Detailed image analyses revealed that pixel values andheterogeneity of the antrum and wall were low in the growing, early-static and preovula-tory phases of the dominant follicle. Conversely, pixel heterogeneity was characteristicallyhigh in late-static and regressing phases. The slope of the pixel value line spanning thefollicle wall increased progressively from the growing to regressing phases (progressive
J. Singh et al. / Animal Reproduction Science 78 (2003) 371–399 383
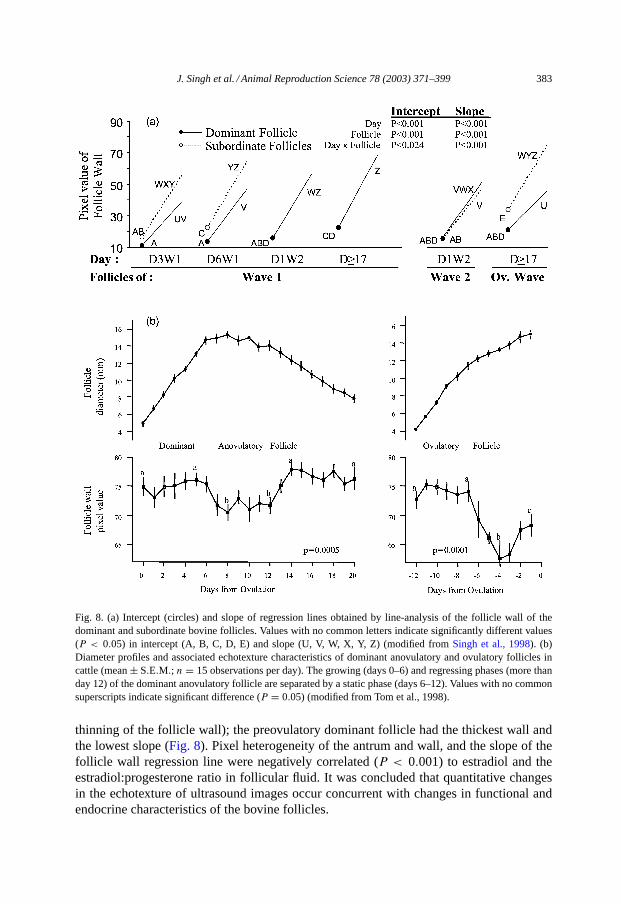
Fig. 8. (a) Intercept (circles) and slope of regression lines obtained by line-analysis of the follicle wall of thedominant and subordinate bovine follicles. Values with no common letters indicate significantly different values(P < 0.05) in intercept (A, B, C, D, E) and slope (U, V, W, X, Y, Z) (modified fromSingh et al., 1998). (b)Diameter profiles and associated echotexture characteristics of dominant anovulatory and ovulatory follicles incattle (mean± S.E.M.; n = 15 observations per day). The growing (days 0–6) and regressing phases (more thanday 12) of the dominant anovulatory follicle are separated by a static phase (days 6–12). Values with no commonsuperscripts indicate significant difference (P = 0.05) (modified from Tom et al., 1998).
thinning of the follicle wall); the preovulatory dominant follicle had the thickest wall andthe lowest slope (Fig. 8). Pixel heterogeneity of the antrum and wall, and the slope of thefollicle wall regression line were negatively correlated (P < 0.001) to estradiol and theestradiol:progesterone ratio in follicular fluid. It was concluded that quantitative changesin the echotexture of ultrasound images occur concurrent with changes in functional andendocrine characteristics of the bovine follicles.
384 J. Singh et al. / Animal Reproduction Science 78 (2003) 371–399
When the echotexture of bovine follicles was studied by in vivo imaging, time-relatedchanges in the walls and antra of dominant ovarian follicles were temporally associatedwith developmental phases of the dominant follicle as determined by serial examinations(Tom et al., 1998b). The growing phase of the dominant follicle was characterized by highpixel values of the follicle wall and decreasing antral heterogeneity. The early static phasewas marked by a drop in pixel values and increased antral heterogeneity during the latestatic phase. The regressing phase was characterized by high mean pixel values of thefollicle wall and a heterogeneous antrum (Fig. 8b). The ovulatory follicle and the dominantanovulatory follicle of Wave 1 were similar in that pixel value of the wall began to decrease6 days after wave emergence. However, pixel values of the wall were substantially lowerin images of the preovulatory follicle than those observed in the anovulatory follicle, andvalues for the ovulatory follicle subsequently began to increase as ovulation approached.Perhaps the observed decreases in pixel values of the dominant follicle are indicative ofovulatory potential and presage the functional transition of the follicle to a corpus luteum.This hypothesis was supported by observations reported in other studies in which the wallsof late growing anovulatory and ovulatory dominant bovine follicles (Adams and Pierson,1995) and human preovulatory follicles (Martinuk et al., 1992) exhibited darker shades ofgrey than those of atretic follicles.
On the premise that changes in follicle image attributes (Singh et al., 1998; Tom et al.,1998;Manivannan et al., 1999) are direct reflections of changes in follicle structure, a his-tomorphometric study of bovine follicles of known stages of development was performed(Singh and Adams, 2000). The thickness of the follicle wall and granulosa layer, and vas-cularity of the theca interna of first wave dominant and subordinate follicles decreasedprogressively from growing and early-static phases to the regressing phase. In general,glandular cells, such as granulosa, theca and luteal cells appeared to be less echoic than theconnective tissue stroma of the ovary. For instance, the ultrasound image of the mid-cyclebovine corpus luteum (maximal luteal cell volume at 56%) was darker than the early (an-giogenic) or regressing luteal glands (luteal cells volume= 41%;Singh et al., 1997). Thus,thinning of the follicle wall during regression (Singh and Adams, 2000) resulted in a morerapid transition from the antrum (low pixel value) to the connective tissue stroma (highpixel value) leading to steeper slope values for the follicle wall (Fig. 8a). The preovulatoryfollicle had the thickest follicle wall, lowest cell densities in the granulosa and theca internalayers, and highest vascularity and edema in the theca interna (Singh and Adams, 2000), allof which are associated with the lowest pixel heterogeneity value and the lowest regressionline slope value (Singh et al., 1998; Tom et al., 1998b). Follicle regression was characterizedby detachment and release of granulosa cells from the follicle wall into the antrum (Singhand Adams, 2000). The antrum of healthy bovine follicles had very low mean pixel valueswhile pixel heterogeneity was high in dominant follicles committed to atresia (Singh et al.,1998; Tom et al., 1998;Vassena et al., 2003) and in follicles that fail to ovulate in responseto GnRH (Martinuk et al., 1992). Subordinate follicles have a brighter antrum with greaterheterogeneity than their dominant counterparts (Singh et al., 1998; Vassena et al., 2003).
A relationship between image attributes and follicular function, and that between follic-ular status and oocyte competence have been documented (Salamone et al., 1999; Vassena,2001). Hence, investigation of a relationship between image attributes of the ovarian folli-cle and the competence of the contained oocyte seemed a logical pursuit. Small to medium
J. Singh et al. / Animal Reproduction Science 78 (2003) 371–399 385
antral follicles from bovine ovaries obtained at the slaughterhouse have been a primarysource of oocytes for in vitro embryo production in cattle. However, such follicles are indifferent physiologic phases (i.e. growing, static or regressing) and presumably containoocytes with varying degrees of developmental potential. In a recent study (Vassena et al.,2003), subordinate follicles whose oocytes produced 8- to 16-cell embryos had differentechotextural characteristics than follicles whose oocytes did not produce embryos. A closerelationship was found between the stage of development of subordinate follicles and theirultrasound echotexture. Together with the observation that oocyte competence is associatedwith follicular status, thus results provided important rationale for the use of ultrasoundimage analysis for identifying follicles that will produce competent oocytes. Although thesensitivity of this technique is not yet sufficient for use in a diagnostic setting, the identi-fication of statistically significant endpoints has formed the basis to improve the imagingtechnique. Further, the use of the remote assessment of follicular status (Pierson and Adams,1999) brings the prospects of providing useful information in near real-time well withinthe grasp of practitioners or research groups who may wish to have access to the biologicalinformation, but who do not wish to invest in the computer equipment and image analysissoftware required to make quantitative assessments of visual data.
4. Three-dimensional ultrasonography
Conventional B-mode ultrasonography involves continuous visualization of two-dimensional “slices” of a tissue (e.g. ovary, uterus, fetus) and mental reconstruction ofthe tissue structure in the third dimension. This is a technically demanding procedure thathas impeded exploitation of the full potential of this type of medical imaging. Advances incomputing power and transducer design have made three-dimensional (3D) imaging fea-sible. The first generation of commercially available 3D scanners is now available from atleast five ultrasound imaging equipment manufacturers. In addition, an add-on computerthat can be attached to the video output of a conventional ultrasound scanner to produce a3D image system is available from one Canadian company.
In the simplest form of three-dimensional imaging, a standard linear-array or convex-arraytransducer head is moved mechanically over the tissue of interest and sequential images(e.g. 30 frames/s) are captured by computer digitization. The transducer head can be movedby free-hand rotation, or mechanically by an external stepper motor assembly, or by anenclosed stepper motor within the transducer head. The 2D images are then electronicallystacked together to reconstruct the tissue volume. Specific algorithms may then be appliedto enhance edge detection or isolate specific image features (e.g. make the fluid around afetus transparent so that surface contours are visible) in near real-time (i.e. within secondsof image acquisition).
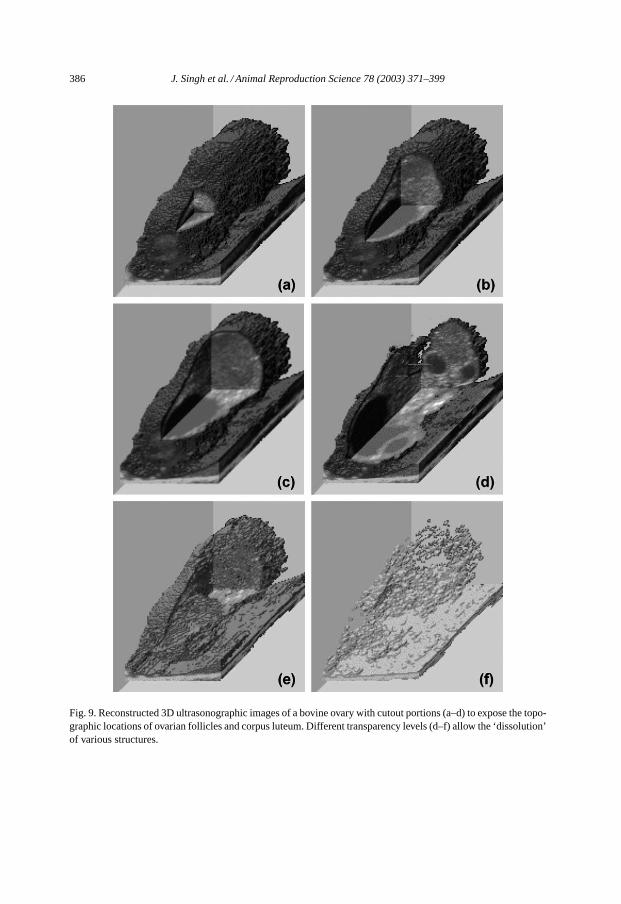
A tremendous advantage of 3D imaging is that once the images are acquired and recon-structed, the image may be rotated in all different planes and evaluated without continuedscanning. Further, the 3D data sets can be used to provide volumetric measurements andpermit acoustic sectioning or stripping of layers of image information, revealing both in-ternal and external features (Fig. 9). Apart from computer-related issues, many technicalchallenges relative to anatomy (e.g. transducer size and configuration for transrectal or
386 J. Singh et al. / Animal Reproduction Science 78 (2003) 371–399
Fig. 9. Reconstructed 3D ultrasonographic images of a bovine ovary with cutout portions (a–d) to expose the topo-graphic locations of ovarian follicles and corpus luteum. Different transparency levels (d–f) allow the ‘dissolution’of various structures.
J. Singh et al. / Animal Reproduction Science 78 (2003) 371–399 387
transvaginal use) and subject (e.g. animal movement during image acquisition) must beresolved before 3D ultrasonography becomes a practical in animal research applications.
Three basic approaches of image acquisition for 3D reconstruction have been used(Pierson, 1999).
4.1. Angular method
A standard linear-array or convex-array transducer head is moved at a constant speedthrough an arc of 45◦–90◦, and 2D images are acquired at regular intervals. A stepper motorhousing that can be adapted to fit different commercial transducers has been designed forthis type of imaging (Elango et al., 1997). The complete assembly remains stationary withinthe rectum or vagina while the transducer head moves for 0.5 to 6 s within the assembly.The original data set takes the form of a section of a cylinder (i.e. cylindrical coordinatesystem); therefore, biquadratic interpolation was used to transform the data set into onerepresenting the shape of a cube (i.e. Cartesian coordinate system). Based on this design,commercial transducers have become available as completely enclosed dedicated probes;the design is conceptually analogous to a mechanical sector probe that contains an array ofcrystals rather than a single crystal.
4.2. Radial-rotation method
The radial method is suitable for use with end-fire convex-array transducers for transvagi-nal imaging, and involves movement of the transducer through one-half of a complete axialrotation (180◦ about its longitudinal axis (Kohler et al., 1997; Pierson, 1999). The recon-structed volume resembles the shape of a cone.
4.3. Matrix method
Angular and radial methods are limited by mechanical rotations of a row of crystals, buta matrix method makes use of electronic steering of ultrasound beams generated from atwo dimensional matrix of crystals. Matrix probes are not yet available, but the “footprint”of such a probe will be large since the source is a sheet of piezoelectric crystals ratherthan a row. Matrix transducers may therefore be unsuitable for transrectal or transvaginalapplications unless miniaturized versions can be developed. However, external approaches(e.g. transabdominal scanning) will be able to make use of faster acquisition times due toelectronic steering of the beam.
5. Vascular imaging
The Doppler effect results from relative compression or rarefaction of sound waves froman approaching or departing source, respectively, and is the underlying reason for a changein acoustic pitch (frequency) from a moving sound source. The same principle is em-ployed in ultrasonography to detect changes in the frequency of ultrasound waves reflectedfrom clusters of blood cells flowing toward or away from the transducer face. Different
388 J. Singh et al. / Animal Reproduction Science 78 (2003) 371–399
modalities of Doppler imaging allow detection of changes in blood velocity and directionof flow over time. Other indices used to describe vascular flow characteristics, such as resis-tance index, pulsatility index and systolic to diastolic ratios, may be calculated. Alterationsin the vasculature of the ovary occur as large follicles and corpora lutea grow and regress,and microvascular changes occur in the tissues comprising follicle walls and the lutealglands (Singh et al., 1997; Singh and Adams, 2000). Hence, in addition to study of the vas-cular anatomy of ovarian follicles and corpus luteum (Pierson, 1992) by color-flow Dopplerimaging, important physiologic processes may also be studied by characterizing changes invascular dynamics over time (e.g. velocity, resistance, volume). Using color flow Doppler,a pronounced “ring” of vascularity has been detected around the developing human cor-pus luteum (Bächström et al., 1994). Vascularity became more prominent but resistance tovascular flow decreased as the corpus luteum matured. Conversely, color mapping patternsbecame much less pronounced and resistance increased during luteal regression. Three vari-ations of Doppler imaging have been used to study vascular flow: Spectral Doppler is used todisplay vascular flow over time in a waveform; color-flow Doppler allows superimpositionof directional vascular flow information on the B-mode grey-scale imaging; and power-flowDoppler is used to superimpose low velocity vascular flow information (without directionalinformation) on the B-mode grey-scale imaging. Color-flow and power-flow Doppler im-ages of ovarian structures are shown, illustrating the different types of information generated(Fig. 10). Power-flow Doppler has now been combined with color-flow Doppler to providedirectional information for low velocity flow. We anticipate that as the techniques becomemore accessible in portable equipment, examination of blood flow patterns will become asroutine and important in ovarian imaging as gray-scale ultrasonography is currently.
5.1. Spectral-flow Doppler ultrasonography
The spectral Doppler technique may involve a pulsed wave or a continuous wave. Theadvantage of the pulsed-wave spectral Doppler technique is that blood flow characteristicsinside a specified vessel or at different regions within a cavity (e.g. heart chamber) can bemeasured precisely. This is made possible by the ability to place the Doppler gate (marker)at the desired anatomical location (e.g. within the lumen of vessels) using real-time ultra-sonography. The ultrasound scanner then displays the spectral wave-forms over time in adifferent window. Quantitative data reflecting the characteristics of resistance, velocity andother characteristics may be generated. Research is just beginning on the assessment of echo-texture characteristics and vascular patterns of individual preovulatory follicles (Pierson,2000). Although data have not yet been critically evaluated, it appears that there was a grad-ual decrease in impedance to blood flow in the vessels immediately surrounding the humanpreovulatory follicle as ovulation nears. Immediately prior to ovulation, the perifollicularvessels were easily identified; however, it is necessary to visualize the perifollicular vesselsin multiple planes due to their tortuous path (Collins et al., 1991; Pierson, 2001, in press).
5.2. Color-flow Doppler ultrasonography
Color Doppler scanners display local blood flow by assigning color to mean frequencyshifts. This information is then superimposed on the real-time B-mode ultrasound image.
J. Singh et al. / Animal Reproduction Science 78 (2003) 371–399 389
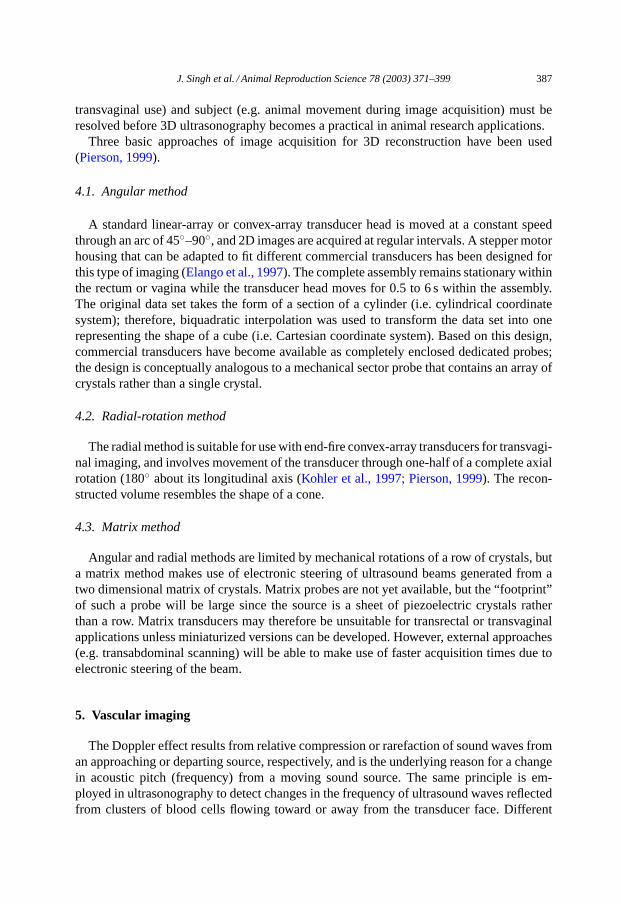
Fig. 10. Color flow (A, C) and power flow Doppler ultrasound images of imminently preovulatory follicles (A,B) demonstrating directional peri-follicular flow and recent sites of ovulation (C, D) demonstrating the vascularpatterns around walls of the recently collapsed follicle/developing corpus luteum. In color flow images, blood flowtoward the transducer is displayed in red, while flow away from the transducer is displayed in blue. In power flowimages, all flow is displayed in a graded variant of yellow to orange colors.
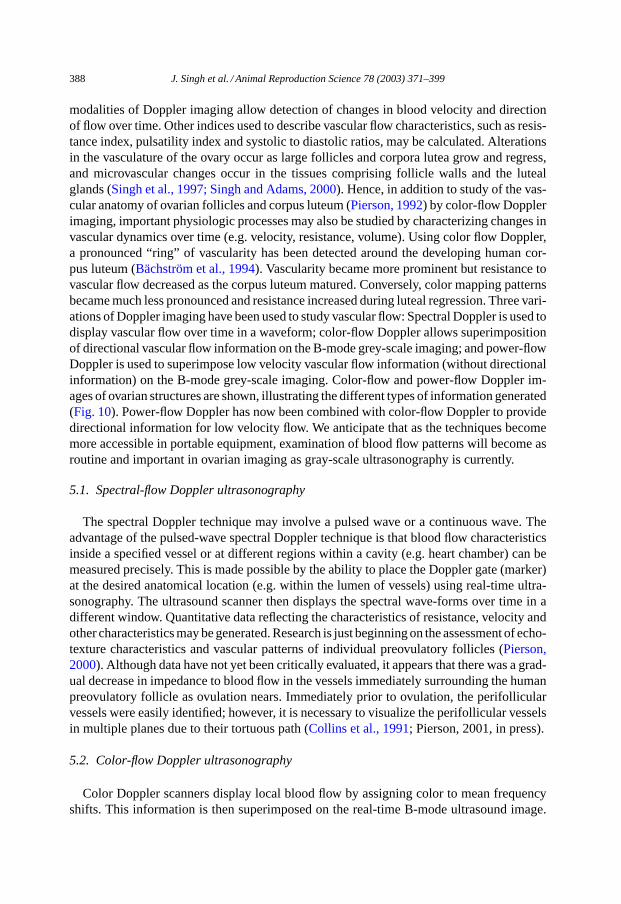
Fig. 11. A. High resolution image of an ovarian follicle of an anesthetized mouse obtained by transabdominalscanning with the ultrasound biomicroscope. The resolution obtained is far greater than that obtained inFig. 3A.Compared to the image of bovine follicle (Fig. 3A), the mouse follicle was much smaller (2.4 mm vs. 15 mm)and was imaged in situ (live) rather than in vitro (excised ovary in a water bath). The cumulus-oocyte-complex(arrowhead) is visible in the center of the follicle. (B) Region analysis of the ultrasound image in A was performedand never-before seen details of the follicle wall (arrows) and the cumulus–oocyte-complex (arrowhead) are clearlyevident.
390 J. Singh et al. / Animal Reproduction Science 78 (2003) 371–399
Color-flow Doppler information is directional—different colors are displayed depending onwhether the blood flow is towards or away from the transducer. Changes in blood flow aroundpreovulatory follicles and during ovulation have been demonstrated by color flow Dopplerultrasonography in women (Brannstrom et al., 1998; Pierson, 2000; Pierson, unpublishedobservations;Fig. 10A and C). Evaluation of ovarian blood flow during follicular stimulationtreatment in women (Balakier and Stronell, 1994; Nargund et al., 1996; Oyesanya et al.,1996; Van Blerkom et al., 1997) may be interpreted to mean that that peak velocity andresistive indices decrease as the diameter of the follicles increases. A strong correlationhas been observed between oocyte recovery rates and the level of follicular vascularity,and it has been proposed that perifollicular blood flow may be used to choose the optimaltime for hCG administration (Oyesanya et al., 1996). Likewise, color flow ultrasonographyevaluation can also be used to detect physiological or pathological changes in the corpusluteum. Low rates of luteal blood flow were observed in non-pregnant women, while corporalutea of pregnant women had the highest rates of blood flow (Zalud and Kurjak, 1990; Glocket al., 1995). One of the problems with color-flow imaging is that artifacts resulting fromrandom noise during ultrasonography may resemble aberrant flow in any direction, thusobscuring true flow characteristics. Other artifacts stem from intestinal motion, turbulentflow and angle-dependent measurement errors.
5.3. Power-flow Doppler ultrasonography
A new application of the Doppler technique encodes the power in the Doppler in color.This is fundamentally different from the mean frequency shift employed by color-flowDoppler imaging. Since noise has uniformly low power, when power is written in colorthe noise appears uniform, not random. Hence, a uniformly colored background is imagedinstead of a random distribution of color, therefore, the sensitivity in measuring vascularflow is improved (Zagzebski, 1996). Power-flow Doppler information is omni-directional—all flow in tissue is shown in a single color (Fig. 10B and D). Another advantage of powerDoppler imaging is that it does not alias and is relatively angle independent. The useof power Doppler imaging of the reproductive organs is in its early stages. Preliminarystudies on luteal function have been performed in normal women as well as women withluteal phase defects and luteinized unruptured follicle syndrome (Kupesic and Kurjak,1997; Kupesic et al., 1997; Zaidi et al., 1995). Follicles which fail to ovulate (luteinizedunruptured follicles) showed reduced blood flow in the follicle walls after the LH surge(Zaidi et al., 1995).
6. Ultrasound biomicroscopy
The combination of B-mode ultrasonography and computer-assisted echotexture analy-sis has the characteristics of an ideal diagnostic tool because it would permit continuousreal-time evaluation of function/dysfunction. The current generation of commercial ul-trasound machines provides a lateral resolution of 0.7–1.0 mm. This level of resolutionis sufficient for many clinical uses, but the full potential of image analysis can be ex-ploited with an instrument that provides microscopic resolution (i.e.<0.2 mm). A new
J. Singh et al. / Animal Reproduction Science 78 (2003) 371–399 391
Canadian company has produced an ultrahigh-frequency ultrasound instrument capable ofmicroscopic resolution (http://www.visualsonics.com). This “ultrasound biomicroscope”uses a single crystal to emit a sound wave with a frequency of 30–70 MHz and will pro-duce an image with a resolution of 30–50�m. To illustrate the potential of this emergingtechnology, a 0.7 mm ovarian follicle of an anesthetized mouse was imaged to reveal thestructure of the cumulus-oocyte complex in vivo (Fig. 11). In addition, the instrument hasspectral Doppler capability to measure blood flow through vessels as small as 50�m indiameter. Major limitations of the biomicroscope are depth of penetration (approximately10 mm at 30 MHz, 5 mm at 50 MHz), field of view (imaging width, 1 cm), and frame rate(8 frames/s). Close proximity of ovaries to the rectum and vagina in large domestic an-imals and humans will permit imaging with this instrument provided the instrument isused in conjunction with a conventional ultrasound machine for targeting the structuresof interest. Echotexture analysis of images obtained with the ultrasound biomicroscopewill, for the first time, allow the study of dynamic changes in the ovary at near histologicresolution. Serial imaging of microscopic structures over time will make accessible thestudy of mechanisms underlying biological events that have eluded reproductive biologistssince the time of de Graaf (e.g. oocyte competence, early embryonic development anddeath, tubal fixation of the conceptus in humans, early luteal insufficiency, endometrialdefects).
7. Magnetic resonance imaging (MRI)
7.1. Two-dimensional MRI
MRI has revolutionized the diagnosis of disease in many areas of human and veterinarymedicine. MR images are less noisy and generally provide better resolution than ultra-sound images (Sarty et al., 1996). Unlike speckle noise in ultrasound images (Abbott andThurstone, 1979), the noise in MRI is not spatially correlated which makes it possible toimprove signal-to-noise ratio by averaging. Magnetic resonance imaging is based upon re-laxation of hydrogen protons in a large magnetic field after a radio-frequency pulse (RF) hasdeflected the proton spin transversely. During relaxation,T1 recovery andT2 decay occursimultaneously, but independently.T1 recovery, also is known as spin-lattice relaxation, andmeans loss of RF pulse energy to the surrounding environment.T2 decay, or spin–spin re-laxation is the loss of energy to other protons or spins. Contrast in MR images is determinedby T1 andT2 relaxation rates, and the proton density (PD) of tissue. TheT1 relaxation rateis the time it takes for 63% of the magnetization to recover to the longitudinal direction, orrelax. TheT2 relaxation rate is the time for 63% of the transverse magnetization to be lost,or decay, while proton density is defined as the number of signal producing protons per unitvolume of tissue. MR images can be weighted to preferentially reflectT1 or T2 relaxationas well as proton density. Two pulse sequence parameters, calledTR andTE, govern theweighting in the image.T1 recovery,T2 decay and PD contribute to contrast in all MRimages regardless of their weighting. An image weighted byT1, T2 or PD is produced byminimizing the effects of the other two processes.
392 J. Singh et al. / Animal Reproduction Science 78 (2003) 371–399
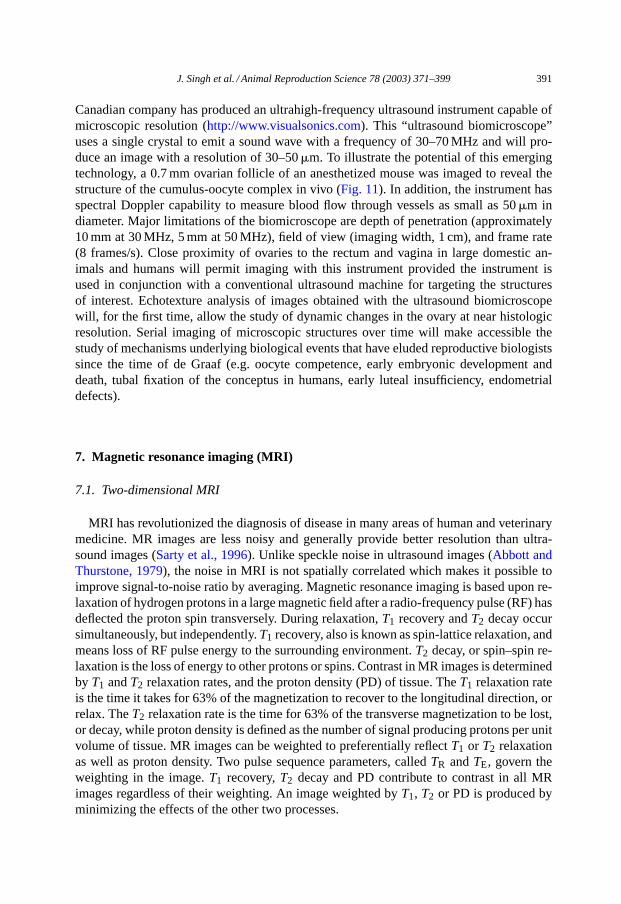
Fig. 12. MRI images of an ex vivo bovine ovary in two A, B and three C, D dimensions. Two-dimensionalT1-(A) andT2-weighted images demonstrating follicles in different stages of atresia (a, A, b, B), the physiologicallydominant follicle (c, C) and a corpus albicans (d, D). Small follicle of 2 mm diameter were easily visualized. Threedimensional images created using FISP and PFISP imaging. Follicles and luteal structures are clearly identifiablein all views. The images may be rotated 360◦ in the computer. Adapted fromHilton et al., 2000andSarty et al.,2000.
Reports on the use of MRI for studying the ovaries of domestic animals are virtuallynon-existent because of the cost of the equipment, the relatively small size of the ovariescompared to surrounding tissues, and the narrow tube diameter that prevents placementof large animals inside the magnetic coils. However, early prototypes of magnetic coilsdesigned for intravaginal or intrarectal use are currently being developed and may makeMRI as user-friendly as ultrasonography (Sarty et al., 2001, 2002). In an effort to explore thepotential advantages of MRI imaging, bovine ovaries were surgically removed at definedtimes of follicular wave development (Sarty et al., 1996; Hilton et al., 2000, 2001). TwodimensionalT1 andT2 weighted images are shown (Fig. 12A and B). Antral fluid of folliclesimaged prior to dominant follicle selection and during atresia had longT1 andT2 relaxationtimes. As the time of selection of the dominant follicle approached, both theT1 andT2
J. Singh et al. / Animal Reproduction Science 78 (2003) 371–399 393
times decreased. TheT1 time decreased in dominant follicles prior to ovulation. It appearsthat theT1 value is inversely related to estradiol concentrations in the follicular fluid. Thus,conventional MRI relaxometry may be useful for identifying the physiologic status ofovarian follicles. We expect that improvements in MRI speed and resolution, combinedwith the use of specific purpose coils, will soon allow relaxometric observations of ovarianfollicles in vivo.
7.2. Three-dimensional MRI
We have used three-dimensional MR imaging coupled with maximum intensity projectiondisplay to study the topographic distribution of follicles in bovine ovaries in vitro (Sartyet al., 2000, Fig. 12C and D). Ovaries were studied using fast imaging with steady stateprecession imaging sequences using maximum intensity projection which displayed threedimensional images as a cine-loop rotating in space. Presently, only the in vitro modelsystem is functional, however, future developments making MRI fast and user-friendlymake this a particularly exciting avenue of inquiry for the study of normal and pathologicovarian function.
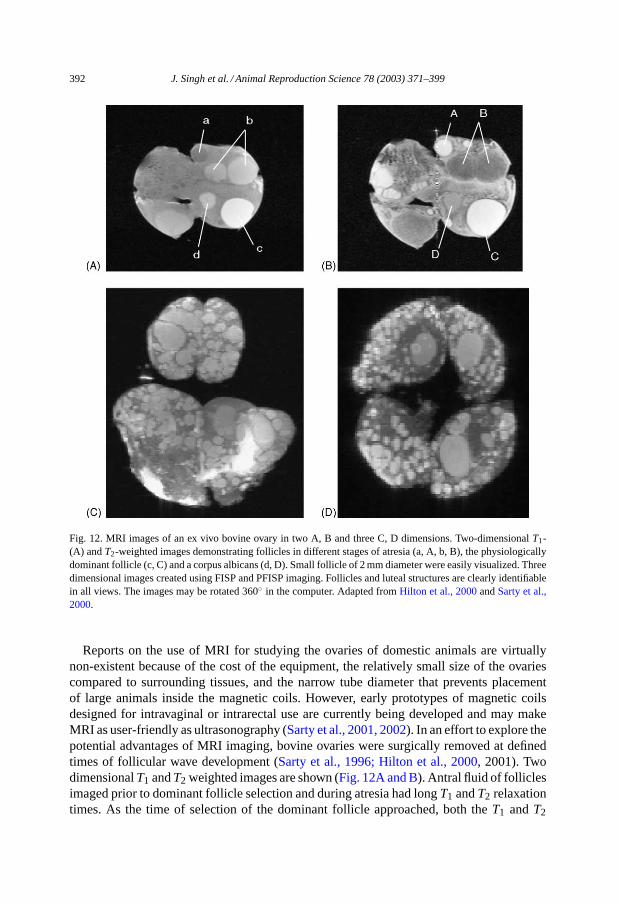
8. Diffraction-enhanced soft tissue X-ray imaging
The use of synchrotron light in medical imaging is an emerging field and has not beenused previously to image ovarian tissue of any species. Excised bovine ovaries, and an
Fig. 13. Diffraction enhanced images (DEI) of a bovine ovary produced with X-rays on beamline×15A of theNational Synchrotron Light Source, Brookhaven National Laboratory, Upton, NY. Three antral follicles approxi-mately 4 mm in diameter are indicated on the left, and a corpus luteum is outlined on the right. The images wereacquired on opposite sides of the diffraction rocking curve, resulting in opposing contrast. Artifact was producedby a paper clip (at top) used to suspend the ovary in a plexiglass water bath (vertical striations).
394 J. Singh et al. / Animal Reproduction Science 78 (2003) 371–399
early bovine embryo (about day 30 of gestation), were imaged using diffraction enhancedimaging (DEI) at 40 keV using a hard X-ray beamline at the National Synchrotron LightSource, Brookhaven National Laboratory, Upton, NY (Christensen et al., 2002). DEI is anew modality made possible by 2 unique characteristics of synchrotron light; i.e. the light ismonochromatic (single wavelength) and polarized (single plane). In addition, synchrotronlight is tremendously bright (in the order of 106 times brighter than the sun, at the surfaceof the sun) and therefore permits penetration and resolution not achievable with conven-tional radiography (e.g. angstroms to microns). DEI is particularly promising for soft tissueimaging because it provides exquisite contrast by using the X-ray bending properties oftissue, rather than the absorption properties. Follicles of various sizes and corpora luteawere apparent within the DE images of the ovaries; however, images of the embryo wereunsatisfactory (Fig. 13). Future studies will utilize lower energies in an attempt to enhancefeature contrast in ovarian and embryonic tissue, and employ computer-assisted image anal-ysis to quantify texture differences within ovarian structures throughout the estrous cycleand pregnancy. At present, in vivo imaging of reproductive organs is not possible, but theex vivo experiments have provided proof-of-principle that DEI of soft tissues is feasible.Future plans at the newly constructed Canadian Light Source include in vivo imaging ofthe ovaries in small and large animals using DEI and other modalities made possible bysynchrotron light (e.g. phase contrast, K-edge subtraction).
9. Conclusion
Advancements in imaging technologies over the last two decades have ushered in a quietrevolution of research approaches to the study of ovarian structure and function. The mostsignificant change in our understanding of the ovary have resulted from the use of ultra-sonography which has enabled serial analyses in live animals. Our understanding of normalphysiologic changes in the internal reproductive organs is now much clearer, as is our under-standing of pathophysiologic changes. There has been rapid progression in the application ofcomputer-assisted image analysis and mathematical modeling of the dynamic changes oc-curing within the ovary in vivo. In addition, new technologies, such as three-dimensional ul-trasonography, two- and three-dimensional magnetic resonance imaging, ultrasound-basedbiomicroscopy and synchrotron-based techniques each have the potential to enhance ourunderstanding almost to the cellular level.
Results of imaging studies over the past two decades have been promising and havefar-reaching implications, well beyond the field of reproductive biology. We have developedconvincing evidence to support the underlying hypothesis that echotexture characteristicsof ovarian images reflect the endocrine and physiologic status of follicles, corpora lutea, andoocytes. Data collected by various modalities provide rationale for the notion that follicleshave individual characteristics; i.e. at any given stage the structural and functional statusof an individual follicle may be entirely different than that of others within its cohort. Inaddition, early results from studies designed to correlate echotexture analysis of the folliclewall with the developmental potential of the contained oocyte have been interpreted to meanthat such differences may be useful for assessing or choosing oocytes for in vitro procedures.Ultimately, through the use of imaging, we would like to be able to unravel the mysteries of
J. Singh et al. / Animal Reproduction Science 78 (2003) 371–399 395
ovarian function and dysfunction by detecting molecular and biochemical changes throughchanges in structure from the gross to cellular levels. Presently, image enhancement andechotexture analysis of images obtained by ultrasound biomicroscopy seems to be the mostpromising emerging technique that may allow in vivo examinations of early antral folliclesand oocytes in near future. Perhaps one day we will be able to do the conceptual equivalentof Northern blot or in situ hybridization of follicular cells and gametes in vivo over time.
Acknowledgements
Original studies reported in this review were supported by Canadian Institutes for HealthResearch (RAP) and by National Science and Engineering Research Council and Sas-katchewan Agriculture Development Fund (GPA).
References
Abbott, J.G., Thurstone, F.L., 1979. Acoustic speckle: theory and experimental analysis. Ultrason. Imaging 1,303–324.
Adams, G.P., 1994. Control of ovarian follicular wave dynamics in cattle: implication for synchronization andsuperstimulation. Theriogenology 41, 25–30.
Adams, G.P., 1998. Control of ovarian follicular wave dynamics in mature and prepubertal cattle forsynchronization and superstimulation. In: Proceedings of the Twentieth Congress of the World Associationfor Buiatrics. Sydney, Australia, vol. 2, pp. 595–605.
Adams, G.P., 1999. Comparative patterns of follicle development and selection in ruminants. Reproduction indomestic ruminants IV. J. Reprod. Fertil. Suppl. 54,17–32.
Adams, G.P., 2000. Developments in the use of ultrasonography in buiatrics. In: Proceedings of the CongressoNazionale della Societa Italiana di Buiatria, vol. XXXII, 5–7 May 2000. Stresa, Italy, pp. 435–450.
Adams, G.P., Pierson, R.A., 1995. Bovine model for the study of ovarian follicular dynamics in humans.Theriogenology 43, 113–121.
Adams, G.P., Sumar, J., Ginther, O.J., 1990. Effects of lactational status and reproductive status on ovarian follicularwaves in llamas (Lama glama). J. Reprod. Fertil. 90, 535–545.
Adams, G.P., Sumar, J., Ginther, O.J., 1991a. Form and function of the corpus luteum in llamas. Anim. Reprod.Sci. 24, 127–138.
Adams, G.P., Sumar, J., Ginther, O.J., 1991b. Hemorrhagic ovarian follicles in llamas. Theriogenology 35, 557–568.
Adams, G.P., Matteri, R.L., Ginther, O.J., 1992. Effect of progesterone on ovarian follicles, emergence of follicularwaves and circulating follicle-stimulating hormone in heifers. J. Reprod. Fertil. 95, 627–640.
Adams, G.P., Evans, A.C.O., Rawlings, N.C., 1993. Follicular waves and circulating gonadotropins in 8-monthold prepubertal heifers. J. Reprod. Fertil. 100, 27–33.
Atiomo, W.U., Pearson, S., Shaw, S., Prentice, A., Dubbins, P., 2000. Ultrasound criteria in the diagnosis ofpolycystic ovary syndrome (PCOS). Ultrasound Med. Biol. 26, 977–980.
Bächström, T., Nakata, M., Pierson, R.A., 1994. Ultrasonography of normal and abnormal luteogenesis. In: Jaffe,R., Pierson, R.A., Abramowicz, J.S. (Eds.), Imaging in Infertility and Reproductive Endocrinology. Lippincott,Philadelphia, pp.143–154.
Baerwald, A.R., Adams, G.P., Pierson, R.A., 2002a. A new model for the menstrual cycle in women. In: Proceedingsof the 11th World Congress on Human Reproduction, Montreal, Que. (abstract #29).
Baerwald, A.R., Adams, G.P., Pierson, R.A., 2002b. Folliculogenesis revisited: characteristics of ovarian follicularwaves during the menstrual cycle. Fertil. Steril. 78(3) (Suppl. 1), S67.
Baerwald, A.R., Adams, G.P., Pierson, R.A., 2003. A new model for folliculogenesis during the menstrual cyclein women. Fertil. Steril., in press.
396 J. Singh et al. / Animal Reproduction Science 78 (2003) 371–399
Balakier, H., Stronell, R.D., 1994. Color doppler assessment of folliculogenesis in vitro fertilization patients.Fertil. Steril. 62, 1211–1216.
Bartlewski, P.M., Beard, A.P., Cook, S.J., Rawlings, N.C., 1998. Ovarian follicular dynamics during anoestrus inewes. J. Reprod. Fertil. 113, 275–285.
Baxes, G.A., 1994. Fundamentals of digital image processing. In: Digital Image Processing: Principles andApplications. Wiley, New York, pp. 13–36.
Bergfelt, D.R., Ginther, O.J., 1993. Relationship between FSH surges and follicular waves during the estrous cyclein mares. Theriogenology 39, 781–796.
Bergfelt, D.R., Brogliatti, G.M., Adams, G.P., 1998. Gamete recovery and follicular transfer (GRAFT) usingtransvaginal ultrasonography in cattle. Theriogenology 50, 15–25.
Bracher, V., Parlevliet, J., Fazelli, A.R., Pieterse, M.C., Vos, P.L., Dielmeman, S.J., Taverne, M.A., Colenbrander,B., 1993. Repeated transvaginal ultrasound-guided follicle aspiration in the mare. Equine Vet. J. Suppl. 15,75–78.
Brannstrom, M., Zackrisson, U., Hagstrom, H.G., Josefsson, B., Hellberg, P., Granberg, S., Collins, W.P., Bourne,T., 1998. Preovulatory changes of blood flow in different regions of the human follicle. Fertil. Steril. 69,435–442.
Brogliatti, G.M., Adams, G.P., 1996. Ultrasound-guided transvaginal oocyte collection in prepubertal calves.Theriogenology 45, 1163–1176.
Christensen, C.R., Singh, J., Adams, G.P., 2002. The use of diffraction enhanced imaging for bovine soft tissue.In: Proceedings of the Fifth Annual Users’ Meeting and Workshops of the Canadian Light Source, 15–16November 2002, University of Saskatchewan, Saskatoon, p. 26 (abstract #35).
Collins, W., Jurkovic, D., Bourne, T., Kurjak, A., Campbell, S., 1991. Ovarian morphology, endocrine functionand intra-follicular blood flow during the peri-ovulatory period. Hum. Reprod. 6, 319–324.
Cook, N.L., Squires, E.L., Ray, B.S., Jasko, D.J., 1993. Transvaginal ultrasound-guided follicular aspiration ofequine oocytes. Equine Vet. J. Suppl. 15, 71–74.
Elango, A., Gander, R.E., Adams, G.P., 1997. Design and development of a three-dimensional ultrasound transducerfor veterinary applications. In: Proceedings of the Annual Conference of the Canadian Medical and BiologicalEngineering Society. Toronto, ON, Canada, pp. 74–75.
Evans, A.C.O., Adams, G.P., Rawlings, N.C., 1994a. Follicular and hormonal development in prepubertal heifersfrom 2 to 36 weeks of age. J. Reprod. Fertil. 102, 463–470.
Evans, A.C.O., Adams, G.P., Rawlings, N.C., 1994b. Endocrine and ovarian follicular changes leading up to thefirst ovulation in prepubertal heifers. J. Reprod. Fertil. 100, 187–194.
Fortune, J.E., 1993. Follicular dynamics during the bovine estrous cycle: a limiting factor in improvement offertility? Anim. Reprod. Sci. 33, 111–125.
Gastal, E.L., Kot, K., Ginther, O.J., 1995. Ultrasound-guided intrafollicular treatment in mares. Theriogenology44, 1027–1037.
Ginther, O.J., 1986. Ultrasonic imaging and reproductive events in the mare. Equiservices Publishing, Cross Plains,WI.
Ginther, O.J., 1992. Reproductive Biology of the Mare. 2nd ed. P224. Equiservices Publishing, Cross Plains, WI.Ginther, O.J., 1995a. Ultrasonic Imaging and Animal Reproduction: Fundamentals Book 1. Equiservices
Publishing, Cross Plains, WI, pp. 7–82, 35–40, 147–155.Ginther, O.J., 1995b. Ultrasonic Imaging and Animal Reproduction: Horses. Equiservices Publishing, Cross Plains,
WI, pp. 35–40, 77–83.Ginther, O.J., Bergfelt, D.R., 1992. Ultrasonic characterization of follicular waves in mares without maintaining
identity of individual follicles. J. Equine Vet. Sci. 12, 349–354.Ginther, O.J., Kot, K., 1994. Follicular dynamics during the ovulatory season in goats. Theriogenology 42, 987–
1001.Ginther, O.J., Beg, M.A., Bergfelt, D.R., Donadeu, F.X., Kot, K., 2001. Follicle selection in monovular species.
Biol. Reprod. 65, 638–647.Ginther, O.J., Kastelic, J.P., Knopf, L., 1989a. Composition and characteristics of follicular waves during the
bovine estrous cycle. Anim. Reprod. Sci. 20, 187–200.Ginther, O.J., Knopf, L., Kastelic, J.P., 1989b. Temporal associations among ovarian events in cattle during oestrous
cycles with 2 and 3 follicular waves. J. Reprod. Fertil. 87, 223–230.
J. Singh et al. / Animal Reproduction Science 78 (2003) 371–399 397
Ginther, O.J., Knopf, L., Kastelic, J.P., 1989c. Ovarian follicular dynamics in heifers during early pregnancy. Biol.Reprod. 41, 247–254.
Ginther, O.J., Wiltbank, M.C., Fricke, P.M., Gibbons, J., Kot, K., 1996. Selection of the dominant follicle in cattle.Biol. Reprod. 55, 1187–1194.
Ginther, O.J., Kot, K., Kulick, L.J., Wiltbank, M.C., 1997. Sampling follicular fluid without altering follicularstatus in cattle: oestradiol concentrations early in a follicular wave. J. Reprod. Fertil. 109, 181–186.
Glock, J.L., Blackman, J.A., Dadger, G.J., Brumstead, J.R., 1995. Prognostic significance of morphologic changesof the corpus luteum by transvaginal ultrasound in early pregnancy monitoring. Obstet. Gynecol. 85, 37–41.
Heller, M, Jehle, D., 1995. Ultrasound in Emergency Medicine. Saunders, Philadelphia, pp. 1–40.Hilton, J.E., Sarty, G.E., Adams, G.P., Pierson, R.A., 2000. Magnetic resonance image attributes of the bovine
ovarian follicle antrum during development and regression. J. Reprod. Fertil. 120, 311–323.Jocelyn, H.D., Setchell, B.P., 1972. Regnier de Graaf on the human reproductive organs. An annotated translation
of Tractatus de Virorum Organis Generationi Inservientibus (1668) and De Mulierub Organis GenerationiInservientibus Tractatus Novus (1962). J. Reprod. Fertil. Suppl. 17, 1–222.
Hinrichs, K., DiGiorgio, L.M., 1991. Embryonic development after intrafollicular transfer of horse oocyte. J.Reprod. Fertil. Suppl. 44, 369–374.
Hoare, E.K., Parker, S.E., Flood, P.F., Adams, G.P., 1997. Ultrasonic imaging of reproductive events in muskoxen.Rangifer 17, 119–123.
Kastelic, J.P., Ginther, O.J., 1989. Fate of conceptus and corpus luteum after induced embryonic loss in heifers. J.Am. Vet. Med. Assoc. 194, 922–928.
Kastelic, J.P., Bergfelt, D.R., Ginther, O.J., 1990a. Relationship between ultrasonic assessment of the corpusluteum and plasma progesterone concentration in heifers. Theriogenology 33, 1269–1278.
Kastelic, J.P., Pierson, R.A., Ginther, O.J., 1990b. Ultrasonic morphology of corpora lutea and central cavitiesduring the estrous cycle and early pregnancy in heifers. Theriogenology 34, 487–498.
Knopf, L., Kastelic, J.P., Schallenberger, E., Ginther, O.J., 1989. Ovarian follicular dynamics in heifers: test oftwo-wave hypothesis by ultrasonically monitoring individual follicles. Dom. Anim. Endocr. 6, 111–119.
Kohler, J., Gander, R.E., Pierson, R.A., 1997. Development of intravaginal three-dimensional ultrasonography.In: Proceedings of the Conference of the Canadian Medical and Biological Engineering Society, pp. 134–135.
Kot, K., Gibbons, J.R., Ginther, O.J., 1995. A technique for intrafollicular injection in cattle: effects of hCG.Theriogenology 44, 41–50.
Kremkau, F.W., 1989. Diagnostic Ultrasound: Principles, Instruments, and Exercises. Saunders, Philadelphia,pp. 1–50, 147–176, 219–231.
Krivanek, A., Liang, W., Sarty, G., Pierson, R.A., Sonka, M., 1998. Automated follicle analysis in ovarianultrasound medical imaging 1998: image processing. In: Proceedings of the International Society for OpticalEngineering (SPIE), vol. 3338, pp. 588–596.
Kupesic, S., Kurjak, A., Vujisic, S., Petrovic, Z., 1997. Luteal phase defect: comparison between Dopplervelocimetry, histological and hormonal markers. Ultrasound Obstet. Gynecol. 9, 105–112.
Kupesic, S., Kurjak, A., 1997. The assessment of normal and abnormal luteal function by transvaginal colorDoppler sonography. Eur. J. Obstet. Gynecol. Reprod. Biol. 72, 83–87.
Manivannan, U., Sarty, G.E., Sirounis, H., Singh, J., Adams, G.P., Pierson, R.P., 1999. Physiologic classificationof bovine ovarian follicles with wavelet packet texture analysis. SPIE 3661, 1238–1245.
Martinuk, S.D., Chizen, D.R., Pierson, R.A., 1992. Ultrasonographic morphology of the human preovulatoryfollicle wall prior to ovulation. Clin. Anat. 5, 1–14.
McCorkell, R.B., MacDougall, L., Adams, G.P., 2001. Transrectal ultrasonography in female Wapiti (Cervuselaphus): a feasibility study. In: Renecker, L.A., Renecker, T.A. (Eds.), Game Conservation and Sustainability:Biodiversity, Management, Ecotourism, Traditional Medicine and Health. Stratford, ON, Canada, pp. 282–290.
McCorkell, R.B., MacDougall, L., Adams, G.P., 2002. Ovarian follicle development in Wapiti (Cervus elaphus)during the anestrous season. Theriogenology, in press.
Misiti, M., Misiti, Y., Oppenheim, G., Poggi, J.M., 1996. Wavelet Toolbox Users’s Guide. The Math Works Inc.,Natick, Mass.
Nargund, G., Bourne, T., Doyle, P., Parsons, J., Cheng, W., Campbell, S., Collins, W., 1996. Associations betweenultrasound indices of follicular blood flow, oocyte recovery and preimplantation embryo quality. Hum. Reprod.11, 109–113.
398 J. Singh et al. / Animal Reproduction Science 78 (2003) 371–399
Oyesanya, O.A., Parsons, J.H., Collins, W.P., Campbell, S., 1996. Prediction of oocyte recovery rate by transvaginalultrasonography and color Doppler imaging before human chorionic gonadotropin administration in vitrofertilization cycles. Fertil. Steril. 65, 806–809.
Pierson, R.A., 1992. From ovulation to implantation. In: Jaffe, R., Warsof, S. (Eds.), Color Doppler Imaging inObstetrics and Gyanecology. McGraw-Hill, New York, pp. 35–60.
Pierson, R.A., 1999. Three-dimensional ultrasonography of the embryo and fetus. In: Jaffe, R., Bui, T.-H. (Eds.),Fetal and Neonatal Ultrasonography. Parthenon Publishing Group, New York, pp. 317–326.
Pierson, R.A., 2000. Imaging technology in assisted reproduction. In: Wolf, D., Zelinski-Wooten, M. (Eds.),Assisted Reproduction and Nuclear Transfer in Mammals. Humana Press, Totowa, NJ, pp. 95–122.
Pierson, R.A., Adams, G.P., 1995. Computer-assisted image analysis, diagnostic ultrasonography and ovulationinduction: strange bedfellows. Theriogenology 43, 105–112.
Pierson, R.A., Adams, G.P., 1999. Remote assessment of ovarian response and follicular status using visual dataanalysis of ultrasonographic images. Theriogenology 51, 47–57.
Pierson, R.A., Chizen, D.R., 1994. Transvaginal ultrasonographic assessment of normal and aberrant ovulation.In: Jaffe, R., Pierson, R.A., Abramowicz, J.S. (Eds.), Imaging in Infertility and Reproductive Endocrinology.Lippincott, Philadelphia, pp. 129–142.
Pierson, R.A., Ginther, O.J., 1984. Ultrasonography of the bovine ovary. Theriogenology 21, 495–504.Pierson, R.A., Ginther, O.J., 1985. Ultrasonic evaluation of the corpus luteum of the mare. Theriogenology 23,
795–806.Pierson, R.A., Ginther, O.J., 1986. Ovarian follicular populations during early pregnancy in heifers. Theriogenology
26, 649–659.Pierson, R.A., Ginther, O.J., 1987a. Follicular populations during the estrous cycle in heifers: Part I. Influence of
day. Anim. Reprod. Sci. 124, 165–176.Pierson, R.A., Ginther, O.J., 1987b. Follicular populations during the estrous cycle in heifers. Part II. Influence of
right and left sides and intraovarian effect of the corpus luteum. Anim. Reprod. Sci. 14, 177–186.Pierson, R.A., Ginther, O.J., 1988a. Follicular populations during the estrous cycle in heifers. Part III. Time of
selection of ovulatory follicle. Anim. Reprod. Sci. 16, 81–95.Pierson, R.A., Ginther, O.J., 1988b. Ultrasonic imaging of the ovaries and uterus in cattle. Theriogenology 29,
21–37.Pieterse, M.C., Kappen, R.A., Kruip, A.M., Taverne, M.A.M., 1988. Aspiration of bovine oocyte during
transvaginal ultrasound scanning of the ovaries. Theriogenology 30, 751–762.Powis, R., Powis, W., 1984. A Thinker’s Guide to Ultrasonic Imaging. Urban and Schwartzenberg Inc., Baltimore,
MD.Rajakoski, E., 1960. The ovarian follicular system in sexually mature heifers with special reference to seasonal,
cyclical, and left-right variations. Acta Endocr. Copenh. Suppl. 52, 7–68.Rajamahendran, R., Taylor, C., 1990. Characterization of ovarian activity in postpartum dairy cows using ultrasound
imaging and progesterone profiles. Anim. Reprod. Sci. 22, 171–180.Ravindra, J.P., Rawlings, N.C., Evans, A.C.O., Adams, G.P., 1994. Ultrasonographic study of ovarian follicular
dynamics in ewes during the oestrous cycle. J. Reprod. Fertil. 101, 501–509.Salamone, D.F., Adams, G.P., Mapletoft, R.J., 1999. Changes in the cumulus–oocyte complex of subordinate
follicles relative to follicular wave status in cattle. Theriogenology 52, 549–561.Sarty, G.E., Pierson, R.A., 1998. Analysis of ovarian follicular response to superstimulation in a three-dimensional
parametric space. Fertil. Steril. 70 (Suppl 3), S183.Sarty, G.E., Adams, G.P., Pierson, R.A., 2000. Three-dimensional magnetic resonance imaging for the study of
ovarian function in bovine in vitro model. J. Reprod. Fertil. 119, 69–75.Sarty, G.E., Baerwald, A.R., Loewy, J., Pierson, R.A., 2002. External versus internal magnetic resonance imaging
methods for the study of ovarian structure and function. MAG*MA, in press.Sarty, G.E., Hess, A.R., (Baerwald), Loewy, J., Pierson, R.A., 2001. External versus intravaginal mri for ovarian
imaging. In: Proceedings of the 47th Annual Meeting of the Canadian Fertility and Andrology Society, Whistler,BC (Abstract 58a).
Sarty, G.E., Kendall, E.J., Pierson, R.A., 1996. Magnetic resonance imaging of bovine ovaries in vitro. Mag. Res.Mat. Physics Biol. Med. (MAG*MA) 4, 205–211.
Sarty, G.E., Liang, W., Sonka, M., Pierson, R.A., 1997. The Development of a Semi-Automated Segmentation ofOvarian Follicular Images Using a Knowledge-Based Algorithm. Medical Imaging 1997: Image Processing.In: Proceedings of the International Society for Optical Engineering (SPIE), 3034, pp. 822–829.
J. Singh et al. / Animal Reproduction Science 78 (2003) 371–399 399
Sarty, G.E., Liang, W., Sonka, M., Pierson, R.A., 1998. Semi-automated segmentation of ovarian follicularultrasound images using a knowledge-based algorithm. J. Ultrasound Med. Biol. 24, 27–42.
Savio, J.D., Boland, M.P., Hynes, N., Roche, J.F., 1990. Resumption of follicular activity in the early postpartumperiod of dairy cows. J. Reprod. Fertil. 88, 569–579.
Savio, J.D., Keenan, L., Boland, M.P., Roche, J.F., 1988. Pattern of growth of dominant follicles during the estrouscycle of heifers. J. Reprod. Fertil. 83, 663–671.
Singh, J., Adams, G.P., 2000. Histomorphometry of dominant and subordinate bovine ovarian follicles. Anat. Rec.258, 58–70.
Singh, J., Pierson, R.A., Adams, G.P., 1997. Ultrasound image attributes of the bovine corpus luteum: structuraland functional correlates. J. Reprod. Fertil. 109, 35–44.
Singh, J., Pierson, R.A., Adams, G.P., 1998. Ultrasound image attributes of bovine ovarian follicles: endocrineand functional correlates. J. Reprod. Fertil. 112, 19–29.
Sirois, J., Fortune, J.E., 1988. Ovarian follicular dynamics during the estrous cycle in heifers monitored by real-timeultrasonography. Biol. Reprod. 39, 308–317.
Spicer, L.J., Echternkamp, S.E., 1986. Ovarian follicular growth, function and turnover in cattle: a review. J. Anim.Sci. 62, 428–451.
Stock, A.E., Fortune, J.E., 1993. Ovarian follicular dominance in cattle: relationship between prolonged growthof the ovulatory follicle and endocrine parameters. Endocrinology 132, 1108–1114.
Tom, J.W., Pierson, R.A., Adams, G.P., 1998a. Quantitative echotexture analysis of bovine corpora lutea.Theriogenology 49, 1345–1352.
Tom, J.W., Pierson, R.A., Adams, G.P., 1998b. Quantitative echotexture analysis of bovine ovarian follicles.Theriogenology 50, 339–346.
Van Blerkom, J., Antczak, M., Schrader, R., 1997. The developmental potential of the human oocyte is related tothe dissolved oxygen content of follicular fluid: association with vascular endothelial growth factor levels andperifollicular blood flow characteristics. Hum. Reprod. 12, 1047–1055.
Vassena, R., 2001. Bovine Oocyte Competence. M.Sc. Thesis, University of Saskatchewan, Saskatoon, Canada.Vassena, R., Adams, G.P., Mapletoft, R.J., Pierson, R.A., Singh, J., 2003. Ultrasound image characteristics of
ovarian follicles in relation to oocyte competence and follicular status in cattle. Anim. Reprod. Sci. 76, 25–41.Wikland, M., Nilsson, L., Hansson, R., Hamberger, L., Janson, P.O., 1983. Collection of human oocytes by the
use of sonography. Fertility Sterility 38, 603–608.Zagzebski, J., 1996. Doppler instrumentation. In: Essentials of Ultrasound Physics. Mosby-Year Book, Inc., St.
Louis, MO, pp. 87–108.Zaidi, J., Jurkovic, D., Campbell, S., Collins, W., McGregor, A., Tan, S.L., 1995. Luteinized unruptured follicle:
morphology, endocrine function and blood flow changes during the menstrual cycle. Hum. Reprod. 10, 44–49.Zalud, I., Kurjak, A., 1990. The assessment of luteal blood flow in pregnant and non-pregnant women by
transvaginal color Doppler. J. Perinat. Med. 18, 215–221.


![Distribution From A Physiologic Perspective Problems / Questions Related to Introduction Distribution From A Physiologic Perspective] Five “Distribution.](https://static.fdocuments.net/doc/165x107/56649ea35503460f94ba7de8/distribution-from-a-physiologic-perspective-problems-questions-related-to.jpg)