Project... · Web viewTheme: Represent and solve ... Use multiplication and division within 100 to...
12
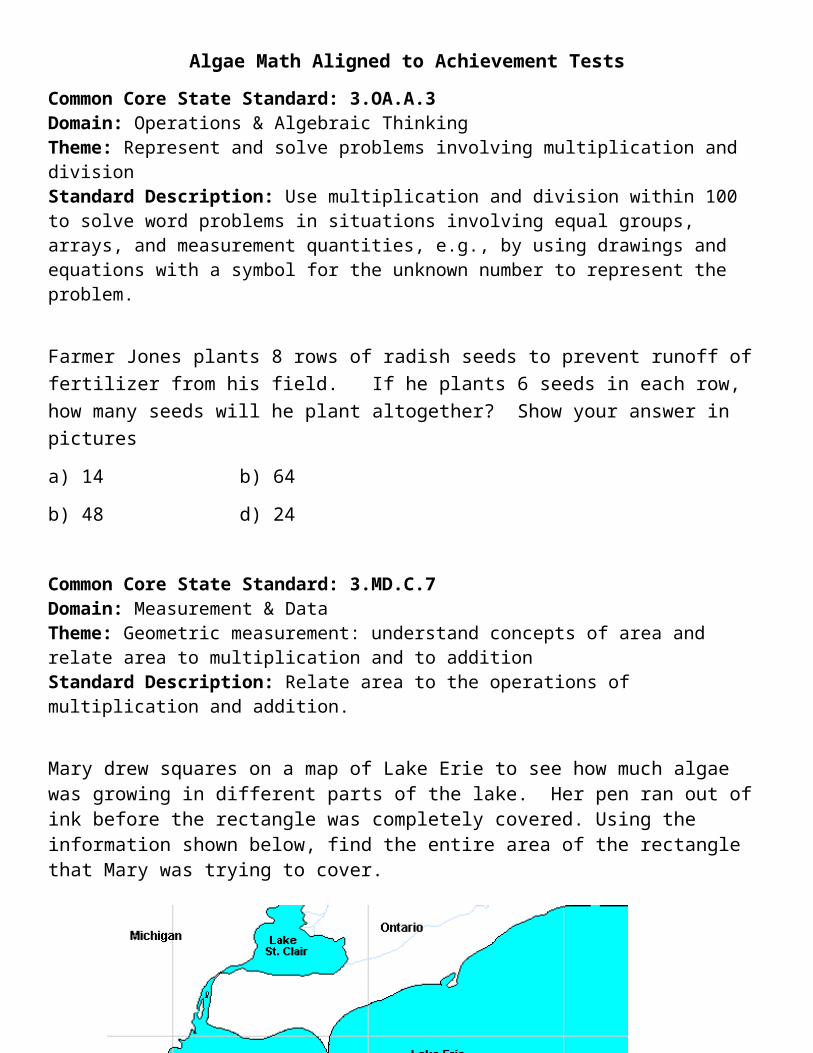
Algae Math Aligned to Achievement Tests Common Core State Standard: 3.OA.A.3 Domain: Operations & Algebraic Thinking Theme: Represent and solve problems involving multiplication and division Standard Description: Use multiplication and division within 100 to solve word problems in situations involving equal groups, arrays, and measurement quantities, e.g., by using drawings and equations with a symbol for the unknown number to represent the problem. Farmer Jones plants 8 rows of radish seeds to prevent runoff of fertilizer from his field. If he plants 6 seeds in each row, how many seeds will he plant altogether? Show your answer in pictures a) 14 b) 64 b) 48 d) 24 Common Core State Standard: 3.MD.C.7 Domain: Measurement & Data Theme: Geometric measurement: understand concepts of area and relate area to multiplication and to addition Standard Description: Relate area to the operations of multiplication and addition. Mary drew squares on a map of Lake Erie to see how much algae was growing in different parts of the lake. Her pen ran out of ink before the rectangle was completely covered. Using the information shown below, find the entire area of the rectangle that Mary was trying to cover.
Transcript of Project... · Web viewTheme: Represent and solve ... Use multiplication and division within 100 to...
Algae Math Aligned to Achievement Tests
Common Core State Standard: 3.OA.A.3Domain: Operations & Algebraic ThinkingTheme: Represent and solve problems involving multiplication and divisionStandard Description: Use multiplication and division within 100 to solve word problems in situations involving equal groups, arrays, and measurement quantities, e.g., by using drawings and equations with a symbol for the unknown number to represent the problem.
Farmer Jones plants 8 rows of radish seeds to prevent runoff of fertilizer from his field. If he plants 6 seeds in each row, how many seeds will he plant altogether? Show your answer in pictures
a) 14 b) 64
b) 48 d) 24
Common Core State Standard: 3.MD.C.7Domain: Measurement & DataTheme: Geometric measurement: understand concepts of area and relate area to multiplication and to additionStandard Description: Relate area to the operations of multiplication and addition.
Mary drew squares on a map of Lake Erie to see how much algae was growing in different parts of the lake. Her pen ran out of ink before the rectangle was completely covered. Using the information shown below, find the entire area of the rectangle that Mary was trying to cover.
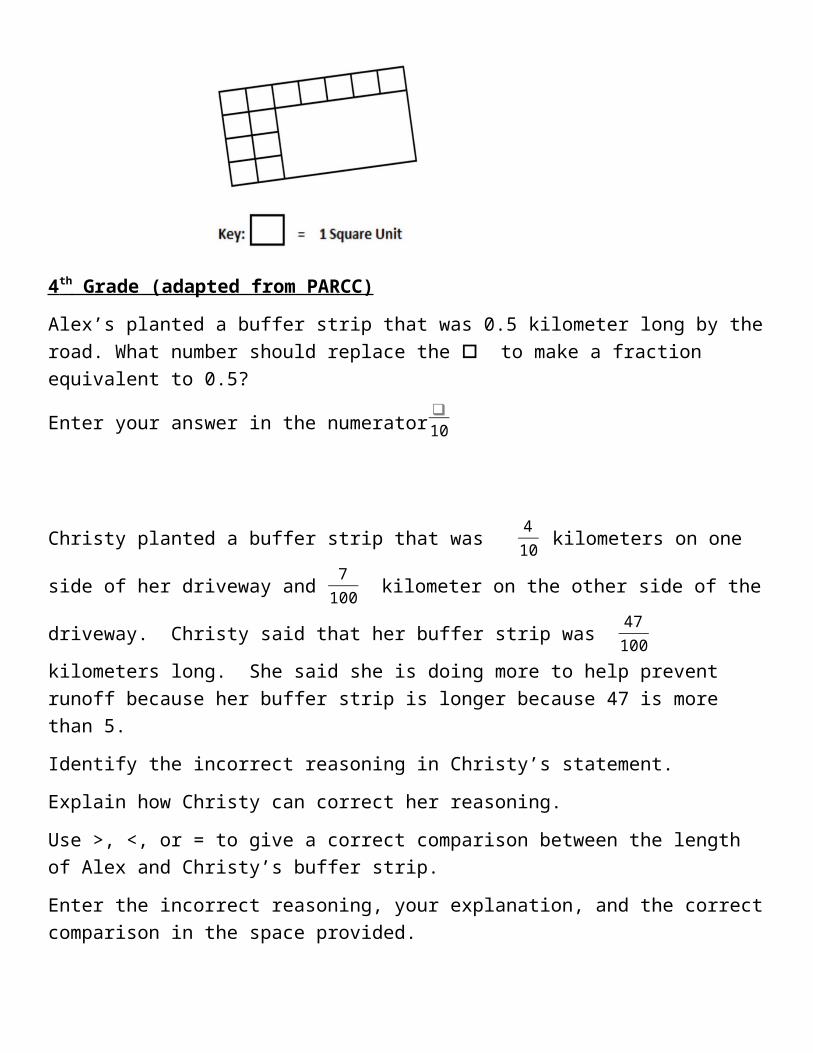
4 th Grade (adapted from PARCC)
Alex’s planted a buffer strip that was 0.5 kilometer long by the road. What number should replace the to make a fraction equivalent to 0.5?
Enter your answer in the numerator ❑10
Christy planted a buffer strip that was 410 kilometers on one side of her driveway and 7100
kilometer on the other side of the driveway. Christy said that her buffer strip was 47100
kilometers long. She said she is doing more to help prevent runoff because her buffer strip is longer because 47 is more than 5.
Identify the incorrect reasoning in Christy’s statement.
Explain how Christy can correct her reasoning.
Use >, <, or = to give a correct comparison between the length of Alex and Christy’s buffer strip.
Enter the incorrect reasoning, your explanation, and the correct comparison in the space provided.
After a big rainstorm, the nitrate levels in Lake Erie was 315. This was 9 times more than it was before the rain. What was the level of nitrates before it rained?
Fifth Grade:

On Saturday, Craig planted wheat seeds on 58 of a mile. On Sunday, he planted 12 of a mile
more. Craig added 58 and 12 to find the total distance, in miles, of wheat seeds he planted.
Craig said 58 + 12 = 610 and plotted 610 of this number line.
Explain why Craig’s answer is not reasonable.
Find the total distance, in miles, Craig planted seeds on Saturday and Sunday.
Explain how to use the number line to show your answer is correct.
Enter your answer and explanations in the space provided.
On Monday, Madison read the level of toxic algae in Sandusky Bay was 48 units. On Tuesday,
she heard the level of toxic algae was only 38 of what it was on Monday. What was the level of
algae on Tuesday?
a) 21
b) 128
c) 18
d) 9
Jason was doing research on Lake Erie algae. He found the nitrate levels were 34 parts per hundred. What number represent how much nitrate was found in Jason’s sample?
a) 34.00
b) 3.40
c) 0.034
d) 0.34
e) 3,400
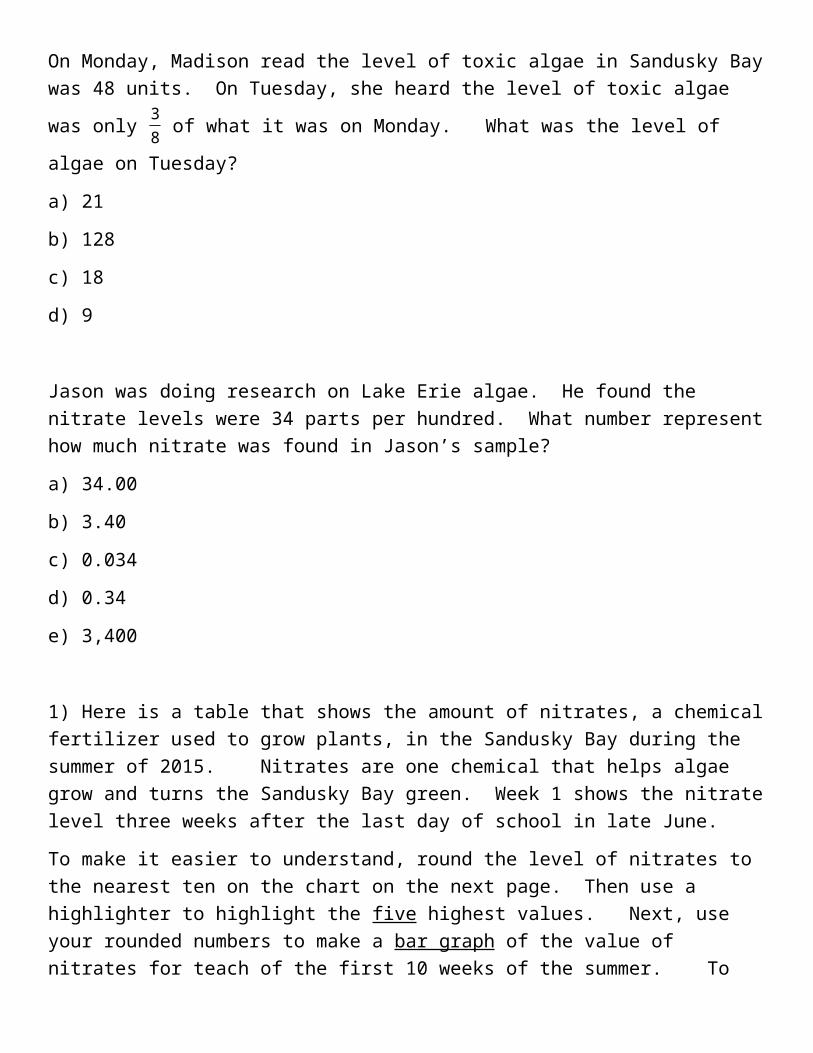
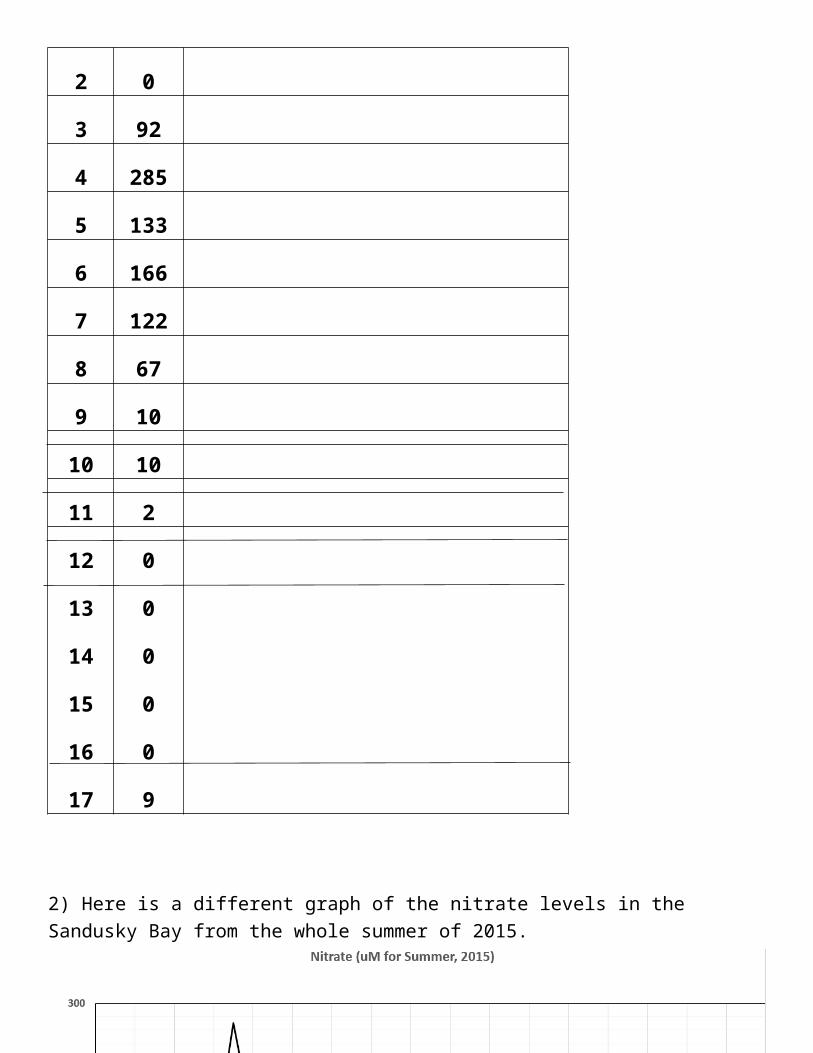
1) Here is a table that shows the amount of nitrates, a chemical fertilizer used to grow plants, in the Sandusky Bay during the summer of 2015. Nitrates are one chemical that helps algae grow and turns the Sandusky Bay green. Week 1 shows the nitrate level three weeks after the last day of school in late June.
To make it easier to understand, round the level of nitrates to the nearest ten on the chart on the next page. Then use a highlighter to highlight the five highest values. Next, use your rounded numbers to make a bar graph of the value of nitrates for teach of the first 10 weeks of the summer. To make a bar graph, color in the boxes that best match each week’s value.
300
280
260
240
220
200
180
160
140
120
100
80
60
40
20
0
Week1
Week2
Week3
Week4
Week5
Week6
Week7
Week8
Week9
Week10

Week Nitrate Nitrate Levels Rounded to the Nearest Ten
1 19
2 0
3 92
4 285
5 133
6 166
7 122
8 67
9 10
10 10
11 2
12 0
13 0
14 0
15 0
16 0
17 9
2) Here is a different graph of the nitrate levels in the Sandusky Bay from the whole summer of 2015.
Without looking back at your chart, use estimation skills to determine what the value of nitrates was for the following weeks:
Week 1: _________________________________________________
Week 2: _________________________________________________
Week 3: _________________________________________________
Week 4: _________________________________________________
Week 5: _________________________________________________
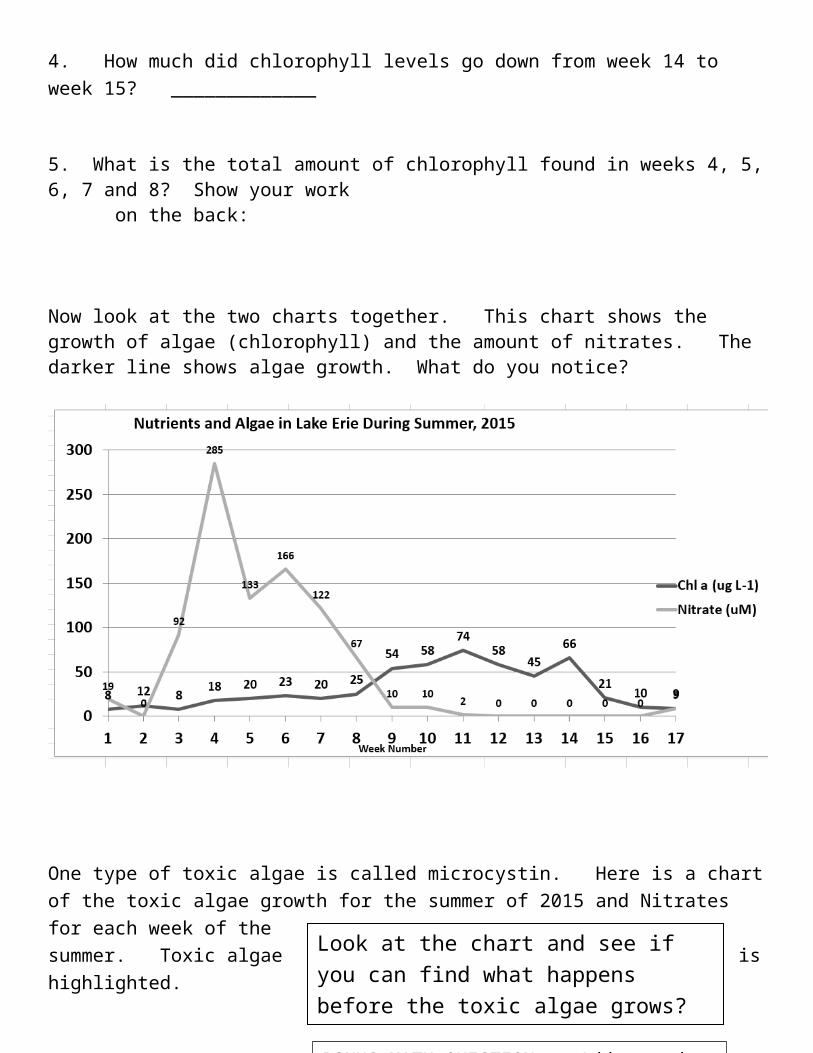
Here is a chart that shows the growth of algae during the same 17 weeks of summer 2015. Algae is found by the presence of chlorophyll. Chlorophyll is green and helps the plant collect sunlight and make food. A higher score of chlorophyll means more algae on Sandusky Bay.
1. What week had the highest amount of chlorophyll? Week ____________________
2. How much more chlorophyll was found in week 9 from week 8? _________________
3. Chlorophyll levels dropped the most in this week. Week _______________________
4. How much did chlorophyll levels go down from week 14 to week 15? _____________
5. What is the total amount of chlorophyll found in weeks 4, 5, 6, 7 and 8? Show your work on the back:

Now look at the two charts together. This chart shows the growth of algae (chlorophyll) and the amount of nitrates. The darker line shows algae growth. What do you notice?
One type of toxic algae is called microcystin. Here is a chart of the toxic algae growth for the summer of 2015 and Nitrates for each week of the summer. Toxic algae is highlighted.
WeekNitrate (uM)
microcystin toxin(ppb)
1 19 5 2 0 53 92 204 285 25 133 76 166 57 122 308 67 89 10 2
10 10 411 2 312 0 213 0 314 0 615 0 1216 0 15
Look at the chart and see if you can find what happens before the toxic algae grows?
BONUS MATH QUESTION: Add together all of the toxic algae levels that are multiples of 5 (end in 5 or 0). What sum do you get?
17 9 3Here is one last chart from the summer of 2015. This chart shows the level of rain during each week of the summer and the levels of nitrates, chlorophyll and toxic algae. How does the level of rain affect the nitrate levels?
Week Chylophyll
Nitrate (uM)
Microcystin toxin(ppb)
Weekly Rain
(inches)
1 8 19 5 2.22 12 0 5 1.433 8 92 20 3.474 18 285 2 05 20 133 7 2.876 23 166 5 1.437 20 122 30 0.488 25 67 8 1.389 54 10 2 0.74
10 58 10 4 1.3311 74 2 3 0.6912 58 0 2 0.113 45 0 3 0.4914 66 0 6 0.215 21 0 12 0.6816 10 0 15 017 9 9 3 0.31
1. Add together how much rain fell during the first 3 weeks of the summer.
2. How much more rain fell in week 5 than in week 6 in inches?
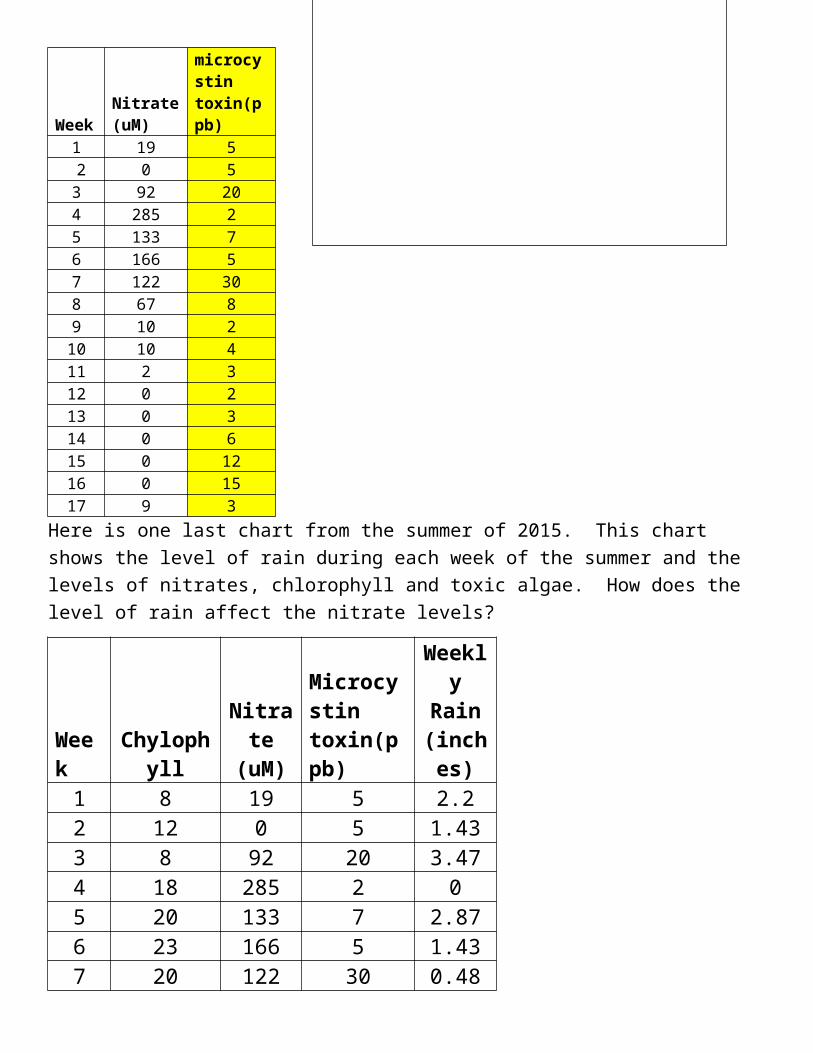
3. Round the amount of rain that fell in the first 7 weeks to the nearest 14 in the table below:
Weekly Rain (inches) Rain rounded to the nearest 14
2.2
1.43
3.47
0
2.87
1.43
0.48