Projects and Practical Work in GCSE Statistics - … · Projects and Practical Work in GCSE...
8
Projects and Practical Work in GCSE Statistics David Green - Leicatershire, England 1. GCSE Statistics In 1988 the GCSE examination was introduced in England and Wales to replace the dual system of examinations taken at age 16 years, GCE (for the most able) and CSE (for the majority). Certificates are awarded in individual subjects. Most school pupils take fiom six to ten subjects, nearly always including Mathematics and English. One of the many subjects on offer is Statistics which entails both written examination and course work. GCSE Statistics is normally taken as a two-year course (age 14-16) although some candidates take it the year after sitting their main GCSE examinations, as a one-year course (age 16-17). It is very much a minority subject (perhaps taken by 1% of all school candidates). Currently there are five separate examination boards for England and Wales providing five different syllabuses. However, in 1992 all five will combine to provide a single syllabus, to be first examined in 1994. A working party of the Joint Rationalis- ation Group for the GCSE Boards is currently devising the new syllabus. Final agreement has not yet been reached although much progress has been made. The philosophy pervading GCSE Statistics is typified in one board's Notes for the Guidance of Teachers for the 1991 examination: "Statistics is essentially a practical subject ... A basic principle of statistical work is getting information from an appropriately drawn sample and inferring results ... It follows that no course in statistics will convey the essence of the subject if it does not include practical work ... It is hoped that the bulk of the teaching of this GCSE course will be based on practical work." (MEG, 1989) Other boards express similar sentiments. It is very clear that for all boards the whole GCSE Statistics course, and not just the project work, is seen to be practically orientated. It is important that the coursework shares the same ethos as the rest of the course, otherwise it tends to be treated as a peripheral aspect and undervalued. Session A4 224 ICOTS 3, 1990: David Green
Transcript of Projects and Practical Work in GCSE Statistics - … · Projects and Practical Work in GCSE...
Projects and Practical Work in GCSE Statistics
David Green - Leicatershire, England
1. GCSE Statistics
In 1988 the GCSE examination was introduced in England and Wales to replace the dual system of examinations taken at age 16 years, GCE (for the most able) and CSE (for the majority). Certificates are awarded in individual subjects. Most school pupils take fiom six to ten subjects, nearly always including Mathematics and English. One of the many subjects on offer is Statistics which entails both written examination and course work. GCSE Statistics is normally taken as a two-year course (age 14-16) although some candidates take it the year after sitting their main GCSE examinations, as a one-year course (age 16-17). It is very much a minority subject (perhaps taken by 1% of all school candidates).
Currently there are five separate examination boards for England and Wales providing five different syllabuses. However, in 1992 all five will combine to provide a single syllabus, to be first examined in 1994. A working party of the Joint Rationalis- ation Group for the GCSE Boards is currently devising the new syllabus. Final agreement has not yet been reached although much progress has been made.
The philosophy pervading GCSE Statistics is typified in one board's Notes for the Guidance of Teachers for the 1991 examination:
"Statistics is essentially a practical subject ... A basic principle of statistical work is getting information from an appropriately drawn sample and inferring results ... It follows that no course in statistics will convey the essence of the subject if it does not include practical work ... It is hoped that the bulk of the teaching of this GCSE course will be based on practical work." (MEG, 1989)
Other boards express similar sentiments. It is very clear that for all boards the whole GCSE Statistics course, and not just the project work, is seen to be practically orientated. It is important that the coursework shares the same ethos as the rest of the course, otherwise it tends to be treated as a peripheral aspect and undervalued.
Session A4 224
ICOTS 3, 1990: David Green

2. Coursework requirements
The coursework component forms a significant part of every board's syllabus, from 25% to 40% of the total assessment. The amount of time to be devoted to the coursework is in proportion to its weighting. Generally the boards are non-committal about the volume of work expected, but one suggests that "written reports on the projects taken together should be in the order of 2500 to 5000 words in length"; another states that a minor project "should take about 6 hours to complete" and have about 12 A4 sides of report, with a major project having twice these figures. These times seem gross underestimates. Boards differ also in either weighting all projects equally or, more commonly, differentiating between major and minor projects. The minimum number of pieces of work required varies from board to board, ranging from one to three. The maximum number varies from three to five although one board sets no upper limit.
Requiring only one project may make the life of the teacher rather easier but it is not so helpful educationally for the pupil, for several reasons: a single project limits the range of statistical topics which can be covered; pupils are "putting all their eggs in one basket"; pupils cannot readily learn from their mistakes and improve in a subsequent project; pupils may find it difficult to maintain interest and momentum.
On the other hand pupils are under great pressure with many calls on their time, as are their teachers. The open-endedness of one board and the "up to 5 projects" of another may make too great a demand on pupils. Similarly the requirement of 3 or 4 projects of equal status can be very burdensome as pupils feel that every piece must be a major project. Perhaps the ideal solution is to give a choice between "one major and two minor projects" and "two major projects".
Coursework common to two curriculum areas could be most helpful even if the time saved were rather small. Group work raises great problems for assessment and seems an unlikely way forward except for a few particularly successFul schools. Boards vary in their enthusiasm for it.
3. Suggestions and actual projects
Some suggestions for projects supplied by a board (MEG, 1989) are:
(9
(ii>
(iii)
(iv)
(v) (vi)
Correlation: (a) Age and weight; (b) Attendance at a football club and team performance. Comparisons: (a) Do oranges from one shop weigh more than those from another shop even though they cost the same? (b) Prices of toothpaste. Time Series: (a) Weather; (b) Population trends relating to your town, district or school. Find, using a questionnaire, the views of your school on reading or entertainment preferences. Obtain and analyse data related to reaction times (perhaps using a computer). Select three different kinds of statistical presentation from published Government statistics. Discuss their merits and suggest other ways in which the data might
ICOTS 3, 1990: David Green

(vii) Open a telephone directory at random and count how many numbers end in 1,2,3,4,5,6,7,8,9,0 and discuss your results.
(viii) A species of beetle reproduces as follows: 30% of females die without female offspring; 40% of females have one female offspring; 30% of females have two female offspring. Simulate the female descendants of 10 females up to the fifth generation and comment. Try varying the proportions.
Some suggestions from another board (NEA, 1989) are:
(i) conducting a school census; (ii) conducting an opinion poll; (iii) comparing urban and rural life patterns by studying two data files for the 1861
survey; (iv) designing a Fruit Machine to conform to the Lotteries Act; (v) running a weather station.
Unfortunately, schools tend to take board's suggestions for projects quite literally and impose these on pupils and then rather dull projects are often produced. (For ideas for projects and practical work see the list of references.)
The list 6f projects below, which were all submitted to one board in the past two 1 years, to some extent contrast with the "official" suggestions given above: I
I I
How old are cars when they are scrapped? I
How does petrol consumption of a car vary? Who uses which forms of transport and why?
i
i
How can the operation of traffic lights be simulated? I
How do newspaper advertisements vary with paper and season? What determines the price of a secondhand car? How does memory vary with age? How does tiredness affect performance (on a computer game)? Does factory output vary with the weather? Basketball scoring ability and height. School absences Baked Beans.
4. What makes a good project?
If we take an apparently banal topic - such as Baked Beans - must we expect a banal project? The answer is NO! It is surprising how much good statistical work can be done. For example:
(i) The relationship between brands, sizes and prices. (ii) Why do people buy particular brands? (iii) Can people tell the difference between brands? (iv) Do people think they can distinguish brands by taste? (v) Are sales and opinion affected by advertising?
Session A4
ICOTS 3, 1990: David Green
(vi) How much do people eat? Are there variations with age, sex, etc? (vii) Are there variations in sales from country to country? (viii) How, when, and where are baked beans eaten? (ix) What do people know about the nutritional value of baked beans?
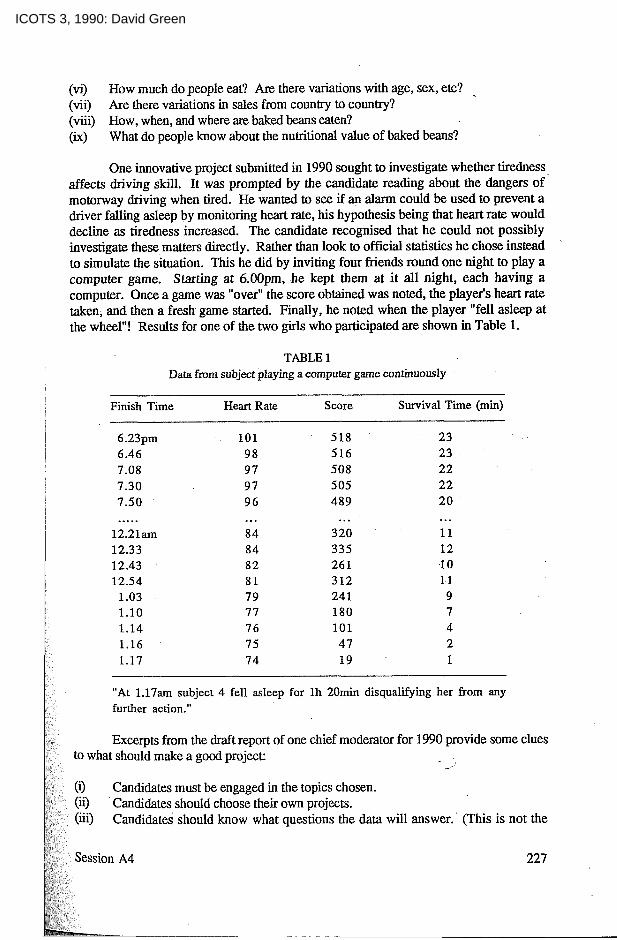
One innovative project submitted in 1990 sought to investigate whether tiredness affects driving skill. It was prompted by the candidate reading about the dangers of motorway driving when tired. He wanted to see if an alarm could be used to prevent a driver falling asleep by monitoring heart rate, his hypothesis being that heart rate would decline as tiredness increased. The candidate recognised that he could not possibly investigate these matters directly. Rather than look to official statistics he chose instead to simulate the situation. This he did by inviting four friends round one night to play a computer game. Starting at 6.00pm, he kept them at it all night, each having a computer. Once a game was "over" the score obtained was noted, the player's heart rate taken, and then a fresh game started. Finally, he noted when the player "fell asleep at the wheel"! Results for one of the two girls who participated are shown in Table 1.
TABLE 1 Data from subject playing a computer game continuously
Finish Time Heart Rate Scare Survival Time (min)
6.23pm 101 518 23 6.46 9 8 5 16 23 7.08 97 508 22 7.30 9 7 5 05 22 7.50 96 489 2 0 ..... . . . . . . . . .
12.21am 8 4 3 20 11 12.33 8 4 335 12 12.43 82 26 1 10 12.54 8 1 312 11 1.03 7 9 24 1 9 1.10 77 180 7 1.14 7 6 101 4 1.16 75 47 2 1.17 7 4 19 1
"At 1.17am subject 4 fell asleep for lh 20min disqualifying her from any further action."
Excerpts from the draft report of one chief moderator for 1990 provide some clues to what should make a good project:
- , J
(i) Candidates must be engaged in the topics chosen. (E) ' Candidates should choose their own projects. (iii) Candidates should know what questions the data will answer.' (This is not the
227
ICOTS 3, 1990: David Green

same, as some candidates believe, as deciding in advance what the answers will be!)
The chief examiner for another board, who is involved in the rationalisation work, believes that good practicaVproject work should include:
-
(i) good use of primary and secondary data; (ii) evidence of both survey work and experimental design work, (iii) well designed work clearly presented showing a clear strategy; (iv) understanding of a wide range of statistical methods; (v) evidence that the candidate can clearly interpret the data, draw conclusions, and
make critical evaluations.
Clearly not every single piece would necessarily have all these qualities but the overall total coursework element should. Finally, the following are some suggestions for an excellent project:
(i) eye catching; (ii) w y to read; (iii) interesting;
(iv) topical; (v) surprising; (vi) not over-long.
To improve project work it may be helpful to look at some apparent weaknesses in candidates' coursework. Candidates - and not just the weaker ones - tend to use every conceivable means of "filling out" their work. An examiner's report (NEA, 1988) stated that "One candidate produced 110 pages of graphs" and this has been experienced at other boards, although things are improving. Sometimes pupils are encouraged in this folly by their teachers. One school issued the following guidance to its pupils in 1990: "Make a decision as to what form of presentation you prefer. You can have all other forms of presentation in an appendix." It is a problem for all to face. Assessment guidelines which require "a wide use of different forms of data representation" to be employed in toto encourage this proliferation unwittingly. The following points from a recent examiner's report (NEA, 1989) highlight some further areas of weakness which are common across the boards, the area most difficult for pupils being making inferences and drawing conclusions.
"The opportunity to investigate had been lost by some centres." "Some do not understand what experimental design involves." "Some do not know what is meant by primary and secondary data." "Interpretation and conclusions ... still ... a difficult section." "Very few made ... suggestions for improvement of their work." "Very little has been used from across the curriculum."
5. Criteria for assessment of projects
The boards lay down (apparently) very clear and precise guidelines for the marking of projects which is done in school by the teachers and then externally
Session A4 228
ICOTS 3, 1990: David Green

moderated. Unfortunately with precision can come rigidity which can lead to a teacher laying down very precise guidance on the contents of a project and then awarding much higher marks than the moderator considers appropriate. The writer has personal experience of reducing a mark from 94% to 54%. However, such instances are rare and becoming rarer as awareness of what is expected and the standard of marking improves. (The quality and appropriateness of the projects themselves is also improving.)
Typical is one board for which assessment is split up into judging each of four skills using the full 0-10 range of marks and it is not expected that every skill should feature in every project. The best two scores for each skill contribute to the total score; the maximum mark for each skill is 10, giving a maximum total score of 80. The four skills are (MEG, 1989): Experimental Design and Data Collection; hesentation and Tabulation of Data; Analysis; Inference and Conclusions.
As guidance for marking projects some boards publish additional verbal criteria for each skill. One board's criteria for one skill are as follows (MEG, 1990):
MARKS Candidates have demonstrated the ability:
Low to recognise suitable ways of representing data; to recognise misleading ways of representing data; to construct bar charts from grouped data;
and in addition Mid to construct bar charts from ungrouped data;
to construct a frequency distribution table; and in addition
High to choose suitable ways of representing data with reasoned argument; to use a frequency distribution table.
This example shows how difficult it can be to provide sensible guidelines. It seems that some discussion of "misleading diagrams" is necessary and that "bar charts" must be used and the only way to gain a very high mark is to "use a frequency distribution table". This is clearly nonsensical but the teachers may take this literally, and who can blame them? One can envisage litigation over this! The same board's Analysis skill guidelines are similarly flawed. The writer would prefer to see more general guidelines and then separate exemplars, as used by most boards. The place for testing very specific micro-skills must lie in the written examination.
All boards have much in common in their skill areas for assessment. There is a clear contrast between boards who require each project to be separately assessed and those who require all a candidate's submitted project work to be marked as a totality. This latter course would seem to be more difficult to do well although it may be less demanding in time. Oral assessment features in only one board where it counts for 20% of the Project assessment (SEG, 1986). It is to be carried out at "appropriate places in the course". Usehl guidance as to the kinds of questions to ask is provided.
The main function of the moderator is to decide on the standardisation of marks and where necessary to make adjustments to the marks for whole groups or subgroups or individuals. Rarely is the rank order found to be seriously at fault. Moderation is generally carried out postally. The published annual examiners' reports are non-specific
Session A4 229
ICOTS 3, 1990: David Green

and may not be seen by the teachers at all. Increasingly, therefore, there is a recognised need for more direct feedback from moderator to school.
6. National developments in GCSE and future problems
The UK's School Examinations and Assessment Council (SEAC), which oversees GCSE, is in the process of revising its GCSE Criteria for Mathematics. A draft document (SEAC, undated) is currently circulating, which is quite encouraging for statistical work, and contains the following draft criteria:
Mathematical approaches All courses should encourage candidates to develop:
a positive attitude to mathematics ...; an ability to think mathematically ...; a willingness to work independently and cooperatively; an ability to communicate and understand mathematical ideas.
Mathematical applications All courses should encourage candidates to develop:
an appreciation of how mathematics is applied to real-life situations, including the use of technology aids as appropriate; the knowledge, skills and understanding needed to apply a range of mathematical concepts to everyday situations; an ability to use mathematics in other curriculum areas; a fm foundation for appropriate fwzher study.
The British Government has recently decided to regulate the school curriculum and has published a National Curriculum for pupils aged 7 to 16 years (DES, 1989). Furthermore, it will monitor achievement by standard tests at ages 7, 11, 14 and 16. Recently it was announced that the assessment at age 16 would be mainly through the GCSE which must therefore be adapted to meet the needs of the National Curriculum assessment process.
Detailed guidelines will eventually be produced for all subjects but initially emphasis has been placed on core subjects such as mathematics, which therefore has relevance for GCSE Statistics. Indeed the mathematics curriculum contains a substantial section entitled "Data Handling". This is promoting statistics from the age of 7 years and effectively inserting aspects of GCSE Statistics within GCSE Mathematics. A full discussion of it may be found in Rouncefield (1989).
All those involved with GCSE Statistics wish the practical ethos to remain central but the stringent assessment criteria of the National Curriculum may make this more difficult. Recent political intervention with its conservative bias poses a threat. (History has been a particular victim with the Government's declaration in July 1990 that historical fact, rather than process, must be the dominant criterion for assessment.) It is not easy to reconcile a broad, investigative, individualised approach to statistics - and to the project work in particular - with the heavy demands on time felt by teacher and pupil alike. The use of the same piece of work for two areas of assessment (e.g.
Session A4 230
ICOTS 3, 1990: David Green

statistics and biology), which might lighten the load, is rarely found as yet. There are clear baniers to crosscurricular activity becoming common.
Oral work is now recognised to be of value within GCSE Mathematics and is now being assessed. This could prove a most valuable aspect in statistics but much effort to establish good practice will be needed. It remains to be seen if the new single syllabus will include oral assessment or not. Computer technology has barely affected statistics yet. Its influence could be profound. There remains the question of whether, like computer studies, statistics will become diffused within all curriculum areas, or will be subsumed into mathematics, or will develop as a vigorous and popular discipline with its own unique ethos. Statistics, with its emphasis on investigation and inference, has so much to offer but this still lies largely unrecognised.
References
DES (1989) Mathematics in the National Curriculum. Department of Education and Science. HMSO.
MEG (1989) GCSE Statistics Syllabus for 1991. MEG (1990) Instructions for Course Work Moderators. NEA (1988) GCSE Statistics Report for 1988. NEA (1989) GCSE Statistics Report for 1989. Rouncefield, M R (1989) Curriculum matters : statistical teaching within mathematics :
the impact of the National Curriculum. Teaching Statistics ll(1). 57-8. SEAC (undated) Dr@ Modified GCSE Criteria for Mathematics. SEG (1986) GCSE Statistics Syllabus for 1988.
Sources of ideas for practical work and projects
Garbutt, J (1990) Take five - five practical activities. Teaching Statistics 12(1). 12-14. Graham, A (1990) Investigating Statistics. Hodder and Stoughton. Holmes, P (ed) (1986) The Best of Teaching Statistics. Teaching Statistics Trust,
Sheffield University. Mead, R (1990) Statistical games 1 - TOMATO. Teaching Statistics l2(3). Rouncefield, M and Holmes, P (1989) Practical hypothesis testing using the sign test.
Teaching Statistics l l ( l ) , 16-17. Rouncefield, M and Green, D (1989) Condorcet's paradox. Teaching Statistics 11(2),
Royle, G (1989) Data bank : water pollution. Teaching Statistics l l (3), 87. Underhill, L (1989) FORESTER - a simulation game for teaching survey sampling.
Teaching Statistics l l ( l ) , 8-1 1. Wang, A-L (1989) The game of Tai Sai. Teaching Statistics 11(1), 2-3.
ICOTS 3, 1990: David Green