Projection Radiography - NYU Tandon School of...
77
Projection Radiography Yao Wang Polytechnic School of Engineering New York University, Brooklyn, NY 11201 Based on Prince and Links, Medical Imaging Signals and Systems and Lecture Notes by Prince. Figures are from the book. EL-GY 6813 / BE-GY 6203 / G16.4426 Medical Imaging
Transcript of Projection Radiography - NYU Tandon School of...
Projection Radiography
Yao Wang Polytechnic School of Engineering
New York University, Brooklyn, NY 11201
Based on Prince and Links, Medical Imaging Signals and Systems and Lecture Notes by Prince. Figures are from the book.
EL-GY 6813 / BE-GY 6203 / G16.4426 Medical Imaging

Projection Radiography Yao Wang, NYU 2
Lecture Outline • Instrumentation
– X-ray tube configuration – Filtration and restriction of x-ray photons – Compensation and Scatter control – Film screen detector – Digital X-ray
• Image formation – Geometric effect – Extended source – Detector/film response
• Image quality – Contrast and SNR – Effect of noise and Compton scattering

Projection Radiography Yao Wang, NYU 3
Overview

Projection Radiography Yao Wang, NYU 4
Radiographic System

Projection Radiography Yao Wang, NYU 5
X-ray Tube

Projection Radiography Yao Wang, NYU 6
X-Ray Tube Components

Projection Radiography Yao Wang, NYU 7
Exposure Control
" I_tube = 1-1000mA

Projection Radiography Yao Wang, NYU 8
X-Ray Spectra

Projection Radiography Yao Wang, NYU 9
Bremsstrahlung • Continuous spectrum of EM radiation is
produced by abrupt deceleration of charged particles (“Bremsstrahlung” is German for “braking radiation”).
• Deceleration is caused by deflection of electrons in the Coulomb field of the nuclei
• Most of the energy is converted into heat, ~0.5 % is x-ray
• The energy of the generated x-ray photon is given by energy conservation:
• The maximum energy for the produced photon is given by:
'e eh K Kν = −
,maxp e tubeE h K eVν= = =
K
K’
hν
Nucleus
[From Graber, Lecture Note for BMI1-FS05]

Projection Radiography Yao Wang, NYU 10
Bremsstrahlung intensity • Overall Bremsstrahlung intensity I:
• The produced x-ray power Px (in[W]) is given by: – Material constant k = 1.1×10⁻⁹ for Tungsten (Z=74).
2tube tubeI V I∝
2
/ : x-ray production efficiency
x tube tube tube tube tube
x tube tube
P k Z V I kZ V P P
P P kZ V
η
η
= = =
= =
Electrical power consumption of tube: Ptube = Itube × Vtube [W]
[From Graber, Lecture Note for BMI1-FS05]
Projection Radiography Yao Wang, NYU 11
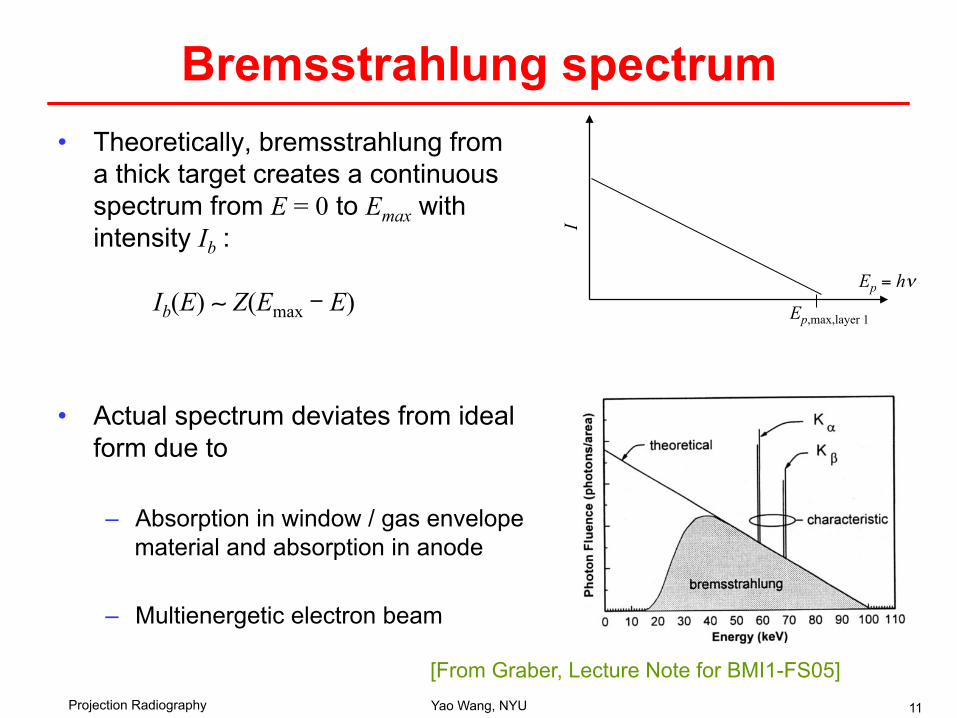
Bremsstrahlung spectrum • Theoretically, bremsstrahlung from
a thick target creates a continuous spectrum from E = 0 to Emax with intensity Ib :
Ib(E) ∼ Z(Emax - E)
• Actual spectrum deviates from ideal form due to
– Absorption in window / gas envelope material and absorption in anode
– Multienergetic electron beam
Ep = hν
I
Ep,max,layer 1
[From Graber, Lecture Note for BMI1-FS05]

Projection Radiography Yao Wang, NYU 12
Characteristic radiation • Narrow lines of intense x-ray at characteristic energies are superimposed on the
continuous bremsstrahlung spectrum. • Caused by removal of inner shell electrons and subsequent filling of hole with
electrons from higher shell. The shell-energy difference determines the energy of characteristic rays
• Lines are named after the lower shell involved in the process; the upper shell involved is denoted by Greek letters: Δn = 1 → α-transitions, Δn = 2 → β-transitions, ...
-
- -
- - -
- -
- -
-
hν
K L M
-
Continuum 0
K
L
M N
E [keV]
K-lines
L-lines
α β γ
α β
Kα
Kβ
Kγ
0.5 3
11
70
[From Graber, Lecture Note for BMI1-FS05]

Projection Radiography Yao Wang, NYU 13
Different types of characteristics rays
From http://hyperphysics.phy-astr.gsu.edu/Hbase/quantum/xterm.html#c1

Projection Radiography Yao Wang, NYU 14
X-ray spectra
• X-ray for general diagnostic radiology produced at 40 – 150 kVp
• Maximum photon energy: Ep[keV] = hνmax = e × kVp
• Characteristic radiation occurs only for anode voltages
e × kVp > IK,L,M,…
74W
[From Graber, Lecture Note for BMI1-FS05]

Projection Radiography Yao Wang, NYU 15
X-ray tube design • Cathode w/ focusing cup, 2 filaments (different spot sizes) • Anode
– Tungsten, Zw = 74, Tmelt = 2250 ºC – Embedded in copper for heat dissipation – Angled (see next slide) – Rotating to divert heat
[From Graber, Lecture Note for BMI1-FS05]

Projection Radiography Yao Wang, NYU 16
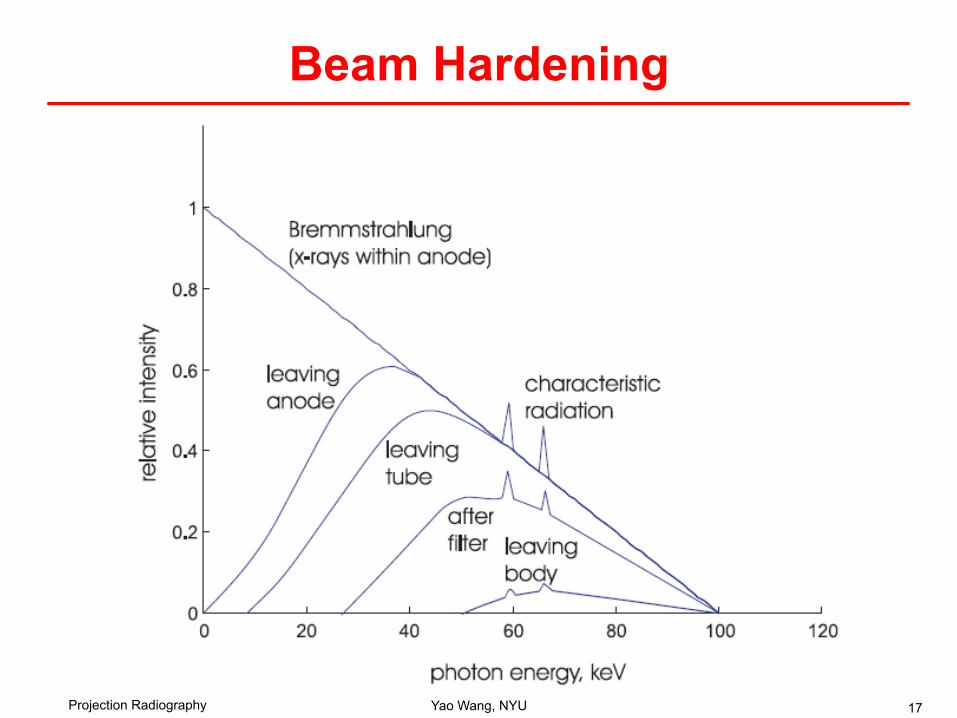
Filtration • Low energy x-ray will be absorbed by the body, without
providing diagnostic information • Filtration: Process of absorbing low-energy x-ray photons
before they enter the patient
Projection Radiography Yao Wang, NYU 17
Beam Hardening

Projection Radiography Yao Wang, NYU 18
Restriction

Projection Radiography Yao Wang, NYU 19
Compensation Filters

Projection Radiography Yao Wang, NYU 20
Contrast Agents
Iodine (33.2 KeV)
Barium (37.4KeV)
When the x-ray energy exceeds the Kedge (binding energy of K-shell), the mu coefficient is much higher, providing high contrast
Projection Radiography Yao Wang, NYU 21
Contrast Agents in Clinical Use • Iodine:
– Can be synthesized into soluble compounds that are safely introduced through intravascular injection or ingestion
– Used for imaging of • Blood vessels, heart chambers, tumors, infections • Kidneys, bladder
– Naturally exist in thyroid, and hence X-ray is very good for thyroid imaging
• Barium – Administered as a “chalky milkshake” – Used in the gastrointestinal tract,
• Stomach, bowel • Air
– Does not absorb x-ray – “opposite” type of contrast – By Inflating the lungs, air provides contrast for lung tissues

Projection Radiography Yao Wang, NYU 22
Scatter Control

Projection Radiography Yao Wang, NYU 23
Grids

Projection Radiography Yao Wang, NYU 24
Problem with Grids

Projection Radiography Yao Wang, NYU 25
Film-Screen Detector
Intensifying screen:
Phosphor: convert x-ray photons to light Reflective layer: Reflect light back to film

Projection Radiography Yao Wang, NYU 26
Radiographic Cassette

Digital Radiography • Replace film by digital detectors • Earlier system: Computer Radiography (CR)
– Store latent images in photostimulable imaging plates (PSP) – Need to be scanned by laser to form a digital image.
• CCD-based system – Small field of view – Group multiple CCD arrays
• TFT-based system • CMOS-based system
– Low cost: widely used in consumer cameras – Small field of view – Easier to tie multiple substrates than CCD arrays
• Portable, and reusable, some has wireless transmitter built in to send captured image to servers
Projection Radiography Yao Wang, NYU 27

Projection Radiography Yao Wang, NYU 28
TFT-Based Digital Radiology • Replace the intensifying screen/X-ray film by
– flat panel detectors (FPD) using thin-film transistor (TFT) arrays – A scintillator
• Consisting of many thin, rod-shaped cesium iodide (CsI) crystals
• When an X-ray is absorbed in a CsI rod, the CsI scintillates and produces light
• The light is converted into an electrical signal by a photodiode in the TFT array
• The electrical signal is amplified and converted to a digital value using an A/D converter
• A typical commercial DR system has flat panel dimensions of 41x41 cm, with an TFT array of 2048x2048 elements
• Ref: Webb, Introduction to biomedical imaging, Sec. 1.5.5

Projection Radiography Yao Wang, NYU 29
Biological effects of ionizing radiation • Damage depends on deposited (= absorbed) energy (intensity × time) per
tissue volume • Threshold: No minimum level is known, above which damage occurs • Exposure time: Because of recovery, a given dose is less harmful if divided • Exposed area: The larger the exposed area the greater the damage
(collimators, shields!) • Variation in Species / Individuals: LD 50/30 (lethal for 50% of a population
over 30 days, humans ~450 rads / whole body irradiation) • Variation in cell sensitivity: Most sensitive are nonspecialized, rapidly
dividing cells (Most sensitive: White blood cells, red blood cells, epithelial cells. Less sensitive: Muscle, nerve cells)
• Short/long term effects: Short term effects for unusually large (> 100 rad) doses (nausea, vomiting, fever, shock, death); long term effects (carcinogenic/genetic effects) even for diagnostic levels ⇒ maximum allowable dose 5 R/yr and 0.2 R/working day [Nat. Counc. on Rad. Prot. and Meas.]
[From Graber, Lecture Note for BMI1-FS05]

Projection Radiography Yao Wang, NYU 30
Image Formation • Basic imaging equation • Geometric effects • Extended source • Film blurring • Impact of noise and scattering

Projection Radiography Yao Wang, NYU 31
Basic Imaging Equations
Projection Radiography Yao Wang, NYU 32
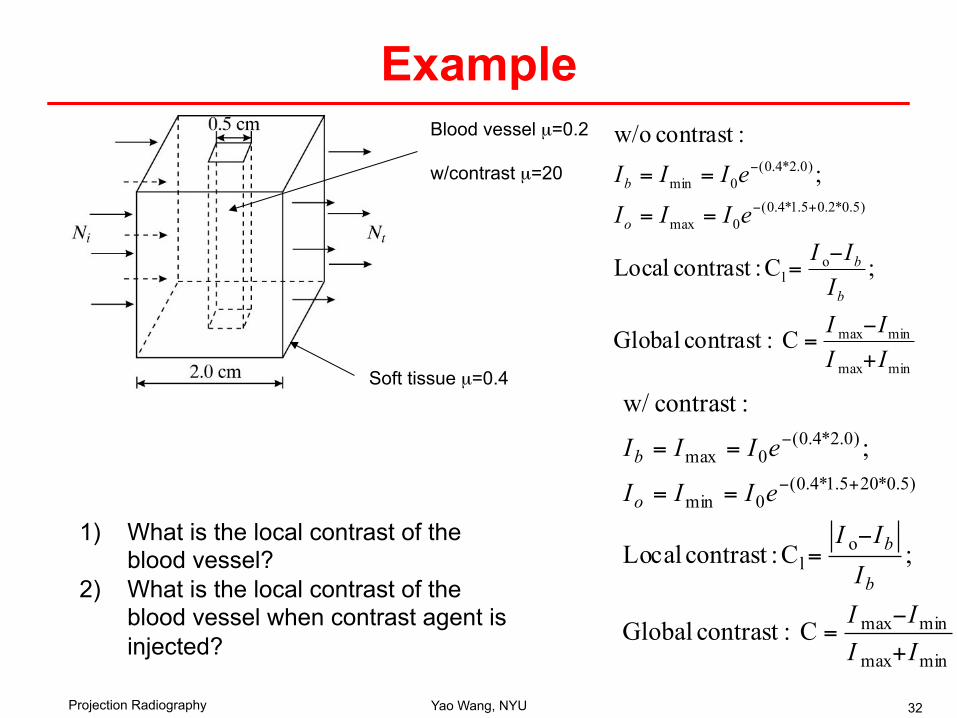
Example
minmax
minmax
ol
)5.0*2.05.1*4.0(0max
)0.2*4.0(0min
C :contrast Global
;C :contrast Local
;:contrast w/o
IIII
III
eIIIeIII
b
b
o
b
+
−=
−=
==
==+−
−
Soft tissue µ=0.4
Blood vessel µ=0.2 w/contrast µ=20
1) What is the local contrast of the blood vessel?
2) What is the local contrast of the blood vessel when contrast agent is injected?
minmax
minmax
ol
)5.0*205.1*4.0(0min
)0.2*4.0(0max
C :contrast Global
;C :contrast Local
;
:contrastw/
IIII
III
eIII
eIII
b
b
o
b
+
−=
−=
==
==+−
−

Projection Radiography Yao Wang, NYU 33
Geometric Effects

Projection Radiography Yao Wang, NYU 34
Inverse Square Law
I_0 is the detected flux at the origin of the detector plane I_r is the detected flux at an arbitrary point of the detector plane with angle θ w/o considering the oblique effect discussed in the next page

Projection Radiography Yao Wang, NYU 35
Obliquity
I0 should be replaced by Ir

Projection Radiography Yao Wang, NYU 36
Overall Effect of Beam Divergence
-> θ is small

Projection Radiography Yao Wang, NYU 37
Anode Heel Effect
Projection Radiography Yao Wang, NYU 38
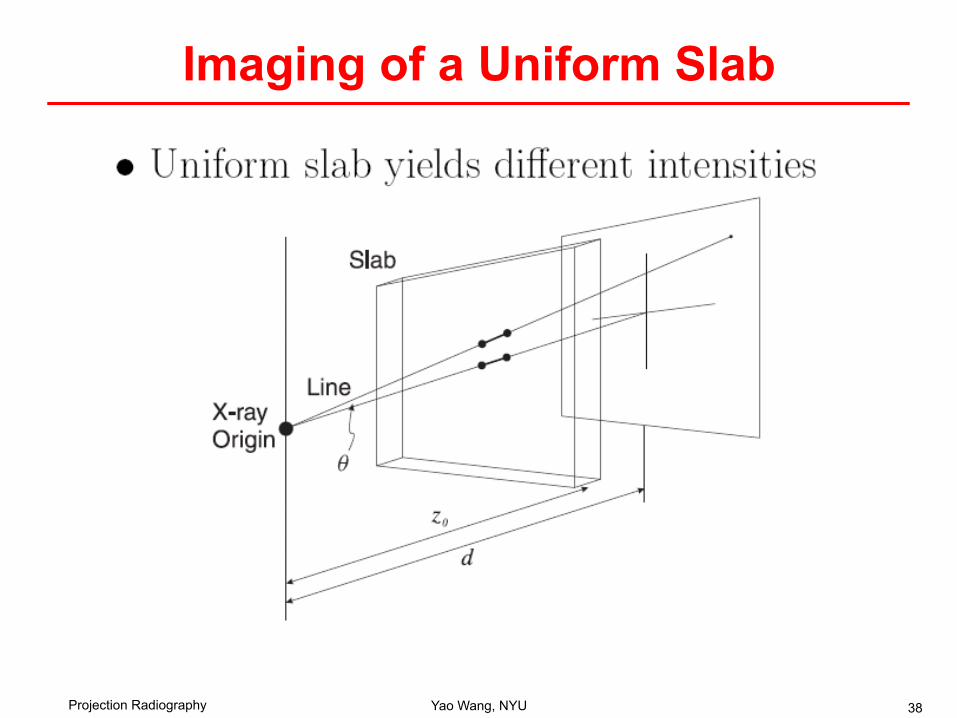
Imaging of a Uniform Slab

Projection Radiography Yao Wang, NYU 39
I_i = I_s/ (4 \pi d^2)
Illustrate the received intensity as function of y or x or \theta

Received Signal as a Function of Theta
Projection Radiography Yao Wang, NYU 40
0
0.05
0.1
0.15
0.2
0.25
0.3
0.35
0.4
0 1 2 3 4 5 6 7 8 9 10 11 12 13 14 15 16 17 18 19 20 21 22 23 24 25 26 27 28 29 30
cos(q)^3*exp(-1/cos(q))
Theta in Degree
This plot assumes mu*L=1, e.g. mu=1/cm, L=1cm.

• How does it vary as a function of Y when x=0 (vertical axis of the detector plain)?
• cos(q) = d/r=d/sqrt(d^2+y^2)/ • Assuming d=5m, y= -10cm to 10cm (q from 0 to 1.14
degree) • Vary small relative change in the range of y
Projection Radiography Yao Wang, NYU 41
0.3674 0.36745
0.3675 0.36755
0.3676 0.36765
0.3677 0.36775
0.3678 0.36785
0.3679 0.36795
-10 -9 -8 -7 -6 -5 -4 -3 -2 -1 0 1 2 3 4 5 6 7 8 9 10
intensity as function of y

Projection Radiography Yao Wang, NYU 42
Imaging of Two Layer Slab Consider the x-ray imaging of a two-layer slab, illustrated below. Determine the intensity of detected photons along the y axis on the detector plane. Express your solution in terms of the y-coordinate Sketch this function. You should consider the inverse square law and the oblique effect. Assume the x-ray source is an ideal point source with intensity I0. For simplicity, assume the slab is infinitely long in the y direction.
θ
X-ray sourceI0
Detector plane
Two layerSlab
L1 L2
µ1 µ2
0
y
D

Solution • Sketch on the board
Projection Radiography Yao Wang, NYU 43

Projection Radiography Yao Wang, NYU 44
Example: Image of a prism due to a point source
Consider the x-ray imaging of a cube. Determine the intensity of detected photons along the y axis on the detector plane. Express your solution in terms of the angle q. Sketch this function. You should consider the inverse square law and the oblique effect. Assume the x-ray source is an ideal point source with intensity I0, and the object has a constant linear attenuation coefficient m. (Example 5.4 in textbook)

Solution
Projection Radiography Yao Wang, NYU 45
Sketch over in class. Also see textbook. Complete as homework Must consider different regions separately Note the edge blurring effect.

Projection Radiography Yao Wang, NYU 46
Objects Magnification
Magnification factor:

Projection Radiography Yao Wang, NYU 47
Imaging of a Thin Non-Uniform Slab • Assume a very thin slab at z
– the linear absorption coefficient at (x’,y’) is µ(x’,y’) – Detector position (x,y) -> slab position (x’,y’)
x
y
x’
y’
x/d=x’/z -> x’=x z/d = x /M(z)
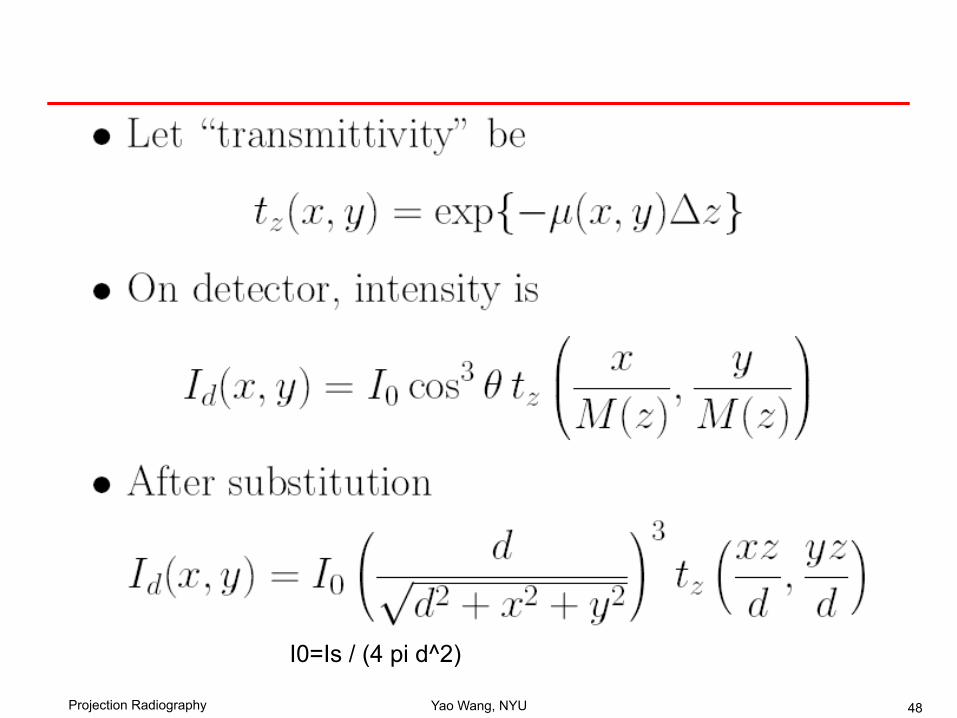
Projection Radiography Yao Wang, NYU 48
I0=Is / (4 pi d^2)

Projection Radiography Yao Wang, NYU 49
Blurring Due to Extended Source
First study the image through a pinhole - Impulse response
Image through an arbitrary objects - Impulse response * object attenuation profile
Note: blurring depends on the object distance! and source size. Less bluring when the object is closer to the detector plane!

Projection Radiography Yao Wang, NYU 50
Image of source through a pinhole
Reversed image
D’/(d-z)=-D/z -> D’=-D (d-z)/z =Dm
Pinhole: a infinitesimal hole (area=0) that passes the X-ray source w/o attenuation. Everywhere else the X-ray is completely absorbed
Loss of source intensity due to inverse square law
Scale factor due to pinhole (See textbook)
Call the following h(x,y) (response due to a pinhole at (0,0)

Projection Radiography Yao Wang, NYU 51
Image of an Arbitrary Slice • An arbitrary slab at z can be thought of as many
pinholes at different locations (x’,y’), each with transmittivity tz(x’,y’) – The received signal due to transmitivity at (x’,y’) can be written
as h(x-x’,y-y’) tz(x’,y’) assuming the system is translation invariant
• The image of the slab is a sum of individual images of the source through all the pinholes multiplied by the respective transmittivity – I_d(x,y)= \int_{x’,y’} h(x-x’,y-y’) tz(x’,y’) dx’ dy’
• The overall effect can be captured through linear convolution
Note: m and M depends on z, distance of slab to the source. When the object is next to the detector M=1, less blurring.

Projection Radiography Yao Wang, NYU 52
Example • Source is a circular disk with diameter D • Object is square plane with dimension W at distance z • Detector plane at distance d from source • How does the detected image look for d=2Z and d=3Z • Note that the blurring of the edge depends on z
• What is t_z(x,y) and s(x,y)? • What is I_d(x,y)? • How is I_d(x,y) related with t_z(x,y)? • How does the image of I_d(x,y) look?

Solution • Sketch on the board
Projection Radiography Yao Wang, NYU 53
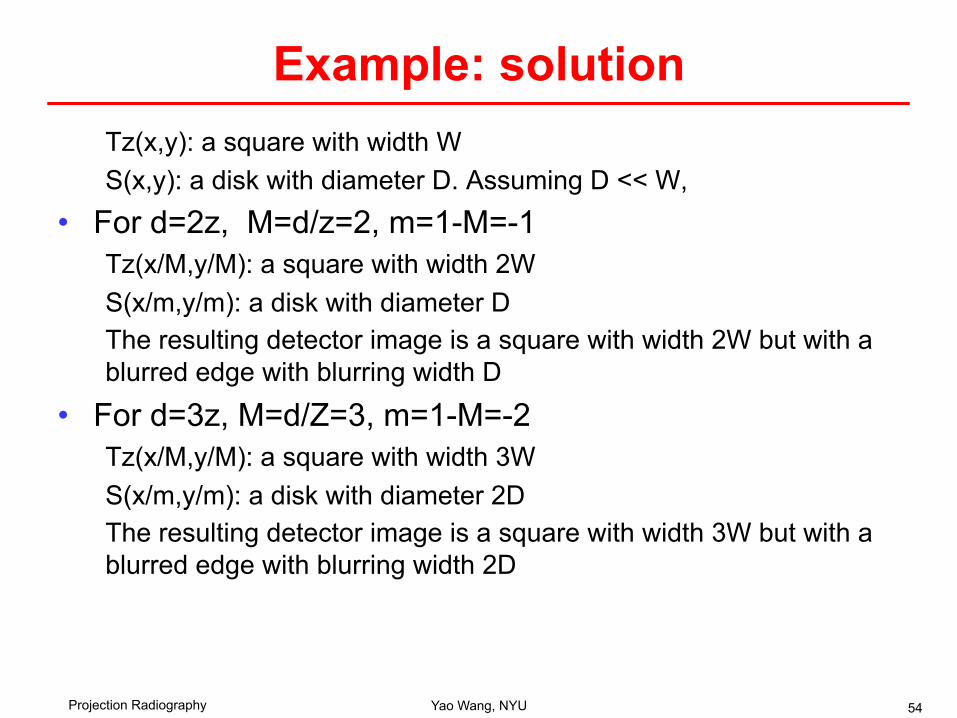
Example: solution Tz(x,y): a square with width W S(x,y): a disk with diameter D. Assuming D << W,
• For d=2z, M=d/z=2, m=1-M=-1 Tz(x/M,y/M): a square with width 2W S(x/m,y/m): a disk with diameter D The resulting detector image is a square with width 2W but with a blurred edge with blurring width D
• For d=3z, M=d/Z=3, m=1-M=-2 Tz(x/M,y/M): a square with width 3W S(x/m,y/m): a disk with diameter 2D The resulting detector image is a square with width 3W but with a blurred edge with blurring width 2D
Projection Radiography Yao Wang, NYU 54

Projection Radiography Yao Wang, NYU 55
Film Screen Blurring
A single x-ray photon causes a blurry spot on the film which is effectively the “impulse response” to the x-ray impulse h(x,y)
Typical MTF for a film-screen detector

Digital Detector Blurring • Digital detectors also lead to blurring in the detected
image, due to the thickness of the scintilators. • Such effect can still be modeled by an impulse response,
also denoted by h(x,y).
Projection Radiography Yao Wang, NYU 56

Projection Radiography Yao Wang, NYU 57
Overall Imaging Equation • Including all effects (geometric, extended source, film-screen
blurring), the image corresponding to a slab at z with transmittivity function tz(x,y) is
• For an object with a certain thickness, the transmittivity function must be modified to reflect the overall attenuation along the z-axis
• When the source is polyenergetic, integration over photon energy is additionally needed

What does it mean? • Output image = scaled version of the object * g(x,y)
• Scaling depends on the object position z – Less magnification when object is closer to the detector
• g(x,y)= ?
• g(x,y) depends on both source and detector blurring and position z!
Projection Radiography Yao Wang, NYU 58

Projection Radiography Yao Wang, NYU 59
Example • In the previous example, how would the image look if the
film blurring is a box function of width h?
Projection Radiography Yao Wang, NYU 60
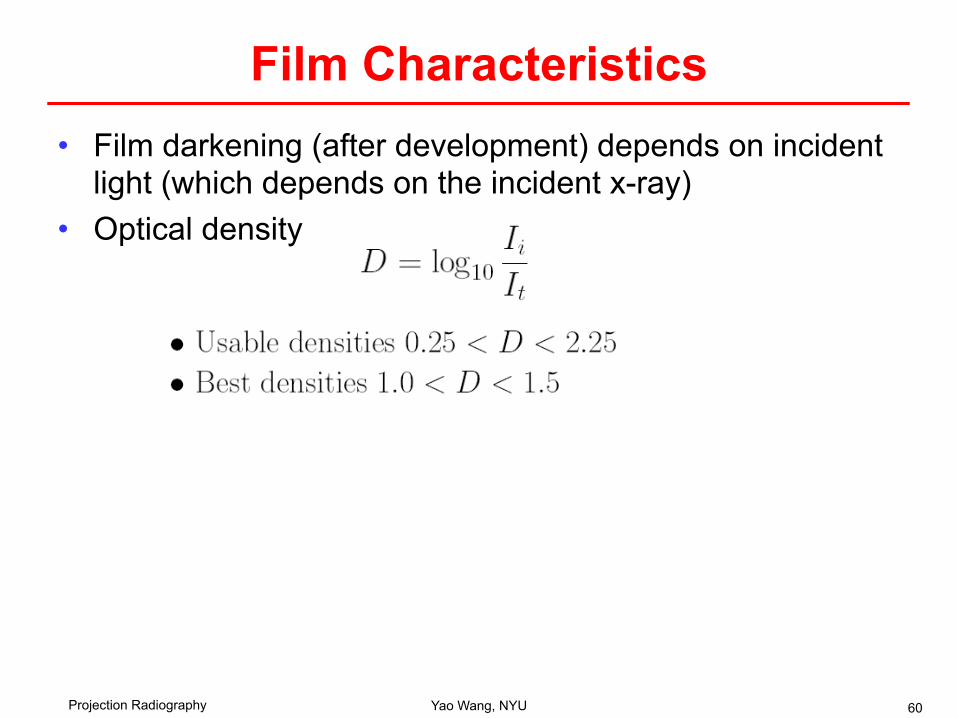
Film Characteristics • Film darkening (after development) depends on incident
light (which depends on the incident x-ray) • Optical density

Projection Radiography Yao Wang, NYU 61
Optical Density vs. Exposure

Projection Radiography Yao Wang, NYU 62
The H&D Curve

Projection Radiography Yao Wang, NYU 63
Effect of Noise • Source of noise:
– Detector does not faithfully reproduce the incident intensity – X-rays arrive in discrete packets of energy. This discrete nature
can lead to fluctuations in the image

Projection Radiography Yao Wang, NYU 64
How is noise related to signal? • Assuming the number of photons in each burst follows the Poisson
distribution – P(N=k)= (a^k / k!) e^{-a} – Variance = mean = a
• Let Nb denotes the average number of photons per burst per area • Let hv denotes the effective energy for the X-ray source • The average background intensity is
• The variance of photon intensity is
• The SNR is • SNR can be improved by
– Increasing incident photon count – Improving contrast
• Recall SNR=(I_t-I_b)/s_b=C I_b/s_b, C=(I_t-I_b)/I_b
22 ⎟
⎠
⎞⎜⎝
⎛Δ
=tA
hvNbbσ
222
2
variance,mean with RV a is
variance,mean with RVan is If
xyxy
xx
aaaXY
X
σσηη
ση
===

Projection Radiography Yao Wang, NYU 65
Detective Quantum Efficiency
When a x-ray source has mean intensity m=N_b, and variance s^2=N_b, SNR =m/s=\sqrt(N_b)

Projection Radiography Yao Wang, NYU 66
Example • Suppose an X-ray tube is set up to fire bursts of photons each with
N=10000 photons and the detector’s output (# of detected photons per burst) x has a mean =8000, variance=40000. What is its DQE?
• Solution:
correctly detected are photons of 16%about only that means This
16.0SNRSNRDQE
402008000
400008000
variancemeanSNR
40000 variance8000,mean has photons detected of# The
10010000variance
mean SNR
10000)variance(mean processPoisson thefollows ray tube- xat the fired photons of # actual The
2
in
out
out
in
=⎟⎟⎠
⎞⎜⎜⎝
⎛=
====
==
===
==

Projection Radiography Yao Wang, NYU 67
Effect of Compton Scattering • Compton scattering causes the incident photons to be deflected
from their straight line path – Add a constant intensity Is in both target and background intensity
(“fog”) – Decrease in image contrast – Decrease in SNR
bb
b
b
bt
b
t
NCIC
IIIC
II
==
−=
σSNR
contrast
:intensity background :intensitytarget
:scattering W/o
bsbs
b
sb
b
b
b
b
ssb
b
sb
bt
sb
st
IINNN
CNN
NCIC
IICC
III
IIIIC
IIII
/11SNR
/1SNR'
1'contrast
:intensity background :intensitytarget
:scatteringW/
' +=
+=
+==
+=
+=
+
−=
+
+
σ

Projection Radiography Yao Wang, NYU 68
Medical Applications • Orthopedic • Chest • Abdomen • Mammography • Angiography
[From Graber, Lecture Note for BMI1-FS05]

Projection Radiography Yao Wang, NYU 69
Mammography • Detection and diagnosis (symptomatic and screening) of breast cancer • Pre-surgical localization of suspicious areas • Guidance of needle biopsies.
• Breast cancer is detected on the basis of four types of signs on the mammogram:
– Characteristic morphology of a tumor mass – Presentation of mineral deposits called
microcalcifications – Architectural distortions of normal tissue patterns – Asymmetry between corresponding regions of
images on the left and right breast
• ⇒ Need for good image contrast of various tissue types. • Simple x-ray shadowgram from a quasi-point source.
[From Graber, Lecture Note for BMI1-FS05]

Projection Radiography Yao Wang, NYU 70
Mammography contrast • Image contrast is due to varying linear attenuation coefficient of
different types of tissue in the breast (adipose tissue (fat), fibroglandular, tumor).
• Ideal energy distribution of X-ray should be below 20KeV for average size breast, slightly higher for denser breast
• Contrast decreases toward higher energies ⇒ the recommended optimum for mammography is in the region 18 - 23 keV depending on tissue thickness and composition.
[From Graber, Lecture Note for BMI1-FS05]

Projection Radiography Yao Wang, NYU 71
Mammography source • Voltage ~ 25-30 kVp • Anode material Mo (Molybdenum), Rh (Rhodium) (characteristic
peaks at 17.9 and 19 for Mo, and slightly higher for Rh ) • Filtering: use Mo or Rh to absorb energy above 20 or 25Kev
Target Mo, Filter Mo Target Rh, Filter Rh
[From Graber, Lecture Note for BMI1-FS05]

Projection Radiography Yao Wang, NYU 72
Anti-scatter grid • Significant Compton interaction for low Ep (37-50% of all photons). • Linear grid: Lead septa + interspace material. Septa focused toward source.
Grid ratio ~ 3.5-5:1. Only scatter correction in one dimension. Scatter-to-primary (SPR) reduction factor ~5
• Recently crossed grid introduced • Grids are moved during exposure • Longer exposure
detector
breast lead septa
[From Graber, Lecture Note for BMI1-FS05]

Projection Radiography Yao Wang, NYU 73
X-ray projection angiography • Imaging the circulatory system. Contrast agent: Iodine (Z=53) compound;
maximum iodine concentration ~ 350 mg/cm3 • Monitoring of therapeutic manipulations (angioplasty, atherectomy,
intraluminal stents, catheter placement). • Short intense x-ray pulses to produce clear images of moving vessels.
Pulse duration: 5-10 ms for cardiac studies …100-200 ms for cerebral studies
[From Graber, Lecture Note for BMI1-FS05]

Projection Radiography Yao Wang, NYU 74
Summary • Projection radiography system consists of an x-ray tube,
devices for beam filtration and restriction, compensation filters, grids, and a film-screen detector (or digital detector, filmless)
• The detector reading (or image gray level) is proportional to the number of unabsorbed x-ray photons arriving at the detector, which depends on the overall attenuation in the path from the source to the detector.
• The degree of film darkening is nonlinearly related to the film exposure (detected x-ray) by the H&D curve
• Both detector noise and Compton scattering reduce contrast and SNR of the formed image.

Imaging Equations • Basic imaging equation (relating detector reading with attenuation
coefficient)
• Modified to consider inverse square law, obliquity, anode heel effect
• Further modified to consider extended source and detector impulse response
Projection Radiography Yao Wang, NYU 75
{ }∫−=x
dxExESExS00 ');'(exp)();( µ

Projection Radiography Yao Wang, NYU 76
Reference • Prince and Links, Medical Imaging Signals and Systems,
Chap 5. • Webb, Introduction to biomedical imaging, Chap 1.

Projection Radiography Yao Wang, NYU 77
Homework • Reading:
– Prince and Links, Medical Imaging Signals and Systems, Chap 5. • Problems for Chap 5 of the text book:
– P5.2 – P5.4 – P5.5 – P5.9 – P5.12 (Hint: you can assume h_1(x/m)=exp(-a x^2/m^2) for arbitrary
m(z), and find parameter “a” based on the given information). Also you may use the following Fourier transform pair:
• exp{-ax^2} <-> \sqrt(\pi/a) exp(- \pi^2 u^2/a) – P5.18 (this problem was not in 1st ed) – P5.22(P5.20 in 1st ed) – P.5.23 (P5.21 in 1st ed) (You could use the general imaging equation
involving convolution. But you could also derive the solution just by geometric sketching!)
– P5.25(P5.23 in 1st ed) – P5.27 only parts (a) and (b) (P5.25 in 1st ed)