Projecting Australian Mortality using the CMI Mortality ...€¦ · Projecting Australian Mortality...
34
Projecting Australian Mortality using the CMI Mortality Projections Model Chen Tang, Bridget Browne, Aaron Bruhn © Chen Tang, Bridget Browne, Aaron Bruhn This presentation has been prepared for the Actuaries Institute 2014 Financial Services Forum. The Institute Council wishes it to be understood that opinions put forward herein are not necessarily those of the Institute and the Council is not responsible for those opinions.
Transcript of Projecting Australian Mortality using the CMI Mortality ...€¦ · Projecting Australian Mortality...

Projecting Australian Mortality using the CMI Mortality Projections Model
Chen Tang, Bridget Browne, Aaron Bruhn
© Chen Tang, Bridget Browne, Aaron Bruhn
This presentation has been prepared for the Actuaries Institute 2014 Financial Services Forum. The Institute Council wishes it to be understood that opinions put forward herein are not necessarily those of the Institute and the
Council is not responsible for those opinions.
2
Projecting mortality
What do we know? – Mortality is declining – Major reasons
What don’t we know? – A lot
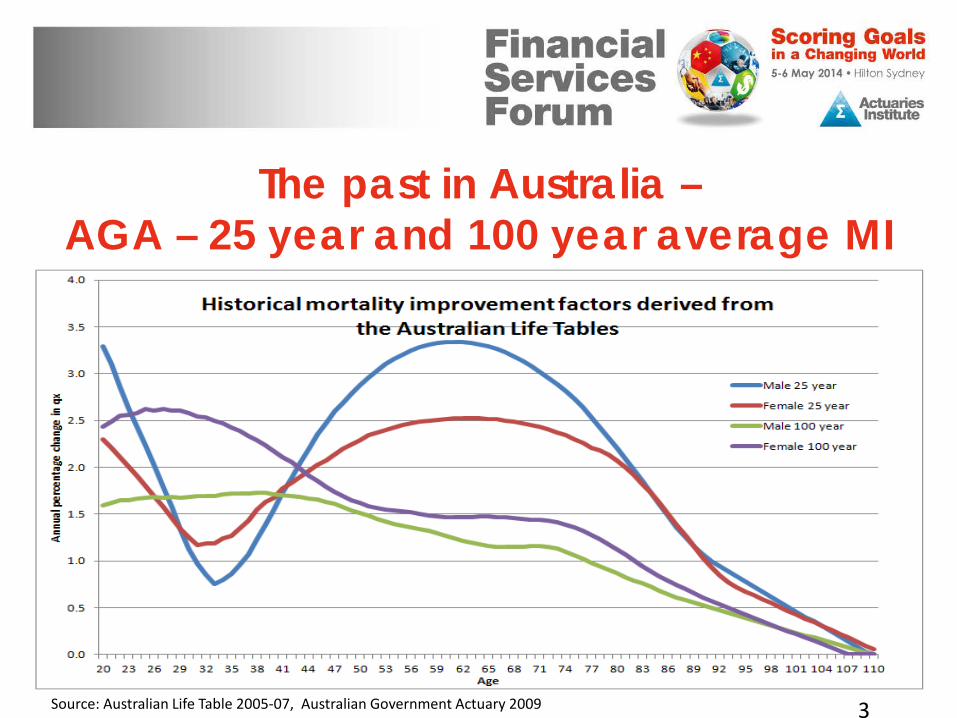
The past in Australia – AGA – 25 year and 100 year average MI
3 Source: Australian Life Table 2005-07, Australian Government Actuary 2009
Heat Maps •Used to present changes in mortality rates over age and time •“At a glance” overview of patterns •Age/time/cohort dimensions •Rate of change not mortality rate itself •Smoothed rate of change (raw is too noisy)
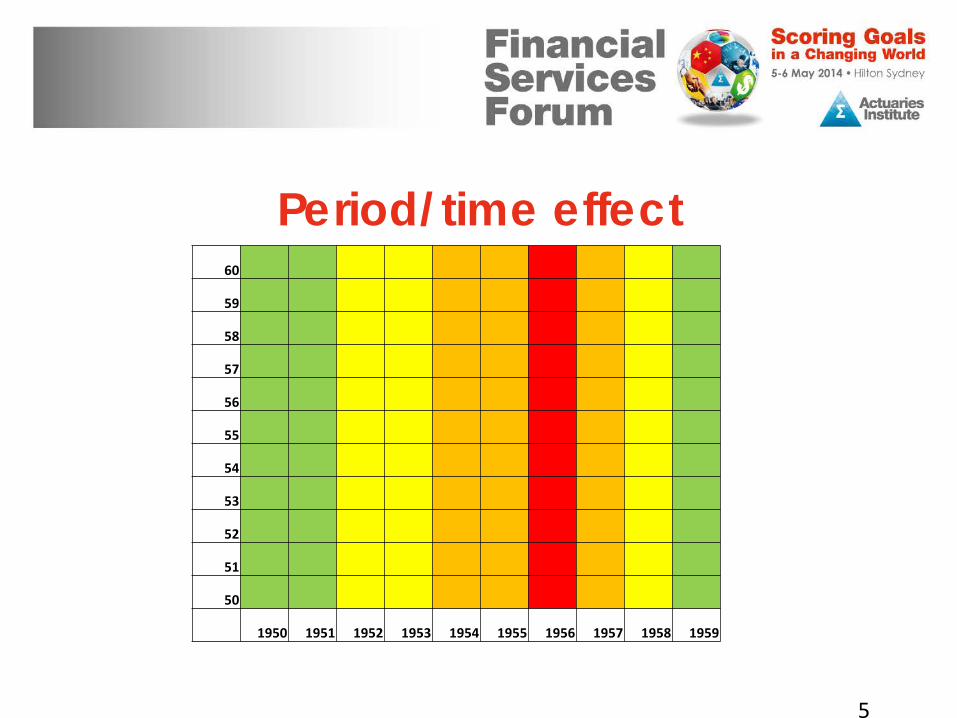
Period/time effect 60
59
58
57
56
55
54
53
52
51
50
1950 1951 1952 1953 1954 1955 1956 1957 1958 1959
5
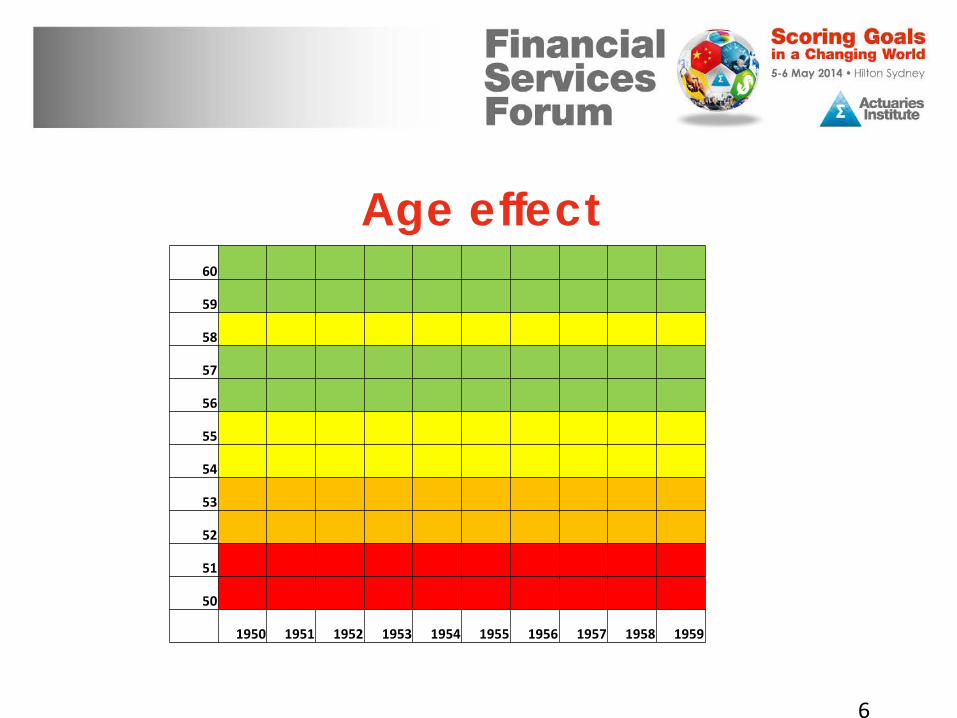
Age effect 60
59
58
57
56
55
54
53
52
51
50
1950 1951 1952 1953 1954 1955 1956 1957 1958 1959
6
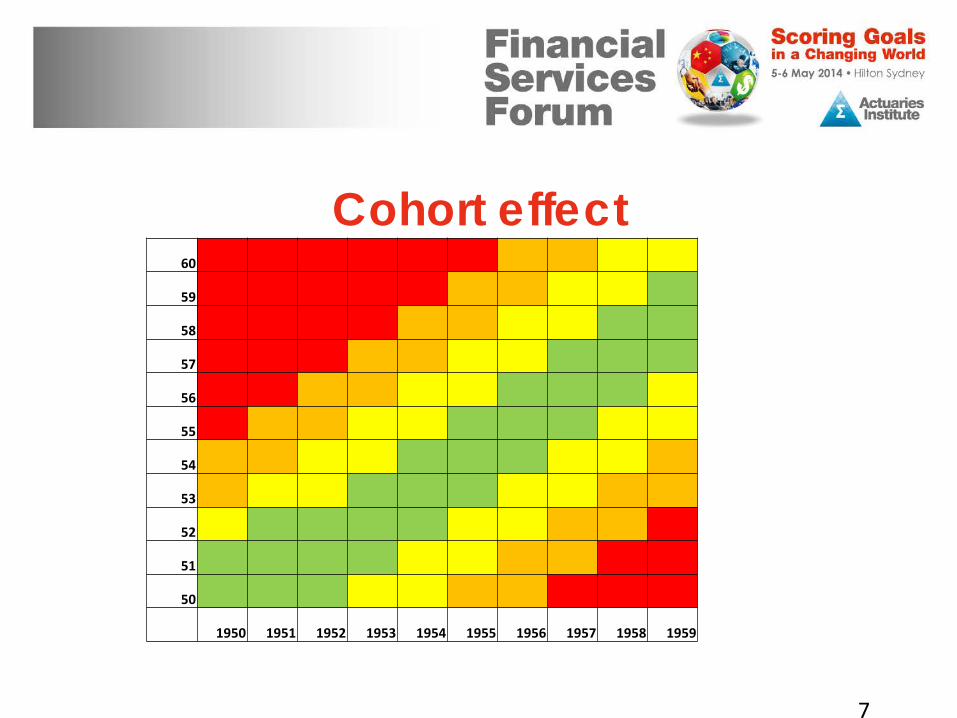
Cohort effect 60
59
58
57
56
55
54
53
52
51
50
1950 1951 1952 1953 1954 1955 1956 1957 1958 1959
7

The past in Australia – in 3D
8 Source: Human Mortality Database, mortalitysmooth R package, calculations Shi and Browne

What are our choices? Explanation
– Should be the goal – Significant limitations currently
9 Source: Booth and Tickle, 2014
What are our choices? Expectation
– Current situation blends to long term – Set by opinion / expert judgement – Underestimation historically
10 Source: Booth and Tickle, 2014

What are our choices?
11 Sources: commentary Booth and Tickle, 2014; graphic Boerger and Aleksic, ICA 2014
Extrapolation – Assumes future trends will be a
continuation of past trends – More objective?
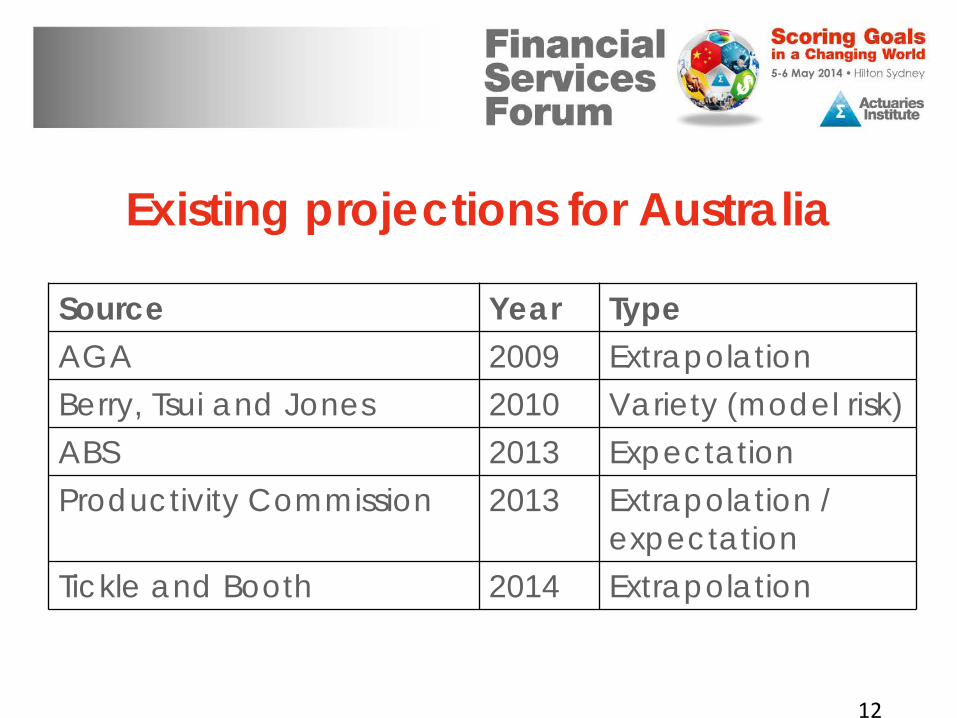
Existing projections for Australia
12
Source Year Type AGA 2009 Extrapolation Berry, Tsui and Jones 2010 Variety (model risk) ABS 2013 Expectation Productivity Commission 2013 Extrapolation /
expectation Tickle and Booth 2014 Extrapolation
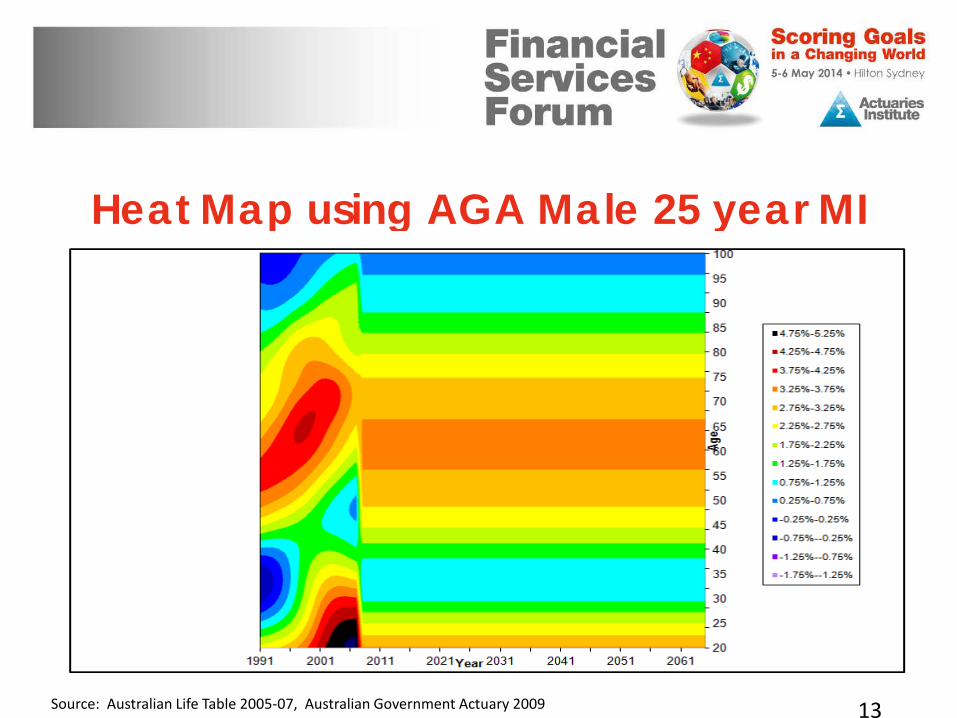
Heat Map using AGA Male 25 year MI
13 Source: Australian Life Table 2005-07, Australian Government Actuary 2009
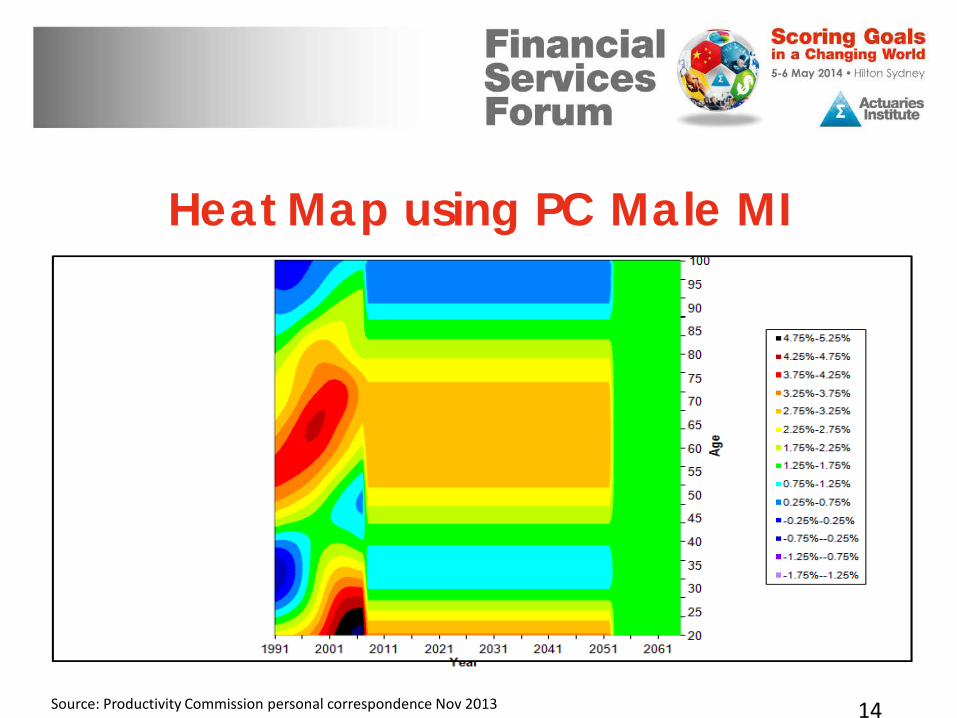
Heat Map using PC Male MI
14 Source: Productivity Commission personal correspondence Nov 2013
A new approach?
Taking advantage of extrapolation Smoothly blending from past to future Explicitly incorporating expectation
15
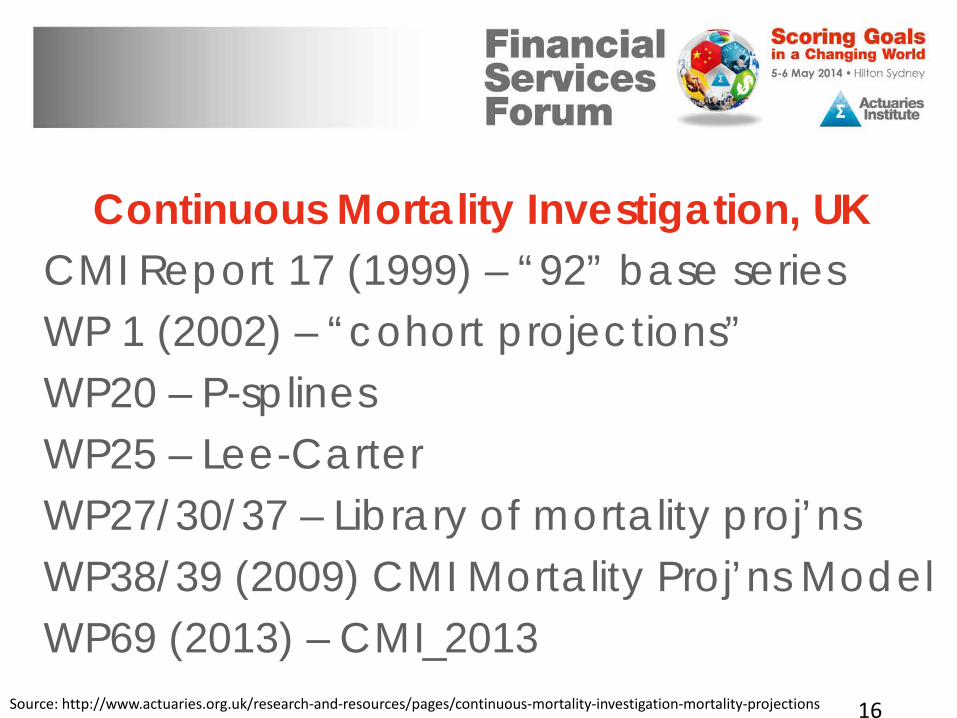
Continuous Mortality Investigation, UK CMI Report 17 (1999) – “92” base series WP 1 (2002) – “cohort projections” WP20 – P-splines WP25 – Lee-Carter WP27/30/37 – Library of mortality proj’ns WP38/39 (2009) CMI Mortality Proj’ns Model WP69 (2013) – CMI_2013 16 Source: http://www.actuaries.org.uk/research-and-resources/pages/continuous-mortality-investigation-mortality-projections
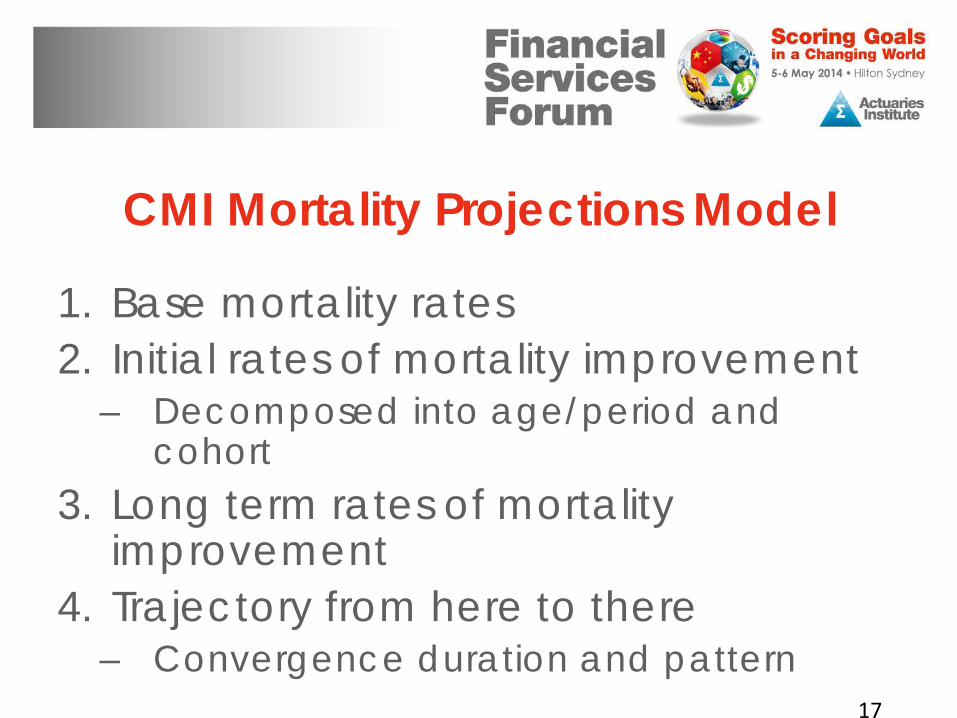
CMI Mortality Projections Model
1. Base mortality rates 2. Initial rates of mortality improvement
– Decomposed into age/period and cohort
3. Long term rates of mortality improvement
4. Trajectory from here to there – Convergence duration and pattern
17
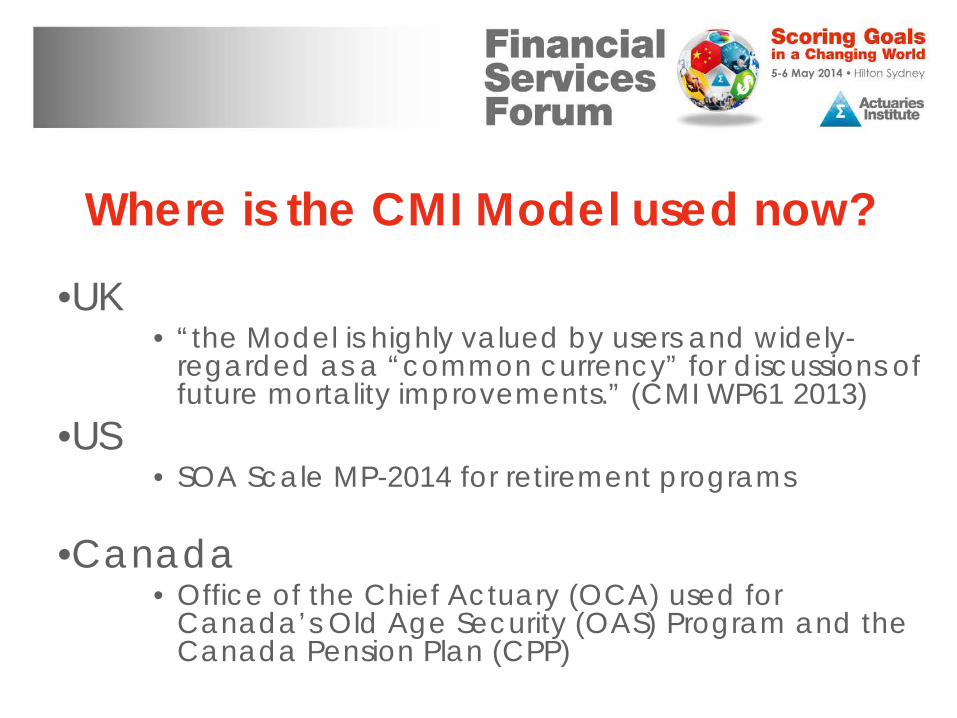
Where is the CMI Model used now?
•UK • “the Model is highly valued by users and widely-
regarded as a “common currency” for discussions of future mortality improvements.” (CMI WP61 2013)
•US • SOA Scale MP-2014 for retirement programs
•Canada
• Office of the Chief Actuary (OCA) used for Canada’s Old Age Security (OAS) Program and the Canada Pension Plan (CPP)

1. Base mortality rates As appropriate for portfolio Here, Australian population, so ALT05-07
19
20 40 60 80 100
-7-6
-5-4
-3-2
-1
Smoothed qx and ALT Mortality Ra
Age
log(qx
)
Smoothed qx,2006Smoothed qx,2007ALT Mortality Rates

2. Initial Rates of mortality improvement
20
20 40 60 80 100
12
34
56
Rates of Mortality Improveme
Age
Perce
ntage
(%)
MaleFemale
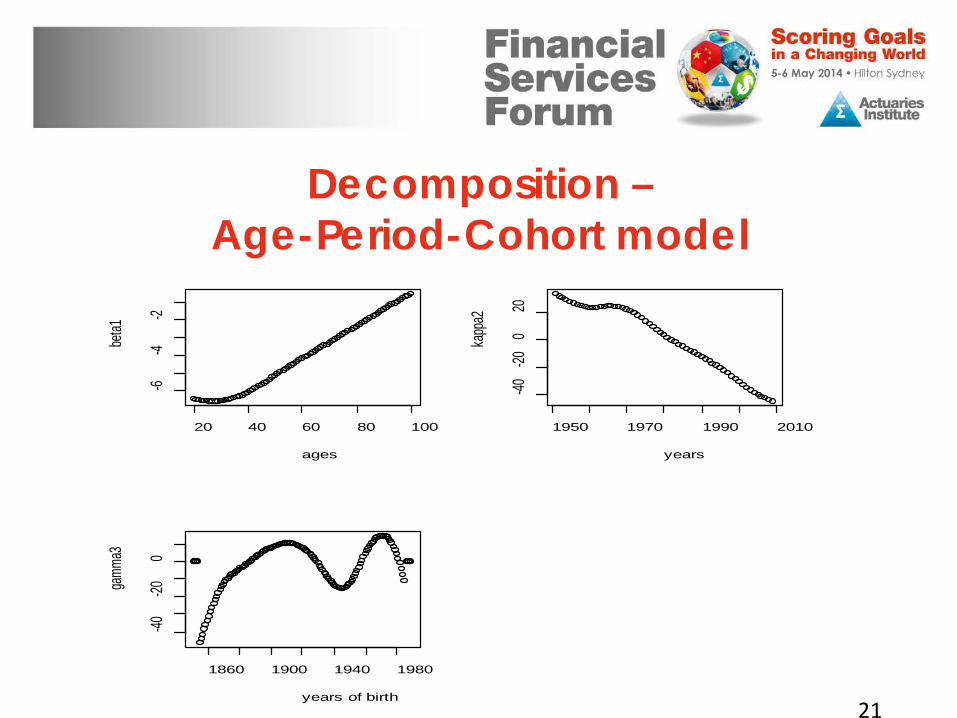
Decomposition – Age-Period-Cohort model
21
20 40 60 80 100
-6-4
-2
ages
beta1
1950 1970 1990 2010
-40-20
020
years
kapp
a2
1860 1900 1940 1980
-40-20
0
years of birth
gamm
a3
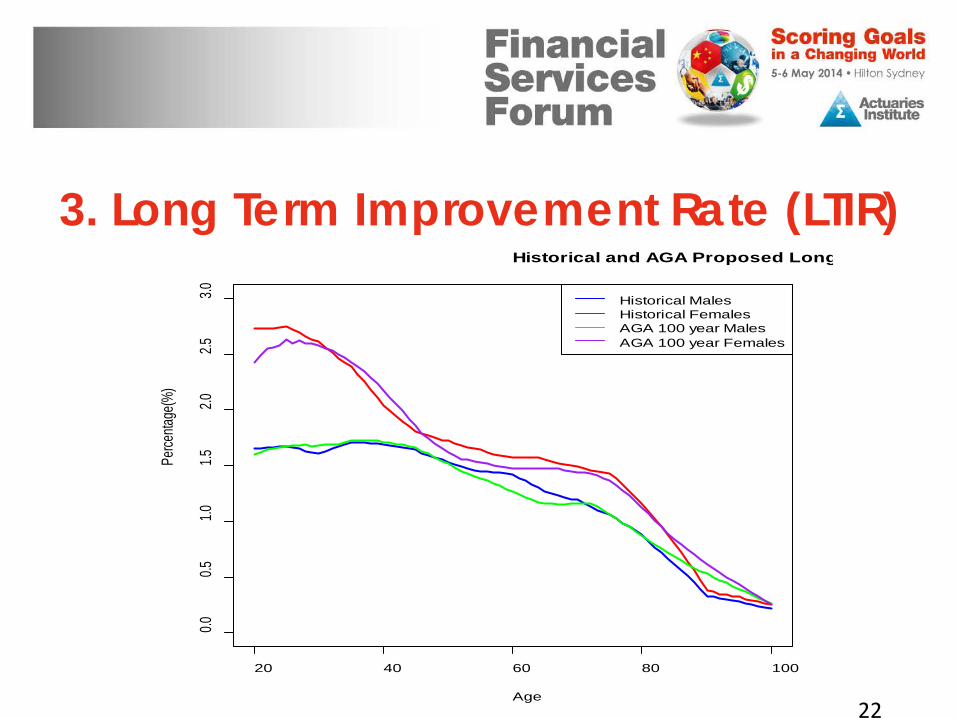
3. Long Term Improvement Rate (LTIR)
22
20 40 60 80 100
0.00.5
1.01.5
2.02.5
3.0
Historical and AGA Proposed Long
Age
Perce
ntage
(%)
Historical MalesHistorical FemalesAGA 100 year MalesAGA 100 year Females
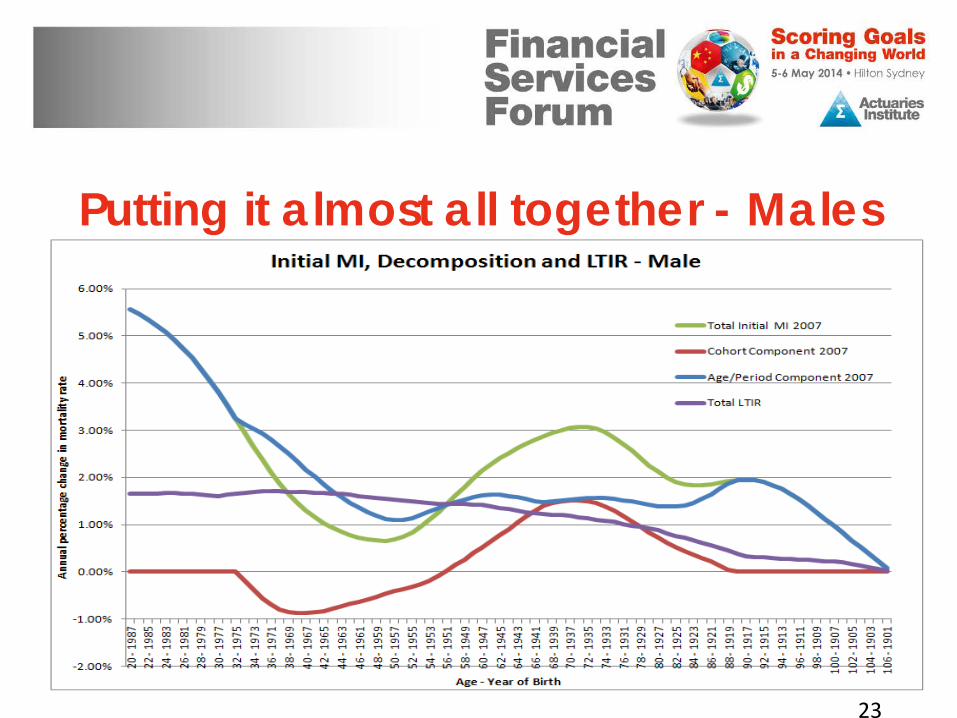
Putting it almost all together - Males
23

4. Convergence duration
24
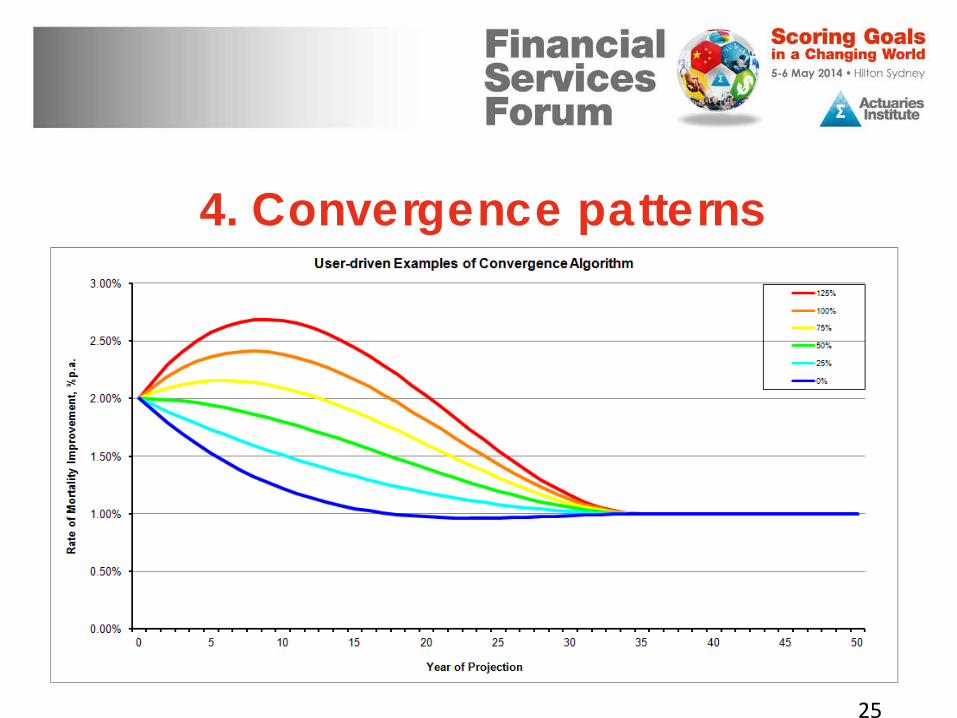
4. Convergence patterns
25
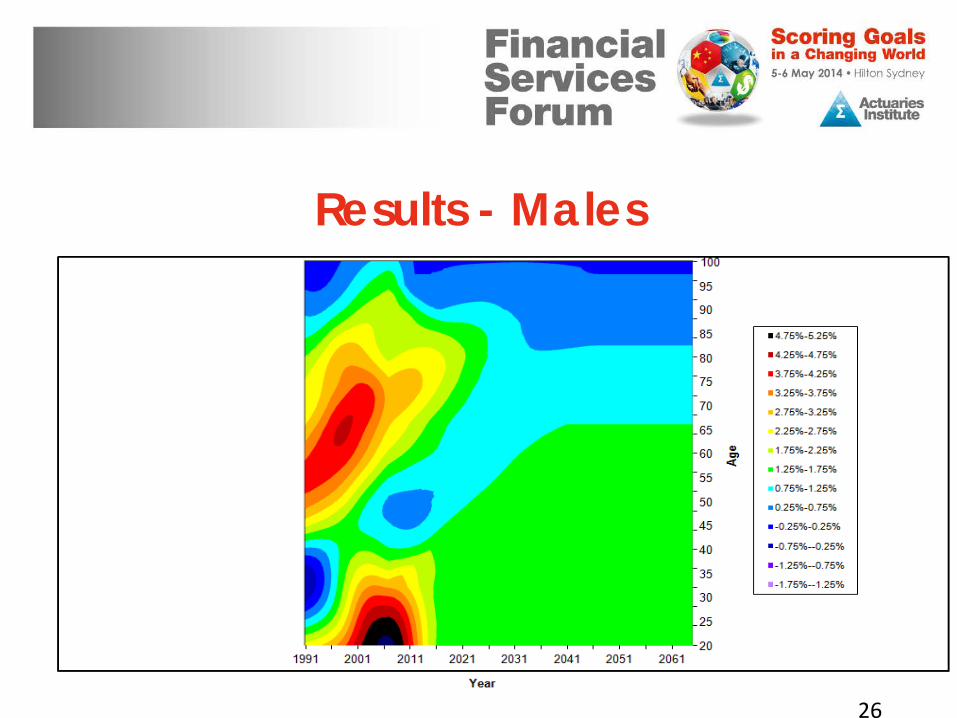
Results - Males
26
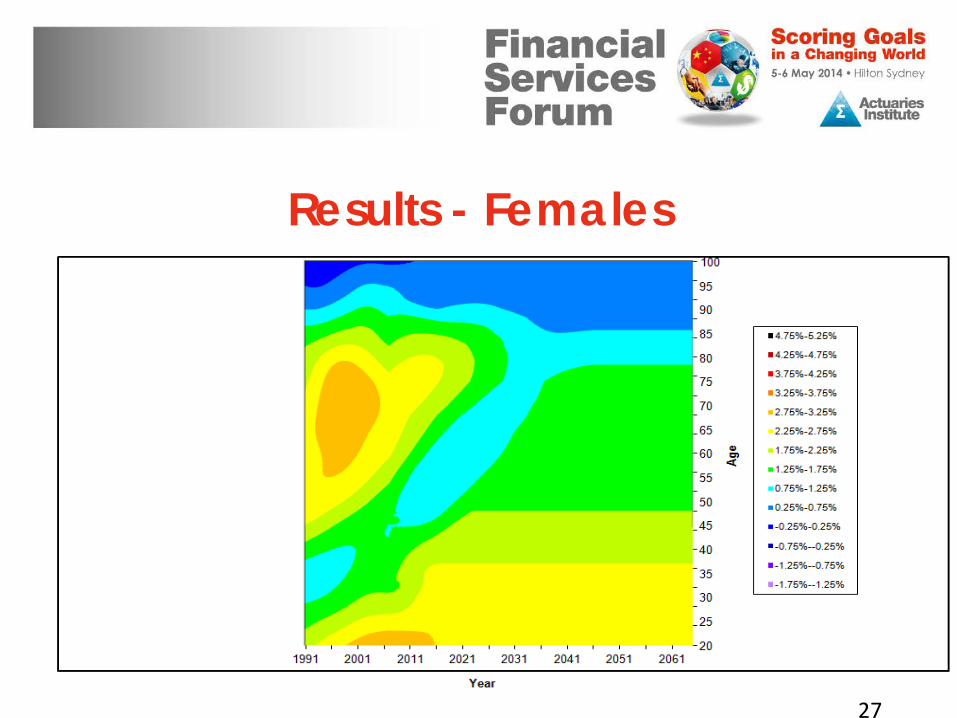
Results - Females
27
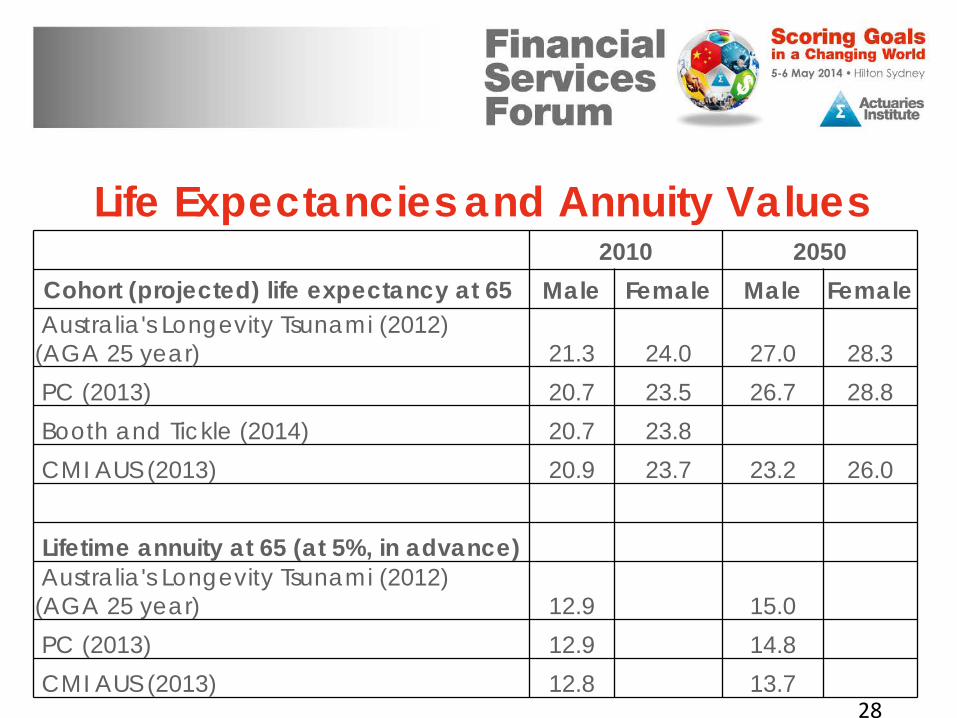
Life Expectancies and Annuity Values 2010 2050
Cohort (projected) life expectancy at 65 Male Female Male Female Australia's Longevity Tsunami (2012) (AGA 25 year) 21.3 24.0 27.0 28.3 PC (2013) 20.7 23.5 26.7 28.8 Booth and Tickle (2014) 20.7 23.8 CMI AUS (2013) 20.9 23.7 23.2 26.0
Lifetime annuity at 65 (at 5%, in advance) Australia's Longevity Tsunami (2012) (AGA 25 year) 12.9 15.0 PC (2013) 12.9 14.8 CMI AUS (2013) 12.8 13.7
28
Sensitivities
Convergence Long term improvement rate (LTIR)
29
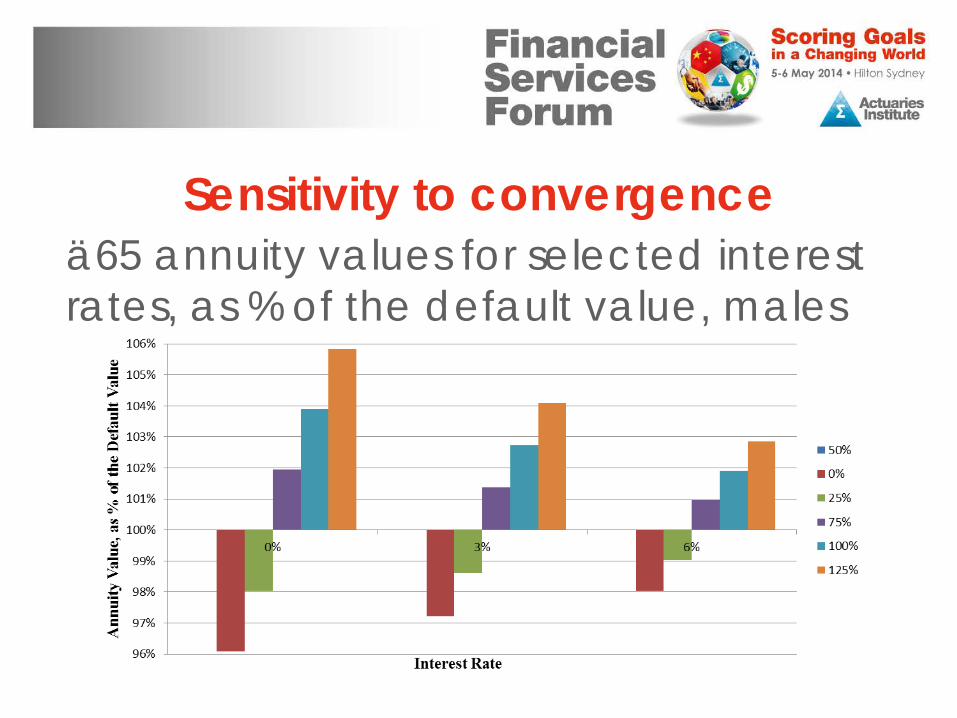
Sensitivity to convergence ä65 annuity values for selected interest rates, as % of the default value, males

Sensitivity to LTIR
31
Future work
Major limitation: deterministic Next step: range of outcomes
32

Conclusion
Should the Actuaries Institute be: – Providing a standard table? – Providing a toolkit for actuaries? – Actively monitoring and communicating
about mortality changes? – Actively monitoring and communicating
about forecasting techniques? – Or?
33
References Australian Bureau of Statistics (2013). Population Projections, Australia, 2012 (base) to 2101. Australian Government Actuary (2009). Australian Life Tables 2005-07. Berry, P., L. Tsui, et al. (2010). Our New 'Old' Problem - Pricing Longevity Risk in Australia. 6th International Longevity Risk and Capital Markets Solutions Conference, Sydney. Börger, M. and M.-C. Aleksic (2014). Coherent Projections of Age, Period, and Cohort Dependent Mortality Improvements. International Congress of Actuaries. Washington DC. Camarda, C. G. (2012). "MortalitySmooth: An R Package for Smoothing Poisson Counts with P-Splines." Journal of Statistical Software 50(1): 1-24. Continuous Mortality Investigation Working Party (2009). CMI Working Paper 38: A prototype mortality projections model: Part one - an outline of the proposed approach. C. M. I. Bureau, Institute and Faculty of Actuaries, UK. Continuous Mortality Investigation Working Party (2009). CMI Working Paper 39: A Prototype Mortality Projections Model: Part Two – Detailed Analysis. C. M. I. Bureau, Institute and Faculty of Actuaries, UK. Productivity Commission (2013). An Ageing Australia: Preparing for the Future. Commission Research Paper. Canberra. Tickle, L. and H. Booth (2014). "The Longevity Prospects of Australian Seniors: An Evaluation of Forecast Method and Outcome." Asia Pacific Journal of Risk and Insurance. University of California Berkeley (USA) and Max Planck Institute for Demographic Research (Germany) Human Mortality Database.
34