
Project: You Drink We Drive
39
-
Upload
gaurav-venkateswar -
Category
Health & Medicine
-
view
431 -
download
4
Transcript of Project: You Drink We Drive


what do Atlanta, GA, Richmond, VA, Greenville, SC, and Birmingham, AL all have in common?

they are just 4 of the dozens of cities across America with public transportation that serves less than 35% the city’s population.

sprawling cities, dense suburbs
need to get home,won’t leave cars behind,
reject the idea of taxis,get behind the wheel
people drive to social events
people often drink in excess of the legal limit

every day in America, another 27 people die as a result of drunk driving crashes.1
drunk driving costs the United States $132 billion a year.2
1 National Highway Traffic Safety Administration FARS data, 2012.2 National Highway Traffic Safety Administration FARS data, 2010

40% of traffic deaths in 2006 in US were alcohol related.

the problem

you are...
...out to dinner with a few friends and finishing off your third glass of wine
...at to a birthday party in the suburbs and have had a little too much to drink
..at a bar downtown after a night of drinking beers and watching football

how doyou [ + your car]
get home?
call a cab
return to bar next morning to
retrieve car
make a [poor] judgment call
take a chance and drive car home
after a few drinks
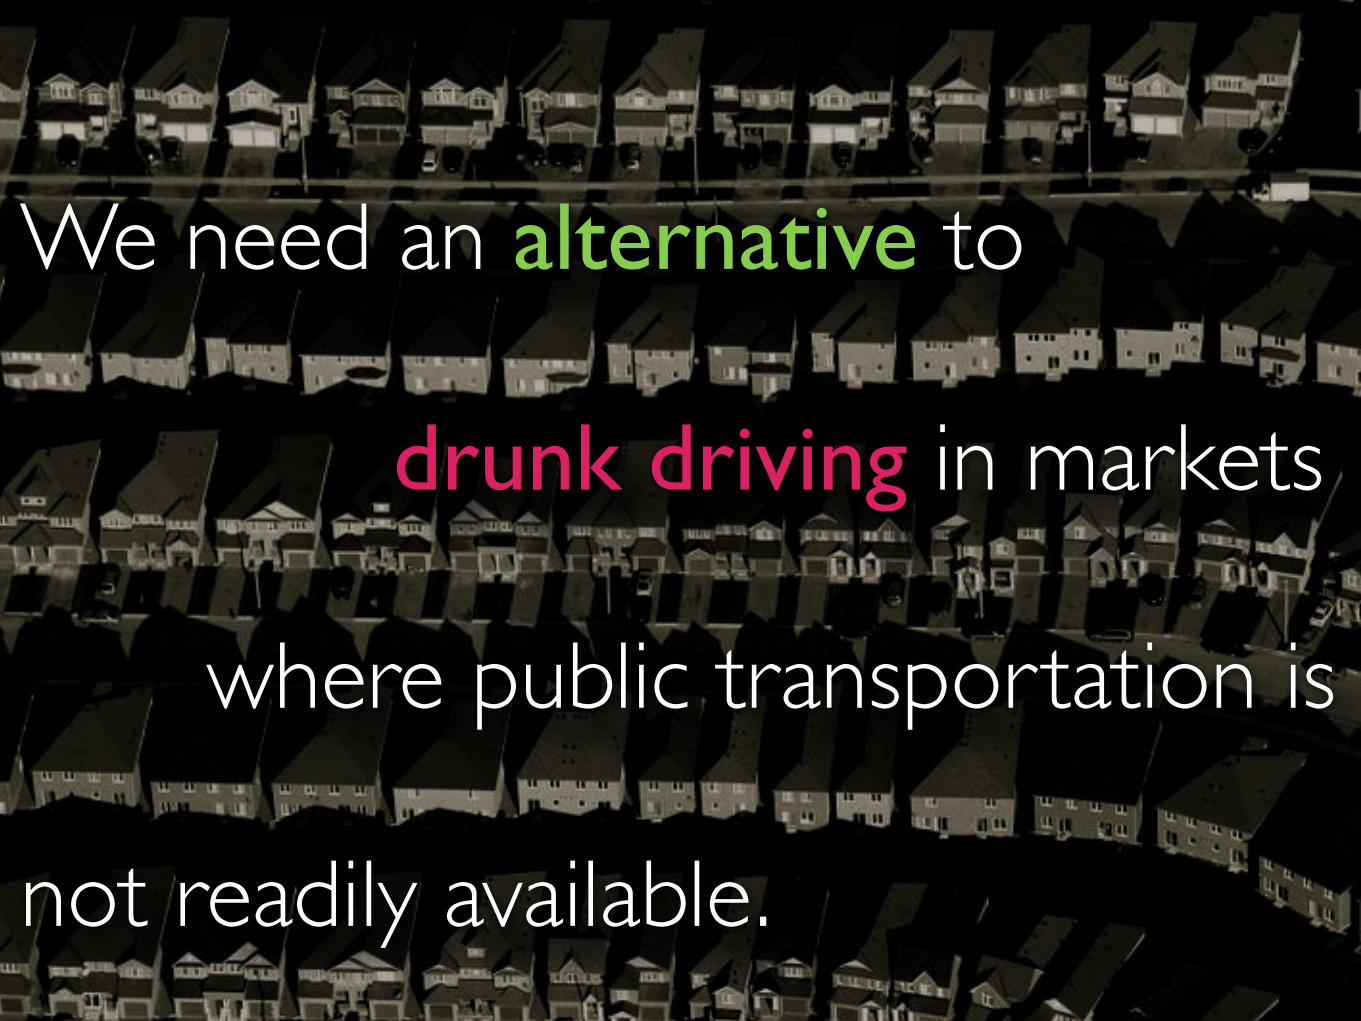
We need an alternative to
drunk driving in markets
where public transportation is
not readily available.

the solution

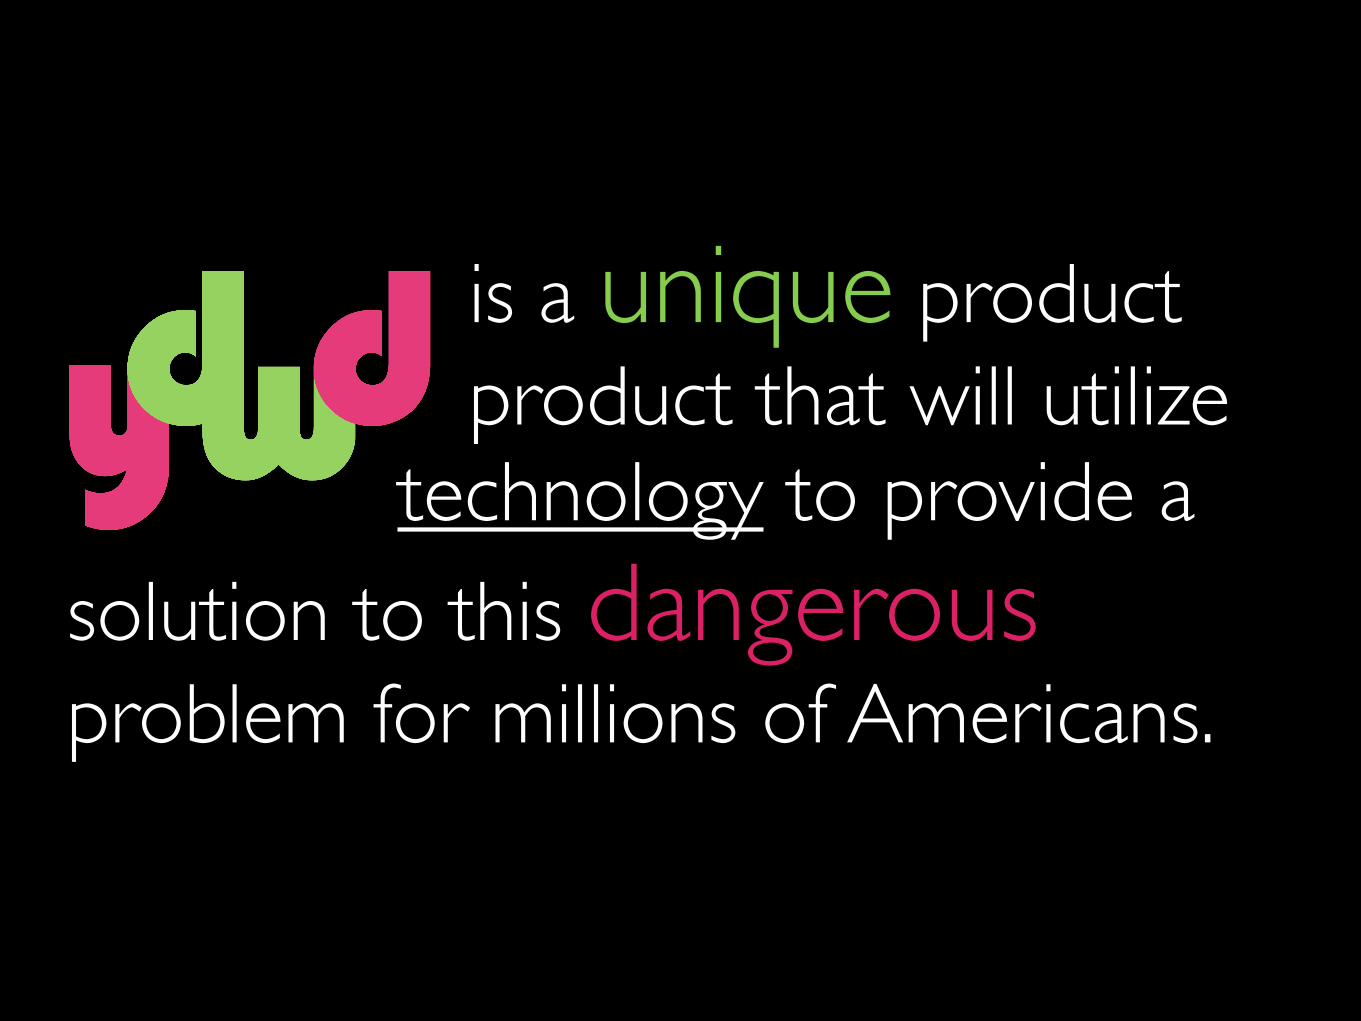
is a unique product product that will utilize technology to provide a solution to this dangerous problem for millions of Americans.

is a mobile-enabled designated driving service that allows users to order, in real time, a driver to chauffeur them home in their own car.


designated driver picks up
at current location
drop at destination
YDWD picks up driver for
next job based on GPS
Fee based on time and
distance

technology
GPS location trackingusers + drivers
track data to analyze usage patternsminimize distances, wait times
traffic variabilityhigh usage locations
integrate with social media check-inuser checks in
gets option to reserve driver in advance
the market

Adults drove drunk112 million times in 2010
* Centers for Disease Control and Prevention, October 2011.
how big is the market?
~300,000 incidents of drunk driving each day.*
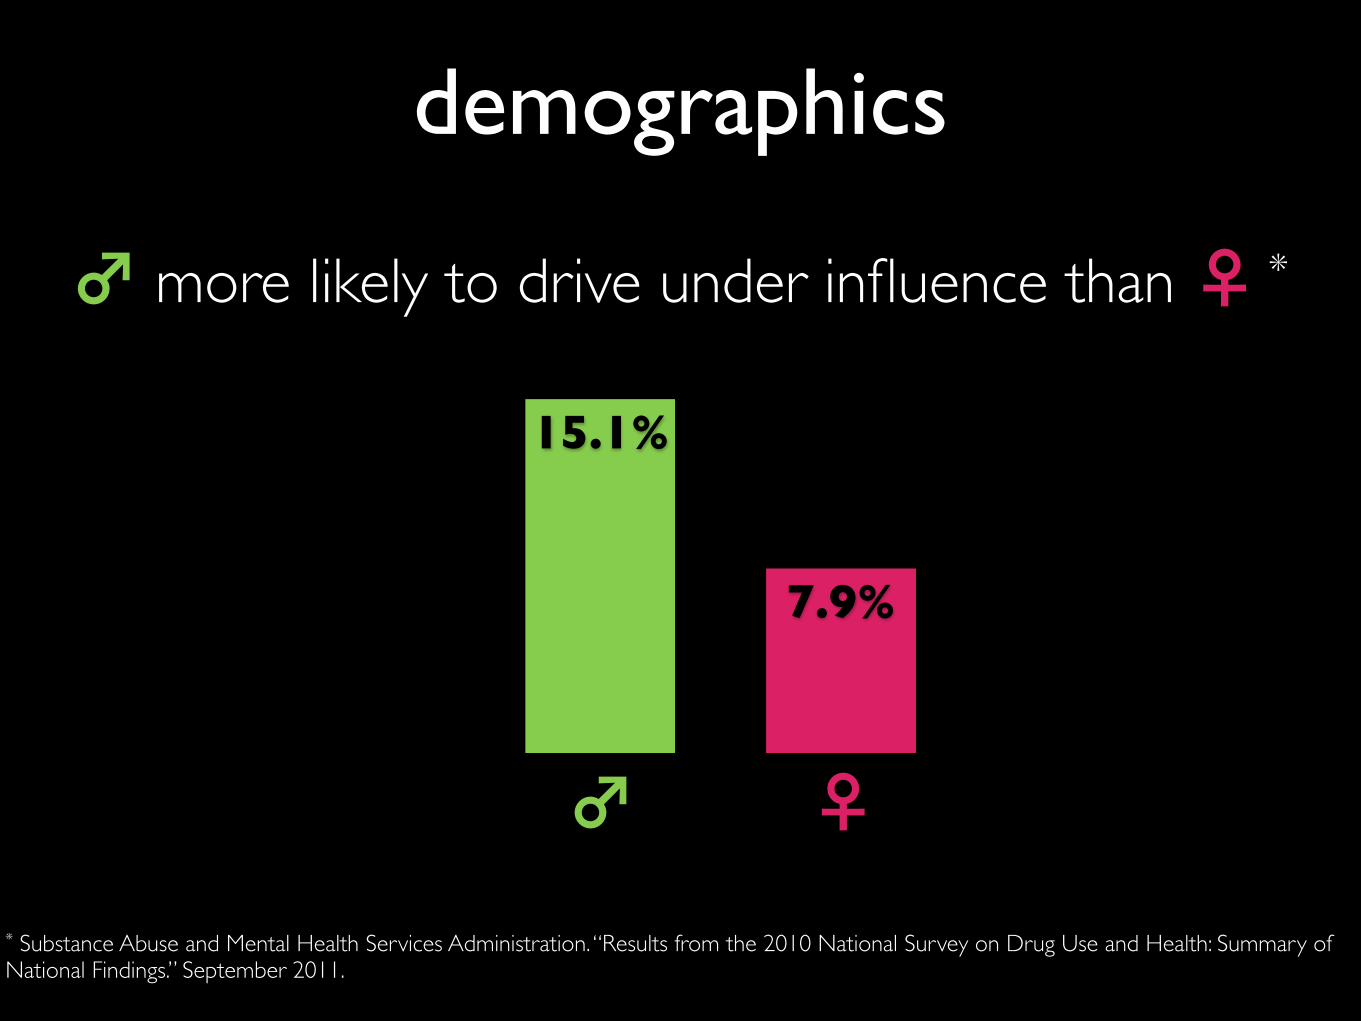
♂ more likely to drive under influence than ♀ *
* Substance Abuse and Mental Health Services Administration. “Results from the 2010 National Survey on Drug Use and Health: Summary of National Findings.” September 2011.
demographics
7.9%
15.1%
♂ ♀

fatal crashes highest for ages 21 to 24*
* National Highway Traffic Safety Administration. “Traffic Safety Facts 2010: Alcohol Impaired Driving” Washington DC:National Highway Traffic Safety Administration, 2011
demographics
21-24 25-34 35-44
29%30%
34%
0
375
750
1125
1500
Ala
bam
aA
lask
aA
rizo
naA
rkan
sas
Cal
iforn
iaC
olor
ado
Con
nect
icut
Del
awar
eD
.C.
Flor
ida
Geo
rgia
Haw
aii
Idah
oIll
inoi
sIn
dian
aIo
wa
Kan
sas
Ken
tuck
yLo
uisi
ana
Mai
neM
aryl
and
Mas
sach
uset
tsM
ichi
gan
Min
neso
taM
issi
ssip
piM
isso
uri
Mon
tana
Neb
rask
aN
evad
aN
ew H
amps
hire
New
Jers
eyN
ew M
exic
oN
ew Y
ork
Nor
th C
arol
ina
Nor
th D
akot
aO
hio
Okl
ahom
aO
rego
nPe
nnsy
lvan
iaR
hode
Isla
ndSo
uth
Car
olin
aSo
uth
Dak
ota
Tenn
esse
eTe
xas
Uta
hVe
rmon
tV
irgi
nia
Was
hing
ton
Wes
t Vir
gini
aW
isco
nsin
Wyo
min
g
39
196
91
156
224
1854
1,213
257
32
314
25
407
97
220
316
64
366315
105
193
2770
4680
258
149109
255
114162
23
226172
10782
208
279
5044
277
716
841
92
161
774
155
215
20
259
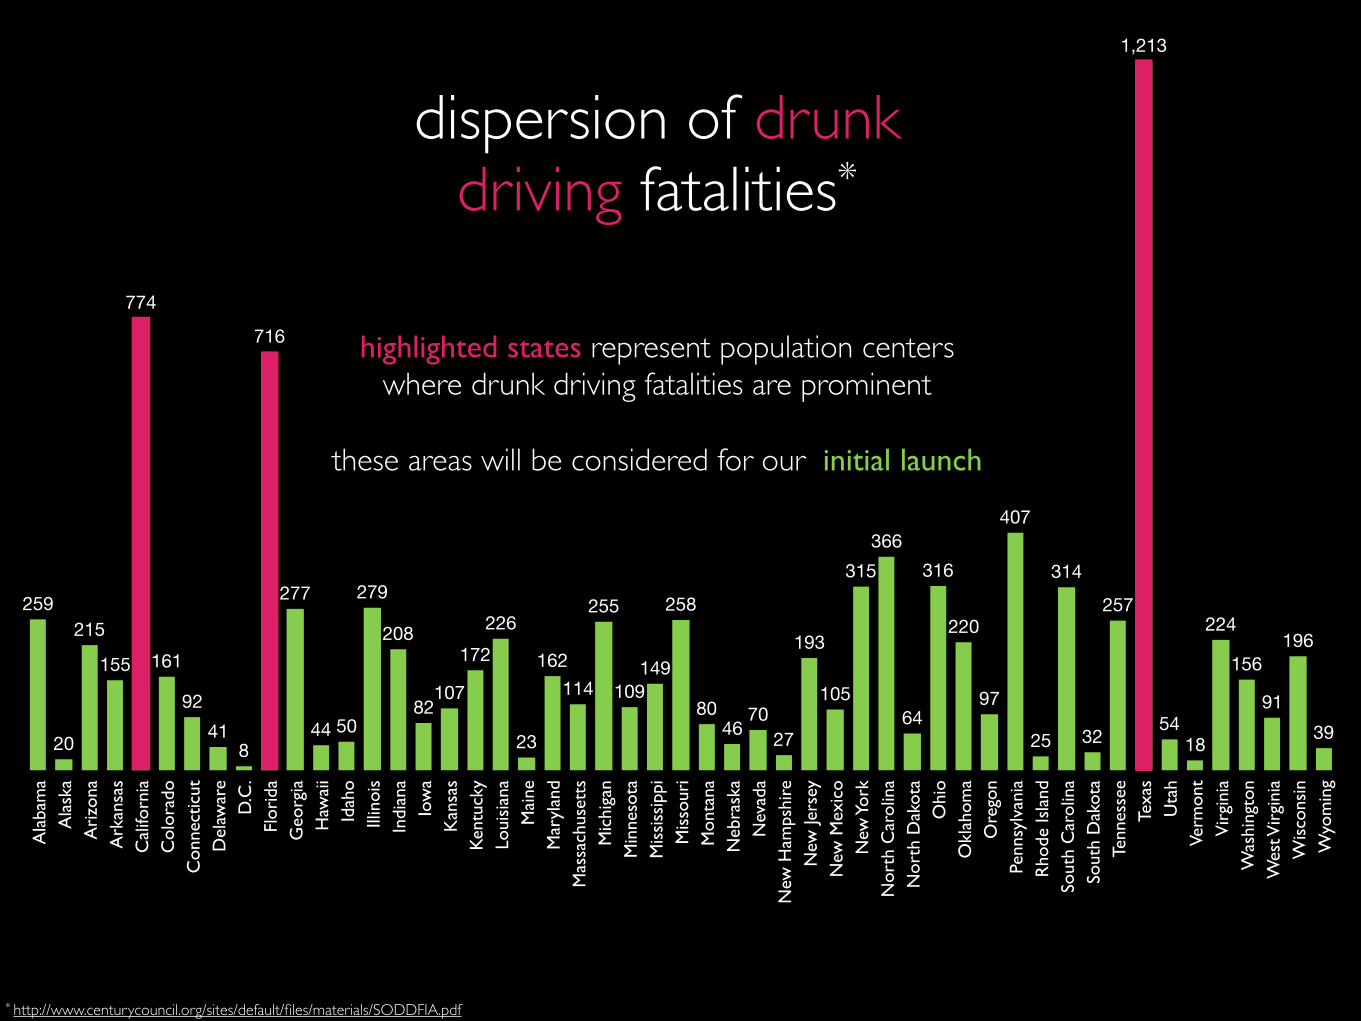
dispersion of drunk driving fatalities*
* http://www.centurycouncil.org/sites/default/files/materials/SODDFIA.pdf
highlighted states represent population centers where drunk driving fatalities are prominent
these areas will be considered for our initial launch

Based on the locus of drunk driving fatalities we have identified these metropolitan areas as strong
potential markets Metropolitan Area Est. Population 2012Los Angeles-Long Beach-Anaheim, CADallas-Fort Worth-Arlington, TXHouston-The Woodlands-Sugar Land, TXMiami-Fort Lauderdale-West Palm Beach, FLSan Francisco-Oakland-Hayward, CARiverside-San Bernardino-Ontario, CASan Diego-Carlsbad, CATampa-St. Petersburg-Clearwater, FLSan Antonio-New Braunfels, TXOrlando-Kissimmee-Sanford, FLSacramento--Roseville--Arden-Arcade, CASan Jose-Sunnyvale-Santa Clara, CAAustin-Round Rock, TXJacksonville, FL
13,052,9216,700,9916,177,0355,762,7174,455,5604,350,0963,177,0632,842,8782,234,0032,223,6742,196,4821,894,3881,834,3031,377,850

172
* “Internet Trends @ Stanford Bases Kickoff ”, Mary Meeker, Dec 2012.
demographics
m i l l i o nsmartphone users in USA
Q4 2012*

potential for future expansion to other countries with similar issues around drunk-driving
future options for growth
license technology for optimizationto other businesses
(e.g., taxi and limousine services)

partnerships
capturing the market
social p.r.

government/nonprofits
partnerships
media
bars/restaurants wines/spirits/beers

competition
taxi + limousine services
other companies providing designated driver servicesfew are tech enabled
focused on larger markets

insurance + liability
is protected throughuser waiversinsured driversumbrella policies

monetization
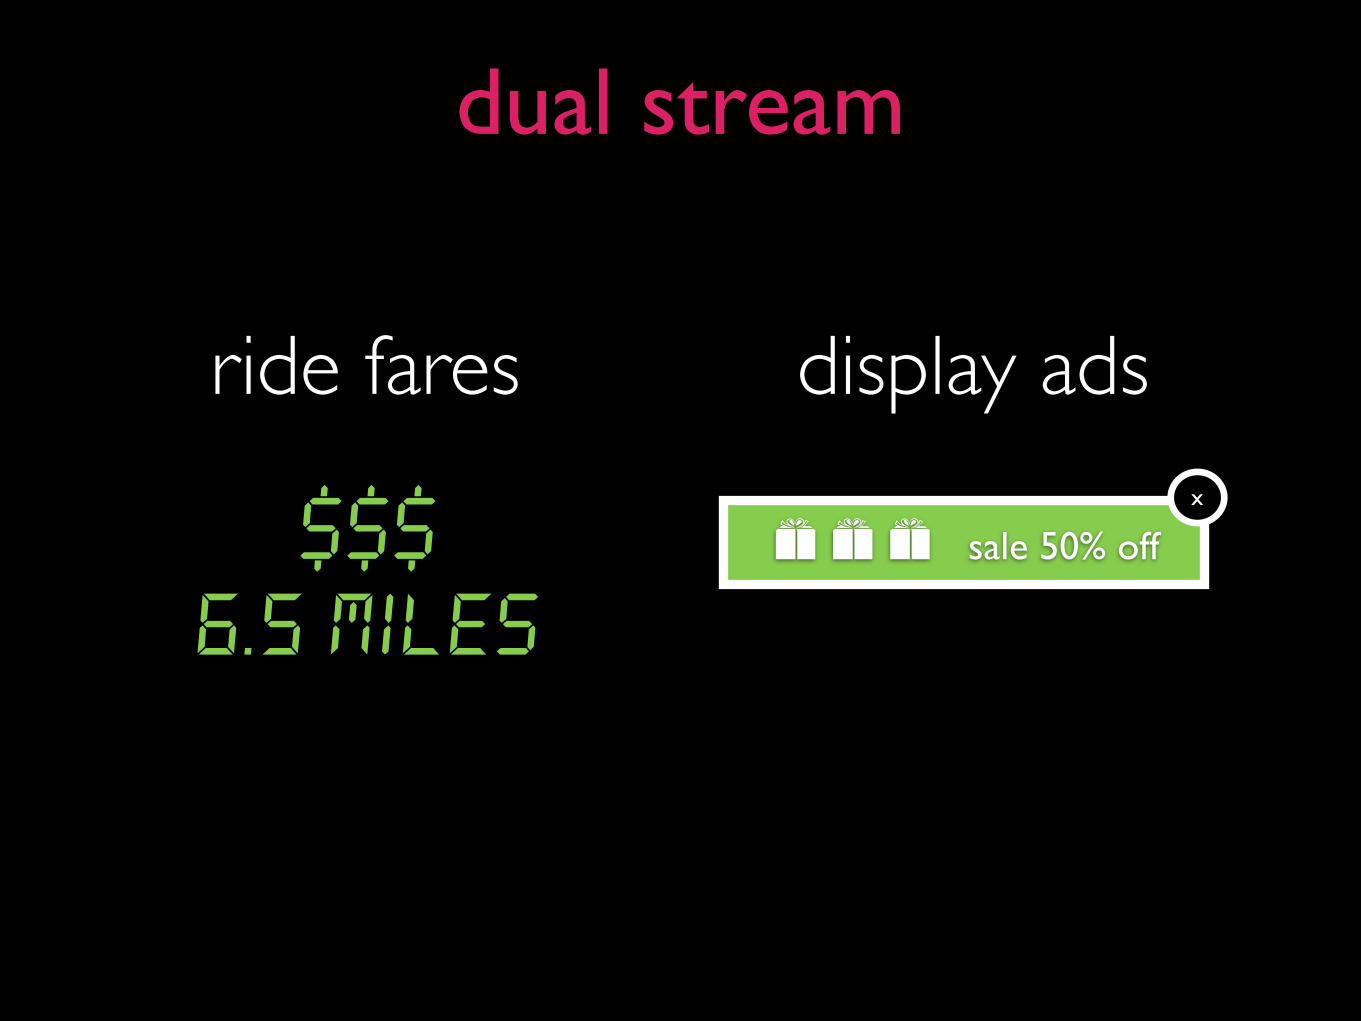
dual stream
ride fares display ads
$$$6.5 miles
sale 50% offx

a/b testing
market a market brate 1 rate 2
optimize pricingwillingness to paycosts/revenues
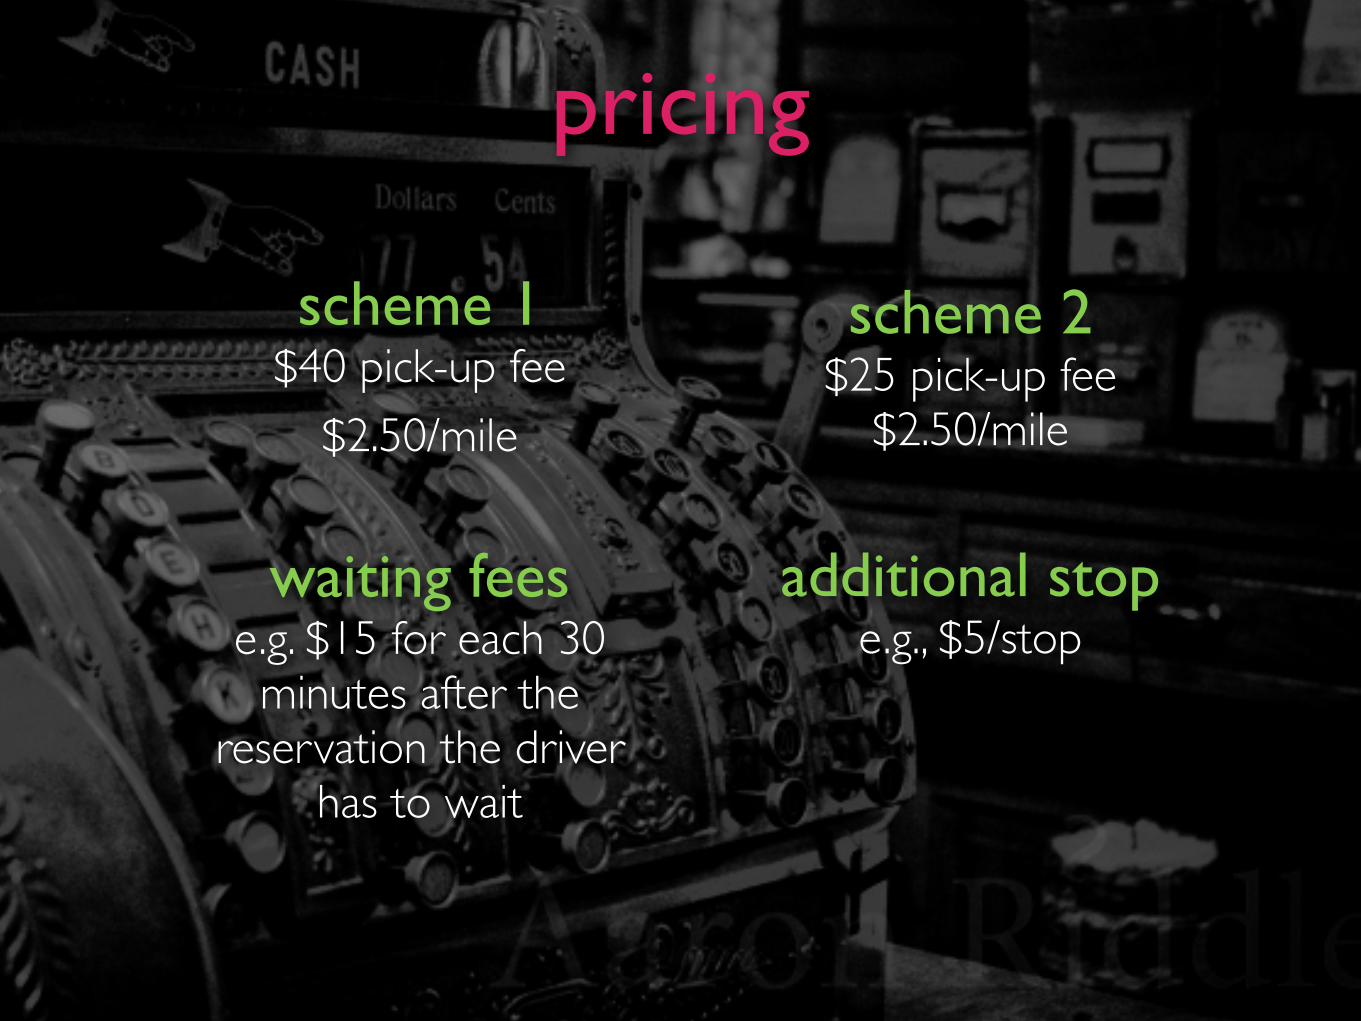
pricing
scheme 1$40 pick-up fee
$2.50/mile
scheme 2$25 pick-up fee
$2.50/mile
waiting feese.g. $15 for each 30 minutes after the
reservation the driver has to wait
additional stope.g., $5/stop

scaling
can expand to new markets in the U.S. and potentially other countries..

funding needs

initial funding request$100,000
phase 13 months
design + development costs
$44,800
operational expenses
$6,000
phase 23 months
design + development costs
$25,400
operational expenses
$23,800

team

c e o
f
o
c
tc
o
omc
Adam Salvitti-Gucwa With a diverse background ranging from 5 years experience as a senior accountant to a more creative position as Product Lead for a design and development studio in NYC, Adam's breadth of experience allows for meaningful strategic insights and organizational management.
Rich Fulop Rich has a diverse background in sports and financial services spanning the last 7 years. He has held roles in sales, trading, asset management and most recently managing budgets and salary caps with Major League Soccer. Given his wide breadth of finance experience, Rich will be responsible all things finance and budget related.
osc
Gaurav Venkateswar Gaurav has 10 years of experience in information technology as a consultant. He has designed, developed, and deployed numerous systems to meet clients’ business and technology needs. He will be responsible for directing the technical development of our solution.
Michael Grant Mike spent three years managing outreach and communications in the non-profit space, building relationships with funders, businesses, and community leaders. After his non-profit experience, Mike joined marketing and IT research firm Forrester Research as an advisor to customer intelligence professionals. Given this background, Mike will build out YDWD’s marketing function.
Andrew Dolan Andrew spent two years in Viacom’s Ad Sales Finance department, where he was responsible for financial reporting for Viacom’s $4 Billion Ad Sales business and for creating budget models for the sales organization. In his role in strategy at Viacom, Andrew performed strategic industry analysis and provided support on M&A transactions. He will be responsible for developing the company’s sales planning and strategy.