Project Slingshot NDR Investor Deck 20191202 1328 (No ...
27
Investor Presentation December 2019
Transcript of Project Slingshot NDR Investor Deck 20191202 1328 (No ...
Investor Presentation
December 2019
22
This presentation contains “forward‐looking statements” which express our expectations concerning future events, plans, results andobjectives. All statements based on future expectations rather than on historical facts are forward‐looking statements that involve anumber of risks and uncertainties, and the Company cannot give assurance that such statements will prove to be correct. While theCompany believes that such forward‐looking statements are based on reasonable assumptions, there can be no assurance that suchfuture events, plans, results and objectives will be achieved or achieved on the schedule or in the amounts indicated. The factors whichcould affect the Company’s future results include, but are not limited to, general economic conditions, our ability to execute our businessstrategy; our limited operating history; our ability to obtain additional financing to affect our strategy; loss of one or more of ourcustomers; cyclical or other changes in the demand for and price of LNG and natural gas; operational, regulatory, environmental, political,legal and economic risks pertaining to the construction and operation of our facilities; hurricanes or other natural or manmade disasters;dependence on contractors for successful completions of our energy related infrastructure; reliance on third party engineers; inability tocontract with suppliers and tankers to facilitate the delivery of LNG on their chartered LNG tankers; competition from third parties in ourbusiness; failure of LNG to be a competitive source of energy in the markets in which we operate, and seek to operate; increased laborcosts, and the unavailability of skilled workers or our failure to attract and retain qualified personnel; a major health and safety incidentrelating to our business; failure to obtain and maintain approvals and permits from governmental and regulatory agencies including withrespect to our planned operational expansion in Mexico; changes to health and safety, environmental and similar laws and governmentalregulations that are adverse to our operations; volatility of the market price of our common stock; and our ability to integratesuccessfully the businesses of Stabilis Energy, LLC and American Electric and additional acquisitions in the expected timeframe.
In addition to the factors described above, you should carefully read and consider the Risk Factors set forth in our Prospectus filed withthe Securities and Exchange Commission on November 8, 2019 and “Item 2. Management’s Discussion and Analysis of Financial Conditionand Results of Operations” in Part I of our most recent quarterly report on Form 10‐Q, as updated in our subsequent quarterly reports onForm 10‐Q and annual reports on Form 10‐K, which are available on the SEC’s website at www.sec.gov or on the Investors section of ourwebsite at www.stabilisenergy.com. Each forward‐looking statement speaks only as of the date of the particular statement, and weundertake no obligation to publicly update or revise any forward‐looking statements herein even if experience or future events make itclear that any of the future events, plans, results and objectives expressed or implied herein will not be realized, except as required bylaw.
Cautionary Statement Regarding Forward‐Looking Statements
33
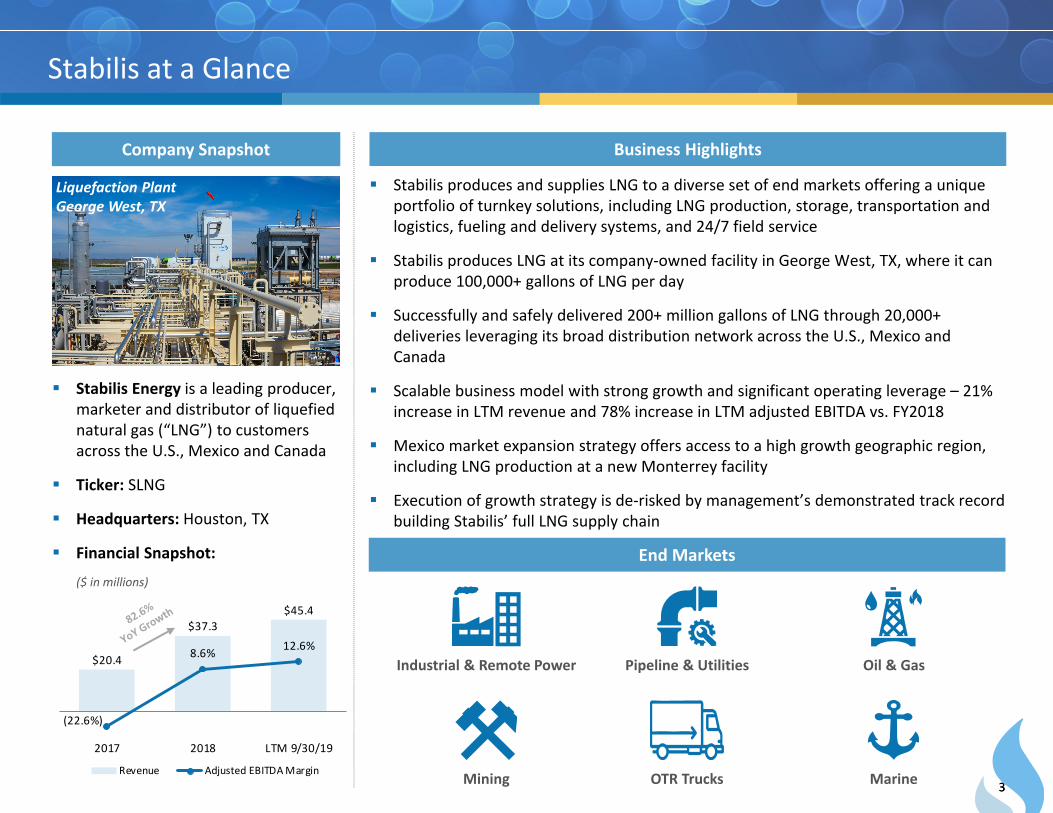
Stabilis Energy is a leading producer, marketer and distributor of liquefied natural gas (“LNG”) to customers across the U.S., Mexico and Canada
Ticker: SLNG
Headquarters: Houston, TX
Financial Snapshot:
Stabilis at a Glance
Company Snapshot Business Highlights
Stabilis produces and supplies LNG to a diverse set of end markets offering a unique portfolio of turnkey solutions, including LNG production, storage, transportation and logistics, fueling and delivery systems, and 24/7 field service
Stabilis produces LNG at its company‐owned facility in George West, TX, where it can produce 100,000+ gallons of LNG per day
Successfully and safely delivered 200+ million gallons of LNG through 20,000+ deliveries leveraging its broad distribution network across the U.S., Mexico and Canada
Scalable business model with strong growth and significant operating leverage – 21% increase in LTM revenue and 78% increase in LTM adjusted EBITDA vs. FY2018
Mexico market expansion strategy offers access to a high growth geographic region, including LNG production at a new Monterrey facility
Execution of growth strategy is de‐risked by management’s demonstrated track record building Stabilis’ full LNG supply chain
Liquefaction PlantGeorge West, TX
End Markets
Oil & GasIndustrial & Remote Power Pipeline & Utilities
Mining MarineOTR Trucks
$20.4
$37.3$45.4
(22.6%)
8.6% 12.6%
(2 5 .0 % )
(1 5 .0 % )
(5 .0 % )
5 .0 %
1 5. 0%
2 5. 0%
3 5. 0%
‐$ 1 0. 0
2017 2018 LTM 9/30/19
Revenue Adjusted EBITDA Margin
($ in millions)
44
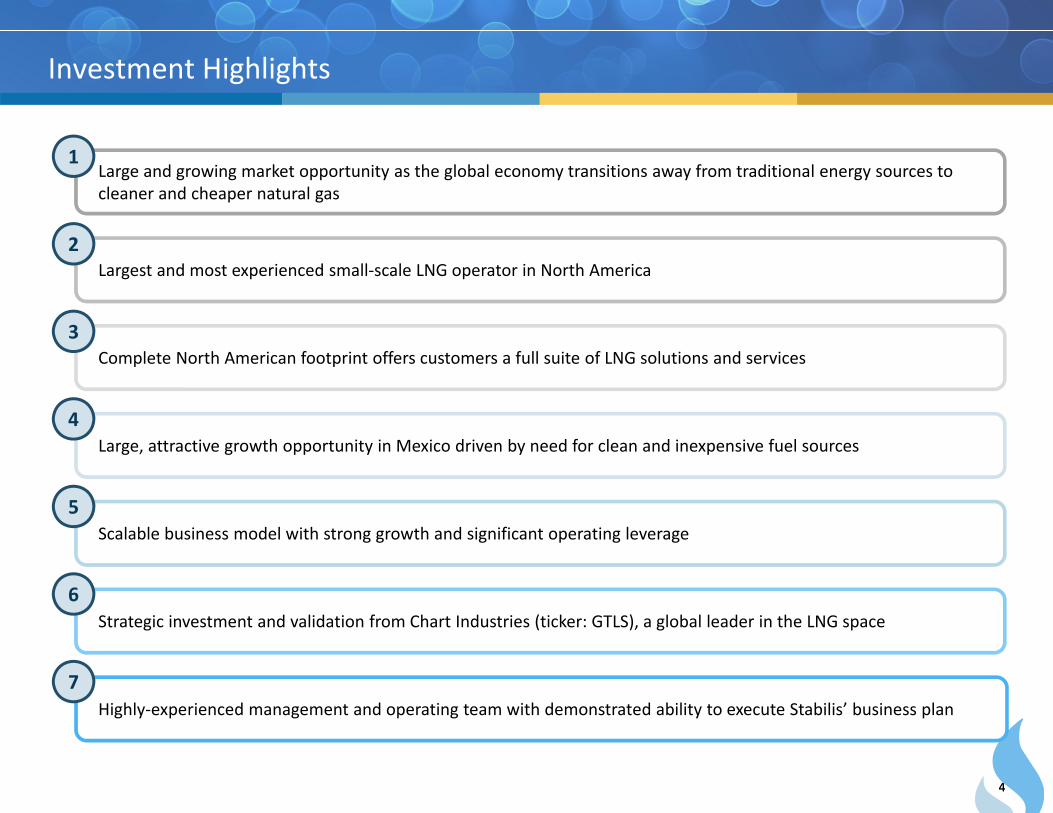
Investment Highlights
Large and growing market opportunity as the global economy transitions away from traditional energy sources to cleaner and cheaper natural gas
Complete North American footprint offers customers a full suite of LNG solutions and services
Largest and most experienced small‐scale LNG operator in North America
Scalable business model with strong growth and significant operating leverage
Large, attractive growth opportunity in Mexico driven by need for clean and inexpensive fuel sources
Strategic investment and validation from Chart Industries (ticker: GTLS), a global leader in the LNG space
Highly‐experienced management and operating team with demonstrated ability to execute Stabilis’ business plan
1
7
2
3
4
5
6
55
Source: U.S. Energy Information Administration, industry research.
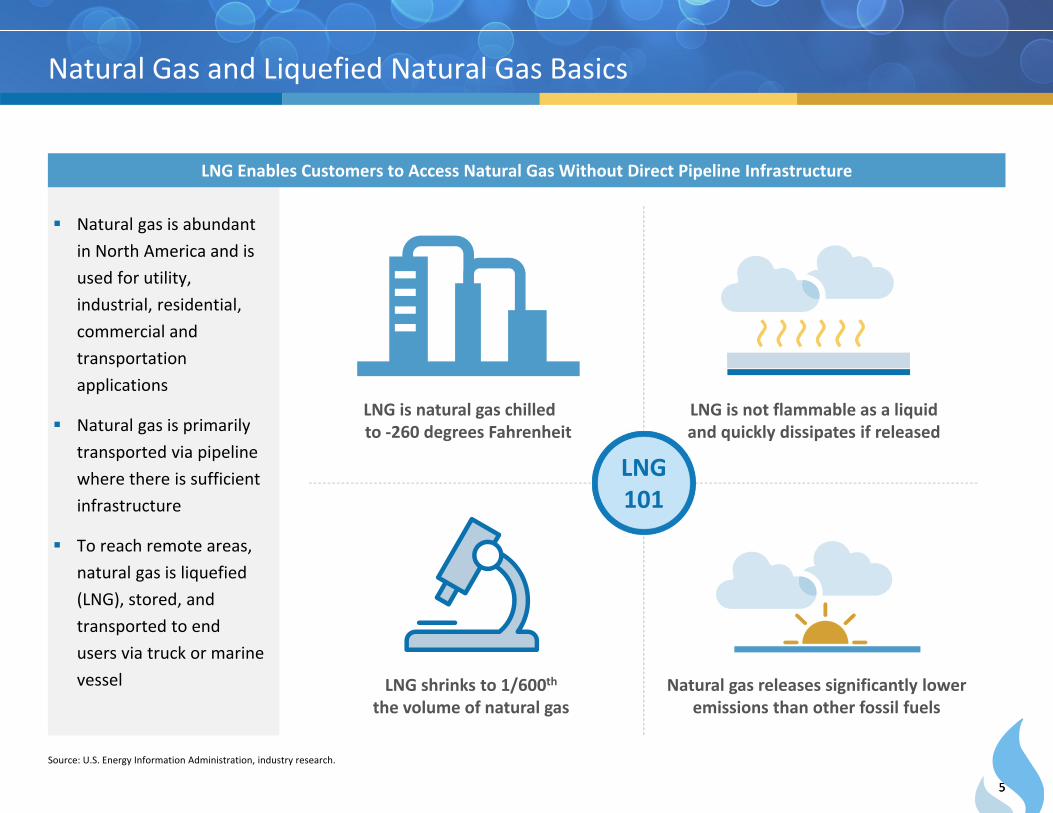
Natural gas is abundant in North America and is used for utility, industrial, residential, commercial and transportation applications
Natural gas is primarily transported via pipeline where there is sufficient infrastructure
To reach remote areas, natural gas is liquefied (LNG), stored, and transported to end users via truck or marine vessel
Natural Gas and Liquefied Natural Gas Basics
LNG Enables Customers to Access Natural Gas Without Direct Pipeline Infrastructure
LNG101
LNG is natural gas chilledto ‐260 degrees Fahrenheit
LNG is not flammable as a liquidand quickly dissipates if released
LNG shrinks to 1/600ththe volume of natural gas
Natural gas releases significantly lower emissions than other fossil fuels
66
Oil & GasIndustrial & Remote Power
Pipeline & Utilities
OTR TrucksMining Marine
Source: Engie; Strategy & Research, GEA Group Aktiengesellschaft.
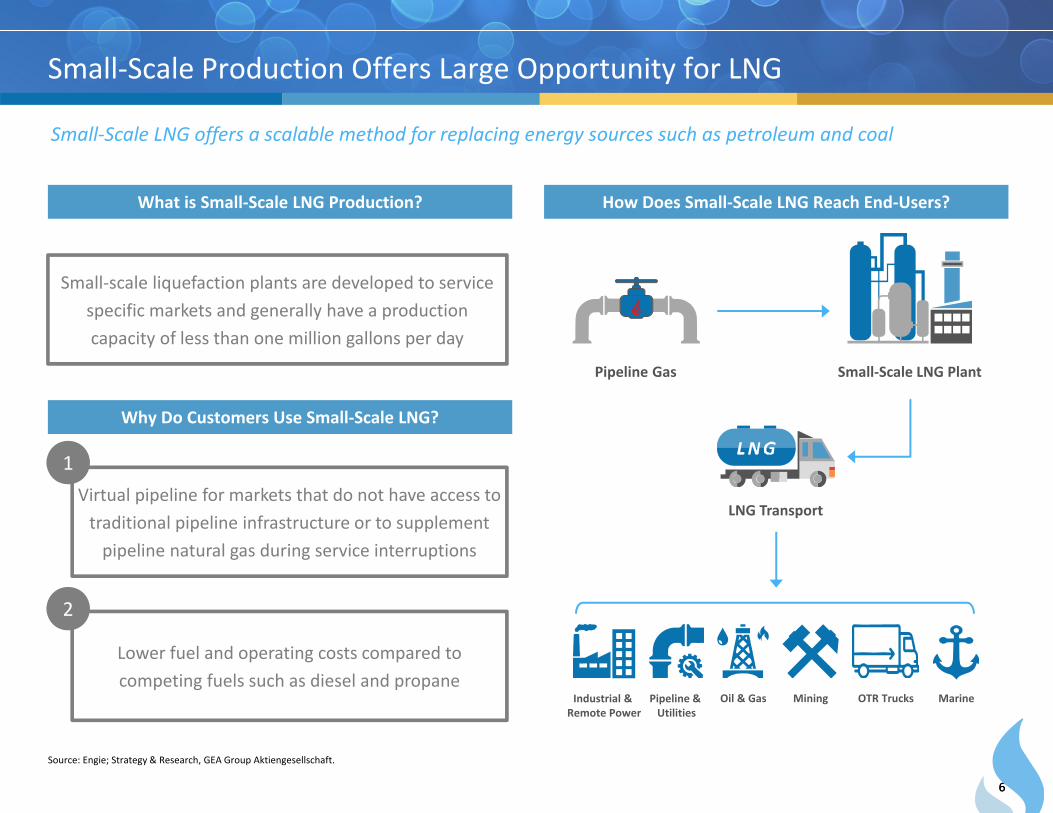
Small‐Scale LNG offers a scalable method for replacing energy sources such as petroleum and coal
Small‐Scale Production Offers Large Opportunity for LNG
What is Small‐Scale LNG Production?
Small‐scale liquefaction plants are developed to service specific markets and generally have a production capacity of less than one million gallons per day
How Does Small‐Scale LNG Reach End‐Users?
Pipeline Gas Small‐Scale LNG Plant
LNG Transport
Why Do Customers Use Small‐Scale LNG?
Lower fuel and operating costs compared to competing fuels such as diesel and propane
Virtual pipeline for markets that do not have access to traditional pipeline infrastructure or to supplement pipeline natural gas during service interruptions
1
2
77
0
200
400
600
800
1,000
1,200
1,400
1,600
1,800
2,000
2018 '19 '20 '21 '22 '23 '24 '25 '26 '27 '28 '29 '30
Million of LNG Ga
llons
‐
5.0
10.0
15.0
20.0
25.0
30.0
2009 2010 2011 2012 2013 2014 2015 2016 2017 2018 2019
$ pe
r MMBT
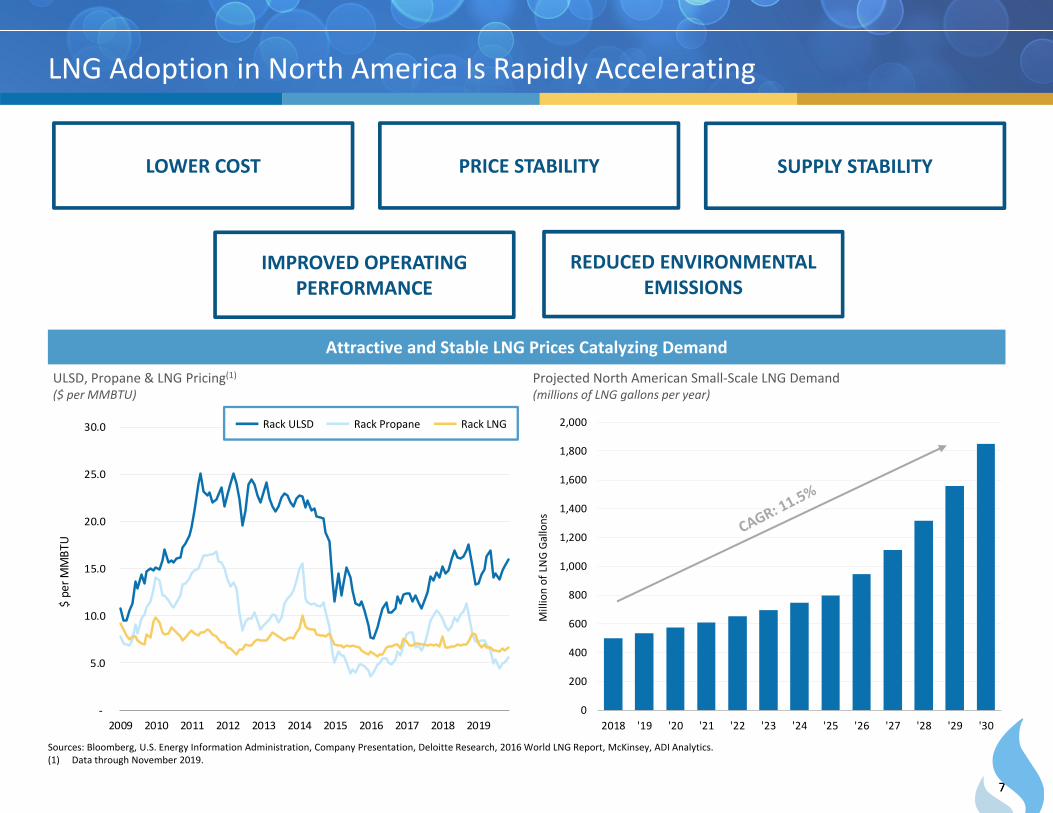
ULNG Adoption in North America Is Rapidly Accelerating
Attractive and Stable LNG Prices Catalyzing Demand
Sources: Bloomberg, U.S. Energy Information Administration, Company Presentation, Deloitte Research, 2016 World LNG Report, McKinsey, ADI Analytics.(1) Data through November 2019.
SUPPLY STABILITYPRICE STABILITY
Projected North American Small‐Scale LNG Demand(millions of LNG gallons per year)
ULSD, Propane & LNG Pricing(1)($ per MMBTU)
IMPROVED OPERATING PERFORMANCE
`
LOWER COST
REDUCED ENVIRONMENTAL EMISSIONS
Rack ULSD Rack Propane Rack LNG
88
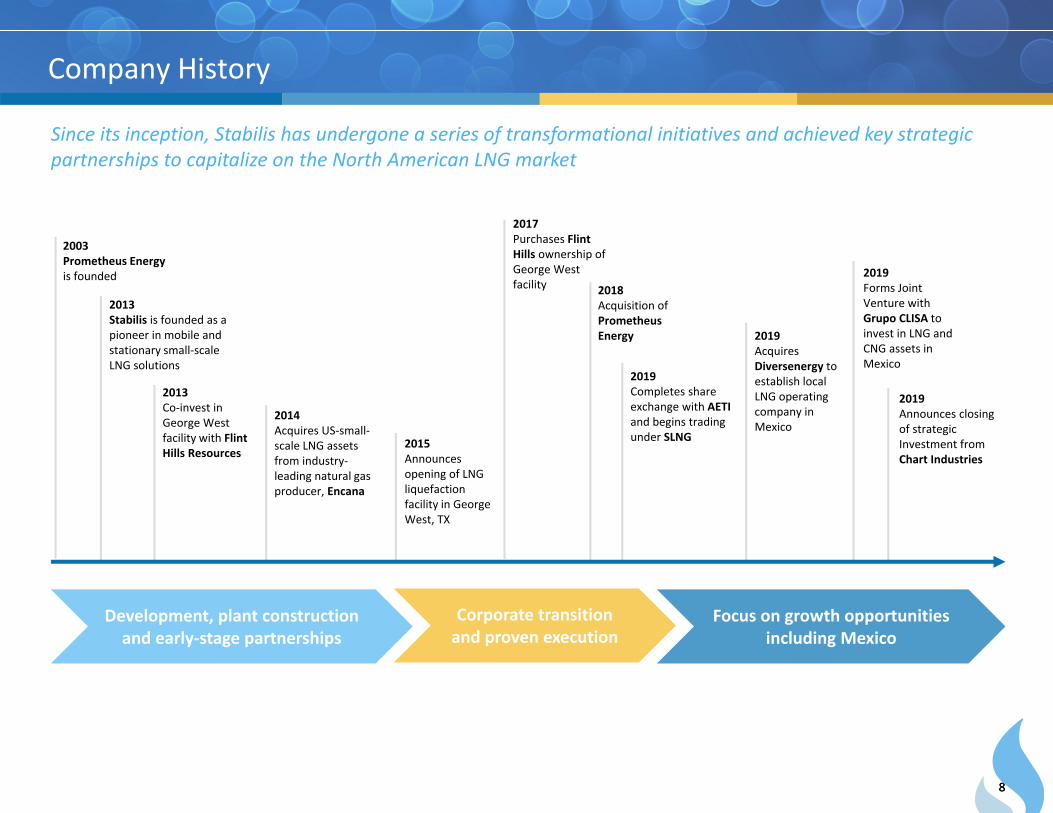
Company History
Since its inception, Stabilis has undergone a series of transformational initiatives and achieved key strategic partnerships to capitalize on the North American LNG market
Development, plant construction and early‐stage partnerships
Corporate transition and proven execution
Focus on growth opportunities including Mexico
2013Stabilis is founded as a pioneer in mobile and stationary small‐scale LNG solutions
2013Co‐invest in George West facility with Flint Hills Resources
2014Acquires US‐small‐scale LNG assets from industry‐leading natural gas producer, Encana
2015Announces opening of LNG liquefaction facility in George West, TX
2018Acquisition of Prometheus Energy
2019Completes share exchange with AETIand begins trading under SLNG
2019Acquires Diversenergy to establish local LNG operating company in Mexico
2019Forms Joint Venture with Grupo CLISA to invest in LNG and CNG assets in Mexico
2019Announces closing of strategic Investment from Chart Industries
2017Purchases Flint Hills ownership of George West facility
2003Prometheus Energy is founded

99
LNG Production
LNG Supply Network
Transportation & Logistics
Equipment Rental & Field Service Support
Overview
Scale
Highlights
Build and operate liquefaction plants
Comprehensive North American LNG
supply network
Agreements with carriersfor national distribution and tailor made logistics
software
Lease, install and operate cryogenic
equipment
100,000+ LNG gallon per day plant in George
West, TX
Supply contracts with 25+ LNG producers
200+ million LNG gallons delivered since inception
150+ piece fleet of mobile equipment
Opportunity to build new plants, with 2nd liquefier
already owned and targeted for the Mexican market
Can deliver LNG anytime throughout
North America
Proven track record of safe and on‐time deliveries
24/7 field service and remote monitoring
Production Distribution
Stabilis Offers Industry‐Leading Fuel Programs and Reach
1010
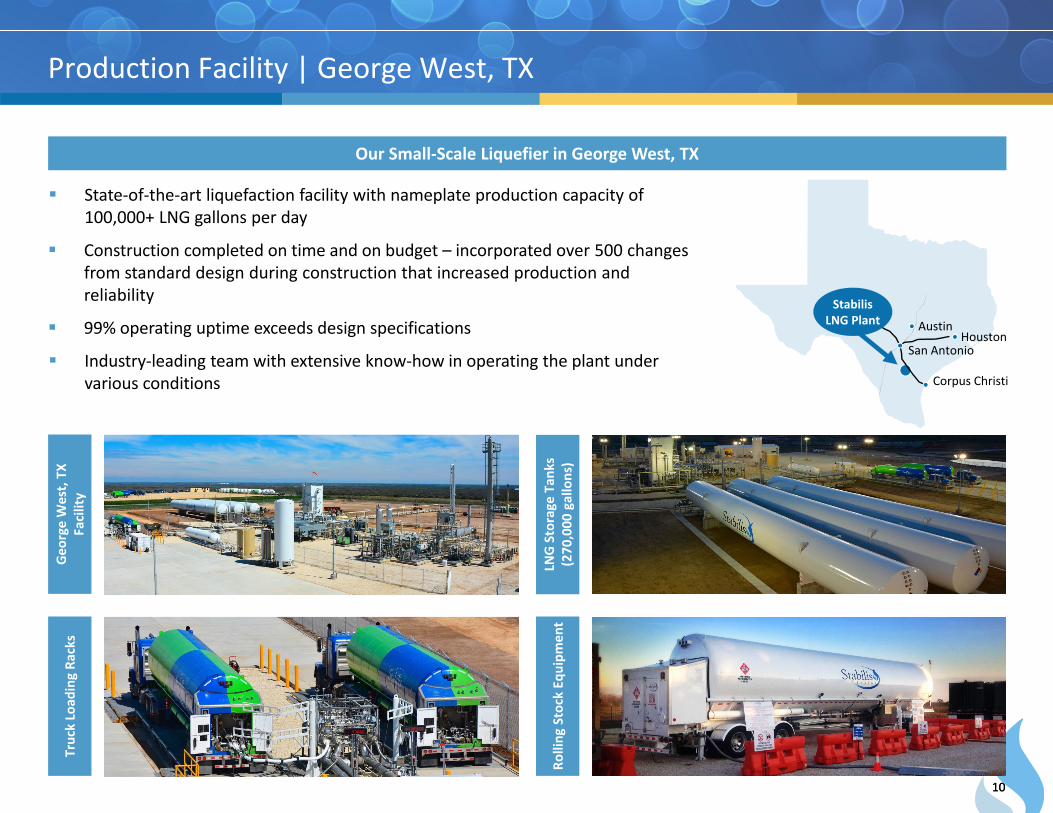
State‐of‐the‐art liquefaction facility with nameplate production capacity of 100,000+ LNG gallons per day
Construction completed on time and on budget – incorporated over 500 changes from standard design during construction that increased production and reliability
99% operating uptime exceeds design specifications
Industry‐leading team with extensive know‐how in operating the plant under various conditions
Production Facility | George West, TX
Our Small‐Scale Liquefier in George West, TX
StabilisLNG Plant
San Antonio
Corpus Christi
Geo
rge West, TX
Facility
Truck Load
ing Ra
cks
LNG Storage
Tan
ks
(270
,000
gallons)
Rolling
Stock Equ
ipmen
t
HoustonAustin
1111
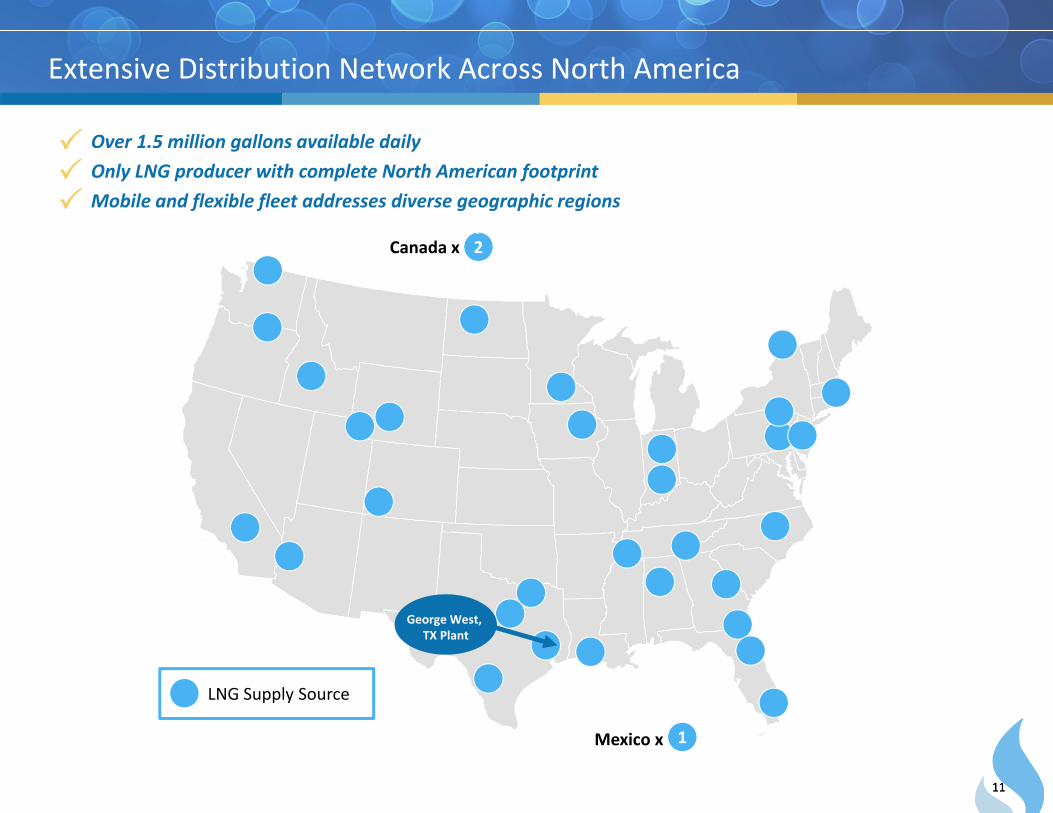
Extensive Distribution Network Across North America
LNG Supply Source
Over 1.5 million gallons available dailyOnly LNG producer with complete North American footprintMobile and flexible fleet addresses diverse geographic regions
(2)
Canada x
1
George West, TX Plant
Mexico x
1212
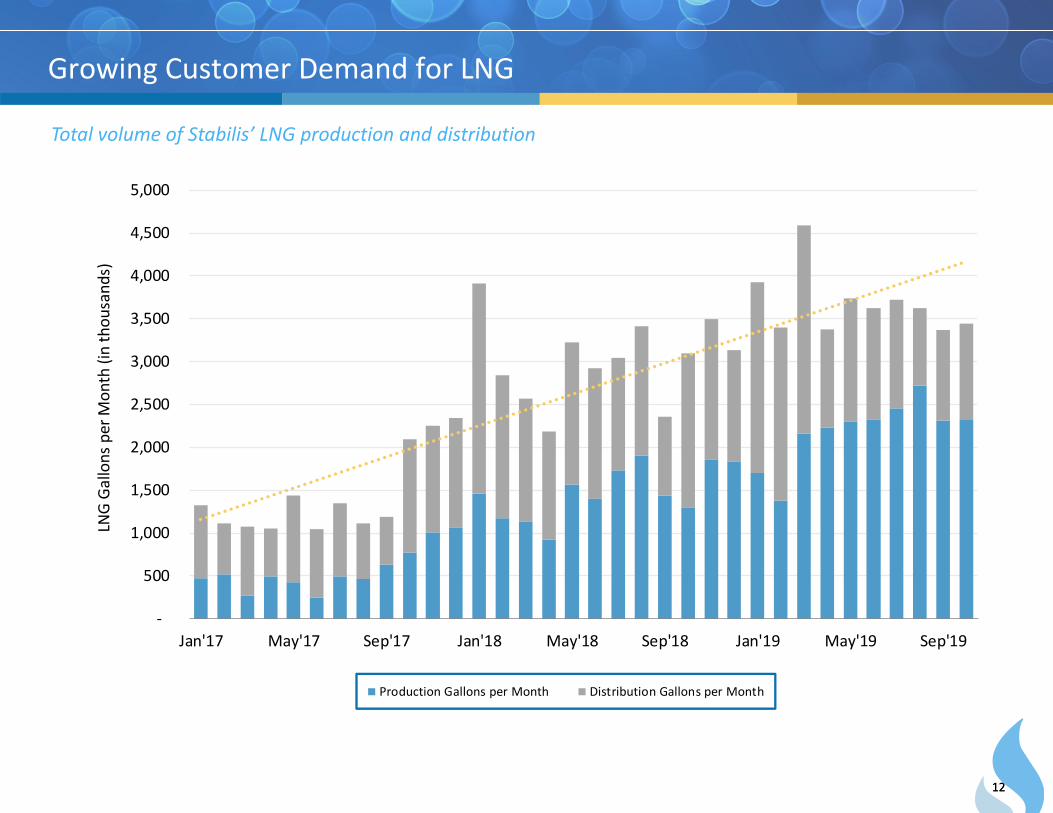
Growing Customer Demand for LNG
Total volume of Stabilis’ LNG production and distribution
‐
5 0 0
1 ,0 0 0
1 ,5 0 0
2 ,0 0 0
2 ,5 0 0
3 ,0 0 0
3 ,5 0 0
4 ,0 0 0
4 ,5 0 0
5 ,0 0 0
‐
500
1,000
1,500
2,000
2,500
3,000
3,500
4,000
4,500
5,000
Jan'17 May'17 Sep'17 Jan'18 May'18 Sep'18 Jan'19 May'19 Sep'19
LNG Gallons per M
onth (in thou
sand
s)
Production Gallons per Month Distribution Gallons per Month`
1313
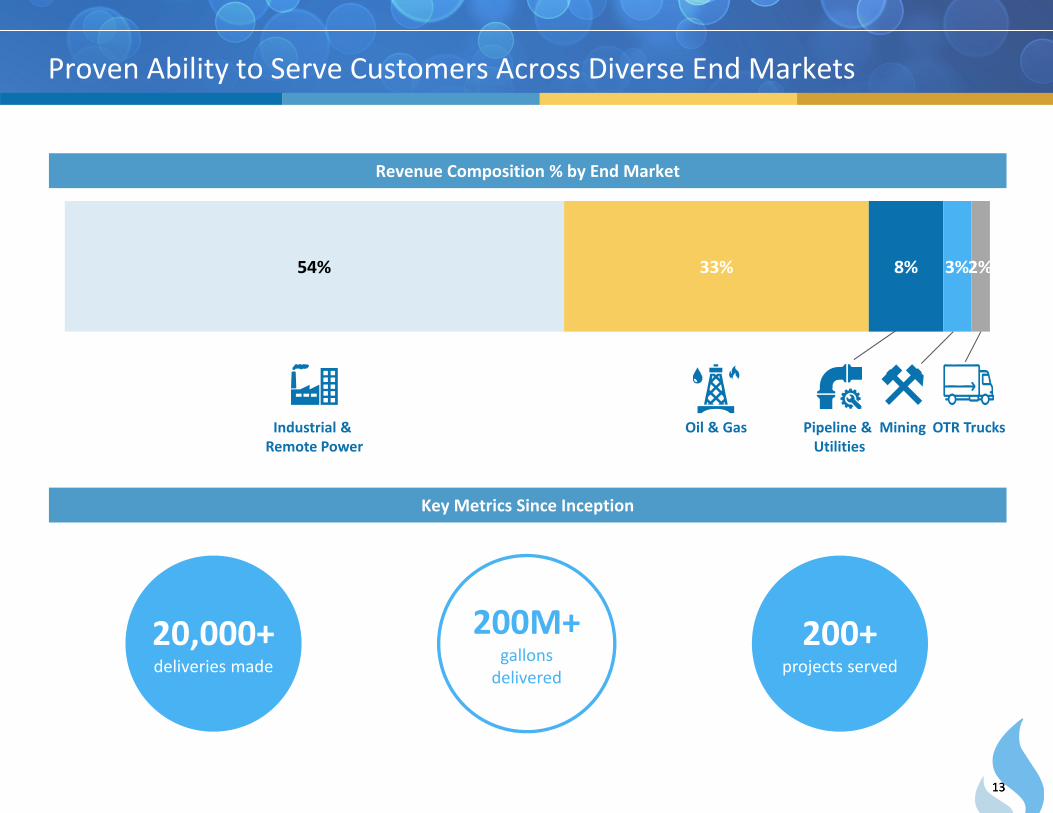
54% 33% 8% 3%2%
Proven Ability to Serve Customers Across Diverse End Markets
Revenue Composition % by End Market
Key Metrics Since Inception
200+projects served
Oil & GasIndustrial & Remote Power
Pipeline & Utilities
Mining OTR Trucks
20,000+deliveries made
200M+gallons delivered
1414
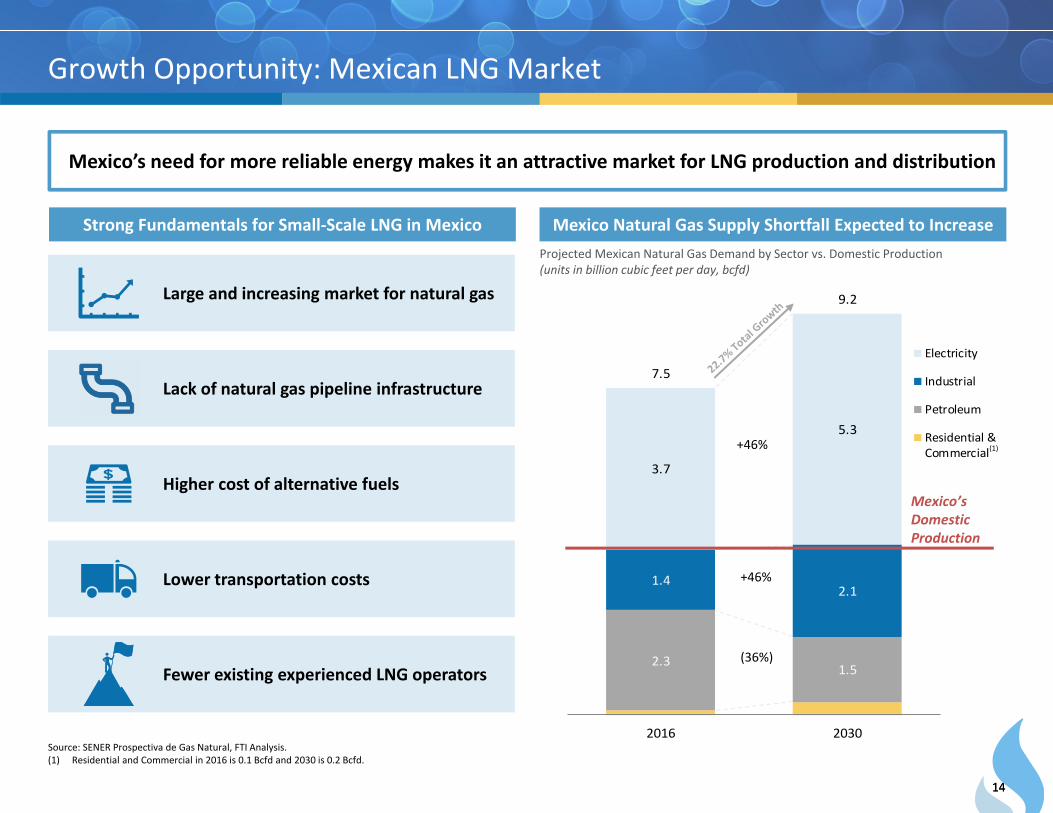
Lack of natural gas pipeline infrastructure
Higher cost of alternative fuels
Lower transportation costs
Fewer existing experienced LNG operators
Large and increasing market for natural gas
Growth Opportunity: Mexican LNG Market
Source: SENER Prospectiva de Gas Natural, FTI Analysis.(1) Residential and Commercial in 2016 is 0.1 Bcfd and 2030 is 0.2 Bcfd.
Strong Fundamentals for Small‐Scale LNG in Mexico
Mexico’s need for more reliable energy makes it an attractive market for LNG production and distribution
Mexico Natural Gas Supply Shortfall Expected to IncreaseProjected Mexican Natural Gas Demand by Sector vs. Domestic Production(units in billion cubic feet per day, bcfd)
2.3 1.5
1.42.1
3.7
5.3
7.5
9.2
0
1
2
3
4
5
6
7
8
9
1 0
2016 2030
Electricity
Industrial
Petroleum
Residential &Commercial(1)
(36%)
+46%
+46%
Mexico’sDomestic Production
1515
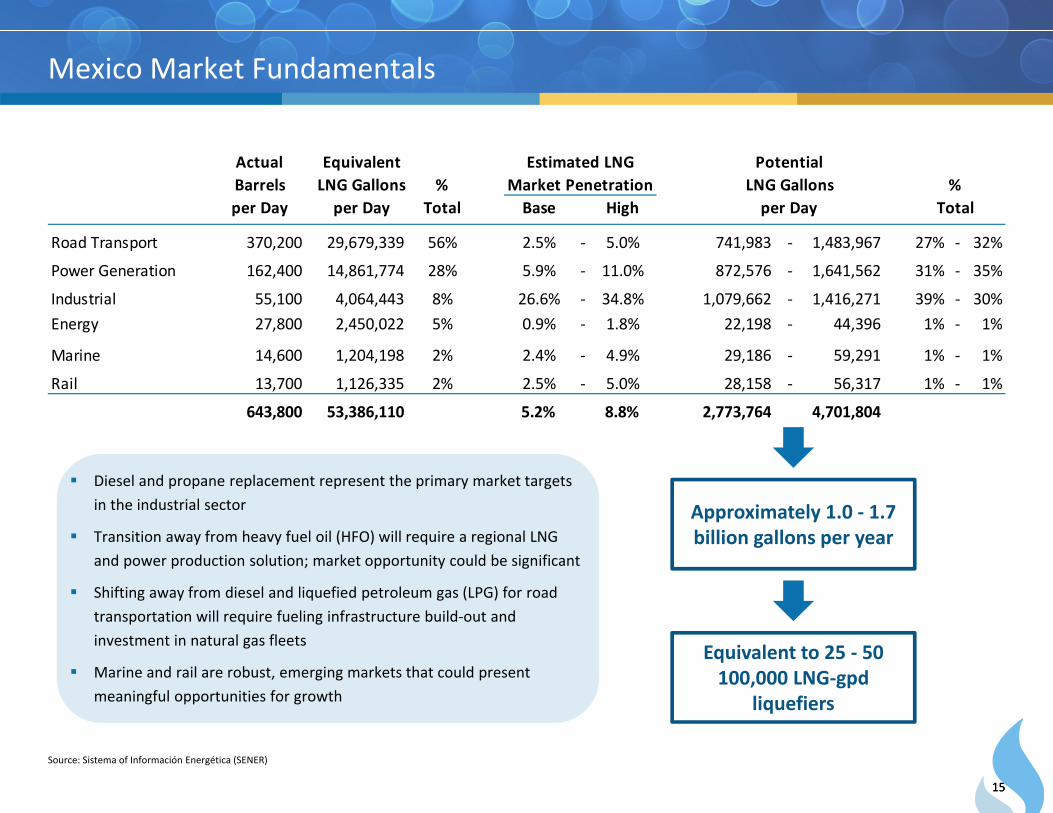
Mexico Market Fundamentals
Source: Sistema of Información Energética (SENER)
Equivalent to 25 ‐ 50 100,000 LNG‐gpd
liquefiers
Approximately 1.0 ‐ 1.7 billion gallons per year
Diesel and propane replacement represent the primary market targets in the industrial sector
Transition away from heavy fuel oil (HFO) will require a regional LNG and power production solution; market opportunity could be significant
Shifting away from diesel and liquefied petroleum gas (LPG) for road transportation will require fueling infrastructure build‐out and investment in natural gas fleets
Marine and rail are robust, emerging markets that could present meaningful opportunities for growth
Actual Equivalent Estimated LNG PotentialBarrels LNG Gallons % Market Penetration LNG Gallons %per Day per Day Total Base High per Day Total
Road Transport 370,200 29,679,339 56% 2.5% ‐ 5.0% 741,983 ‐ 1,483,967 27% ‐ 32%
Power Generation 162,400 14,861,774 28% 5.9% ‐ 11.0% 872,576 ‐ 1,641,562 31% ‐ 35%
Industrial 55,100 4,064,443 8% 26.6% ‐ 34.8% 1,079,662 ‐ 1,416,271 39% ‐ 30%Energy 27,800 2,450,022 5% 0.9% ‐ 1.8% 22,198 ‐ 44,396 1% ‐ 1%
Marine 14,600 1,204,198 2% 2.4% ‐ 4.9% 29,186 ‐ 59,291 1% ‐ 1%
Rail 13,700 1,126,335 2% 2.5% ‐ 5.0% 28,158 ‐ 56,317 1% ‐ 1%
643,800 53,386,110 5.2% 8.8% 2,773,764 4,701,804
1616
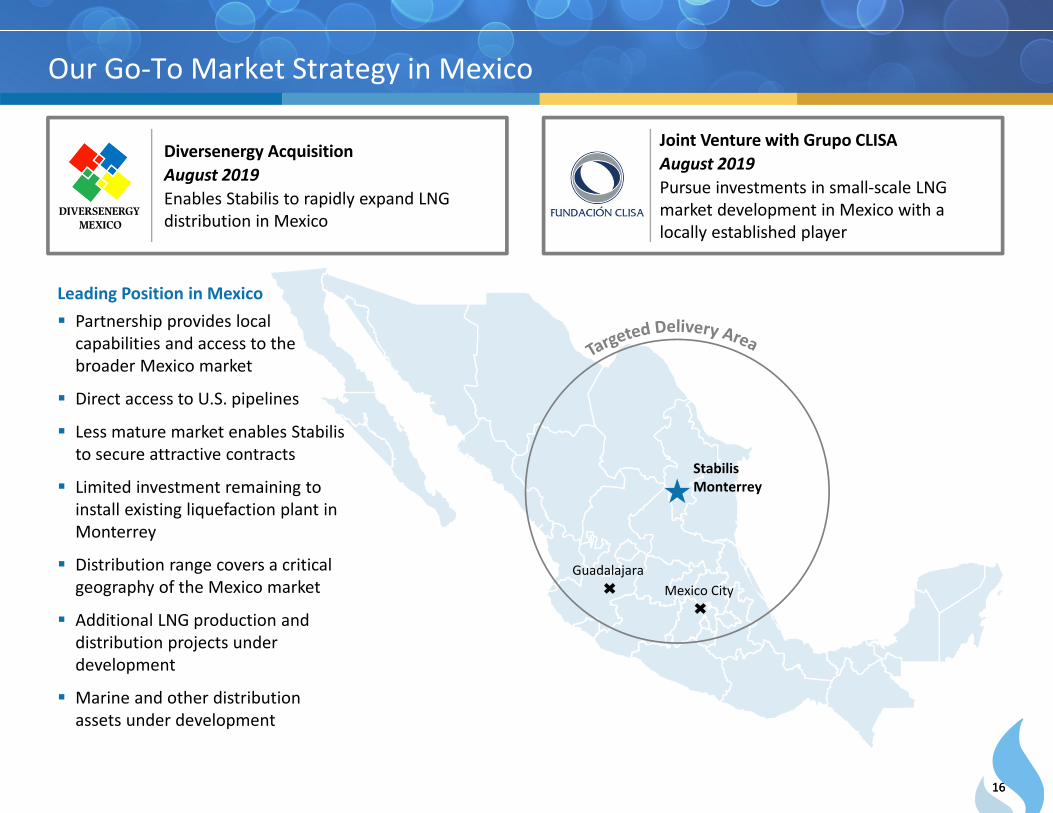
Our Go‐To Market Strategy in Mexico
Stabilis Monterreyj
GuadalajaraMexico City
Diversenergy AcquisitionAugust 2019Enables Stabilis to rapidly expand LNG distribution in Mexico
Joint Venture with Grupo CLISAAugust 2019Pursue investments in small‐scale LNG market development in Mexico with a locally established player
Leading Position in Mexico Partnership provides local capabilities and access to the broader Mexico market
Direct access to U.S. pipelines
Less mature market enables Stabilis to secure attractive contracts
Limited investment remaining to install existing liquefaction plant in Monterrey
Distribution range covers a critical geography of the Mexico market
Additional LNG production and distribution projects under development
Marine and other distribution assets under development
1717
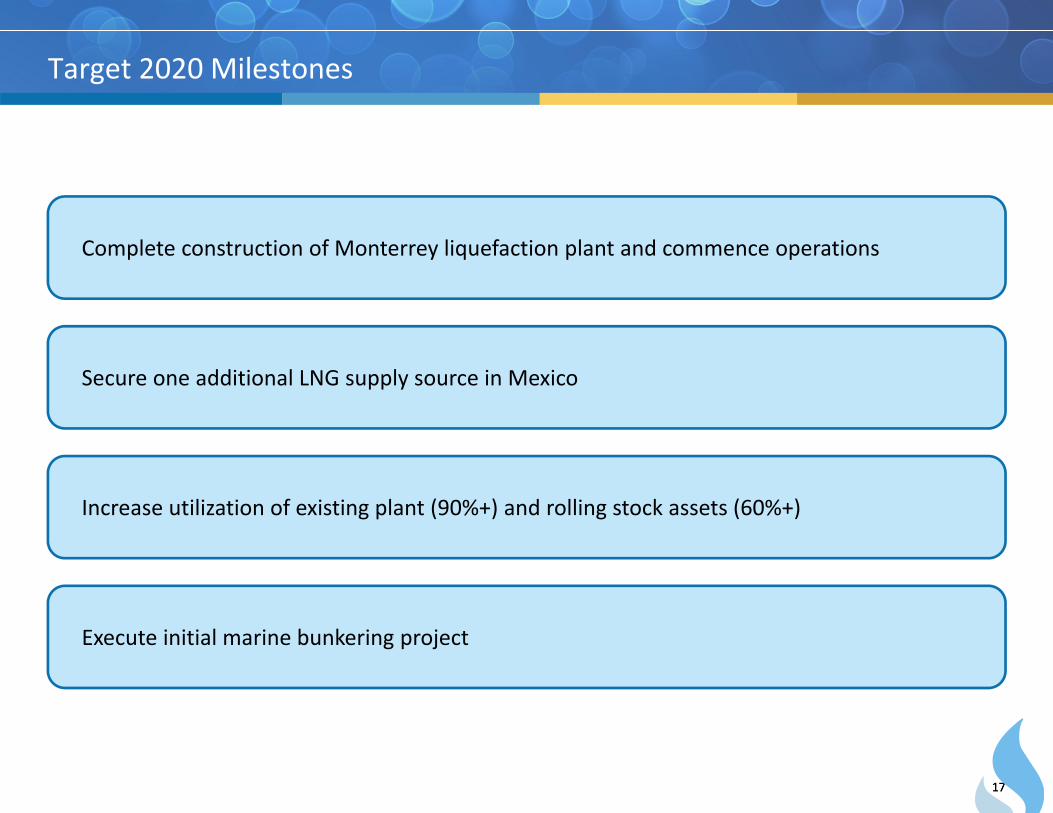
Target 2020 Milestones
Complete construction of Monterrey liquefaction plant and commence operations
Secure one additional LNG supply source in Mexico
Increase utilization of existing plant (90%+) and rolling stock assets (60%+)
Execute initial marine bunkering project
1818
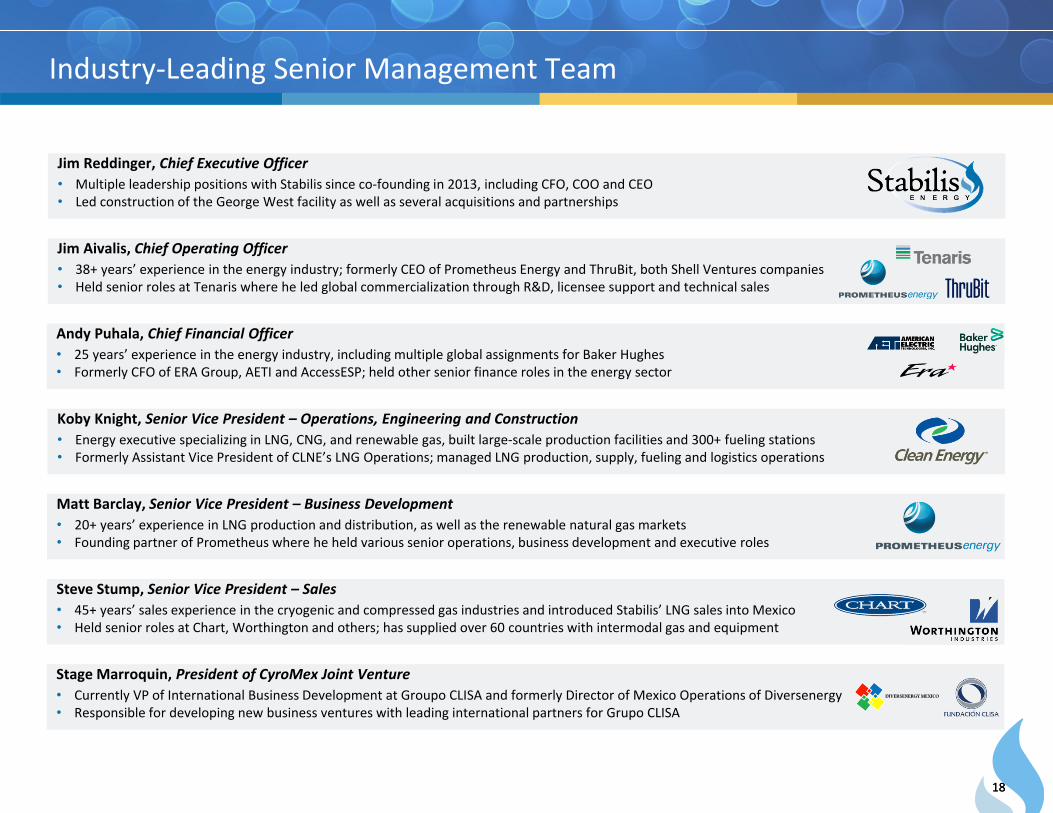
Jim Aivalis, Chief Operating Officer• 38+ years’ experience in the energy industry; formerly CEO of Prometheus Energy and ThruBit, both Shell Ventures companies• Held senior roles at Tenaris where he led global commercialization through R&D, licensee support and technical sales
Industry‐Leading Senior Management Team
Jim Reddinger, Chief Executive Officer• Multiple leadership positions with Stabilis since co‐founding in 2013, including CFO, COO and CEO • Led construction of the George West facility as well as several acquisitions and partnerships
Andy Puhala, Chief Financial Officer• 25 years’ experience in the energy industry, including multiple global assignments for Baker Hughes• Formerly CFO of ERA Group, AETI and AccessESP; held other senior finance roles in the energy sector
Matt Barclay, Senior Vice President – Business Development• 20+ years’ experience in LNG production and distribution, as well as the renewable natural gas markets• Founding partner of Prometheus where he held various senior operations, business development and executive roles
Koby Knight, Senior Vice President – Operations, Engineering and Construction• Energy executive specializing in LNG, CNG, and renewable gas, built large‐scale production facilities and 300+ fueling stations• Formerly Assistant Vice President of CLNE’s LNG Operations; managed LNG production, supply, fueling and logistics operations
Steve Stump, Senior Vice President – Sales • 45+ years’ sales experience in the cryogenic and compressed gas industries and introduced Stabilis’ LNG sales into Mexico• Held senior roles at Chart, Worthington and others; has supplied over 60 countries with intermodal gas and equipment
Stage Marroquin, President of CyroMex Joint Venture• Currently VP of International Business Development at Groupo CLISA and formerly Director of Mexico Operations of Diversenergy• Responsible for developing new business ventures with leading international partners for Grupo CLISA

1919
Financial Overview
2020
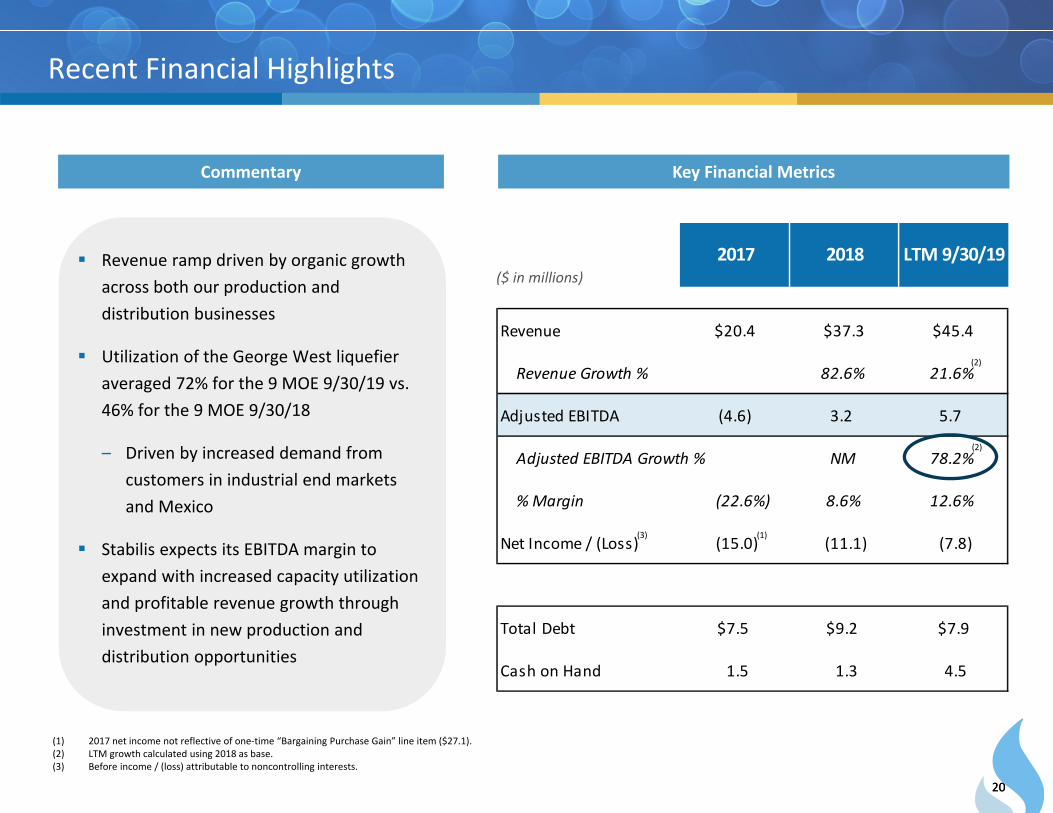
Revenue $20.4 $37.3 $45.4
Revenue Growth % 82.6% 21.6%
Adjusted EBITDA (4.6) 3.2 5.7
Adjusted EBITDA Growth % NM 78.2%
% Margin (22.6%) 8.6% 12.6%
Net Income / (Loss) (15.0) (11.1) (7.8)
Total Debt $7.5 $9.2 $7.9
Cash on Hand 1.5 1.3 4.5
2017 2018 LTM 9/30/19
Recent Financial Highlights
Revenue ramp driven by organic growth across both our production and distribution businesses
Utilization of the George West liquefier averaged 72% for the 9 MOE 9/30/19 vs. 46% for the 9 MOE 9/30/18
– Driven by increased demand from customers in industrial end markets and Mexico
Stabilis expects its EBITDA margin to expand with increased capacity utilization and profitable revenue growth through investment in new production and distribution opportunities
Commentary Key Financial Metrics
($ in millions)
(1) 2017 net income not reflective of one‐time “Bargaining Purchase Gain” line item ($27.1).(2) LTM growth calculated using 2018 as base.(3) Before income / (loss) attributable to noncontrolling interests.
(2)
(2)
(3) (1)
2121
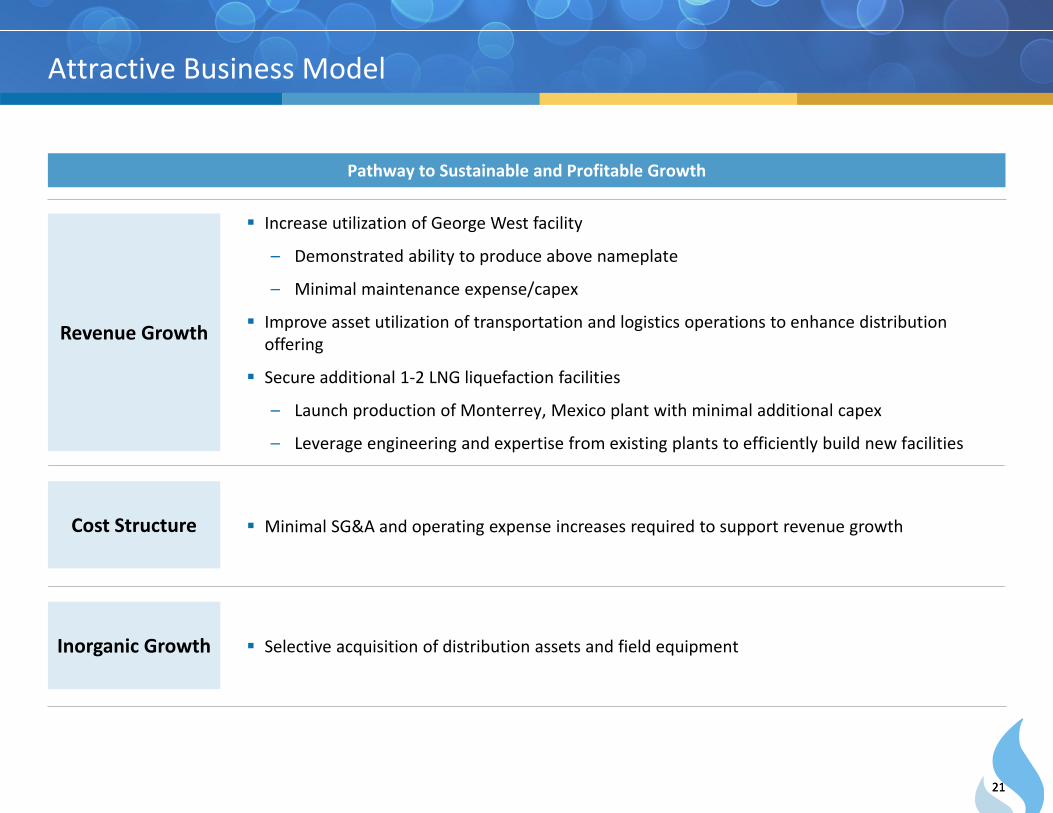
Attractive Business Model
Pathway to Sustainable and Profitable Growth
Increase utilization of George West facility
– Demonstrated ability to produce above nameplate
– Minimal maintenance expense/capex
Improve asset utilization of transportation and logistics operations to enhance distribution offering
Secure additional 1‐2 LNG liquefaction facilities
– Launch production of Monterrey, Mexico plant with minimal additional capex
– Leverage engineering and expertise from existing plants to efficiently build new facilities
Minimal SG&A and operating expense increases required to support revenue growth
Selective acquisition of distribution assets and field equipment
Revenue Growth
Cost Structure
Inorganic Growth

2222
Appendix
2323
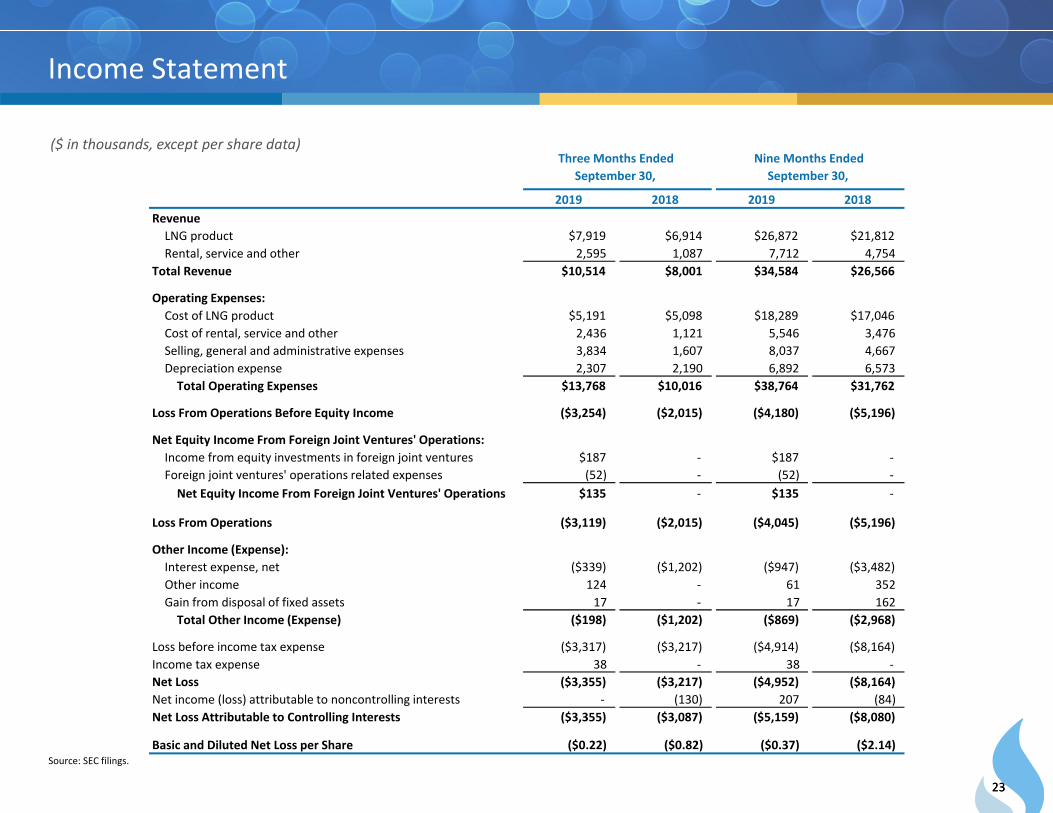
Income Statement
($ in thousands, except per share data)
Source: SEC filings.
2019 2018 2019 2018RevenueLNG product $7,919 $6,914 $26,872 $21,812Rental, service and other 2,595 1,087 7,712 4,754
Total Revenue $10,514 $8,001 $34,584 $26,566
Operating Expenses:Cost of LNG product $5,191 $5,098 $18,289 $17,046Cost of rental, service and other 2,436 1,121 5,546 3,476Selling, general and administrative expenses 3,834 1,607 8,037 4,667Depreciation expense 2,307 2,190 6,892 6,573Total Operating Expenses $13,768 $10,016 $38,764 $31,762
Loss From Operations Before Equity Income ($3,254) ($2,015) ($4,180) ($5,196)
Net Equity Income From Foreign Joint Ventures' Operations:Income from equity investments in foreign joint ventures $187 ‐ $187 ‐Foreign joint ventures' operations related expenses (52) ‐ (52) ‐Net Equity Income From Foreign Joint Ventures' Operations $135 ‐ $135 ‐
Loss From Operations ($3,119) ($2,015) ($4,045) ($5,196)
Other Income (Expense):Interest expense, net ($339) ($1,202) ($947) ($3,482)Other income 124 ‐ 61 352Gain from disposal of fixed assets 17 ‐ 17 162Total Other Income (Expense) ($198) ($1,202) ($869) ($2,968)
Loss before income tax expense ($3,317) ($3,217) ($4,914) ($8,164)Income tax expense 38 ‐ 38 ‐Net Loss ($3,355) ($3,217) ($4,952) ($8,164)Net income (loss) attributable to noncontrolling interests ‐ (130) 207 (84)Net Loss Attributable to Controlling Interests ($3,355) ($3,087) ($5,159) ($8,080)
Basic and Diluted Net Loss per Share ($0.22) ($0.82) ($0.37) ($2.14)
Nine Months Ended September 30,
Three Months Ended September 30,
2424
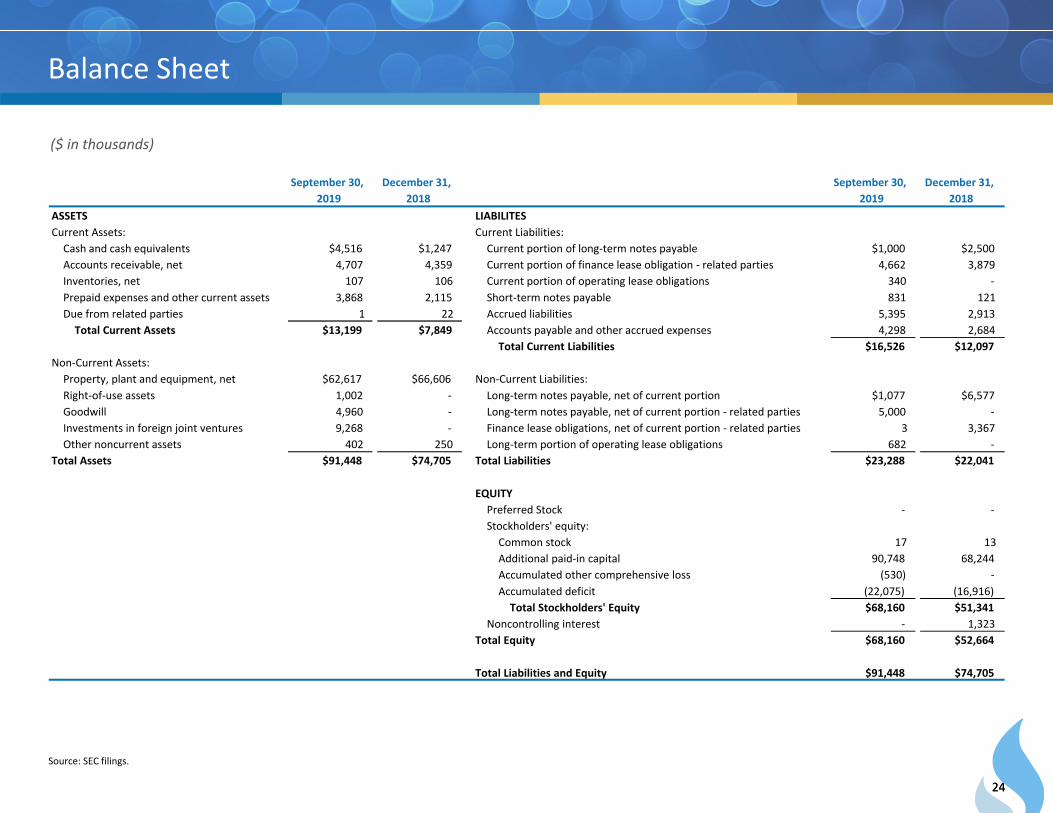
Balance Sheet
($ in thousands)
Source: SEC filings.
ASSETS LIABILITESCurrent Assets: Current Liabilities:Cash and cash equivalents $4,516 $1,247 Current portion of long‐term notes payable $1,000 $2,500Accounts receivable, net 4,707 4,359 Current portion of finance lease obligation ‐ related parties 4,662 3,879Inventories, net 107 106 Current portion of operating lease obligations 340 ‐Prepaid expenses and other current assets 3,868 2,115 Short‐term notes payable 831 121Due from related parties 1 22 Accrued liabilities 5,395 2,913Total Current Assets $13,199 $7,849 Accounts payable and other accrued expenses 4,298 2,684
Total Current Liabilities $16,526 $12,097Non‐Current Assets:Property, plant and equipment, net $62,617 $66,606 Non‐Current Liabilities:Right‐of‐use assets 1,002 ‐ Long‐term notes payable, net of current portion $1,077 $6,577Goodwill 4,960 ‐ Long‐term notes payable, net of current portion ‐ related parties 5,000 ‐Investments in foreign joint ventures 9,268 ‐ Finance lease obligations, net of current portion ‐ related parties 3 3,367Other noncurrent assets 402 250 Long‐term portion of operating lease obligations 682 ‐
Total Assets $91,448 $74,705 Total Liabilities $23,288 $22,041
EQUITYPreferred Stock ‐ ‐Stockholders' equity:Common stock 17 13Additional paid‐in capital 90,748 68,244Accumulated other comprehensive loss (530) ‐Accumulated deficit (22,075) (16,916)Total Stockholders' Equity $68,160 $51,341
Noncontrolling interest ‐ 1,323Total Equity $68,160 $52,664
Total Liabilities and Equity $91,448 $74,705
December 31, 2018
September 30, 2019
September 30, 2019
December 31, 2018

2525
Cash Flow Statement
($ in thousands)
Source: SEC filings.
2019 2018 2019 2018Cash Flow from Operating Activities: Cash Flow from Financing Activities:Net loss ($4,952) ($8,164) Proceeds on long‐term borrowings from related parties $5,000 $4,603Adjustments to reconcile net loss to net cash used in operating activities ‐ ‐ Payments on long‐term borrowings from related parties (2,582) (1,233)Depreciation and amortization 6,892 6,573 Payments on long‐term borrowings ‐ (2,420)Gain on disposal of fixed assets (17) (162) Proceeds from short‐term notes payable 767 408Bad debt expense 147 ‐ Payments on short‐term notes payable (394) (452)Gain on extinguishment of debt (116) ‐ Net cash provided by financing activities $2,791 $906Income from equity investment in joint venture (187) ‐Interest expense restructured to debt ‐ 3,258 Net increase (decrease) in cash and cash equivalents $3,269 ($583)
Changes in operating assets and liabilities, net of acquisitions: Cash and cash equivalents, beginning of period $1,247 $1,488Accounts receivable 1,823 (55) Cash and cash equivalents, end of period $4,516 $905Due to/(from) related parties 113 (2,148)Inventories 67 (28) Supplemental disclosure of cash flow information:Prepaid expenses and other current assets (1,184) (590) Interest paid $1,108 $1,121Accounts payable and accrued liabilities 1,117 (199) Income taxes paid ‐ ‐Other 18 45 Non‐cash investing and financing activities:Net cash provided by (used in) operating activities $3,721 ($1,470) Extinguishment of long‐term debt $7,000 ‐
Cash Flow from Investing Activities: Equipment acquired under capital leases ‐ 1,335Acquisition of fixed assets ($2,103) ($819)Proceeds on sales of fixed assets 125 800Acquisition of American Electric, net of cash received (1,876) ‐Acquisition of Diversenergy, net of cash received 611 ‐Net cash used in investing activities ($3,243) ($19)
Nine Months EndedSeptember 30,
Nine Months EndedSeptember 30,
2626
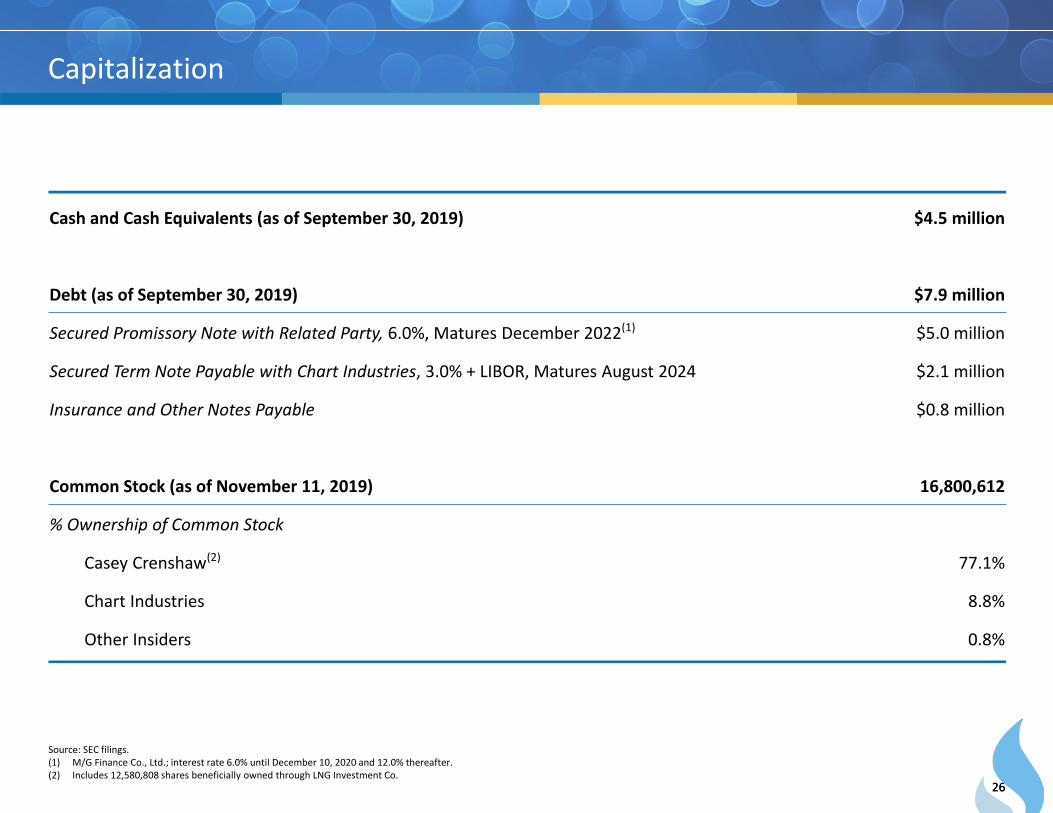
Capitalization
Source: SEC filings.(1) M/G Finance Co., Ltd.; interest rate 6.0% until December 10, 2020 and 12.0% thereafter.(2) Includes 12,580,808 shares beneficially owned through LNG Investment Co.
Cash and Cash Equivalents (as of September 30, 2019) $4.5 million
Debt (as of September 30, 2019) $7.9 million
Secured Promissory Note with Related Party, 6.0%, Matures December 2022(1) $5.0 million
Secured Term Note Payable with Chart Industries, 3.0% + LIBOR, Matures August 2024 $2.1 million
Insurance and Other Notes Payable $0.8 million
Common Stock (as of November 11, 2019) 16,800,612
% Ownership of Common Stock
Casey Crenshaw(2) 77.1%
Chart Industries 8.8%
Other Insiders 0.8%

Thank you. www.stabilisenergy.com