
Project Report on Sugar Industry
106
CHAPTER-1 SUGAR INDUSTRY AT GLANCE Page | 1
-
Upload
bahubali-khanapure -
Category
Documents
-
view
109 -
download
4
Transcript of Project Report on Sugar Industry

CHAPTER-1
SUGAR INDUSTRY
AT GLANCE
Page | 1

INDIAN SUGAR INDUSTRY
1.1) INTRODUCTION:
Sugar originated from the Arabic word "sharkara" and is derived from the sanskrit world "sharkara". Sugar is an important part of the daily diet and forming a class of edible substances which includes sucrose, lactose, and fructose. It provides the human body with requisite carbohydrates and is basically extracted from sugar cane and sugar beet. Found in fruits, honey, sorghum, sugar maple and in several other sources, it is the main ingredient of candy which is loved by children the world over. Yet, it has been blamed for causing tooth decay and excess consumption of sugar has been associated with a host of ailments like diabetes, obesity, weight gain, depression, joint pain, fatigue and insulin resistance and even cancer. Sugar is present in various forms in fruits, honey, maple syrup and other natural sources. It is extracted by an intricate process, whereby the pulp is extracted first and then, the remaining is used for producing the sugar. Sugar has wide variety of uses and is used for baking, sweets, alcoholic beverages, and even in the soap we use. Further, it is also used as a food preservative and in confectionery items.
1.2) History:
Sugar is said to have originated in India. During the Gupta dynasty in India, the extraction of sugar was clearly known to the Indians. Experts identify the Pacific region and certain parts of India like the North East as real locations where the sugar cultivation was practised. This was taken to the western hemisphere by the Arab traders who borrowed the techniques from India and subsequently, set up mills to commercially produce this highly useful agricultural product. The production of sugar spread to countries like Spain and the Portuguese took it to South America.
During the eighteenth century, sugar production became increasingly mechanized and sugar market went through a phase of great boom. New technology was developed as sugar became a very popular item and specialized procedures were developed for the large scale processing of sugar. At first, the sugar was used mainly for tea and then, went into the making of confectionery and chocolates. The Dutch took sugar to the Carribean Islands and today, this area is the largest source of sugar in the world. With the introduction of sugar plantations in the Carribean islands on a large scale, the price of sugar fell
Page | 2

substantially and in Britain, all classes of people took to sugar and it has become a part of their routine. Earlier, it was relegated to the upper echelons of society, it, then, became a common commodity and became sufficiently cheaper. Maximum consumption of sugar has been recorded from Belgium and the least consumption is from Ethopia with an amount of three kilos per year.
1.3) Sources of Sugar
Generally, sugar is produced from plants like sugarcane and sugar beet. The sugarcane plant is very thick with long grasses. A perennial crop, it is grown in the various tropical and subtropical areas. The stalks of the sugarcane is the exact location, from where the sweet sap is extracted. Sugar beet has the highest sugar content from among the beetroot family and this variety is specifically cultivated for high quality sugar production. In addition, sugar is produced from sweet sorghum, maple, honey, corn sugar, etc. Of a 180 countries of the world, around a 100 of them make sugar from the sugar beet and cane.
1.4) Types of sugar
1)Raw sugarsRaw sugars consist of varying shades of yellow to brown sugars and is
processed by boiling till it solidifies. From sugar beet juice, the raw beet sugars are extracted and are then used to fabricate white sugar. Raw sugars include demerera, muscovada and turbinado. These are available in crystalline and loaf forms, where the moulds are then allowed to dry up and the resulting product is called jaggery or gur. Raw sugar is not so popular in South America. Mill white sugar is produced by exposing the sugar to sulfur dioxide but it retains the coloured impurities.
2)Blanco direct Blanco direct is a white sugar used much more in India and Asia and is less purer than the white sugar. It undergoes the process of phosphation and is more devoid of impurities. White refined sugar, popular in the West, is processed by dissolving the raw sugar and purifying it with phosphoric acid or by filtration strategies. White sugar is available in granulated form. Granulated sugar includes coarse grained sugars such as sanding sugars, caster sugar and
Page | 3

superfine powdered sugar and they are divided on the basis of fineness of grades.
3)Brown sugars
Brown sugars are formed when sugars form fine crystals with high molasses content or from coating white refined sugar with a cane molasses syrup. Colour and taste becomes stronger with increasing molasses content . On being exposed to air, they tend to harden and proper handling of this. Natural sugars are found in their natural form and covers the most unrefined sugars and includes the fruits, grains and vegetables. The World Health Organization has approved the natural sugars as carbohydrates for unrestricted consumption purposes.
1.5) Manufacturing Process:
For sugarcane, the process of refining is carried out in following steps Pressing of sugarcane to extract the juice. Boiling the juice until it begins to thicken and sugar begins to crystallize.
Spinning the crystals in a centrifuge to remove the syrup, producing raw sugar.
Shipping the raw sugar to a refinery where it is washed and filtered to remove remaining non-sugar ingredients and color.
Crystallizing, drying and packaging the refined sugar.
1.6) World Sugar Scenario:
After two consecutive seasons of surplus between world sugar production and consumption, World Sugar economy is now facing a significant supply-demand imbalance. There will be fall in global sugar production. The world consumption of sugar is forecasted to grow by 1.73% to 167.446 mln tones. World production is expected to increase by 4.817 million tonnes, which is 8.404 million tonnes lower thanworld consumption.
World export availability is expected to rise due to projected growth in output in exporting countries. World export availability for season 2009-10 is
Page | 4

expected to be 51.964 million tonnes, as against 50.903 million tonnes in the previous season.
A significant production shortfall in India and China, as well as a further contraction of production in the EU, on the other hand and a continuing expansion of sugar output in Brazil, on the other hand are the four major supply features of Sugar season 2008-2009.
1.7) Indian Sugar Economy
The sugar industry is the largest agro-based industry and India is the Second largest producer of sugar in the world next only to Brazil. Sugar industry in India is headed for a rough patch during the current sugar year ending September 30, 2009. India plays a crucial role in the world's sugar output. Indian sugar industry is controlled by the Government. Starting from cane price to the price of sugar, everything is under the hands of the Government. The Statutory minimum Price (SMP) of sugarcane is fixed by the Central Government to support the cane farmers. However, states like U.P., Haryana and Uttarakhand are free to fix their own price known as State Advisory Price (SAP), which is usually higher than SMP.
1.8) India’s Production:
The Country’s sugar output touched a three year low. Sugar production in 2008-09 season is set to fall by 44% from the previous season. In sugar season 2008-09, production has declined to 147.50 lacs tones compared to production of 263.28 lac tonnes in the year, 2007-08. One major reason for this is the shrinkage in the sugarcane growing area in last couple of years due to delay in cane payment and confusion over the price, less area of ratoon in this season and poor monsoon in some parts of the country. The sugar industry is cyclical in nature. It is dependent upon monsoons for both its production and price realisation. Such a shortfall in sugar production has posed a serious threat to inventory on hand. Drop in cane output may lead to increase in cost of production for sugar companies and hit their profit margins in 2009.
1.9) Government Policies:
Rising prices of sugar has caused concern to the Government and it has intervened substantially to control the prices of the sugar, because it is one of the essential commodities. The Government brought in measures such as weekly quota for free sale, weekly reporting mechanism to monitor sugar dispatches and sale, liberalized raw sugar import under Advance Authorization
Page | 5

Scheme [with change in export obligation norm from ‘grain-to-grain’ to ‘tonne-to tonne’ basis] and finally the facility to import raw sugar without export obligation as well as import of white sugar upto 10 lakh tonnes by Government agencies, both at zero% customs duty. The Centre is also planning to bring back Gur under the Sugarcane (control) order, 1996 to ensure adequate cane supplies to sugar mills.
1.10) Demand & Supply of sugar in India: (In million tonnes)
Season 2008-2009
Season 2007-2008
1 Opening stock as on 1st October
80.00 92.00
2 Production during the season
147.50 263.28
3 Imports 25.00 ------4 Total availability 252.50 355.285 Domestic consumption* 220.00 225.726 Exports 2.00 49.567 Closing stock 30.50 80.00
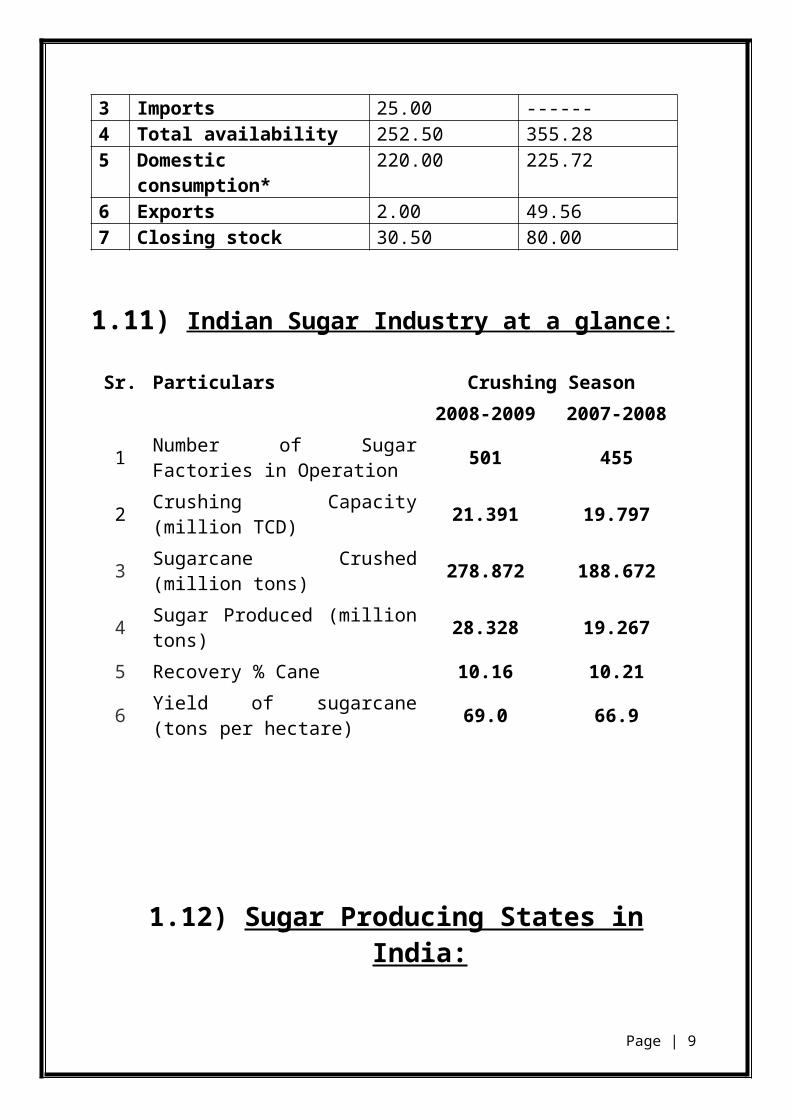
1.11) Indian Sugar Industry at a glance :
Sr. Particulars Crushing Season 2008-2009 2007-2008
1 Number of Sugar Factories in Operation 501 455
2 Crushing Capacity (million TCD) 21.391 19.7973 Sugarcane Crushed (million tons) 278.872 188.6724 Sugar Produced (million tons) 28.328 19.2675 Recovery % Cane 10.16 10.21
6 Yield of sugarcane (tons per hectare) 69.0 66.9
Page | 6

1.12) Sugar Producing States in India:
Page | 7

SWOT ANALYSIS:
SWOT analysis is a strategic planning method used to evaluate the
Strengths, Weaknesses, Opportunities, and Threats involved in a project or in a
business venture. It involves specifying the objective of the business venture or
project and identifying the internal and external factors that are favorable and
unfavorable to achieving that objective. The technique is credited to Albert
Humphrey, who led a convention at Stanford University in the 1960s and 1970s
using data from Fortune 500 companies.
STRENGTHS
Global prices to move up –an incremental positive
The demand is everlasting
Environmental conditions suitable for the growth of sugar cane
About 2.7% culitvable land is used for the cane production
The sugar industry also includes alcohol, gur an khandri which is mainly
for the domestic industry
WEAKNESS
Production to decline by 20-25% in fy09
Shift of the farmer from cane to paddy, wheat, pulses and oil seeds
The greater diversion of cane to un-organised sector
The ignorance in the residual sugar market
Some of the government policy that adhere the growth of the sugar
industry
Shortage in sugar cane supply
Obsolete technology
Page | 8
OPPRTUNITIES
Prices to rise by 25% in fy09 and more in fy10e
Higher margins , lower cyclicality driving shift towerds integration
The on going increase in demand year after year
The shift of brazil from white sugar to production of ethanol.
THREATS
Less rainfall in the highest sugarcane cultivating regions
Due to water shortage the shift of the farmers to multiple crops
cultivation
Due to government policies the selling of sugarcane by the farmers to
private sectors
Sugar production being more volatile than cane production
Due to rise in domestic consumtion the export is likely to fall
Page | 9

CHAPTERCHAPTER-2
DESIGN OF THE STUDY
Page | 10

2.1) TITLE OF THE STUDY:
“A study on working capital management and Ratio analysis” at VSL, Bellad-
Bagewadi.
2.2) STATEMENT OF THE PROBLEM:
The success and failure of any organization is very much influenced by
the past and previous year financial analysis and working capital management.
Vishwanath Sugars ltd is mainly engaged in production of sugar. The
leading Vishwanath Sugars ltd is private sector undertakings, which is located
in Bellad-Bagewadi. and have been striving hard on meeting the competition
from their competitors.
Any business enterprise needs funds for its operations, investors are the
major ‘Source’ of fund apart from owners funds. From the above statement it is
clearly state that they need to be strong in managing resources and increase
there receivables and decrease the liabilities, to be strong in managing working
capital thus it is this problem, which prompted the researcher to take up the
study on financial statement analysis and working capital management.
2.3) OBJECTIVE OF THE STUDY:
The study aims to achieve the following objectives:
To determine the progress of the company and to ascertain the future
prospects of the company.
To find out the level of activity or the operating efficiency of the
company.
To measure the liquidity or the short-term solvency and to indicate
whether the company will be able to meet the short-term obligations out
of its resources.
Page | 11
To ascertain the working capital requirement of the company.
To study the extent of influence of different factors on size of working
capital.
2.4) SCOPE OF THE STUDY:
This study has a wider scope to cover components and determinants of
capital, sources and types of working capital, components of capital
management such as cash, receivables and inventory. Financial analysis which
covers using different tools of ratios.
2.5) METHODOLOGY:
No study is completed until a proper method is adopted. The level of any
systematic research depends upon collection of data by keenly observing the
existing conditions, classification and interpretation of data and at the end
formation and generalization and conclusion.
The research design should be such that it maximizes reliability of the
evidence collected. The data required for the preparation of financial statement
analysis and working capital management was collected through Primary and
Secondary data.
Primary Data :
Primary data required for the study is collected from the Vishwanath Sugars ltd
Head office.
Secondary Data :
This includes information relating too
Annual reports.
Company brouchers, magazines, periodical reports.
Page | 12

Balance sheets, profit and loss accounts.
Published text books.
Internet.
2.6) TOOLS FOR COLLECTING DATA:
After carrying out analysis of financial statements, balance sheet and
profit and loss A/c, to elicit additional information to supplement the analysis,
discussions were held with the concerned executives of the company. For this
purpose a schedule was prepared for collection of data which is presented in the
appendices.
2.7) PLAN OF ANALYSIS:
Information from financial statements was arranged as per the objectives
of the study. The data collection have been analyses by the use of statistical
tools and techniques such as percentages, average where ever necessary the data
have been presented diagrammatically using graph charts, tables etc.
REFRENCE PERIOD:
For the company under study, financial year is from March 2008-2009,
March 2007-2008, and March 2006-2007.
REVIEW OF LITERATURE:
Annual reports of Vishwanath Sugars ltd from 2006-2009.
Financial management text books:
Prasanna Chandra.
I. M. Pandey.
Interviewing the finance manager of Vishwanath Sugars ltd.
Page | 13

2.8) OPERATIONAL DEFINATIONS OF CONCEPTS:
Current Assets: Includes Inventories, Sundry debtors, Cash and Bank,
Loans and advances and all those assets that could be converted into cash
within one year.
Current Liabilities: It includes Sundry Creditors, Advances received
from Customers, Provisions and any other liability that fall due for
payment within one year.
Quick Assets: Current assets (less) Inventories.
Liquid Liability: Current liability (less) Bank overdraft etc.
Net working Capital: Current assets (less) Current liabilities.
Liquidity: Liquidity is used in limited sense study to mean short term
debt repaying capacity of the enterprises. In other words, it is taken as the
ability of the firm to meet the claims of suppliers of short-term capital
Profitability: Refers to the ability of the company in making the profits
in relation to capital employed, sales and the share holder’s funds.
Cash: Cash is the money, which the firm can disburse immediately
without any restrictions.
Inventory: Inventory refers to the stock of goods in the company.
Receivables: Receivable represents the amount due from its customers to
whom the company has extended the credit.
Net sales: It is the gross sales less returns and allowances freight out and
cash discounts allowed.
Credit sales: It means gross credit sales less sales returns.
LIMITATIONS OF THE STUDY:
The figure and facts claimed in the annual reports and other forms are
assumed to be true.
Page | 14

The authenticity of conclusions drawn is only based on the observations
made by the researcher only.
It is data based on the data supplied by the company personnel.
The project is just a brief study due to lack of comprehensive and
practical knowledge.
Lack of sufficient time to get required information.
The out come of the study is based on the data given in the financial
statements so that there is always difference in the actual and the
calculated values.
Page | 15

CHAPTER-3
INTRODUCTION
TO FINANCE
Page | 16

INTRODUCTION TO FINANCE
Finance has been called “The science of money”. In studies the principles
and methods of obtaining control of money from those have saved it and the
administration of it by those in to whose control it passes.
Finance may be said to be circulatory system of the economic body,
making possible needed co-operation between the many units of activity. In an
organization composed of myriad separate enterprises, each working for its own
end but simultaneously contributing to the system as whole, some forces is
necessary to bring about direction and co-ordination. Something must be direct
the floe of economic activity and facilitate its smooth operation. Finance is the
agent that produces this result.
Finance is the business activity which is concerned with the acquisition
and conversation of capital funds in meeting financial needs and overall
objective of a business enterprise.
3.1) SCOPE AND IMPORTANCE OF FINANCE
The modern industrial or service firm must conduct its business in a
rapidly changing and highly competitive environment. A premium is placed on
the ability to react quickly and correctly to constantly changing market
conditions. Financial management is most totally independent area. It draws
heavily on related discipline and fields of study namely Economics,
Accounting, Marketing, Production and Quantitative methods. Management
must be concerned with all the aspects of firm’s operation including production
of goods and delivery of services, sales and marketing activities and supporting
functions such as Personnel training and data processing. To handle these
responsibilities, most firms make extensive use of financial data and reports.
Page | 17

The scope financial management involves shaping the fortunes of the
enterprise as it involves the most vital decision of allocation of capital. A broad
and farsighted outlook has to be taken into consideration to ensure the funds of
the enterprise are utilized in the most efficient manner. Financial decisions have
far reaching consequences for the firm because they influence the size,
profitability, growth, risk and survival of the firms.
Financial statements are prepared for decision making. They play
dominant role in setting the framework of managerial decisions. But the
information provided in the financial statements not an ending itself as no
meaningful conclusions can be drawn from these statements is of immense use
in making decisions through analysis and interpretation of financial statements.
Financial analysis is the process of identifying relationship between the items of
Balance Sheet and the profit & loss statements, such as Schedule of changes in
Working capital, cost volume profit analysis and ratio analysis. It is the process
of establishing and interpreting various ratios. It is with the help of ratios that
the financial statements can be analyzed more clearly and decision made from
such analysis.
3.2) WORKING CAPITAL MANAGEMENT
Introduction:
The management of working capital is an important and time consuming
aspect of management finance. Sufficient working capital must be provided in
order to take care of the normal process of purchasing raw materials and
supplies, turning out finished products, selling the products, waiting for
payments to be made. If the original estimates of working capital are
insufficient, some emergency measures must be restored to or the business will
come to dead stop. Inadequate levels of working capital can results in serious
financial difficulties, and even bankruptcy; exclusive levels are likely to reduce
Page | 18

corporate profitability and ultimately cause the firm’s effectiveness and market
value to decline.
Meaning of Working Capital:
In accounting working capital is the difference between the inflow and
outflow of funds. In other words, it is the net cash inflow. It is defined as the
excess of current assets over current liabilities and provision.
Definition of Working Capital:
“Working Capital is the amount of funds necessary to cover the cost of
operating the enterprises.”
Concepts of Working Capital:
There are two concepts of working capital:
Balance Sheet concept.
Operating Cycle or Circular flow concept.
(A) Balance Sheet Concept:
There are two interpretation of working capital under the balance sheet
concept:
1. Gross working capital.
2. Net working capital.
1. Gross working capital:
In the broad sense, the term working capital refers to gross working capital and
represents the amount of funds invested in current assets. Thus, the gross
working capital invested in total current assets of the enterprise. The gross
working capital concept is financial or going concern concept.
Page | 19

2. Net working capital:
The term net working capital is the excess of current assets over current
liabilities. Net working capital is an accounting concept of working capital.
Net working capital= Current assets – Current liabilities
Current assets include:
Cash in hand.
Cash in bank.
Sundry debtors (less provision for bad debts).
Short-term loans and advances.
Inventories of stocks as:
Raw materials.
Work-in-progress.
Stores and spares.
Finished goods.
Temporary investments of surplus funds.
Prepaid expenses.
Accrued incomes.
Current liabilities include:
Bills payable.
Sundry creditors or accounts payable.
Accrued or outstanding expenses.
Short-term loans, advances and deposits.
Dividends payable.
Bank overdraft.
Provision for taxation, if it does not amount to appropriation of profits.
Page | 20

(B) Operating cycle or circular flow concept:
The circular flow of concept of working capital is based upon this operation or
working capital cycle of a firm. The cycle starts with the purchase of raw
material and other resources and ends with the realization of cash from sale of
finished goods. The speed/time duration required to complete one cycle
determination the requirements of working capital-longer the period of cycle
determines the requirements of working capital.
Importance or advantage of adequate working capital:
Working capital is the life blood and nerve center of a business. Working
capital is very essential to maintain the smooth running of a business. No
business can run successfully without an adequate amount of working capital.
Some of the importance or advantage of adequate working capital are as
follows:
Page | 21

Solvency of the business: Adequate working capital helps in maintaining
solvency of the business by providing uninterrupted flow of production.
Good will: Sufficient working capital enables a business concern to make
prompt payment and hence helps in creating and maintaining good will.
Easy loans: A concern having adequate working capital, high solvency
and good credit standing can arrange loans from bank and other easy and
favorable terms.
Cash discounts: Adequate working capital also enables a concern to
avail cash discounts on the purchases and hence it reduces costs.
Regular supply of raw materials: Sufficient working capital ensures
regular supply of raw materials and continuous production.
Regular payment of salaries: A company which has ample working
capital can make regular payment of salaries, wages and other day to day
commitments which rises the morale of its employees, increase there
efficiency, reduces wastages and costs and enhances production and
profits.
Exploitation of favorable market conditions: Only concerns with
adequate working capital can exploit favorable market conditions such as
purchasing its requirements in bulk when the prices are lower and by
holding its inventories for higher prices.
Ability to face crises: Adequate working capital enables a concern to
face business crises in emergencies such as depression because during
such periods, generally there is much pressures on working capital.
Quick and regular return on investment: Every investor wants a quick
and regular return on his investments. Sufficiency of working capital
enables a concern to pay quick and regular dividends to its investors as
there may not be much pressure to plough back profits. This gains the
confidence of its investors and creates a favorable market to rise
additional funds in the future.
Page | 22

High morale: Adequacy working capital creates an environment of
security, confidence; high morale creates efficiency in a business.
Importance of Excess or Inadequate working capital:
Every business concern should have adequate working capital to run its
business operations. Both excess as well as short working capital positions are
bad for any business.
Disadvantages of redundant or excessive working capital:
Excessive working capital mans idle funds which earn no profits for the
business and hence the business cannot earn a proper rate of return on its
investments.
When there is redundant working capital, it may lead to unnecessary
purchasing and accumulation of inventories causing more chances of
theft, wastes and losses.
Excessive working capital implies excessive debtors and defective credit
policy which may cause higher incidence of bad debts.
It may result into overall inefficiency in the organization.
When there is excessive working capital, relations with the banks and
other financial institutions may not be maintained.
Due to low rate of return on investments the value of shares may also fall.
The redundant working capital gives rise to speculative transactions.
Disadvantages or dangers of inadequate working capital:
A concern which has inadequate working capital cannot pay its short –
term liabilities in time. Thus it will lose its reputation and shall not be
able to get good credit facilities.
It cannot buy its requirement in bulk and cannot avail discounts, etc.
Page | 23

It becomes difficult for the firm to exploit favorable market conditions
and undertake profitable projects due to lack of working capital.
The firm cannot pay day-to-day expenses of its operations and it creates
inefficiencies, increases costs and reduces the profits of business.
It becomes impossible to utilize efficiently the fixed assets due to non
availability of liquid funds.
The rate of return on investments also falls with the shortage of working
capital.
Need or Objectives of working capital:
The need for working capital to meet the operation needs of a firm need
not be over emphasized. Every business needs some amount of working capital.
The need of working capital arises due to the time gap between production and
realization of cash from sales.
Working capital is needed for following purpose, they are:
For the purchase of raw materials, components and spares.
To pay wages and salaries.
To incur day-to-day expenses and over heads costs such as fuel, power
and office expenses, etc.
To meet the selling costs as packing, advertising, etc.
To provide credit facilities to the customers.
To maintain the inventories of raw materials, work-in-progress, stores
and spares and finished stock.
The amount of working capital needed goes on increasing with the growth
and expansion of business till it attains maturity. At maturity the amount of
working capital needed is called normal working capital.
Page | 24

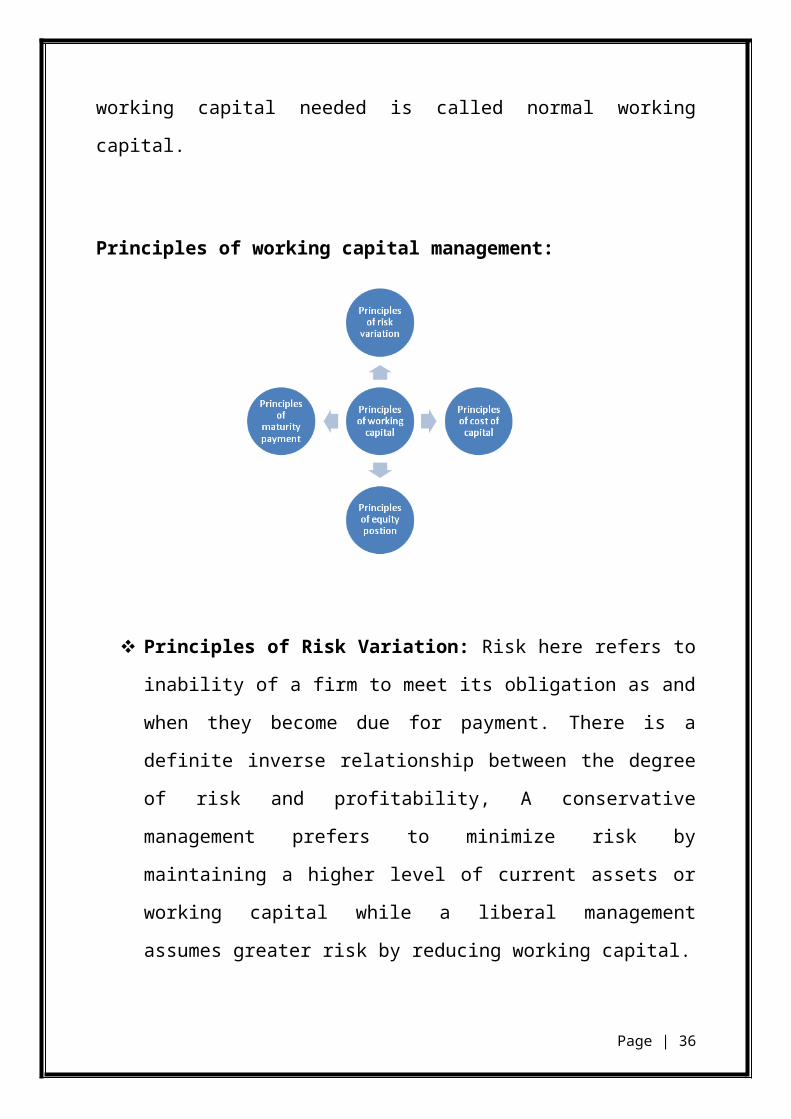
Principles of working capital management:
Principles of Risk Variation: Risk here refers to inability of a firm to
meet its obligation as and when they become due for payment. There is a
definite inverse relationship between the degree of risk and profitability,
A conservative management prefers to minimize risk by maintaining a
higher level of current assets or working capital while a liberal
management assumes greater risk by reducing working capital.
Principle of Cost of Capital: The various sources of raising working
capital finance have different cost of capital and the degree of risk
involved. Generally, higher the risks lower is the cost and lower the risk
higher is cost. A sound working capital management should always try to
achieve a proper balance between these two.
Principle of Equity Position: This principle is concerned with planning
the total investment in current assets. According to this principle, the
amount of working capital invested in each component should be
adequately justified by firm’s equity position.
Principle of Maturity of Payment: This principle is concerned with
planning the sources of finance for working capital. According to this a
Page | 25

firm should make every effort to relate maturities of payment to its flow
of internally generated funds. Maturity pattern of various current
obligations is an important factor in risk assumptions and risk
assessments. Generally, shorter the maturity schedule of current liabilities
in relation to expected cash inflows, the greater the inability to meet its
obligation in time.
COMPONENTS OF WORKING CAPITAL:
There are three important components in working capital, they are:
Cash management.
Receivable management.
Inventory management.
Cash Management:
Cash management has assumed importance because it is the most significant of
all the current assets. It is required to meet business obligations and it is
unproductive when not used.
Cash management deals with the following:
Cash inflows and outflows.
Cash flows within the firm.
Cash balance held by the firm at a point of time by financing deficit or
investing surplus cash.
Receivable management:
Receivable management is the process of making decisions relating to
investment in trade debtors. We have already stated that certain investment
decisions are necessary to increase the sales and the profits of a firm. But at the
same time investment in this asset involves cost considerations also. Further,
Page | 26

there is always a risk of bad debts too. Thus, the objective of receivables
management is to take a sound decision as regards investment in debtors.
Dimension of receivable management are:
Forming of credit policy.
Executing the credit policy.
Formulating and executing collection policy.
Inventory management:
The investment in inventory is very high in most of the undertakings
engaged in Manu fracturing, whole-sale and retail trade. The amount of
investment is sometimes more in inventory than in other assets. It is necessary
for every management to give proper attention to inventory than in other assets.
It is necessary for every management to give proper attention to inventory
management. A proper planning of purchasing, handling, storing and
accounting should form a part of inventory management. An efficient system of
inventory management will determine what to purchase, how much to purchase,
from where to purchase, where to store etc.
3.3) RATIO ANALYSISA ratio is a simple arithmetical expression of the relationship of one
number to another. It may be defined as the indicated quotient to two
mathematical expressions. According to Accountants hand book by Knell and
Bedford, a ratio “Is an expression of the quantitative relationship between
two numbers”
Ratio analysis is a process of comparison of one figure against another,
which make a ratio, and the appraisal of the ratios to make proper analysis about
the strengths and weakness of the firm operations. The calculations of ratios are
Page | 27

a relatively easy and simple task but the proper analysis and interpretation of the
ratios can be made only by the skilled analyst. While interpreting the financial
information, the analyst has to be careful in limitations imposed by the
accounting concepts and information, the analyst has to be careful in limitations
imposed by the accounting concepts and methods of valuation. Information of
non-financial nature will also be taken into consideration before a meaningful
analysis is made.
Significance of Ratio Analysis:
The ratio analysis is one of the most powerful tools of financial analysis. It is
used as a device to analysis and interprets the financial health of the enterprise.
The use of ratios is not confined to financial managers only. There are different
parties interested in the ratio analysis for knowing the financial position of a
firm for different purposes of a firm for different purposes. The suppliers of
goods on credit, banks, financial institutions, investors, shareholders and
management all make use of ratio analysis as a tool in evaluating the financial
positions and performance of a firm for granting credit, providing loans or
making investment in the firm. With use of ratio analysis, one can measure the
financial condition of a firm and one can point whether the condition is strong,
good, questionable or poor.
Helps in financial forecasting and planning: Ratio analysis is of much
help in financial forecasting and planning. Planning is looking ahead and
the ratio calculated for a number of year work as guide for the future.
Meaningful conclusions can be drawn for future from these ratios.
Helps in control: Ratio analysis even helps in making effective control
of business standard ratio can be based upon Performa financial statement
variances or deviation, if any can be found by comparing the actual with
the standards to take a corrective action at the right time. The weakness or
Page | 28

otherwise , if any come to the knowledge of the management which helps
in the control of business.
Utility to shareholder/investors: Investors in the company will like to
assess the financial position of the concern where he is going to invest.
His first interest will be the security of his investment and then a return in
the form of dividend or interest. For purpose he will try to assess the
value of fixed assets and the loans raised against them. The investor will
feel satisfied only if the concern has sufficient amount of assets long-term
solvency ratios will help him in assessing the financial position of the
concern. Profitability ratios, on the other hand will be useful to determine
the profitability position.
Utility to creditors: The creditors or suppliers extend short-term credit to
the concern. They are interested to know whether financial positions of
the concern enable their payments at a specified time or not. The concern
pays short term creditors out of its current assets. If the current assets are
sufficient to meet the current liabilities then the creditors will not hesitate
in extending credit facilities.
ADVANTAGES/USES OF RATIO ANALYSIS:
Ratio analysis simplifies the understanding of financial statements.
Ratio analysis is an instrument for diagnosing the financial
health/condition of a business that is through the computation comparison
and interpretation of accounting ratios.
Ratio analysis is an invaluable aid to the management in the efficient
discharge of its basic functions of forecasting, planning, communications
etc. By an analytical study of the past performance of the business, trends
in cost, sales, profits and other related facts can be understood and based
on such trends.
Future events can be forecasted.
Page | 29

Ratios are helpful in establishing standard costing system and budgetary
control.
Ratio analysis is not only useful to management but also to outsiders like
creditors and investors.
LIMITATIONS OF RATIO ANALYSIS:
Ratio analysis is very useful in many aspects. However, its importance should
not be exaggerated because it has number of limitations which are as follows:
Ratios computed from historical dated are used for predicting and
projecting the likely events in the future. Such ratios may provide a
glimpse of the firms past performance but the forecast for the future may
not be correct.
Ratios are tools of quantitative analysis only. As such only quantitative
aspects are taken into account in ratios analysis, thereby ignoring
qualitative factors which generally where the conclusions are drawn.
A ratio is a hypersensitive; a new entry of a transaction can change its magnitude drastically.
3.4) Categories of Ratios
The ratio analysis is made under six broad categories as follows:
Long-term Solvency Ratios.
Shot-term Solvency Ratios.
Profitability Ratios.
Activity Ratios.
Operating Ratios.
Long-Term Solvency Ratios:
Page | 30

The long term liability financial stability of the firm may be considered as
dependent upon its ability to meet all its liabilities, including those not currently
payable. The ratios which are important in measuring the long-term solvency
are as follows:
Debt-Equity Ratio.
Shareholders equity ratio.
Debt to net worth ratio.
Capital gearing ratio.
Fixed assets to long-term funds ratio.
Proprietary ratio.
Debt service coverage ratio.
Dividend cover.
Interest cover.
1. Debt-Equity ratio: Capital is derived from two sources: share and
loans. It is quite likely for only shares to be issued when the
company is formed, but loans are invariably raised at some later
date. There are numerous reasons for issuing loan capital. For
instance, the owners might want to increase their investment but
avoid the risk which attaches to share capital, and they can do this
by making secured loan.
Debt Equity Ratio = Long Term Debt Share Holders Fund
This ratio indicates the relationship between loan funds and net
worth of the company, which is known as gearing. If the proportion
of debt to equity is low, a company is said to be low-geared and
vice versa. A debt equity ratio of 2:1 is the norm accepted by
financial institutions for financing of projects. The higher the
gearing, the more volatile the return to the shareholders.
2. Shareholders equity ratio: Share holders Equity
Page | 31

Total assets (Tangible)
It is assumed that the larger the proportion of the shareholders
equity, the stronger is the financial position of the firm. This
ratio will supplement the debt equity ratio. In this ratio the
relationship is established between the shareholders funds and the
total assets. This ratio indicates the degree to which unsecured
creditors are protected against the loss in the event of liquidation.
3. Debt to net worth ratio: The ratio compares long- term debt to the
net worth of the firm i.e., the capital and free reserves less
intangible assets. This ratio is finer than the debt-equity ratio and
includes capital which is invested in fictitious assets like deferred
expenditure and carried forward losses. This ratio would be more
interest to the contributors of long term finance of the firm.
Debt to Net worth Ratio = Long term debt
Net worth
4. Capital gearing ratio: It is the proportion of fixed interest bearing
funds to equity shareholders funds. The fixed interest bearing funds
include debenture, long term loans and preference share capital.
The equity shareholder funds include equity share capital, reserves
and surplus. Capital gearing ratio indicates the degree of
vulnerability of earnings available for equity shareholders.
Capital Gearing Ratio = Fixed Interest bearing funds
Equity share holders fund
5. Fixed assets to long term funds ratio: This ratio indicates the
proportion of long term funds deployed in fixed assets. Fixed
assets represent the gross fixed assets less depreciation
provided on this till date of calculation. Long term funds
Page | 32

include share capital, reserves and surplus and long term
loans. The higher the ratio indicates the safer the funds
available in case of liquidation. It also indicates the
proportion of long term funds that is invested in working
capital.
Fixed Assets to Long Term Funds Ratio = Fixed Assets
Long-Term funds
6. Proprietary Ratio: It expresses the relationship between net worth
and total assets.
Net worth = equity share capital+ preference share capital+
reserves- fictitious assets.
Total assets= fixed assets+ current assets
Reserves embarked specifically for a particular purpose should not
be included in calculation of net worth. A high proprietary ratio is
indicative of strong financial position of the business. The higher
the ratio the better it is
Proprietary Ratio = Net Worth
Total Assets
7. Interest cover: The interest coverage ratio shows how many times
interest charges are covered by funds that are available for payment
of interest. An interest cover of 2:1 is considered reasonable by
financial institutions. A very high ratio indicates that the firm is
conservative in using debt and a very low ratio indicates excessive
use of debt.
Interest Cover = Profit before Interest, Depreciation and Tax
Interest
Page | 33

8. Dividend cover: This ratio indicates the number of times the
dividends are covered by net profits. This highlights the amount
retained by a company for financing of future options.
Dividend Cover = Net Profit after Tax
Dividend
Short- Term solvency Ratios:
The short-term solvency ratios, which measure the liquidity of the firm and its
ability to meet its maturing short-term obligations. Liquidity is defined as the
ability to realize values in money the most of liquid assets. It refers to the ability
to pay in cash, the obligations that are due.
The corporate liquidity has two dimensions viz, quantitative and qualitative
concepts. The quantitative concept includes the quantum, structure and
utilization of liquid assets and in the qualitative concept it is the ability to meet
all present and potential demands on cash from any source in a manner that
minimizes cost and maximizes the value of the firm. Thus, corporate liquidity is
a vital factor in business-excess liquidity, though a guarantor of solvency would
reflect lower profitability, deterioration in managerial efficiency, increased
speculation and unjustified expansion, extension of too liberal credit and
dividend policies.
The important ratios in measuring short term solvency are:
Current ratio.
Quick ratio or liquid ratio.
1. Current ratio: This ratio measures the solvency of the company in the
short-term. Current assets are those assets which can be converted into
cash within a year. Current liabilities and provisions are those liabilities
that are payable within a year. A current ratio of 2:1 indicates a highly
solvent position. A current ratio of 1.33:1 is considered by banks as the
Page | 34

minimum acceptable level for providing working capital finance. A high
current ratio may be due to the pilling up of inventory, inefficiency in
collection of debtors, high balances in cash and bank accounts with out
the proper investment.
Current ratio = Current Assets, Loans & Advances
Current liability & provision
2. Quick ratio or liquid ratio: This ratio is used as measure of the
company’s ability to meet its current obligations. Since bank overdraft is
secured by the inventories, the other current assets must be sufficient to
meet other current liabilities. A quick ratio of 1:1 indicates highly solvent
position. This ratio is called acid test ratio. This ratio serves as a
supplement to the current ratio in analyzing liquidity.
Quick Ratio or Liquidity Ratio = Current Assets, Loans & Advances – Inventories
Current Liability & provision – Bank overdraft
Profitability Ratios:
The purpose of study and analysis of profitability ratios are to help assessing the
adequacy of profits earned by the company and also to discover whether
profitability of the firm is the net result of a large number of policies and
decisions. The profitability ratios show the combined effects of liquidity, asset
management and debt management on operating results. Profitability ratios are
measured with reference to sales, capital employed, total assets employed,
shareholders funds etc. The major profitability ratios are as follows:
Return on capital employed or return on investment (ROCE or ROI).
Earnings per share (EPS).
Cash earnings per share (Cash EPS).
Gross profit margin.
Net profit margin.
Page | 35
Cash profit margin.
Return on assets.
Return on Net worth (Return on shareholders funds).
1. Return on capital employed: The strategic aim of business enterprises is
to earn a return on capital. If in any particular case, the return on the long-
run is not satisfactory then the deficiency should be corrected or the
activity be abandoned for a more favorable one. Measuring the historical
performance of an investment centre calls for a comparison of the profits
that has been earned with capital employed.
Return on Capital Employed = Net Profit 100
Capital Employed
2. Earnings per share (EPS): The objective of financial
management is wealth or value maximization of a corporate entity.
The value is maximized when the market price of equity shares is
maximized. The use of the objective of wealth maximization or net
present value maximization has been advocated as an appropriate
and operationally feasible criterion to choose among the
alternatives financial actions. A higher EPS means better capital
productivity.
Earning per Share = Net Profit after tax and Preference Dividend
No of Equity Shares
3. Gross profit margin: The ratio measures the gross profit margin on the
total net sales made by the company. The gross profit represents the
excess of sales proceeds during the period under observation over their
costs, before taking into account administration, selling and distribution
and financing charges. The ratio measures the efficiency of the company
operations and this can be compared with the previous year’s results to
Page | 36

ascertain the efficiency partners with respect to the previous years. The
gross profit margin may be compared with that of competitors in the
industry to assess the operational performance relative to the other
players in the industry.
Gross Profit Margins = Sales – Cost of Goods Sold 100
Sales
4. Net profit margin: The ratio is designed to focus attention on the net
profit margin arising from business operations before interest and tax is
deducted. The convention is to express profit after tax and interest as a
percentage of sales. A draw back is that the percentage which a result
varies depending on the sources of employed to finance business activity,
interest is charged above the line while dividends are deducted below the
line. It is for this reason that the net profit earnings before interest and tax
(EBIT) are used. It is to be observed that majority of the costs debited to
the profit and loss account are fixed in nature and any increase in sales
will cause the cost per unit to decline because of the spread of same fixed
cost over the increased number of units sold.
Net Profit Margin = Net Profit before interest and Tax 100
Sales
5. Cash profit ratio: where cash profit= net profit + depreciation
Cash profit ratio measures the cash generation in the business as a result
of the operations expressed in terms of sales. The cash profit ratio is more
reliable indicator of performance where there are sharp fluctuations in the
profit before tax and net profit from year to year owing in depreciation
charged. It also facilitates inter-firm comparison of performance since
different methods of depreciation may be adopted by different companies.
Cash Profit Ratio = Cash Profit 100
Page | 37

Sales
6. Return on assets: The profitability of the firm is measured by
establishing relation of net profits with the total assets of the organization.
This ratio indicates the efficiency of utilization of assets in generating the
revenue.
Return on Assets = Net Profit after Tax 100
Total Assets
Activity ratios or Turnover ratios:
Activity ratios measure how effectively the firm employs its resources. These
ratios are also called turnover ratios which involve comparison between the
level of sales and investments in various accounts inventories, debtors, fixed
assets, etc, activity ratios are used to measure the speed with which various
accounts are converted into sales or cash. The following activity ratios are
calculated for analysis:
Inventory ratio: A considerable amount of a company’s capital may be tied up
in the financing of raw materials, work-in-progress and finished goods. It is
important to ensure that the level of stocks is kept as low as possible, consistent
with the need to fulfill customer’s order in time.
Inventory turnover ratio: Cost of goods sold
Average inventory
Average inventory: opening stock+ closing stock
2
Inventory ratio: The level of inventory in a company may be assessed by the
use of the inventory ratio, which measures how much has been tied up in
Page | 38

inventory. The inventory turnover ratio has decreased from past, it means that
either inventory is growing or sales are dropping. In addition to that, if a firm
has a turnover that is slower than for its industry, then there may be obsolete
goods on hand, or inventory stocks may be high. Low turnover has impact on
the liquidity of the business.
Inventory ratio: Inventory 100
Current assets
Debtors:
There are three main debtors ratios are as follows :
1. Debtor turnover ratio: Debtor turnover, which measures whether the
amount of resources tied up in debtors, is reasonable and whether the
company has been efficient in converting debtors into cash.
Debtors turnover ratio: Credit sales
Average debtors.
2. Debtors collection period: Average collection period, which measures
how long it take to collect amounts from debtors. The actual collection
period can be compared with the stated credit terms of the company. If it
is longer than those terms, then this indicates some insufficiency in the
procedures of collecting debts.
Debtors collection period: Average debtors X 365
Credit sales
3. Bad debts to sales ratio: This ratio indicates the efficiency of the credit
control procedures of the company. Its level will depend on the type of
the business. Mail order companies have to accept a fairly high level of
bad debts, while retailing organizations should maintain very low levels
or, if they do not allow credit accounts, none at all. The actual ratio is
compared with the target or norm to decide whether or not acceptable
Page | 39

Bad debts to sales ratio: Bad debts
Sales
4. Creditors payment period: In general the longer the credit period
achieved the better, because delays in payment mean that the operation of
the company are being financed interest free by suppliers of funds. But
there will be a point beyond which delays in payment will damage
relationships with the suppliers which, if they are operating in a sellers
market, may harm the company. If too long period is taken to pay
creditors, the credit rating of the company may suffer, there by making it
more difficult to obtain suppliers in the future.
Creditor payment period: Average creditors X 365
Purchases
Operating ratios:
The ratio of all operating expenses (i.e. materials, labour, factory overheads,
administration, and selling expenses) to sales is the operating ratio. A
comparison of the operating ratio would indicate whether the cost content is
high or low in the figure of sales. If the annual comparison shows that the sales
has increased the management would be naturally interested and concerned to
know as to which element of the cost has gone up.
1) Material cost ratio. 2) Administrative expenses ratio.
3) Labour cost ratio. 4) Selling and distribution expenses ratio.
5) Factory overhead ratio.
CHAPTER-4
Page | 40

COMPANY PROFILE
VISHWANATH SUGARS LIMITED
BELLAD-BAGEWADI
4.1) PROFILE OF THE COMPANY
Vishwanath Sugars Ltd., was a pioneer in the exporting of power to other
industry. Situated in state of Karnataka, it combines for technology and the
latest. Mechanization and compliments with a two years experience result, High
quality sugar.
Page | 41

Alongside, the factory waste namely molasses is used for organo
Chemicals industrial alcogol/rectified spirit is manufacture with the sugar waste.
This VSL company is also looking towards venturing into plant a new plant for
production.
4.2) History:
Vishwanath sugars ltd entered the sugar industry in the late nineties.
Based in the Indian State of Karnataka, it began operations by setting up one
sugar factory, of which used a scientific method of cultivation. Despite
increasing emphasis on traditional cultivation methods, Vishwanath sugars ltd
was among the few to introduce modernity to this industry.
Sugar factories in Maharashtra were being victimized through state
policies Private farms were being nationalized and the co-operative movement
quickened the pace of ultimate closure of these farms. This was unfortunate
because the yields from these belts of sugarcane were among the best in the
world. The yield of cane was 64 ton per acre, recovery of sugar was 11.5% per
acre and yield of sugar was 7.36 tons per acre. Realizing that it could no longer
work towards its full potential, the opened Vishwanath Sugars Ltd at Bellad
Bagewadi in Karnataka State.
In 2002, the foundation stone at the factory of Vishwanath sugars ltd was
laid by then Governor of Karnataka. Due to the prevalent India Pakistan war at
that time.
The factory was erection on a war footing and commissioned in a record
time of less than ten months. Production started in 2005.Today advanced
technology and a high level of Mechanization has made Vishwanath sugars ltd
one of India’s largest sugar producers. This Vishwanath sugars ltd company has
one of the highest average recovery rates in industry.
Page | 42

4.3) ABOUT THE FOUNDER
A Light has gone out of our lives but has left behind many sweet
memories. Born with humble feelings, Shri Umesh V. Katti learnt that Honesty
and hard work lead to success. Very early in his life, through the example and
teachings of great men like swami Vivekanand, Mahatma Gandhi and swami
Dayanand Saraswati, he assimilated in his life the maxim that “There is no
religion greater than man”.
Shri Umesh V. Katti started his carrier as agriculturist. He use to grow
sugar cane as a main crop in his filed. In later days Shri Umesh V. Katti has
acquired great name and reputation from his achievements in agriculture, for his
insight and analytical skills and for his deep understanding of people problems.
A popular person Shri Umesh V. Katti made his mark for his outspoken and
fortnight views and stood for the elections of MLA and was also elected as a
MLA and after that he was selected another three times as a MLA and for the
forth time he became a Sugar minister and was Public Work Department and
cabinet minister. He was also Director of Belgaum District Co-operative Bank.
And at present he is the Horticulture and Prison Minister in cabinet.
Then he started his carrier as a Business man as a industrialist, when we
studied about his we would he was a visionary person and a hard worker and he
is a self made man and a good decision maker.
When we asked his employs their opinion was that “He is a kind hearted
Person and also a well knowledge person in the field of sugar industry and
distillery industry technical field.” When we asked for some more details they
told being a politician he is also a great industrialist. They also told that my
establishing this industry in rural place he is feeding thousand of family’s live
hoods. Being a agriculturist he understands the problems of farmers and poor
people and helped to solved the problems. When we asked the people of the
villages.
Page | 43

Shri Umesh V. Katti vision and foresight have led to this huge growth of
industry in Karnataka. Due to his belief in Humanity and faith in Almighty he
could transform his dream into reality.
4.4) Location: Vishwanath sugars ltd is located at Bellad Bagewadi small village in the
Belgaum district of Karnataka Bellad Bagewadi lies in presented between two
rivers, Ghatprabha & Krishna. It falls under the command area of Hidkal dam,
on the Ghatprabha Left Bank canal, at the confluence of four townships
(talukas) , Mudhol, Jamakhandi, Raibag and Gokak.
4.5) COMPANY VISION AND MISSIONS :
VSL will continue to expand its operations by expanding production into
new markets and applications. Growth will also come from value added
diversification derived from the group’s strengths in products and process.
The quality of the products and services delivered by VSL will always
strive to exceed customer expectations.
VSL always has and will continue to use renewable resources in its
products. We believe that this is an important need for sustainable development.
VSL has been and always is aware of its social commitment to the
community that it serves. We believe that we have a responsibility and
obligation to return to society what we earn from it.
VSL has a vision to adopt the most modern technologies and equipments
to improve the production of the company and to create more no of
employment.
VSL has an vision to help farmers present in the surrounding area and
help them in improving their yield totally they want to see rural development.
Page | 44

4.6) ORGANIZATION STRUCTURE:
4.7) MANAGEMENT TEAM:
Mr. Umesh V. Katti Mr. Umesh V. Katti is Chairman and Promoter of the company having
business and manufacturing interest in Sugar Industrial Alcohol, Organic
Chemicals, Agriculture etc. since over five years. He is also associated with
Page | 45

various Educational, social and Cultural Organization and is also cabinet
minister of the state government.
Mr.Ramesh V. KattiMr.Ramesh V. Katti is the vice chairman of the company. He is also
Bachelor of Arts from Hukkeri. He is also a Chairman of a Sugar cane factory at
Hukkeri.
Shri Mallikarjun Pujar Managing Director of the company having more than 12 years of
experience in the filed of Sugar, Chemical and Power. He is Bachelor of Arts
having such a good experience he is good at managerial skills which helps
maintaining of people of the company.
Shri Mukesh Kumar SharmaHe is COO of the company with more than 13 years of experience in the
filed of Sugar Industry. He is well known person in Sugar Industry. He is person
who had his Bachelor of Engineering from Bihar with specialization in the field
of Chemistry.
Mr. Shivanand M Katti Whole time Chief Electrical Engineer of the company. He is B.E. in
electrical from belgaum. He is the person with great knowledge who is most
helpful person in the company who looks after power section of the company.
4.8) BANKERS AND INSTITUTIONS:Bank of India
Industrial Development Bank of India
State Bank of India
HUDCO
4.9) COMPANY QUALITY POLICY :
Page | 46

We are committed to produce and supply products to meet our costumers
needs.
We shall continually strive to improve the effectiveness of our quality
management system.
We shall train and motivate our employees for continual improvement.
We are conscious of our responsibility towards safety, Health and
Environment.
Quality is what we think, and Believe.
4.10) PRODUCT AT GLANCEThe specification of Bellad Bagewadi sugar isPolarization : 99.80 to 99.88
Moisture : 0.35 to 0.06
Icmsa : up to 150 units
Ash : 0.08 to 0.10
Granulation : S-30 of Indian Sugar
Standard Colour : Sparking white
Packing : Present Packing. 100 kg
However they can be packaged in 50 kg HDPE bags, if required.
Vishwanath sugars ltd is the manufacture of White Crystal Sugar, along with
sugar some other main products manufactured in Vishwanath Sugars works ltd
are…Power ,Distillery Products,Bio-gas etc…..
4.11) Sugar Industry By-Products
SUGAR CANE
SUGAR MOLASES BAGASSE PRESS MUD
Page | 47

RECTIFIED BIOGAS EXPORTABLE POWER BIO SPIRIT POWDER FERTILIZER
FUEL INDUSTRIAL PORTABLEETHANOL ALCHOHOL ALCHOHOL
4.12) FUNCTIONAL DEPARTMENTS
1 Administration Department
2 Purchase Department
3 Cane Development Department
4 Production Department
5 Finance Department
6 Sales and Distribution Department
Administration Department
Administration department is the main department in the organization.
They are total number of 38 employees working in this department. Is divided
into 6 sections and they are as below :
1. Share section.
2. Purchase section.
Page | 48
3. Stores section.4. Sales Section.
5. Time office section.
6. Computer section.
7. Security section.
8. Telephone operating section.
1) SHARE SECTION:
The Share section is one of the important sections because more than half
of the total authorized capital is collected from shareholders. In this factory the
share are class
1. Grower shares A class
2. Non Grower Shares D class
3. Society share B Class
4. Out of Area Share E class
5. Govt share C Class
The person who wants to become a member has to follow the procedure /
rules. He has to fulfill appropriate application given by the share section
authority. If the boards of directors approve the application in body meeting,
then only he is treated as shareholder of the factory. After the approval he has to
pay the amount equivalent to face value of the share.
There is no transferability of share. If at all he wants to transfer his shares,
he has to transfer to such a person who is the member of the factory. If he
transfer to another person it is not valid and such shares get cancelled. For the
Page | 49

identification of its members, the factory issues share certificate and identity
cards to such share holders.
2) PURCHASE SECTION :
Purchase officer
Clerks
Attenders
FUNCTIONS OF PURCHASE DEPARTMENT:-
receiving purchasing requisition
determining the volume of materials to be ordered
placing orders
inviting tenders and quotations from different suppliers
Checking and passing bills for payment.
Receiving and inspecting materials.
Steps involved in purchasing the materials:
A. Raising requisition :
It is the first step and necessity for particular can be used only by the user
of the material.
B. Scrutinizing requisition :
The manager scrutinizes the demand of materials. He examines
whether the item mentioned in the requisition note is necessary or not.
C. Vendor selection :
After scrutinizing, if a material is necessary then tender advertisement
is given or if they have permanent vendors. The manager chooses the power
vendor. The BOD does selection of vendors.
Page | 50

D. Enquiry :
After selecting a proper vendor enquiry is sent to the vendor.
E. Receiving Quotation :
The purchase manager receives the quotations from vendors to whom
the enquiries are sent. Through there quotations a right vendor is chosen.
F. Sending purchase order :
Lastly the purchase order is placed to the selected venders. In this way
purchase of material takes place.
3) STORES SECTION
Stores keeper
Clerks Tool room Clerk Diesel room Clerk
Attainders Tool room attainders Clerks
Daily wage labors Attainders
PROCEDURE OF WORKING AT PRESENT: Handling of materials: First, they receive the stores purchase indents
from concerned section heads for requisition to purchase item needed for the
crushing or off season work. Then they mention the present stock of item in the
Page | 51

purchase indents, after verifying the stores. Then only they forward the
purchase indents.
After receiving the materials from suppliers they seek the quality approval
of the same materials. After getting the approval materials are placed to the
respective to the racks they issue the materials by adapting FIFO method.
They issue the materials to the workers of the factory on loan and
retainable basis on daily loan or personal loan.
STORES ACCOUNT:
After receiving the materials from suppliers quantity will be verified.
The details of the materials will be entered in to transport registered and
approved memo will be sent to the concerned departments for getting quality
approval. They keep bin cards for each different items receipt from the suppliers
with details.
TOOL ROOM:
Tool room is personnel issue the materials to the workers on temporary
loan and retainable basis entering in the register.
List of the registers:
1. Transport register.
2. Approval memo book.
3. Bin card files.
4. Purchase order.
5. Stores purchase indent etc.
4) TIME OFFICE :
Time keeper
Page | 52

Clerks
Time office is one of the important sections of administration department.
There are 5 employees working in this department.
Functions:
1. Showing the absent report to the HOD’s
2. To receive the attendance cards from the workers
3. To put attendance of the workers in the master role
4. It arranges the duty to the workers, maintains working bell
5. It maintains salary register book.
Types of Leaves:
1. Sick leaves :
Sick leave provided to employees 15 days per year
2. Casual leaves :
Casual leave provided to employees 12 days per year
3. Earn leaves :
If employee attends 30 days in a month then he is eligible for 3 days
Earn leave
Shift working : In a shift of 8 hours the factory is providing 4 types of shifts.
Shift Time
I 4 am to 12 pm
II 12 pm to 8 pm
III 8 pm to 4 am
General Shift 8-30 am to 5-30 pm
5) SALES SECTION :
Sales officer
Page | 53

Godown clerk
Consultant Clarks
In this section sales of the following products produced takes place are
sugar, molasses, bagasses and power. This factory is producing three types
of sugars they are M-30, S1-30 and S2-30 grades. And also it producing by
products like molasses, bagasses, press mud. These are used by factory it self
only like molasses and press mud are used in distillery / Ethanol production
and bagasses is used in production of power. And power is exported to
KPTCL.
This section will take care of all the sales transactions. The sale of sugar
is done according to the notification by the central government and has such
factories follows certain government rules in sales of sugar. Accordingly,
Karnataka state federation of co-operative sugar factories limited will give
figures of bags to sell within a month.
PROCEDURE FOR SALE:
The organization undertakes selling activities in three methods;
1. Free sale: Free sale is done within the country. Hear company will invite
tenders from different buyers at a 10 days notice. The sugar is sold to that
buyer who quotes or bids highest price. Tenders are called periodically. If
the rate is not satisfactory the tender will be cancelled. In free sale sugar
is being done to bulk purchases on the bases of tenders, these bulk
purchases then sell the purchased sugar to retailers.
2. Levy sale: It is also done within the state of Karnataka and being sold to
the government of Karnataka on levy bases. The government then
distributes outlets at predetermined, reasonable price.
Page | 54

3. Export : Sugar is sold outside the country on the contract bases.
According to the rules and regulation of the contract it will be done.
6) COMPUTER SECTION:
The total number of employees working in this department is 9. This section
is to maintain all types of records that are very important for the organization
and the following departments are computerized in the factory,
a) Weigh bridge department
b) Cane accounts department
c) Time office department
d) Laboratory department
e) Stores department
f) Sales department
g) Purchase department
h) General accounts department
i) Sales accounts section
7) SECURITY SECTION:
Security officer
Assistant security officer
Security guard
The security section is operating under the administrative department. It
is also working in three shifts as mentioned under time office section. Hear in
this department the employees are recruited on the yearly contract basis. There
are total 42 guards working in this section.
Page | 55

FACILITY TO WORKERS:-
1 Availability of rest house with TV facility.
2 Availability of quarters.
3 Providing 2 wheelers for employees who are visiting the field to
supervise and check the availability cane.
4 Executive levels are provided with 4 wheelers.
5 Weekly one holiday of any in a week
FINANCE DEPARTMENT:Accounts of finance department are the main and the hart of every
department of the company or industry. Hear in this factory, the accounts
section maintains all the transactions related to the factory dealings. The sale
accounts, purchase accounts, etc are maintained and this department prepares
P&L account, Balance sheet, etc.
In RSSK is divided finance department or accounts department in two sections.
1. General account section
2. Cane account section
In the above chart 50% of the labors are working in the general
account section and 50% are in the cane accounts section.
1. GENERAL ACCOUNTS SECTION:
In general accounts section book keeping is followed. General
account transactions like receipts and payments registers are maintained.
Receipts include sales process of sugar, molasses, share amount, etc. Payments
include salary, tax, etc. maintaining audit and audit rectification is done, annual
account and monthly account are prepared and maintained.
Some other types of registers are maintained by this section are:
a. Advance register
b. Contractors register
c. Contra register
d. Fixed assets register
Page | 56

e. Bank register
f. Expense register
Functions
1) Its main function’s to finalize each & every record of the factory.
2) It prepares profit & loss a/c & balance sheet.
3) It executes financial activities in factory.
4) Ratio analysis.
5) Report to the management.
6) Conduction of meetings.
2. CANE ACCOUNTS SECTION:
This section maintains the cane accounts and cane bills. This section
purchases the cane on daily basis and prepares accounts of forthrightly basis. In
addition, will take care of all cane suppliers accounts and department manager
separates accounts for cane suppliers.
The section will provide cane bill once in a month desired by the higher
authority. While giving cane bill, department will debut all the expenses and
advances which is given to the cane suppliers in terms of seeds, fertilizers and
transportation facilities and also harvesting of the cane that all the expenses are
given by the factory.
The registers maintained in this section are:
a) Self harvesting payment register
b) Harvesting bills
c) Cultivator payment register
CANE DEVELOPMENT DEPARTMENT
Cane Manager
Office manager Cane Cane Procurement Manager Cane Dev Manager
Page | 57

Cane Officers Cane Officers Field Assistants Field Assistants
Objectives of the CDD:
To get best quality of cane at a right time
To improve the variety of the cane
To provide all facilities like seeds, fertilizers, unloading and
loading charges
Main objectives are to receiving exactly 2500 TCD
To undertake seeds development program
Varieties of Sugar cane:
1. COC671 {Early Maturity}
2. CO8011 {Middle Maturity}
3. CO86032 {Early Maturity}
4. CO8021 {Early Maturity}
5. CO94012 {Early Maturity}
PRODUCTION DEPARTMENT
STRUCTURE
Page | 58
Laboratory In charge
Deputy Chief Chemist

The production department is center of the center organization. The main
function of the production department is Functions:-
To maintain close and co-ordinates relationship with all others.
To upgrade the technical efficiency of the production.
To flow up the daily production schedule of as per plan.
To produce the future needs of the company and to promote the
organization.
Page | 59
Laboratory Chemist
Laboratory Boys
Manufacturing Chemist
Staff and Workers

CHAPTER-5
ANALYSIS
SCHEDULE OF CHANGES IN WORKING CAPITAL
SL.NO PARTICULARS 31/03/2009 31/03/2008 Increase or Decrease in
Absolute1 LOANS :-
Secured Loans 1,330,097,993.26 638,064,463.23 692033530.03
Page | 60

Unsecured Loans 23,242,972.00 ---------------- 23,242,972.00
TOTAL 1353340965.26 638,064,463.23 715276502.03
2 FIXED ASSETS Gross Block 1,800,795,673.04 965,574,561.26 835221111.78
(Less) - Depreciation 169,905,278.44 124,662,222.38 45243056.06
Net Block - A 1,630,890,394.60 840,912,338.88 789978055.72
TOTAL CURRENT ASSET
1,119,608,329.53 683,578,842.26 436029487.27
(Less) – Current Liability in provision
584,263,485.22 279,261,185.52 305002299.7
Net Current Assets – B
535,344,844.31 404,317,656.74 131027187.57
Total (A+B) 2166235238.91 1245229995.62 921005243.29
Working capital required:
WCP= COGS * Operating Cycle + Desired Cash Balance
No of Working Days
Operating Cycle = Raw material + WIP + Finished Goods +Debtors – Creditors
Page | 61

1) Raw Materials
a) Average Stock of Raw materials = Total of Raw materials and Components
2
b) Raw material consumption per day = Total material consumed
No of working days
(Amount in Rupees)
PARTICULARS 2009 2008 2007
Average stock of Raw materials 500023234.43 275874282.31 254892920.00
Raw Material consumption per day 3846332.57 1339195.54 897510.28
Raw materials (in days) 130 206 284
Working capital maintained by the company:
WC= Current assets (less) Current liabilities.
Particulars 2009 2008 2007
Total current assets 1,119,608,329.53 683,578,842.26 422067183.97
Page | 62

Totalcurrent liabilities 584,263,485.22 279,261,185.52 151708691.07
W.C 535,344,844.31 404,317,656.74 270358492.90
Page | 63

RATIO
ANALYSIS
Page | 64

1)Debt Equity Ratio:
Debt Equity Ratio = Long Term Debt Share Holders Fund
Debt= Secured loan + unsecured loan (long term)
Particular’s 2009 2008 2007
Debt 135,33,40,965.26 63,80,64,000 76,80,20,840
Equity 34,03,59,000.00 34,03,59,000 33,19,71,481
Ratio 3.97 1.87 2.31
Page | 65

2) Shareholders equity ratio:
Shareholders equity ratio: Share holders Equity
Total assets (Tangible)
Particulars 2009 2008 2007
Shareholders funds 83,45,92,364.65 60,93,74,000 34,38,69,627
Total assets 2,18,79,33,329.91 152,67,00,000 110,46,90,466
Ratio 0.38 0.39 0.31
Share holders equity: Equity shares+ Preference+ Reserves and surplus- losses (if any)
Page | 66

3)Debt to net worth ratio:
Debt to Net worth Ratio = Long term debt
Net worth
Net worth: equity + preference+ reserves and surplus- losses
Particulars 2009 2008 2007
Long term debt 135,33,40,965.26 63,80,64,000 76,80,20,840
Net worth 83,45,92,364.65 60,93,74,000 34,38,69,627
Ratio 1.62 1.04 2.23
:
If we look at this ratio we can say the company is having more long term debts than its net worth. So the company has to taken care of it. Here higher the ratio higher the obligation and vice-versa.
Page | 67

4) Fixed assets to long term funds:
Fixed assets to long term funds: Fixed assets
Long term funds.
Long term funds = equity + debt
Particular’s 2009 2008 2007
Fixed Assets 1,63,08,90,394.60 84,09,12,000 83,19,52,687
Long term funds. 169,36,99,965.26 97,84,23,000 109,99,92,321
Ratio 0.96 0.85 0.75
If we look at this ratio the company is getting more and more long term funds from year to year. This analysis states us that the company securing itself by raising its long term funds. This raise the company’s capability of investment.
Page | 68

5) Current ratio:
Current ratio: Current assets
Current liabilities
Particular’s 2009 2008 2007
Current assets 111,96,08,329.53 68,35,78,842.26 42,20,67,183.97
Current Liability 58,42,63,485.22 27,92,61,185.52 15,17,08,691.07
Ratio 1.91 2.44 2.78
:
As the current ratio is moving downwards from year to year, it states us that the company is becoming lesser capable to meet its short term obligations. If the company’s current ratio goes lesser than 1 it would be very harmful to the company. So the company has taken care of it.
Page | 69

6) Quick Ratio:
Quick Ratio: Current assets- stock
Current liabilities- bank o/d
Particular’s 2009 2008 2007
Current Assets- Stock 66,90,90,723.72 37,81,31,521.16 19,65,75,176.36
Current Liability – Bank overdraft
58,42,63,485.22 27,92,61,185.52 15,17,08,691.07
Ratio 1.14 1.35 1.29
If we look at the quick ratio we can say that the company is not so consistent to meet its short term debt obligations. By above analysis the company from 2007 to 2008 it had more capability of repaying its debt obligations and if compare 2008 to 2009 it has lost its capability of repayment of its debt obligations.
Page | 70

7)Return on capital employed:
Return on Capital Employed = Net Profit 100
Capital Employed
Particulars 2009 2008 2007Net Profit 22,52,18,081.25 21,64,97,137.69 7,09,29,391.60Capital Employed 83,45,92,364.65 60,93,74,000 34,38,69,627
Ratio 0.26 0.35 0.20
This position of the company states us that the company is fair enough in its return on capital employed. The above analysis states us that the company as compared to 2009 into 2008 it is not having fair margin and if we 2008 into 2007 it has gained good margin in it.
Page | 71

8) Net profit margin:
Net Profit Margin = Net Profit before interest and Tax 100
Sales
Particulars 2009 2008 2007Net Profit before interest and Tax
251,079,243.25 247,131,501.69 70929391.60
Sales 1,160,705,003.75 942,877,990.40 518359946.19
Ratio 0.21 0.26 0.13
By above analysis we can say that as compared to 2007 into 2008 it has gained good control over its costs and if we compare 2009 into 2008 the company is not having much control over its costs.
Page | 72

SUGGESTION AND RECOMMENDATION
On the basis of analysis, the recommendation to further improves the working capital management, which would level the company to greater heights.
1) As we seen in the current ratio, we can say that the company is utilizing its equity fully. This states us that there is no unutilized fund in the company.
2) By observing current ratio, we can say that the company is having more current assets than its current liabilities.
Page | 73