PROJECT REPORT ON - ethesisethesis.nitrkl.ac.in/5933/1/E-100.pdf · PROJECT REPORT ON ......
42
PROJECT REPORT ON STUDIES ON TREATMENT OF SUGAR INDUSTRY EFFLUENT USING INVERSE FLUIDISED BED BIOREACTOR A Report Submitted In partial fulfilment of the requirements of B.Tech Chemical Engineering Submitted by Banka Bihari Praharaj Roll No. 110CH0417 Under the guidance of Prof. Abanti Sahoo DEPARTMENT OF CHEMICAL ENGINEERING NATIONAL INSTITUTE OF TECHNOLOGY, ROURKELA
-
Upload
truongkhue -
Category
Documents
-
view
233 -
download
0
Transcript of PROJECT REPORT ON - ethesisethesis.nitrkl.ac.in/5933/1/E-100.pdf · PROJECT REPORT ON ......

PROJECT REPORT ON
STUDIES ON TREATMENT OF SUGAR INDUSTRY EFFLUENT
USING INVERSE FLUIDISED BED BIOREACTOR
A Report Submitted In partial fulfilment of the requirements of B.Tech
Chemical Engineering
Submitted by
Banka Bihari Praharaj
Roll No. 110CH0417
Under the guidance of
Prof. Abanti Sahoo
DEPARTMENT OF CHEMICAL ENGINEERING
NATIONAL INSTITUTE OF TECHNOLOGY, ROURKELA

i
CERTIFICATE
This is to certify that the project report entitled “Studies On Treatment Of Sugar
Industry Effluent Using Inverse Fluidised Bed Bioreactor” submitted by Banka Bihari
Praharaj (110CH0417) in partial fulfilment of the requirements for the award of B.Tech
Degree in Chemical Engineering at the National Institute of Technology, Rourkela is an
authentic work carried out by him under my supervision and guidance.
To the best of my knowledge, the matter embodied in the report has not been submitted to any
other University/Institute for the award of any Degree.
______________
Date: Signature of the
Supervisor
Name: Prof. Abanti Sahoo
Designation: Associate Professor
Department: Chemical Engineering
National Institute of Technology, Rourkela
Rourkela-769008, Odisha
ii
ACKNOWLEDGEMENT
I feel immense pleasure and privilege to express my deep sense of gratitude and feel indebted
towards all those people who have helped, inspired and encouraged me during the preparation of
this report. I am grateful to my supervisor, Prof. Abanti Sahoo, for suggesting me the topic
and providing me the guidance, motivation and constructive criticism throughout the course
of the project. I would also like to thank HOD, Prof. R. K. Singh for his kind help to make this
report complete. I am also thankful to all the staff and faculty members of Chemical Engineering
Department, National Institute of Technology, Rourkela for their consistent encouragement.
Thanking You,
Banka Bihari Praharaj
(110CH0417)
iii
ABSTRACT
Treatment of effluent of sugar industry is carried out by inverse fluidized bed. Different
components of effluent like chemical oxygen demand (COD), biochemical oxygen demand
(BOD) and pH have been measured by varying different parameter such as concentration, time
of fluidization. The growth of microorganism w.r.t. different parameter has been noted. COD,
BOD and pH are observed to decrease with decreasing concentration of the solution. Again
values of different output parameters (BOD, COD and pH) are observed to be reduced with
increasing timing in an inverse fluidized bed. Microorganisms are allowed to grow and steady
state was observed same microbes were transferred to inverse fluidized bed for studying the
effect of parameters on its growth. Microorganisms are observed to be grown on the surface of
polypropylene beads by producing a biofilm. The observed reduction in COD, BOD and pH
indicate the suitability for the application of inverse fluidised bed for waste water treatment for
any industry.
Keywords: Inverse fluidization; COD reduction; BOD and pH analysis

iv
CONTENTS
Sl no Items Page no
1 CERTIFICATE I
2 AKNOWLEDGEMENT Ii
3 ABSTRACT Iii
4 CONTENTS Iv
5 LIST OF FIGURES/TABLES v-vii
6 INTRODUCTION
(Chapter 1) 1-5
7 MATERIALS AND METHODS
(Chapter 2) 6-14
8 REULTS AND DISCUSSION
(Chapter 3) 15-31
8 CONCLUSION
(Chapter 4) 32-33
9 REFERENCE
34

v
LIST OF FIGURES
Sl no. Figure number Figure Caption Page
number
1 2.1 EXPERIMENTAL SET UP 9
2 2.2 GROWTH OF MICROORGANISM
WITH TIME
14
3 3.1 RESPONSE OF COD WITH
CONCENTRATION
19
4 3.2 RESPONSE OF BOD WITH
CONCENTRATION
23
5 3.3 RESPONSE OF pH WITH
CONCENTRATION
24
6 3.4 VARIATION OF OBSERVED
VALUES WITH STANDARD
VALUES
25
7 3.5 RESPONSE OF COD WITH TIME 26
8 3.6 RESPONSE OF BOD WITH TIME 27
9 3.7 RESPONSE OF pH WITHTIME 28
10 3.8 RESPONSE OF OBSERVED
VALUES BEFORE AND AFTER
TREATMENT
29

vi
LIST OF TABLES
Sl no. Table number Table name Page
number
1 3.1 TITRATION FOR COD AT 100% CONCENTRATION 16
2 3.2 TITRATION FOR COD AT 50% CONCENTRATION 17
3 3.3 TITRATION FOR COD AT 50% CONCENTRATION 18
4 3.4 RESPONSE OF COD WITH CONCENTRATION 19
5 3.5 D.O. AT 100% CONCENTRATION 20
6 3.6 D.O. AT 50% CONCENTRATION 21
7 3.7 D.O. AT 25% CONCENTRATION 22
8 3.8 RESPONSE OF BOD WITH CONCENTRATION 23
9 3.9 VARIATION OF pH WITH CONCENTRATION 24
10 3.10 OBSERVED PARAMETER VS STANDARD
PARAMETER
25

vii
11 3.11 VARIATION OF COD W.R.T. TIME DURING
FLUIDIZATION
26
12 3.12 VARIATION OF BOD W.R.T. TIME DURING
FLUIDIZATION
27
13 3.13 VARIATION OF pH W.R.T. TIME DURING
FLUIDIZATION
28
14 3.14 OBSERVED PARAMETERS BEFORE AND AFTER
TREATMENT
29
15 3.15 BOD RANGES 30

1
CHAPTER 1
INTRODUCTION

2
Fluidization is a technique in which solid particle behaves like fluid when come in contact with
liquid, gas or both. At the time of fluidization there are two force acting on the solid particle one
is gravitational force and other one is fluid drag force.
1.1:-INVERSE FLUIDIZATION
When the direction of liquid and gas is opposite in direction the fluidization technique is called
inverse fluidization. This method is useful when the solid particle density is lower than that of
liquid. We can achieve fluidization by passing gas from the bottom and liquid from the top side.
Inverse fluidization is of two type two phase or three phase inverse fluidization. In two phase
inverse fluidization; fluidization achieve with liquid and solid but in three phase fluidization gas,
liquid and solid are needed to fluidised the bed.
Liquid fluidization draw large attention because it is useful in many new fields like biochemical
field and in treatment of industrial effluents. This type of fluidization help us when the particle
density is higher than that of liquid by passing liquid from the bottom. Now a day’s inverse
fluidization is drawing more attention because of some advantages of this over fluidization like
we can control the bio film thickness in biochemical processing unit. Here the velocity of
fluidization is low so energy consumption is low and solid attrition is also low, ease of
fluidization in case of power failure and the mass transfer rates are high.

3
1.2:-ADVANTAGES OF INVERSE FLUIDISATION PROCESS
We can easily do treatment of effluent of different industries like wine, sugar, paper using
inverse fluidization technique because this process is easy to handle, the cost is low, the energy
consumption is low and the efficiency is more than that of normal fluidization technique. The
advantages of this over normal fluidization are the gas holdups are large, less energy required
because of low fluid velocity, the attrition of solid particle is low so easy in the fluidization
process, the mass transfer rates are high and the fluidization can be carried out without any
problem in case of power failure.
1.3:-APPLICATION OF INVERSE FLUIDIZATION
1. These are very much useful in treatment of industrial effluent.
2. These are useful in biotechnology field in the immobilization of biocatalyst reactor.
3. Control of biofilm thickness and ease of re-fluidization in case of power failure in inverse
fluidization. This helps in the treatment of effluent of wine industry.
4. With the development of fluidized bed, coal combustion and the recent interest in the use of
fluidized beds for waste utilization and for dry solids separation, the potential applications of
multi-component fluidized beds are on the rise. It is because; the fluidized particles though
uniform in size at beginning, may change due to the attrition, coalescence and chemical
reaction, thereby affecting the quality of fluidization.
4
1.4:-OBJECTIVE
1. Study on COD, BOD, and pH of the effluent of the sugar industry by varying different
parameters like concentration, time of fluidization and plot the responses.
2. To compare the performance of inverse fluidised bed with the published data.
1.5:-LITEREATURE REVIEW
Inverse fluidization is use for the treatment of sewage and waste waters. Bacteria grows in the
chemically inter media and break down the sewage or waste water. But the bacteria has to grow
perfectly in the column producing a bio film on the surface of the solid particle used and helps in
the breaking sewage or waste water. We can decrease the value of liquid measuring pollutants to
a greater level by measuring the COD, BOD, TSS and again the waste water can be reused. In
this treatment microorganisms are playing vital role so it is important to monitor the amount and
quality of microorganism in the bed. There are many microorganism which helps in the
treatment of a particular waste water. In case of treatment of effluent of sugar industry
Staphylococcus aureus gives better results in removing the pollutants.
1.6:-PREVIOUS STUDIES:
Gomez et al. (2006) studied the phenol removal in a laboratory scale fluidized bed reactor by
immobilized derivatives of soybean peroxide. The effect of different variables on the process
is also studied and a model is setup based on the experimental results that shows the
behaviour of system in both steady and transient state. He consider the fluidized bed reactor
as the plug flow reactor in series with an ideal mixer and obeys a kinetic law based on the
observed external mass transfer resistances in order to work out the process rate.

5
Sokol & korpal (2006) investigated in the inverse fluidized bed bio film reactor (IFBBR) in
which polypropylene particles of density 910 kg/m3 were fluidized by an upward co-current
flow of gas and liquid. Measurements of chemical oxygen demand (COD) versus residence
time t are performed for various ratios of settled bed volume to bioreactor volume (Vb/VR)
and air velocities u to determine the optimal operating parameters for a reactor, that is, the
values of (Vb/VR), u and t for which the largest reduction in COD occurred. The biomass
loading in a reactor depended on the ratio (Vb/VR) and an air velocity u.
Sowmeyan & Swaminathan (2007) worked to evaluate the feasibility of an inverse
fluidized bed reactor for the anaerobic digestion of distillery effluent, with a carrier material
that allows low energy requirements for fluidization, providing also a good surface for
biomass attachment and development. Inverse fluidization particles having specific gravity
less than one are carried out in the reactor.
Removal of COD is about 70% of industrial effluent by inverse fluidized bed (Sokol, 1994).
6
CHAPTER 2
MATERIALS AND METHOD

7
Different types of materials and different processes are carried out for the treatment of effluent.
The methods which are used for the determining of different parameters like COD, BOD, pH.
2.1:-MATERIALS REQUIRED
1. Fluid- air and effluent
2. Solid- polypropylene beads of 6 mm diameter
3. Microorganism- staphylococcus aureus
Different setup for different mode of fluidization 2 phase or 3 phase. Two phase inverse fluidization
is carried out by only the flow of liquid. Three phase inverse fluidization can be carried out in two
ways i.e. continuous mode and batch mode. In batch mode solid particles fluidized by passing only
gas from the bottom there is no net flow of liquid occur. But in continuous mode both liquid and gas
contribute in the fluidization of solid particles. In batch mode waste water is stored in the column
first and then gas is passes from the bottom for fluidization to occur. Measurement of different
parameters are done by taking some amount of sample from the discharge end and tests are carried
out. In case of continuous mode simultaneously there will be liquid flow and gas flow.

8
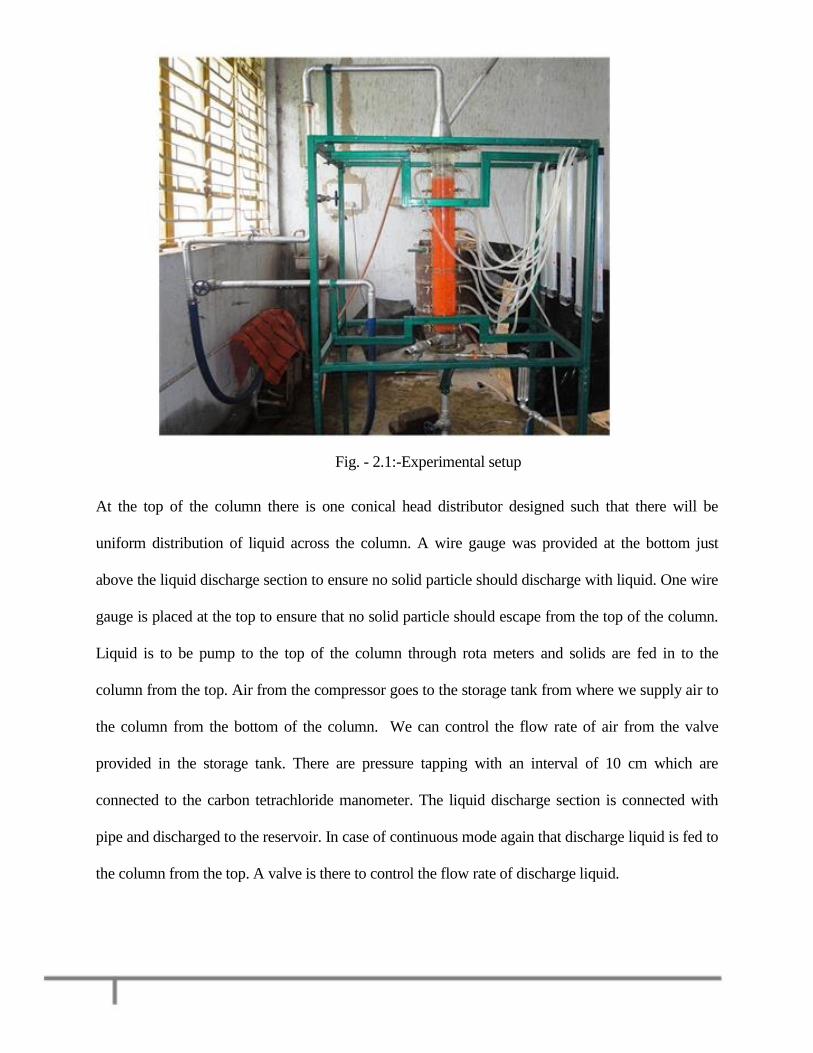
2.2:-EXPERIMENTAL SET UP
The column was made of Perspex and had the dimension of 100 mm internal diameter with a
maximum height of 1240 mm and a wall thickness of 3 mm. The column consisted of three
sections, namely,
1. Conical liquid distribution section:
The larger diameter of this section is 10 cm which is same as of column diameter and the smaller
diameter is 3 cm. The angle of cone is 30o.The distributor is also kept at the top of the column. Ball
valves are there to control the incoming water low rate.
2. Test section:
The height of this section is 100cm and there are 10 number of tapings with a gap of 10 cm. The pressure
tapings are connected with manometers with help of pipes.
3. Conical liquid discharge section:
This section consists exit outlet for the water, at the bottom of the column another distributors
given to prevent the particles from escaping the bed. This distributor also works as sparger of air
.A non-returning control valve is there to let the air in.
4. Five number of manometers (1 metre) are there to measure the bed pressure drop. These
manometers are filled with carbon tetra chloride.
9
Fig. - 2.1:-Experimental setup
At the top of the column there is one conical head distributor designed such that there will be
uniform distribution of liquid across the column. A wire gauge was provided at the bottom just
above the liquid discharge section to ensure no solid particle should discharge with liquid. One wire
gauge is placed at the top to ensure that no solid particle should escape from the top of the column.
Liquid is to be pump to the top of the column through rota meters and solids are fed in to the
column from the top. Air from the compressor goes to the storage tank from where we supply air to
the column from the bottom of the column. We can control the flow rate of air from the valve
provided in the storage tank. There are pressure tapping with an interval of 10 cm which are
connected to the carbon tetrachloride manometer. The liquid discharge section is connected with
pipe and discharged to the reservoir. In case of continuous mode again that discharge liquid is fed to
the column from the top. A valve is there to control the flow rate of discharge liquid.

10
2.3:-PARTS OF SETUP
1. The column is of 1024mm height and the diameter is 100mm with a thickness of 3mm and
material of construction is perplex.
2. A pump is used to pump the water from the reservoir to the column.
3. A water rotameter of 0-100 LPM is used to measure the flow rate of liquid pumped from the
reservoir.
4. Air rotameter of 0-1000 LPH is used to measure the flow rate of air coming from the storage
tank to the bottom of the column.
5. Five manometer of carbon tetrachloride of 1 meter length is used for the measurement of
pressure drop across the bed.
6. On the top and bottom part of the column circular pitch distributor of different pitch diameter
are used for proper distribution of air and water in the column.
2.4:-METHODS
Methods used for calculating COD, BOD and procedure of the experiment are explain below.
2.4.1:-Chemical oxygen demand (COD)
The COD test is used for measuring the amount of organic pollutants in water. They determine
the amount of organic compound present in surface water like effluent, waste water. This helps
in knowing the quality of water and express in mg/L; which is mg of oxygen consumed per litre
of solution. In other words this measures the material present in the waste water can be oxidised
in presence of strong oxidizing chemical. This is a rough measure of pollution level in waste
water because test carried out rapidly.
Following formula is used for determining COD

11
COD (mg/L) = (A-B)*1000*8*N/Vo (1)
Where A = ml FAS used for blank
B = ml. FAS used for sample
N=normality of FAS
Vo=mL of sample
2.4.1.1: Measurement of COD
(A) Principle
The organic matter present in the sample produce CO2 and H2O by oxidizing completely with
K2Cr2O7 in the presence of H2SO4, AgSO4 and HgSO4. The sample is refluxed with a known
amount of potassium dichromate (K2Cr2O7) in the sulphuric acid medium and the excess
potassium dichromate (K2Cr2O7) is determined by titration against ferrous ammonium sulphate,
using ferroin as an indicator. The dichromate consumed by the sample is equivalent to the
amount of O2 required to oxidize the organic matter.
(B) Chemical required
1. Potassium dichromate
2. Sulphuric acid
3. Ferrous ammonium sulphate
4. Silver sulphate
5. Mercury sulphate
6. Ferroin indicator
7. Organic free distilled water
12
2.4.2:-Biochemical oxygen demand (BOD)
BOD of waste water is the amount of oxygen required for the biological decomposition of organic
matter on a standard period of time and temperature. The standard time is taken to be 5 days and
the standard temperature is 20oC.
(A) Principle
The sample is filled in an airtight bottle and incubated at specific temperature for 5 days. The
dissolved oxygen (DO) content of the sample is determined before and after five days of
incubation at 20°C and the BOD is calculated from the difference between initial and final DO.
Following formula is used for the determination of BOD
BOD = (𝑫𝒐 − 𝑫𝟓) ∗ (𝒗𝒐𝒍𝒖𝒎𝒆 𝒐𝒇 𝒅𝒊𝒍𝒖𝒕𝒊𝒐𝒏
𝒗𝒐𝒍𝒖𝒎𝒆 𝒐𝒇 𝒔𝒂𝒎𝒑𝒍𝒆) (2)
Where Do-initial D.O. of sample
D5-D.O. at the end of 5 days of sample
(B) Reagents required
1. Manganous Sulphate Solution
2. Alkaline Iodide Sodium Azide Solution
3. Sodium Thiosulphate stock solution
4. Starch Indicator
5. Sulphuric Acid
13
2.4.3:-PROCEDURE
1. Solid particle of the particular size and density loaded to the column to a particular bed height.
2. Effluent was mix with water to get the desired concentration.
3. The solution is fed to the column to a particular height.
4. Microbes are allowed to grow on the beads surface.
5. Air was passed from the bottom to carry out the fluidization.
6. After certain time interval sample was taken from the discharge section and performed the
required test to measure different parameters.
2.4.4:-MICROORGANISM
Here staphylococcus aureus microorganism was selected for the treatment of sugar industry. This
gives better degradation of compound present in the sugar industry effluents. This bacteria cause
dieses to many animal including human being. We can found this on the skin and throat pipe of
human being. The main dieses cause due to this bacteria is skin dieses. They grow in a wide range
of pH i.e. 4.3 to 9.2 and gives better result in between 7.3-8.2.

14
2.4.5:-INOCULUM PREPARATION
The microbial species of staphylococcus aureus is taken from the solidified slant culture. Then
nutrient broth is prepared which is readymade available. 3.25 gm of nutrient was added to 250
ml of distilled water and the solution is checked for pH=7.It was autoclaved at 1210 c for 20 min.
& then it was cooled. Microbes are extracted from the mother culture by swapping method
through inoculums loop and was mixed to the nutrient solution. Then it is kept at laminar flow
chamber at 300 c temp, 120 rpm and incubated for around 1 day. Again to make the volume up to
1 litre the procedure is repeated. This time the 250 ml. incubated solution is take as mother
culture.
Fig. - 2.2: Growth of microorganism with time

15
CHAPTER 3
RESULTS AND DISCUSSION

16
Observation for the COD, BOD and pH with variation of different parameters are listed below
and their responses are plotted in different graphs.
3.1: COD VARIATION WITH CONCENTRATION
(A) 100% concentration solution ( 100% effluent provided by the industry)
Titration readings noted for COD with 100% concentration of solution are listed in TABLE 3.1.
TABLE NO. 3.1: Titration for COD at 100% concentration
Sample Calculation:
From equation 1 it can be written as
COD (mg/L) = (A-B)*1000*8*N/Vo
Where, A=14.1
B=7.6
Vo =2.5
N=0.1
COD (mg/L) = 2080
Sl no Sample Volume of sample
(ml)
Burette reading
(ml)
Volume of 0.1 N
FAS (ml)
Initial Final
1 Blank 2.5 0 14.1 14.1
2 Sample 2.5 14.1 21.7 7.6
3 Sample 2.5 21.7 29.3 7.6

17
(B) 50% concentration solution (50% effluent + 50% water)
Titration readings noted for COD with 50% concentration of solution (50% effluent + 50% water)
are listed in TABLE 3.2.
TABLE NO. 3.2: Titration for COD at 50% concentration
Where, A=14.1
B=9.3
Vo=2.5
N=0.1
COD (mg/L) = 1536
Sl no Sample Volume of
sample
(ml)
Burette reading
(ml)
Volume of 0.1 N
FAS (ml)
Initial Final
1 Blank 2.5 0 14.1 14.1
2 Sample 2.5 14.1 23.4 9.3
3 Sample 2.5 23.4 32.7 9.3

18
(C) 25% concentration solution (25% effluent + 75% water)
Titration readings noted for COD with 25% concentration of solution (25% effluent + 75% water) are
listed in TABLE 3.3.
TABLE NO. 3.3: Titration for COD at 25% concentration
Sl no Sample Volume of
sample
(ml)
Burette reading
(ml)
Volume of
0.1 N
FAS (ml) Initial Final
1 Blank 2.5 0 14.1 14.1
2 Sample 2.5 14.1 25.4 11.3
3 Sample 2.5 25.4 36.7 11.3
Where, A=14.1
B=11.3
Vo=2.5
N=0.1
COD (mg/L) =896
19
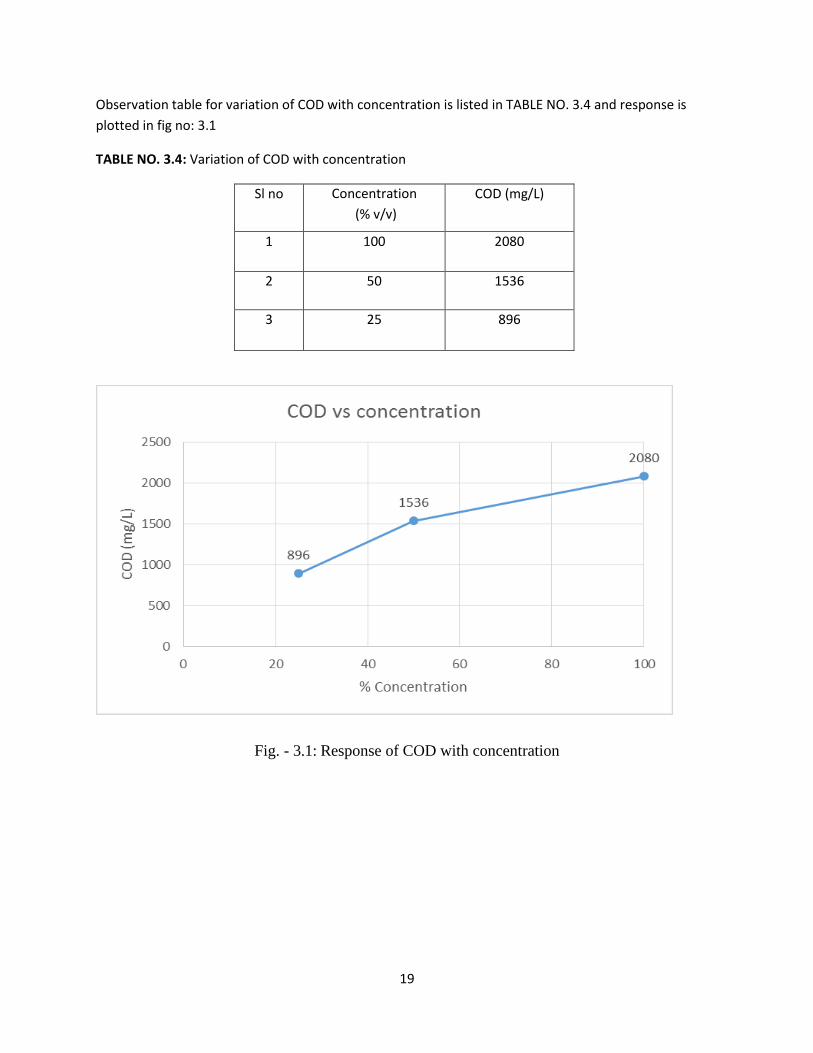
Observation table for variation of COD with concentration is listed in TABLE NO. 3.4 and response is
plotted in fig no: 3.1
TABLE NO. 3.4: Variation of COD with concentration
Sl no Concentration
(% v/v)
COD (mg/L)
1 100 2080
2 50 1536
3 25 896
Fig. - 3.1: Response of COD with concentration
20
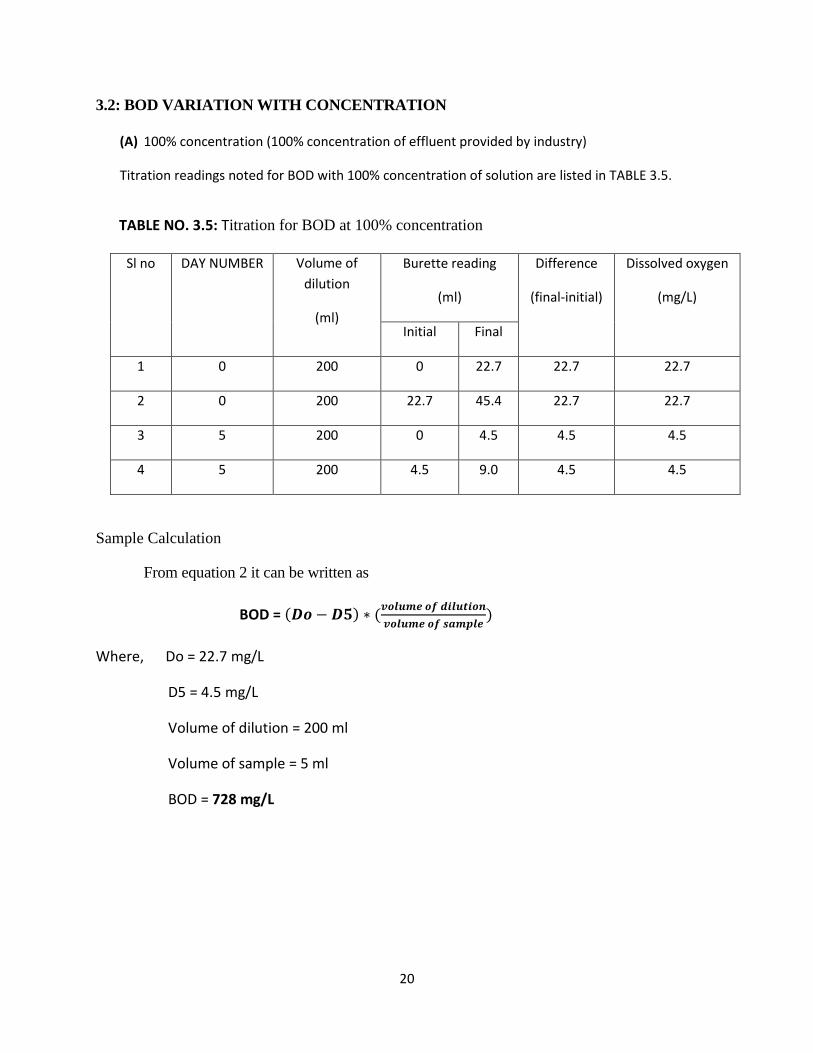
3.2: BOD VARIATION WITH CONCENTRATION
(A) 100% concentration (100% concentration of effluent provided by industry)
Titration readings noted for BOD with 100% concentration of solution are listed in TABLE 3.5.
TABLE NO. 3.5: Titration for BOD at 100% concentration
Sample Calculation
From equation 2 it can be written as
BOD = (𝑫𝒐 − 𝑫𝟓) ∗ (𝒗𝒐𝒍𝒖𝒎𝒆 𝒐𝒇 𝒅𝒊𝒍𝒖𝒕𝒊𝒐𝒏
𝒗𝒐𝒍𝒖𝒎𝒆 𝒐𝒇 𝒔𝒂𝒎𝒑𝒍𝒆)
Where, Do = 22.7 mg/L
D5 = 4.5 mg/L
Volume of dilution = 200 ml
Volume of sample = 5 ml
BOD = 728 mg/L
Sl no
DAY NUMBER Volume of
dilution
(ml)
Burette reading
(ml)
Difference
(final-initial)
Dissolved oxygen
(mg/L)
Initial Final
1 0 200 0 22.7 22.7 22.7
2 0 200 22.7 45.4 22.7 22.7
3 5 200 0 4.5 4.5 4.5
4 5 200 4.5 9.0 4.5 4.5
21
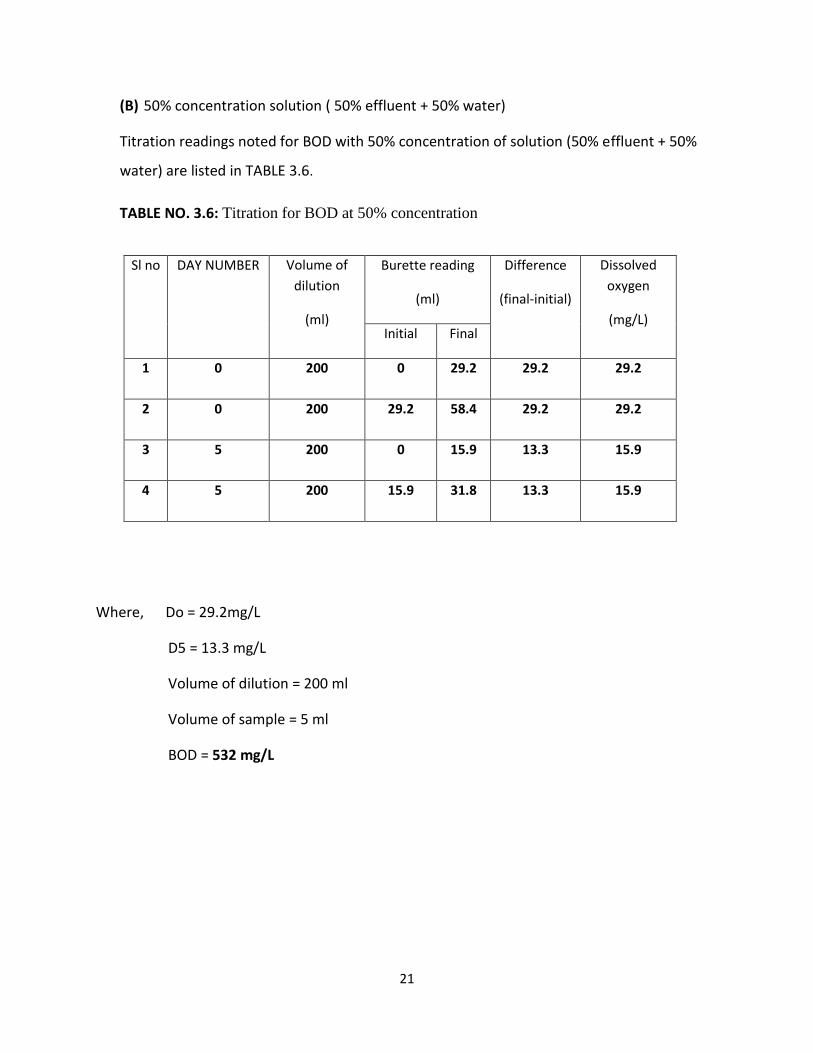
(B) 50% concentration solution ( 50% effluent + 50% water)
Titration readings noted for BOD with 50% concentration of solution (50% effluent + 50%
water) are listed in TABLE 3.6.
TABLE NO. 3.6: Titration for BOD at 50% concentration
Sl no
DAY NUMBER Volume of
dilution
(ml)
Burette reading
(ml)
Difference
(final-initial)
Dissolved
oxygen
(mg/L) Initial Final
1 0 200 0 29.2 29.2 29.2
2 0 200 29.2 58.4 29.2 29.2
3 5 200 0 15.9 13.3 15.9
4 5 200 15.9 31.8 13.3 15.9
Where, Do = 29.2mg/L
D5 = 13.3 mg/L
Volume of dilution = 200 ml
Volume of sample = 5 ml
BOD = 532 mg/L

22
(C) 25% concentration solution (25% effluent + 75% water)
Titration readings noted for BOD with 25% concentration of solution (25% effluent + 75%
water) are listed in TABLE 3.7.
TABLE NO. 3.7: Titration for BOD at 25% concentration
Sl no
DAY NUMBER Volume of
sample
(ml)
Burette reading
(ml)
Difference
(final-initial)
Dissolved
oxygen
(mg/L) Initial Final
1 0 200 0 31.2 31.2 31.2
2 0 200 31.2 62.4 31.2 31.2
3 5 200 0 23.1 23.1 23.1
4 5 200 23.1 46.2 23.1 23.1
Where, Do = 31.2 mg/L
D5 = 23.1 mg/L
Volume of dilution = 200 ml
Volume of sample = 5 ml
BOD = 324 mg/L

23
Observation table for variation of BOD with concentration is listed in TABLE NO. 3.8 and
response is plotted in fig no: 3.2
TABLE NO. 3.8: Variation of BOD with concentration
Sl no Concentration (% v/v) BOD (mg/L)
1 100 728
2 50 532
3 25 324
Fig. - 3.2: Response of BOD with concentration
24
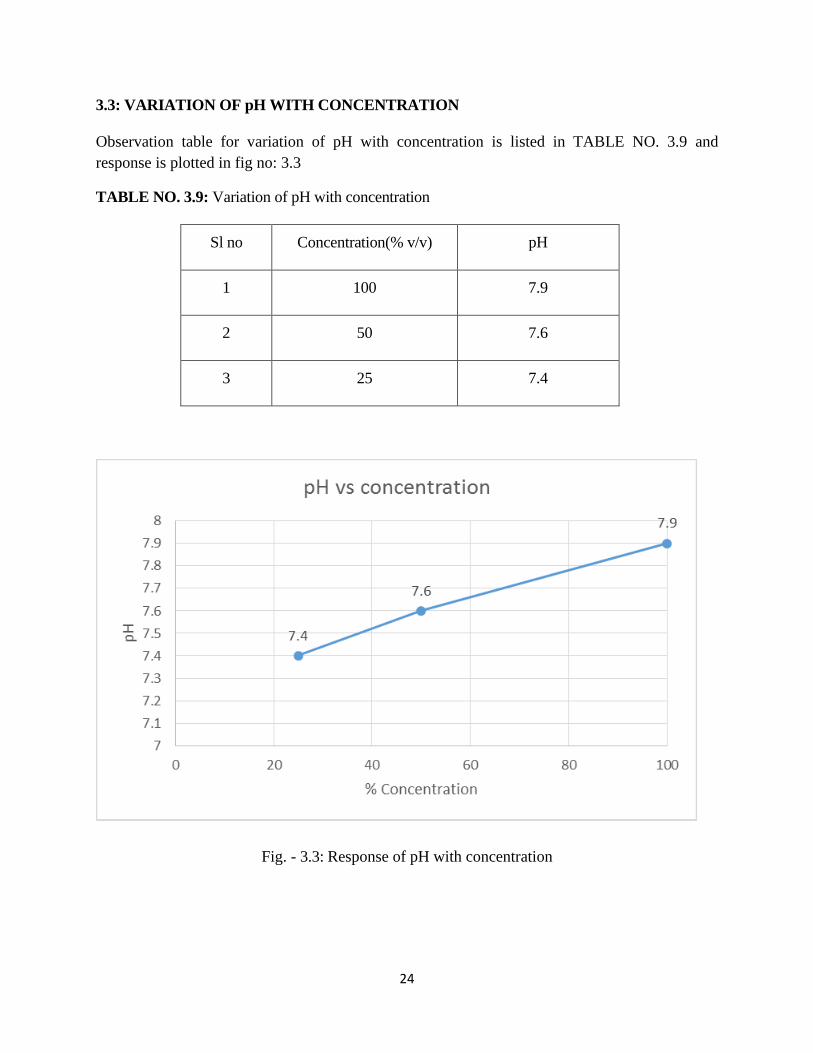
3.3: VARIATION OF pH WITH CONCENTRATION
Observation table for variation of pH with concentration is listed in TABLE NO. 3.9 and
response is plotted in fig no: 3.3
TABLE NO. 3.9: Variation of pH with concentration
Sl no Concentration(% v/v) pH
1 100 7.9
2 50 7.6
3 25 7.4
Fig. - 3.3: Response of pH with concentration

25
TABLE NO. 3.10: For 100 % concentration of effluent the parameters are listed below
Fig. - 3.4: Observed parameter vs standard parameter
Sl no Parameters Observed value of
parameter
Standard value of
parameter
1 Colour Brown Colourless
2 Odour Unpleasant Odourless
3 COD 2080 mg/L 250 mg/L
4 BOD 728 mg/L 30 mg/L
5 pH 8.2 5.5-9

26
When the fluidized bed has started at a time interval sample were taken from the discharge line and
the required tests are performed.
COD, BOD and pH of the solutions which are the measures of pollution level of the effluent were
measured against time.
3.4: VARIATION OF COD WITH TIME DURING FLUIDIZATION
Observed values of COD with time during fluidization is listed in TABLE 3.11 and response is
plotted in Fig no: 3.5
TABLE NO. 3.11: Variation of COD with time during fluidization
Time (hr) COD (mg/L)
0 896
15 864
30 800
48 768
Fig. - 3.5: Variation of COD with time at during fluidization

27
3.5: VARIATION OF BOD WITH TIME DURING FLUIDIZATION
Observed values of BOD with time during fluidization is listed in TABLE 3.12 and response is
plotted in Fig no: 3.6
TABLE NO. 3.12: Variation of BOD with time during fluidization
Time (hr) BOD (mg/L)
0 324
15 312
30 288
48 276
Fig. - 3.6: Variation of BOD with time during fluidization

28
3.6: VARIATION OF pH WITH TIME DURING FLUIDIZATION
Observed values of pH with time during fluidization is listed in TABLE 3.13 and response is
plotted in Fig no: 3.7
TABLE NO. 3.13: Variation of pH with time during fluidization
Time (hr) pH
0 7.4
15 7.4
30 7.3
48 7.3
Fig. - 3.7: Variation of pH with time during fluidization

29
The values of the parameter decrease after treating the effluent on the inverse fluidized bed.
The following table describe the COD, BOD, pH values after the treatment and before that
The experiment was carried out at 25% v/v concentration of effluents following are the data
TABLE NO.3.14: Observed parameters before and after treatment
Sl no Parameters Observed value of parameter
before treatment
Observed value of parameter
after treatment
1 colour Brown Colourless
2 odour Unpleasant Odourless
3 COD 896 mg/L 768 mg/L
4 BOD 324 mg/L 276 mg/L
5 pH 7.4 7.3
Fig:-3.8: Response of observed values before and after treatment

30
Effluents are categories in to different types with their BOD values following is the table from the
literature regarding the types of effluent
TABLE NO. 3.15: BOD ranges
Sl no Type of effluent BOD ranges
1 Influent 150-400
2 Primary Effluent 60-160
3 Secondary Effluent 10-60
4 Digester Supernatant 1000-4000+
5 Industrial Wastes 100-3000+

31
All the processes are assumed to occur in the fluidized bed region only. The concentration of
biofilm is assumed to be constant everywhere. For bio particle model, constant density was
assumed, homogeneous biofilm distribution and the solid particles were also assumed to be
spherical in shape. All the bed materials are assumed to be distributed evenly in the bed region. The
pH of the solution in the column was maintained at suitable value (i.e. 7.3) for growth of the
microorganism by which biofilm on the surface of the solid particle was developed. The solid
particle used in the experiment is polypropylene whose density is less than that of effluent of sugar
industry. After the microorganism grows on the surface of the polypropylene beads perfectly and
produce a homogeneous biofilm the experiments were conducted by varying air flow rates. For the
treatment of effluent of sugar industry we have to measure the COD, BOD and pH of the effluent at
different time interval.
During the experimentation it was observed that the polypropylene particles were moving in
downward direction even though the process was a batch process (liquid was not flowing from the
top of the unit). The fluidization was taking place because of movement of particles in downward
direction and mild upward force exerted by air from bottom. Downward movement of particles may
be due to the fact that growth of biofilm on the surface of polypropylene beads making it heavier
than water.
The observed data are then listed in different tables and effect of parameters on COD, BOD and pH
of the effluent are shown in different plots. In table 3.4, table 3.8, table 3.9 variation of COD, BOD
and pH with concentration are described and in table 3.11, 3.12, 3.13 variations of COD, BOD, and
pH with time of fluidization are described. On table 3.10 observed data with standard value is
compared, table 3.14 observed values before and after treatment are compared and BOD ranges of
different effluents are described on table 3.15

32
CHAPTER 4
CONCLUSION & SCOPE
TO FUTUREWORK

33
4.1: CONCLUSION
In the treatment of effluent of sugar industry by inverse fluidized bed the concentration of the
sample is 25% v/v with the normal water. The fluidization is 3 phase batch mode operated for 48
hour and the results are noted. The bed height is taken to be 18 cm and polypropylene beads of 6
mm dia. The pH of the sample reduced to 7.3 from 7.4 slightly reduced in the pH value. The COD
of the sample is decrease to 768 from 896 in 48 hour of inverse fluidization. The BOD of the sample
is decrease to 276 from 324 in 48 hour of inverse fluidization. The observed reduction in COD,
BOD and pH indicate the suitability for the application of inverse fluidised bed for waste water
treatment for any industry.
4.2:- SCOPE OF FUTURE WORK
Treatment of industrial effluents can be done
(i) By using different bed heights of same sized polypropylene beads.
(ii) By using different sizes of the beads.
(iii) by using different concentrations of effluent
(iv) by varying air flow rates
(v) by continuous flow of effluents

34
REFERENCES
1. Determination of biochemical oxygen demand; CEM, NITTTR Lab; August 30, 2010
2. Garcia, D., Buffiere, P. Molettal, R., and Elmaleh, S., Anaerobic digestion of
wine distillery wastewater in down-flow fluidized bed, Wat. Res. Vol. 32, No.
12, pp. 3593-3600, 1998.
3. Gomez, L., Bodalo, A., and Gomez, E.,(2006) Murcia Experimental behaviour and design
model of a fluidized bed reactor with immobilized peroxidase for phenol removal Chemical
Engineering Journal 127 ,47-57
4. Sahoo A and Lima T effect of parameter on treatment of industrial effluent using inverse
fluidised bio reactor: statistical analysis. Particulate science and technology 32 (2013),
151-157
5. Sokol, W. and Korpal, W., Aerobic treatment of wastewaters in the inverse fluidized bed
biofilm reactor, Chemical Engineering Journal 118 (2006) 199-205.
6. Sowmeyan, R., Swaminathan, G.;(2007) Evaluation of inverse anaerobic fluidized bed
reactor for treating high strength organic wastewater; Bioresource Technology 99, 3877-
3880.
7. Sokoł, W. and Halfani, M. R. : Hydrodynamic characteristics of a three-phase fluidised
bed bioreactor with the KMT-biomass support, Proc. 3rd Int. Meeting on Chemical
Engineering and Biotechnology, ACHEMASIA’ 94, Beijing, pp 139–145 (1994).