Project report on exploring express cargo
43
PROJECT REPORTON EXPLORING EXPRESS CARGO BUSINESS POTENTIAL IN ASSIGNED TERRITORY (GURGAON) SUBMITTED TO SUBMITBY: Prof. Shri Atmanand,Ph.D.DHRUBJI MANDAL Professor of Economics & Energy Dean-Consulting & Advancement at MDI, Gurgaon
-
Upload
dhrubaji-mandal -
Category
Education
-
view
3.548 -
download
3
Transcript of Project report on exploring express cargo

PROJECT REPORTON EXPLORING EXPRESS CARGO
BUSINESS POTENTIAL IN ASSIGNED TERRITORY
(GURGAON)
SUBMITTED TO SUBMITBY: Prof. Shri Atmanand,Ph.D.DHRUBJI MANDAL Professor of Economics & Energy Dean-Consulting & Advancement at MDI, Gurgaon

ACKNOWLEDGEMENT
The satisfaction, which accompanies the successful completion of the project, is incomplete
without the mention of a few names. We take this opportunity to acknowledge the efforts of
many individuals who helped us to make this project possible.
We would like to express our heartfelt appreciation and gratitude to our project head Mr. AMIT
KUMAR, Retail Head, Self-express .This project is a result of his teaching, encouragement and
inputs in the numerous meetings he had with me, despite his busy schedule. He made sure that
my stay in the office was a learning experience.
I would also like to thank Prof. Shri ATMANAND, Ph.D. Professor of Economics &Energy,
Dean-Consulting & Advancement at MDI for his constant support, continued encouragement
guidance and indescribable help throughout this project.
Finally, we would like to thank Our Institute, Management Development Institute for making
this experience to work on this project. The learning from this experience has been immense and
would be cherished throughout our life.

PREFACE
This project is a scientific and systematic study of real issues on a problem with the application of
management concept and skills. The study can deal with small or big issues in any division of an
organization.
It can be case study where a problem has been dealt with, through the process of management. The
essential equipment of a project is that, it should contain scientific collection of data, analysis and
interpretation of data leading to a valid conclusion.
Working on Project is an essential part in MIBA curriculum. It enables the student to share the real
experience in the corporate world. Our Project is Regarding the Economic analysis of Logistics Company
The topic of our project is “Report On Exploring Express Cargo Business Potential In Assigned
Territory”
We hope this study will contribute to the organization.

INDEX
S. No. Content
1 Industry Profile
2 An Over View : The Logistics Industry
3 Evolution of Logistics Industry
4 Indian Logistics Industry
5 The Study
5.1 Safexpress
5.2 Gati
5.3 Blue Dart
6 Location Mapping
7 Secluded destination by Zone
8 Graphical Analysis of Secluded destination
9 City Coverage By Zone
10 District Coverage By Zone
11 Comparison of all the Company Zone Wise
12 Mapping of the Zone Matrix & Transit Time Policy
12.1 Safexpress
12.2 Gati
12.3 Blue Dart
13 Mapping of AIR Business
14 Logical Industry Update
15 Competition Update
16 Financial Mapping of Competition
16.1 Quarterly Basis Analysis
16.2 Yearly Basis Analysis
17 Share Holding
18 Earnings Per share Before Extraordinary Idem
19 Profit Before Interest Tax and Exceptional Item
19.1 Quarterly Basis Analysis
19.2 Yearly Basis Analysis
20 Net Profit Loss Comparison
20.1 Quarterly Basis Analysis
20.2 Yearly Basis Analysis
21 Operating Profit Margin & Net Profit Margin
22 Recommendation
23 References

INDUSTRY PROFIE
Several factors helped the growth of logistics industry in India over the decade that includes
changing tax system, rapid growth in industries such as automobile, pharmaceuticals, FMCG and
retail. However, major sectors that are investing huge amounts in logistics industry are aviation,
metal & mining and consumer durables. With increasing competition and cost, focus on
outsourcing, entry of foreign players is having positive impact on the industry. Three major
contributors for the growth of the logistic industry are: emergence of organized retail, increase in
foreign trade and India becoming soon the manufacturing hub.
As per the World Bank‟s Logistics Performance Index 2010, India is placed at 47th
position out
of 155 countries.

An Overview: The Logistics Industry
Logistics refers to movement of goods and raw materials from the place of production to the place of
consumption. A recent study defined logistics as that part of the supply chain process that plans,
implements and controls the efficient flow and storage of goods, services and related information from the
point of origin to the point of consumption, in order to meet the customers‟ requirements. Transportation
is the raw term used in place of logistics.
Logistics was originated when it was felt that there was a great deal of need of transportation of arms,
ammunitions, food supply, tools and thus the term logistics came into existence. 1920s and 1930s were
the era of manufacturing. Less of customization; there were limited models of cars and that too of a
particular range. At that time, the focus was entirely upon the production efficiency, companies
concentrating more on the purchasing of cheap raw material and low cost transportation. With the
changing emerging trends in the Indian market, the focus shifted from production to market orientation,
the number of competitors increased in the market.
Customers are now equipped with multiple choices and the companies shifted towards customization of
more and more products. The mantra for being successful in the market to improvise the existing system
the term purchasing of raw material transformed to procurement of raw material, thus there was addition
of a number of warehouses and distribution system.
Furthermore, the intense competition in the market place was on major highlights and concept of mere
logistics turned into supply chain management. Now not only the attention given to production efficiency
to produce better quality and low priced products. All this was possible through a good communication
and interlink age among the vendors, manufacturers, distributors of supply chain.
Next level is the value chain strategy, in this concept no one is customer or supplier but all echelons of
supply chain are partners and work hand in hand. Thus in order to have a sound and oiled logistics
network rule is to give boost to supply chain and value chain. Today's modern, efficient
warehouses/distribution centers are the heart of logistics, and provide control, efficiency and velocity for
goods moving through the system.
Logistics is not confined to manufacturing operation alone. It is relevant to all enterprises, including Govt.
institutions such as Hospitals and schools and service organization such as retailers, banks and financial
service organizations. The study of logistics is especially important for bulk raw materials, where
substantial outflow of freight is involved. Management of Logistics is an art, which is extremely difficult
to perfect in India, JIT ends up being SHIT somehow in time.

The Transportation & Logistics industry sector comprises a wide range of service providers, covering all
modes of transport – air, road, rail, sea – as well as related services such as warehousing, handling,
stevedoring, and finally value added services like packaging, labeling, assembling etc. In addition to these
'physical' services, T&L includes all sorts of planning, organizational and management services in the
area of transportation and logistics. Over the past years, we have seen a trend to consolidation, resulting in
larger, integrated groups operating in more than one of the T&L sub-sectors. As a result, the limits
between the T&L sub-sectors become more and more indistinct.
The success of the logistics industry depends on the promptness with which the products can be delivered
to a particular destination or to a client. Time and location are two factors, which can either make or mar
the logistics industry. The logistics industry is governed by technology, integration, globalization,
legislation and confederations.
Formerly, warehousing facilities and logistic facilities were situated in remote areas like water port,
beside rail tracks and those places in towns or cities which were not treaded up on by many. However,
these sites shifted to rural areas and other localities. The logistics industry has experienced several
changes over the years. These changes can be attributed to the growth in the retail industry and the
manufacturing segments.
Globally, the logistics industry is valued at US$ 3.5 trillion. The U.S., which contributes to over 25% of
the global industry value, spends close to 9% of its GDP on logistic services. The Indian Logistics
Industry is presently estimated at US$ 90 billion. The industry has generated employment for 45 million
people in the country in comparison with the IT and ITeS sector which employs approximately 4.3
million people.
According to CII It is forecast to grow at a Compound Annual Growth Rate (CAGR) of approximately
8% over the next three to five years. Third Party Logistics (3PL) Solutions, is slated to grow at a
compound annual growth rate (CAGR) of over 16% from 2007-10. Consequently, 3PL service providers
are expected to corner an increased share of the Indian Logistics pie, from 6% in FY06 to 13% in FY11,
at a CAGR of 25%.

Evolution of Logistics Industry
The evolution of logistics and Supply Chain Management (SCM) in the 1990s can be traced back
to “physical distribution management” in the 1970s when there was no coordination among the
various functions of an organization, and each was committed to attain its own goal. This myopic
approach then transformed into “integrated logistics management” in the 1980s that called for
the integration of various functions to achieve a system-wide objective. Supply Chain
Management (SCM) further widens this scope by including the suppliers and customers into the
organizational fold, and coordinating the flow of materials and information from the
procurement of raw materials to the consumption of finished goods.

Indian Logistics Industry
Positive Trends Seen In Indian Logistics Industries
The Industry has got the desired Momentum
Logistics has become a strategic Source of Competitive Advantages
Huge Investment are Made by Foreign investors
High investment are made by government to improve the infrastructure
India is becoming the auto hub of the world

THE STUDY
1. SAFEXPRESS
2. . GATI
3. BLUE DART

Safe Express
Safe press –India‟s Leading Logistics Company is renowned for its domain expertise and
experienced manpower in the LSCM sector. Safe press can best understand your Logistics and
distribution requirements and can offer the most suitable Logistics model and solution to you.
Safe press has the largest network coverage across India traversing over 6,00,000 km. every day
covering over 560 locations through more than 1000 routes operating 24 hours a day 365 days a
year reaching these locations through its fleet of 3500 vehicles operating on. All Safe press
vehicles have all-weather proof containers for safe transit. Safe press also operates through Air to
locations directly covered by flights and to all other locations on a multi modal basis
It's a fact that when you communicate with Email in the usual POP3 form, Web-mail, or even via
SSL, your messages can be intercepted, read, changed, and counterfeited by others. Now there is
a secure way to communicate over the Internet. There is an email client that fully protects your
correspondence from prying eyes. Safe Express, designed with modern military level
cryptography, securely protects all transmitted data.
Safe Express is a powerful, highly configurable, yet easy to use email client.
Safe Express is a public key email encryption client that automatically encrypts all your
messages.
Safe Express is an anti-spam email client that automatically classifies incoming emails as spam
or non-spam.

Mr. Jain, CMD Safe press, was conferred the honor of „CEO of the Year‟ by Asia‟s Best
Employer Brand Award.
Safeexpress was bestowed with the Award for Excellence in Training for its continuous efforts to
improve the skills of the supply chain workforce.
Safe-express has been upgrading the skills of its employees over the years by providing them
with on-the-job trainings and specialized courses. For its efforts, the company won awards for
Innovation in Retention Strategy as well as for Best HR Strategy in line with Business.
Safeexpress was awarded the „Best Air Cargo Logistics Company of the Year‟ at the 5th
ASSOCHAM International Conference on Indian Civil Aviation. The prestigious award was
presented to Mr. Rubal Jain, Director – safe express, by Mr. Ajit Singh, Honorable Minister for
Civil Aviation in India.
Safe express is the 'Market Leader' and 'Knowledge Leader' of the Indian Supply Chain &
Logistics Industry.
Safe express has the capability to deliver to every square inch of India.
Safe express has over 580 offices and 48 hubs and mega-hubs across India.
Safe express has over 2500 employees working in more than 580 offices across the country.
Safe express has the largest nationwide network of over 580 destinations.
Safe express fleet travels over 6,00,000 Kms every day.
Safe express has the fastest transit-time in the industry of 1.8 days.
Safe express delivers over 80 million packages a year.
Safe express plans to open 32 Logistics Parks at key business centers all over the country in the
next couple of year

GATI
Gati pioneered express distribution service in India in 1989.Gati was one of the first companies
to print its delivery date on the docket and offer money back guarantee, by accepting payment
after producing proof of delivery – a POD. Gati started the practice which is now perceived as a
standard norm in the industry.
Gati first started operations between Madras and Madurai. After in-depth planning, Gati
launched its operations in four stations: Hyderabad, Bangalore, Madras and Hosur in 1989.in the
generic cargo segment.
Gati's business model was different , it choose to focus on the customers‟ needs right from day
one and time bound, point to point delivery, premium priced cargo management service was its
key value proposition. Gati never operated the transport vehicles on its own from the beginning
itself, instead developed the Business Partner concept of “Gati Associates”, thus giving rise to a
team of entrepreneurs who were independent business partners of Gati.
The name Gati was coined after short listing several Sanskrit-based names . Gati reflects speed
with direction, true to the way of its operations
Gati started its operations as a door-to-door cargo company, a division of Transport Corporation of India
(TCI) in 1989. Mr. Mahendra Agarwal Founder & CEO of Gati Ltd wanted to rebuild TCI based on
processes, systems and manage it professionally to meet consumer implicit and explicit delivery needs.
Over period of 7 years, under the leadership of Mr. Mahendra Agarwal the division flourished into a
small business and in 1994, Gati was ready to separate from TCI and perform on its own. The actual legal
separation took place in 1996 and the division emerged, Gati came into being an 18 Crores cargo
business, splitting from its 200 crores mother company, TCI. From Initial four years of its operation,
delivery commitments took priority over complete utilization of capacity and Gati was focused on to its
aim to provide time bound and point to point delivery..
.

Innovation, Value-addition and growth
Gati introduced desk-to-desk service to meet the price sensitive customer market in 1994. The
placement of desk to desk cargo was between regular transportation and premium cargo.
Premium cargo was next day delivery and Desk to Desk was delivered within four days. As Gati
grew in terms of business volume, services and revenue, Gati made the transition from small
cargo services to cargo management.
This was a period for many firsts. Gati introduced toll-free numbers for the first time in the
Indian logistics segment and became the first 3PL service provider in India. Gati was also the
first logistics company in India to be awarded an ISO 9001 certification.
Gati's legal separation took place from TCI in 1996 through a de-merger process marked a period
of rapid growth as the Gati took over parts of the TCI‟s business, the shipping division was
named as Gati Coast to Coast and the TCI Highways division was taken over by Gati. Gati took
its first steps towards acquiring a corporate identity, the beginnings of Gati Ltd.
Based on volume of traffic, origin and destination, Gati tied up with Indian Airlines (IA) for a
fixed price long term contract. Delivery of premium cargo became easy and accurate. IA
complimented the 550 locations Gati served at that point of time. Gati expanded its service
network to include multi-modal services, courier services and international operations to SAARC
countries. Business grew from servicing 2 regions to 10.
In Jan 2010, Gati went a step forward to help its customer by providing complete integrated
Supply Chain Solution hence becoming a knowledgeable company by launching 'RedSun', Gati's
Supply Chain Division. In Nov 2010, Gati also ventured into E-Commerce business by
launching 'makemygiftz.com', Gati's new web service to offer its customer a complete e-
commerce platform linked to a physical distribution network. Also, Gati Coast to Coast was re-
branded and named as Gati Ships in 2010.
Gati was given the title of “Consumer Super Brand” in 2009-2010, in Logistics

BLUE DART
South Asia's premier courier and integrated express package Distribution Company. We have the
most extensive domestic network covering over 33,742 locations, and service more than 220
countries and territories worldwide through our group company DHL, the premier global brand
name in express distribution services. Our vision is to establish continuing excellence in delivery
capabilities focused on the individual customer. In pursuit of sustainable leadership in quality
services, we have evolved an infrastructure unique in the country today:
The only one of its kind in the country today, that is focused on carriage of packages as its prime
business, rather than as a by-product of a passenger airline. A dedicated aviation system to
support Blue Dart's services is self-sustaining, with its own bonded warehouses, ground handling
and maintenance capability
Fitch Ratings India Pvt. Ltd. has assigned the highest "F1+ (ind)" [F one plus (Ind)] rating for
our short term debt programme of Rs. 30 crores. Further, ICRA Ltd. has also assigned the
highest "A1+" (pronounced A one plus) Rating for our Commercial Paper Programme of Rs. 25
crores.
It has committed, diverse and over 8,318 strong are our most valued asset. All the achievements
have been possible because they have a team who believes in themselves and their company, a
team with a winning attitude.
Social Responsibility is a core element in our corporate strategy. We as a socially responsible
corporate have undertaken numerous steps to give back to communities, in whatever way they
can.

Commitment towards community causes has been unwavering since our inception in 1983. We
as a socially responsible corporate has an in-house Sustainability Team responsible for
identifying and addressing various sustainability issues and supporting initiatives that make the
world a better place for future generations. As part of the DHL Group & in line with its CSR
platform, our major focus areas have been:
- Go Teach (Education)
- Go Green (Environment)
- Go Help (Disaster Management Response
In association with Oasis India (NGO) started an initiative called "Blue Edge - Empowering
Lives", which is aimed at enriching the lives of young adults from difficult environment, who
have not been able to complete their education. Through this initiative we enable around 50
students every six months, by providing training on English Speaking, Computer Skills, Life
Skills and Customer Orientation. Since inception, 524 students have successfully completed this
program and have felicitated at seven Graduation Ceremonies held in Blue Dart headquarters in
Mumbai.
One amongst the biggest concerns facing today's world is global warming. A warmer Earth may
lead to changes in rainfall patterns, a rise in sea level, and a wide range of impacts on plants,
wildlife, and humans. The main cause of Global Warming is emission of CO2. We have
fervently taken up various steps in this regard, to sum up as 'Go Green' initiatives:
In association with Think Foundation (NGO), Sarla Blood Bank and other blood banks regularly
hold Blood Donation Drives at our facilities, to help young Thalassemia patients, who need
blood transfusion every 15 days to survive.
In October 2009, floods at Andhra Pradesh and Karnataka affected hundreds of lives, who lost
their near and dear ones, homes and belongings. To make a difference in the lives of the affected
people, we decided to do something quick and called for support from its Group Company -
DHL. Teams from all Business Units responded fast and a quick plan was worked out to send the
relief material to the affected areas of Karnataka and Andhra Pradesh.
Jointly with their colleagues from DHL,organized Volunteers Day, to promote the spirit of
volunteerism amongst our employees in India.

Location Mapping:
Company Safe Express Gati Blue dart
Scheduled Destinations 582 407 394
City Coverage 442 333 257
District Coverage 250 278 178
582
407
394
Scheduled Destinations
Safe Express
Gati
Blue dart

Safexpress has the highest number of scheduled destinations & city coverage However; Gati
leads the way in district coverage.
All the three companies serve 143 common cities across India.
There are close to 158 cities where only Safexpress is present.
Safexpress & Gati serves 94 cities where blue dart is absent

Scheduled Destination by Zone
Below is the Zone wise Scheduled destination of all 3 companies
Company Safe Xpress Gati Blue Dart
East 67 79 2
West 217 121 116
North 169 97 109
South 129 110 167
Total 582 407 394
East :
Arunachal Pradesh, Assam , Bihar , Chhattisgarh, Jharkhand , Manipur, Meghalaya, Mizoram,
Nagaland, Orissa, Sikkim, Tripura, West Bengal, Andaman & Nicobar
West
Gujarat, Madhya Pradesh, Maharastra, Daman, Diu, Dadra & Nagar Haveli, Goa.
North
Jammu & Kashmir, Himachal Pradesh, Punjab, Haryana, Rajasthan, Uttar Pradesh, UttraKhand,
Chandigarh, Delhi
South
Andhra Pradesh, Karnataka, Kerala, Tamil Nadu, Pondicherry, Lakshadweep

Graphical Analysis of Scheduled Destination
0
20
40
60
80
100
120
140
160
Safe Xpress Gati Blue Dart
East 67 79 2 148
6779
2
148
East
East
0
50
100
150
200
250
300
350
400
450
500
Safe Xpress Gati Blue Dart
West 217 121 116 454
217
121 116
454
West
West

0
50
100
150
200
250
300
350
400
450
Safe Xpress Gati Blue Dart
South 129 110 167 406
129110
167
406
South
South
0
50
100
150
200
250
300
350
400
Safe Xpress Gati Blue Dart
North 169 97 109 375
169
97 109
375
North
North

CITY COVERAGE BY ZONE
Zone Safe Express Gati Blue Dart
East 61 72 2
West 128 86 66
North 150 89 74
South 103 86 115
Total 442 333 257
Safe Express Gati Blue Dart
East 61 72 2 135
6172
2
135
0
20
40
60
80
100
120
140
160
East
East
Safe Express Gati Blue Dart
West 128 86 66 280
128
8666
280
0
50
100
150
200
250
300
West
West

Safe Express Gati Blue Dart
South 103 86 115 304
10386
115
304
0
50
100
150
200
250
300
350
North
South
Safe Express Gati Blue Dart
South 103 86 115 304
10386
115
304
0
50
100
150
200
250
300
350
South
South

District Coverage By Zone
Safe Express Gati Blue Dart
East 45 62 2
West 57 66 46
North 94 84 65
South 54 66 67
total 250 278 180
Graphical Comparison of District Zone Wise
0
50
100
150
Safe Express Gati Blue Dart
District Wise Zone Coverage
East 45 62 2 109
4562
2
109
East
East
020406080
100120140160180
Safe Express Gati Blue Dart
District Wise Zone Coverage
West 57 66 46 169
57 6646
169
West
West

0
50
100
150
200
250
Safe Express Gati Blue Dart
District Wise Zone Coverage
North 94 84 65 243
94 8465
243
North
North
0
50
100
150
200
Safe Express Gati Blue Dart
District Wise Zone Coverage
South 54 66 67 187
5466 67
187
South
South

From going through all the data and Analyzing the Graph we come with some of the Conclusion
that is as mentioned below:
Safexpress is leading the way in Western &Northern region of India, In terms of scheduled
destination and City coverage.
Gati is leading the way in the Eastern part of the country Whereas Strength of Blue dart lies into
Southern India
Safexpress has the highest district Coverage in Northern India, Gati leads in Eastern & Western
Part Whereas Blue dart leads into southern India.
0
10
20
30
40
50
60
70
80
90
100
Safe Express Gati Blue Dart
45
62
2
57
66
46
94
84
65
54
66 67
Comparision of all companies zone wise respectively
East
West
North
South

Mapping of Zone Matrix & Transit Time Policy
Common Guidelines:
1. Transit Time excludes booking and delivery days
2. Extra transit days for delivery at ODA locations.
3. Booking after pickup cut off time is considered as next day pickup
4. Transit time may increase if there is any holidays/Strikes/rallies at the destination
Method of Calculation
1. Safexpress has ready transit time matrix
2. For Gati, It has been calculated using web based transit time calculator (Sample size 50+
cities).
3. To find out transit time From & To each Zone, 4-5 city samples has been taken which
includes Tier1, Tier2 and Tier 3 cities
Safexpress Zone Matrix Zone States
North One Delhi , UP, Haryana, Rajsthan
North Two Chandigarh, Punjab, Himachal, Uttranchal, J & K
East West Bengal , Orissa, Bihar , Jharkhand, Chattisgarh
North East Assam , Meghalaya, Tripura, Arunachal, Mizoram , Manipur, Nagaland, Sikkim
West One Gujrat, Daman& Diu , Dadra & Nagar Haveli
West Two Maharsatra, Goa
South One AP, Karnatka, TamilNadu, Pondicherry
South Two Kerla
Central Madhya Pardesh

Transit
Time
Ex/To North One
North two East
North East
West One West Two
South One
South Two Central
North One 2 2 5 6 3 4 4 5 3
North Two 2 2 5 6 4 4 5 5 3
East 4 5 2 3 4 5 4 5 3
North East 4 5 3 2 5 5 5 6 4
West One 3 4 5 6 2 2 4 5 3
West Two 4 5 5 6 2 2 3 5 3
South One 4 5 5 6 4 3 2 3 3
South Two 5 5 5 6 4 4 2 2 3
Central 3 4 5 6 2 3 3 5 2
0123456
North One
North two
East
North East
West One West Two
South One
South Two
Central
Ex/To Transit Time for Safexpress
North One North Two East North East West One
West Two South One South Two Central

GATI Zone Matrix
EDC States
AMC Punjab, Haryana, Himachal
AMD Gujarat, Daman Diu, Dadra & Nagar Haveli
BLR Karnataka and Hosur
BOM Mumbai, Thane, Panvel, Bhivandi
CCU West Bengal, Sikkim
CJB Western Tamil Nadu , Kerala
GUA Assam
HYD Andhra Pradesh
IDR Madhya Pradesh
JAI Rajasthan
JSP Bihar , Odisha, Jharkhand
LKO Central UP , Eastern UP
MAA Northern Tamil Naidu , Pondicherry , Port Blair
NAG Vidharbha, Chhattisgarh
NCR National Capital Region , Gurgaon
NDA Western UP (Ghaziabad, Noida), UttraKhand
PNQ Rest of Maharastra & Goa- Ex.Vidharbha & Mumbai
NE1 Meghalaya, Mizoram, Tripura, Arunachal Pradesh
NE2 Manipur & Nagaland
J& K Jammu & Kashmir
0
2
4
6
8
10
12AMC
AMDBLR
BOM
CCU
CJB
GUA
HYD
IDRJAI
JSPLKO
MAA
NAG
NCR
NDA
PNQ
NE1
NE2J& K
GATI TRANSIT TIME GRAPH
AMC
AMD
BLR
BOM
CCU
CJB
GUA
HYD
IDR
JAI

Transit Time Table for GATI
For Gati, It has been calculated using web based transit time calculator (Sample
size 50+ cities).
To/Ex AMC AMD BLR BOM CCU CJB GUA HYD IDR JAI JSP LKO MAA NAG NCR NDA PNQ NE1 NE2 J&K
AMC 2 4 5 4 5 5 9 4 4 2 5 4 5 4 4 2 4 11 9 4
AMD 2 2 4 2 7 4 9 4 2 2 5 4 4 4 4 4 2 9 9 4
BLR 7 4 2 4 4 2 7 2 4 4 5 4 2 4 4 4 2 12 9 8
BOM 4 2 4 2 5 4 9 4 4 4 5 4 4 2 4 4 2 12 9 7
CCU 4 5 4 5 2 5 7 4 5 5 2 4 4 4 5 4 5 4 7 7
CJB 7 5 2 4 5 2 9 4 5 5 7 5 4 4 5 5 4 12 9 8
GUA 8 8 7 8 4 8 2 7 7 9 5 5 7 7 8 7 8 2 2 11
HYD 4 4 2 2 4 4 7 2 2 4 4 4 2 2 4 4 2 9 9 7
IDR 4 2 4 4 5 4 9 2 2 2 4 4 4 4 4 4 2 9 9 4
JAI 7 2 5 4 5 5 9 4 2 2 7 4 5 4 2 4 4 11 9 4
JSP 7 7 7 7 2 6 5 5 5 5 2 4 5 5 8 4 5 7 7 7
LKO 4 4 5 5 5 6 9 4 4 4 5 2 5 4 4 2 5 10 9 7
MAA 7 4 1 4 5 4 7 2 4 4 5 5 2 4 4 7 4 11 9 8
NAG 4 4 4 2 4 4 7 2 2 4 4 2 4 2 4 4 2 9 9 7
NCR 2 2 4 4 5 5 9 4 2 2 5 2 4 4 2 2 4 11 9 4
NDA 2 4 5 4 4 6 9 4 4 2 4 2 5 4 2 2 4 10 9 7
PNQ 4 2 2 2 5 4 9 2 4 4 4 4 4 2 4 4 2 11 9 7
NE1 11 11 11 11 4 11 2 11 8 9 5 11 10 7 12 11 11 2 4 12
NE2 9 9 9 9 4 9 2 9 8 9 7 7 9 7 9 9 9 2 2 11
J& K 4 7 9 7 9 8 10 7 7 5 8 7 9 7 8 5 7 10 10 2
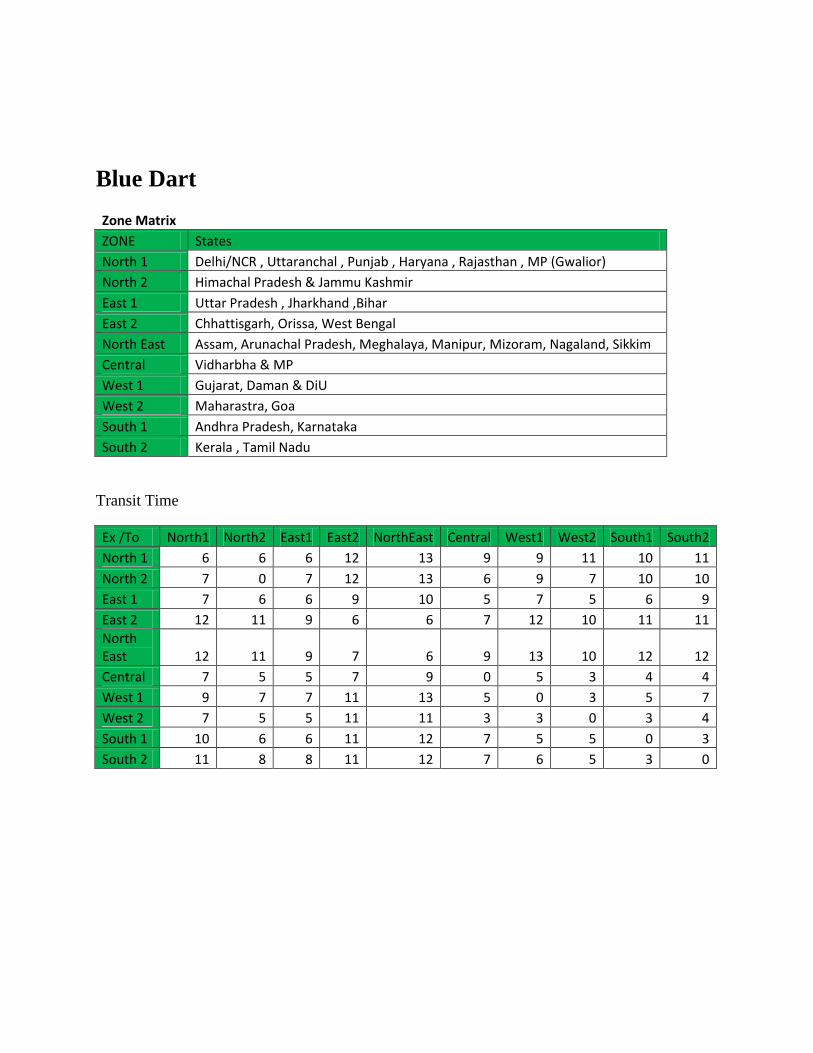
Blue Dart
Zone Matrix ZONE States
North 1 Delhi/NCR , Uttaranchal , Punjab , Haryana , Rajasthan , MP (Gwalior)
North 2 Himachal Pradesh & Jammu Kashmir
East 1 Uttar Pradesh , Jharkhand ,Bihar
East 2 Chhattisgarh, Orissa, West Bengal
North East Assam, Arunachal Pradesh, Meghalaya, Manipur, Mizoram, Nagaland, Sikkim
Central Vidharbha & MP
West 1 Gujarat, Daman & DiU
West 2 Maharastra, Goa
South 1 Andhra Pradesh, Karnataka
South 2 Kerala , Tamil Nadu
Transit Time
Ex /To North1 North2 East1 East2 NorthEast Central West1 West2 South1 South2
North 1 6 6 6 12 13 9 9 11 10 11
North 2 7 0 7 12 13 6 9 7 10 10
East 1 7 6 6 9 10 5 7 5 6 9
East 2 12 11 9 6 6 7 12 10 11 11
North East 12 11 9 7 6 9 13 10 12 12
Central 7 5 5 7 9 0 5 3 4 4
West 1 9 7 7 11 13 5 0 3 5 7
West 2 7 5 5 11 11 3 3 0 3 4
South 1 10 6 6 11 12 7 5 5 0 3
South 2 11 8 8 11 12 7 6 5 3 0
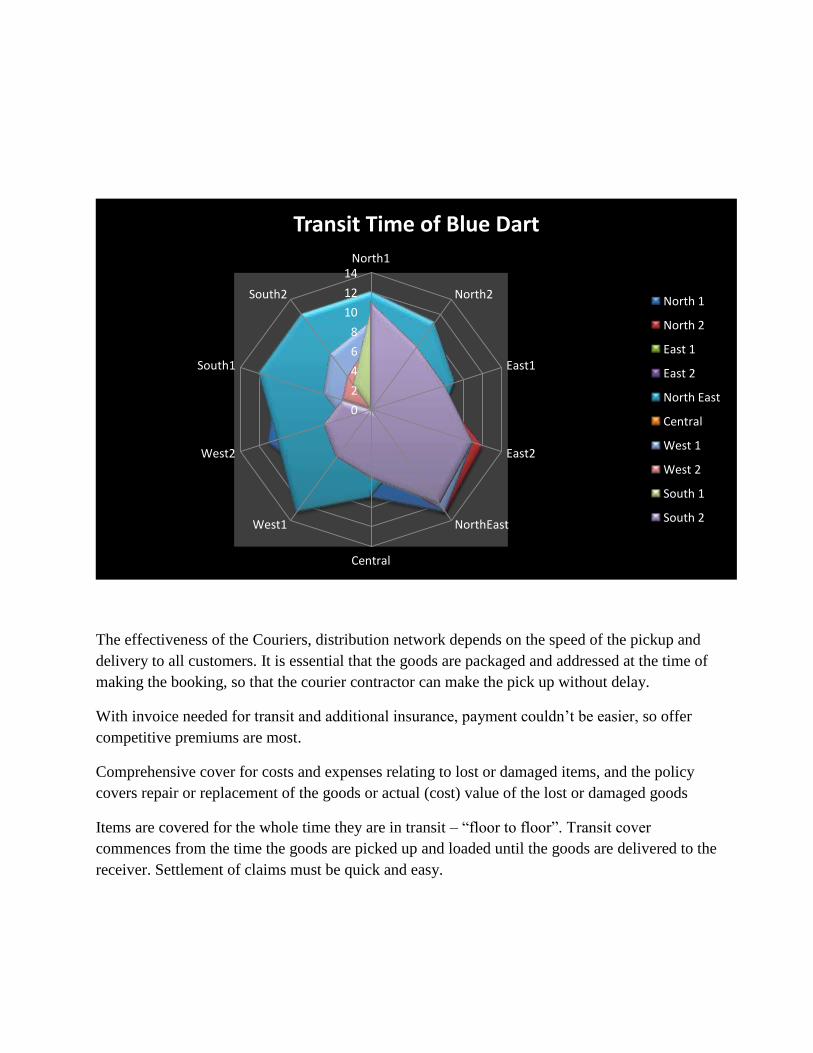
The effectiveness of the Couriers, distribution network depends on the speed of the pickup and
delivery to all customers. It is essential that the goods are packaged and addressed at the time of
making the booking, so that the courier contractor can make the pick up without delay.
With invoice needed for transit and additional insurance, payment couldn‟t be easier, so offer
competitive premiums are most.
Comprehensive cover for costs and expenses relating to lost or damaged items, and the policy
covers repair or replacement of the goods or actual (cost) value of the lost or damaged goods
Items are covered for the whole time they are in transit – “floor to floor”. Transit cover
commences from the time the goods are picked up and loaded until the goods are delivered to the
receiver. Settlement of claims must be quick and easy.
0
2
4
6
8
10
12
14North1
North2
East1
East2
NorthEast
Central
West1
West2
South1
South2
Transit Time of Blue Dart
North 1
North 2
East 1
East 2
North East
Central
West 1
West 2
South 1
South 2

Logistics Industry Updates
Air Cargo terminal has been started in Ozark , Nasik
Hyderabad Airport recognized as "Best Cargo Terminal of The Year" from Cargo Association of
India (ACCAI)
Railways Carried 647 MT freight in Apr-Nov 2012
Swiss World Cargo - The first Carrier to join proof of concept of IATA's multilateral e-Air Way
bill Agreement initiative
Express Industry Council of India (EICI) has alleged the domestic airlines have formed a price
cateral that is exploiting the levy of fuel Surcharge (FSC) on cargo by noy applying a rational
Pricing mechanism for the same
Competetion Updates
APL Logistics & Vescor has announced the formation of JV to serve automotive industry in
India . APL logistics is leader in expert in automotive logistics especially finished vehicle
logistics
SpoyOn has updated the It system i.e. Spot connect wherein the customer can have their own
portal which provide POD, Tracking Visibility, invoices and e-billing
Red Express has started sending bulk advertising emails
DB Schenker in Ban lore , focusing on last mile delivery
Geodic, the 4th largest Player of Europe is increasing their presence as in last four years they
have expanded from 7 to 17 locations
Indospsce has inaugurated logistic park at chakan
Indo Arya embarked upon creation of 4 Logistics Park, 2 lac sq. feet each. Currently, company
has over 4 million ware housing space.

Financial Mapping of Competition
1. Quarterly Basis
Month BLUE dart GATI safe EXPRESS
Apr-Jun10-11 394 277 208
Juk-sep 10-11 442 294 226
Oct -Dec 10-11 444 319 225
Jan -March 10-11 479 337 229
Apr _june 11-12 416 372 225
Jun -sep 11-12 453 389 236
Oct -Dec 11-12 464 395 236
Jan-mar-11-12 496 411 212
Apr-jun12-13 457 432 288
Jul-sep12-13 470 418 298
Oct-Dec12-13 492 459 327
Jan-March 12-13 532 446 315
9.27.1 7.5
10.79.2
7.75.7
7.19.4
7.79.8 9.42.5
1.7 1.41.6
1.41.4 2.3 0.4
13.7
-2.6
1.5 1.8
3.13.3 2.7
2.7 3.23 2.9 2.3
3
2.8
2.3 2.6
0
5
10
15
20
25
30
Axi
s Ti
tle
Financial Mapping Quaterly basis
safe EXPRESS
GATI
BLUE dart

2. On Yearly Basis Analysis
Year BLUE dart (in crores) GATI (in crores) safe EXPRESS (in crores)
2010-11 1759 1228 892
2011-12 1829 1567 941
2012-13 1952 1755 988
When looked into quarterly performance, Gati has nearly steady growth till the end of 2011-12
which started growing rapidly in 2012-13 but Blue Dart has shown nearly constant growth
The Key Competition of Safexpress i.e. Gati, Blue Dart has Touched respective revenue of INR
1228 crores, INR 1755 Crores in 2012-13. Also Safe express grew steadily where as Gati and
Blue Dart Grew Close to 35.09% and 11.99% respectively over previous year.
1759 18291952
1228
15671755
892 941 988
0
500
1000
1500
2000
2500
2010-11 2011-12 2012-13
BLUE dart (in crores)
GATI (in crores)
safe EXPRESS (in crores)

Profit before interest tax and exceptional items
1. Quarterly basis analysis
Month BLUE dart GATI safe EXPRESS
Apr-Jun10-11 36.8 22.3 16.9
Jul-sap 10-11 31.1 16.9 27.4
Oct -Dec 10-11 36.1 16.2 25.5
Jan -March 10-11 51.8 30.2 20.8
Apr _june 11-12 50.3 25.7 17.6
Jun -sep 11-12 44.1 28.1 19.3
Oct -Dec 11-12 32.8 29.4 21.9
Jan-mar-11-12 44.1 27.7 19.5
Apr-jun12-13 58.1 28.5 92.2
Jul-sep12-13 45.5 25.2 15.1
Oct-Dec12-13 65.2 23.5 23.6
Jan-March 12-13 58.4 31.1 14.2
Note: All the data are in crores
0
0.5
1
1.5
2
2.5
3
3.5
0
5
10
15
20
25
Quaterly analysis of Profit/Loss
GATI
BLUE dart
safe EXPRESS

2. Yearly Data Analysis of Profit before interest tax and exceptional items
Blue Dart (in
crores) Gati (In crores)
Safexpress(In crores)
2010-11 156 105 71
2011-12 171 111 78
2012-13 227 145 145
Through Safexpress was on the top of the list in term of revenue generation but due to more
business from low margin FTL (Close to 72 % ) The company stood at the bottom while
calculating PBIT
Blue dart has achieved much higher PBIT When compared with Gati and Safexpress due to more
business from high margin Air shipments On the other hand side, Gati has the lower PBIT till
2011-12 but they kept an eye on cost which resulted into higher PBIT next year
While looking up into the quarterly result , shooting u of Gati's PBIT in the month of Apr - June
12 -13 outshines , as the company has transferred substantial part of its express distribution &
Supply chain business [EDSC] to Gati-Kintetsu PVT Ltd Moreover, the company transferred its
shipping business to Gati PVT Ltd .
107 115
160
16 11
4251 52 52
2010-11 2011-12 2012-13
Yearly analysis ofProfit before interest tax and exceptional items
Blue Dart Gati Safexpress

Net Profit Loss Comparison
Quarterly Graph presentation
Month BLUE dart (In crores) GATI (In crores) safe EXPRESS (In
crores)
Apr-Jun10-11 25.6 5.1 12.2
Juk-sep 10-11 21 3.8 14.5
Oct -Dec 10-11 24 3.1 11.8
Jan -March 10-11 36.1 3.6 12.8
Apr _june 11-12 34 3.2 13.4
Jun -sep 11-12 29.8 3.8 13.8
Oct -Dec 11-12 22.4 5.3 13.5
Jan-mar-11-12 29.1 0.9 11.2
Apr-jun12-13 40.6 40.6 13.6
Jul-sep12-13 32.2 -7.8 13.1
Oct-Dec12-13 45 5.1 11.3
Jan-March 12-13 41.8 5.7 13.9
0
0.5
1
1.5
2
2.5
3
3.5
0
5
10
15
20
25
Quaterly analysis of Profit/Loss
GATI
BLUE dart
safe EXPRESS

Yearly Analysis of Profit /Loss
Year Blue Dart Gati Safexpress
2010-11 107 16 51
2011-12 115 11 52
2012-13 160 42 52
Analysis :
Continuously increasing over the income, Control over operating expenditure, no interest cost
etc. has allowed Blue Dart to increase profits year after which have reached INR 160 Crores by
2012-13.
In 2012-13, Gati has transferred its EDSC & Shipping business to its subsidiary company due to
which the liquidity inflow occurred and profit of the company has touched INR 42 Crores. From
last three YearProfit of TCI has been nearly constant which stood at INR 52 Crores by 2012-13.
107115
160
16 11
4251 52 52
2010-11 2011-12 2012-13
Net profit Yearly basis
Blue Dart Gati Safexpress

Operation Profit Margin & Net profit Margin Analysis
1. Operating Profit Margin Percentage and its Graphical analysis
Month BLUE dart GATI safe EXPRESS
Apr-Jun10-11 13 8.1 5.5
Juk-sep 10-11 10.2 7.5 6.2
Oct -Dec 10-11 10.8 7.2 5.6
Jan -March 10-11 14.2 9.1 6.4
Apr _june 11-12 12.3 7.8 6.2
Jun -sep 11-12 9.9 6.2 6.2
Oct -Dec 11-12 6.6 9.4 5.8
Jan-mar-11-12 9.1 6.4 5.5
Apr-jun12-13 11.6 -1.6 5.9
Jul-sep12-13 9 8.8 5.2
Oct-Dec12-13 12.4 3.9 4.8
Jan-March 12-13 11.2 3.7 5.4
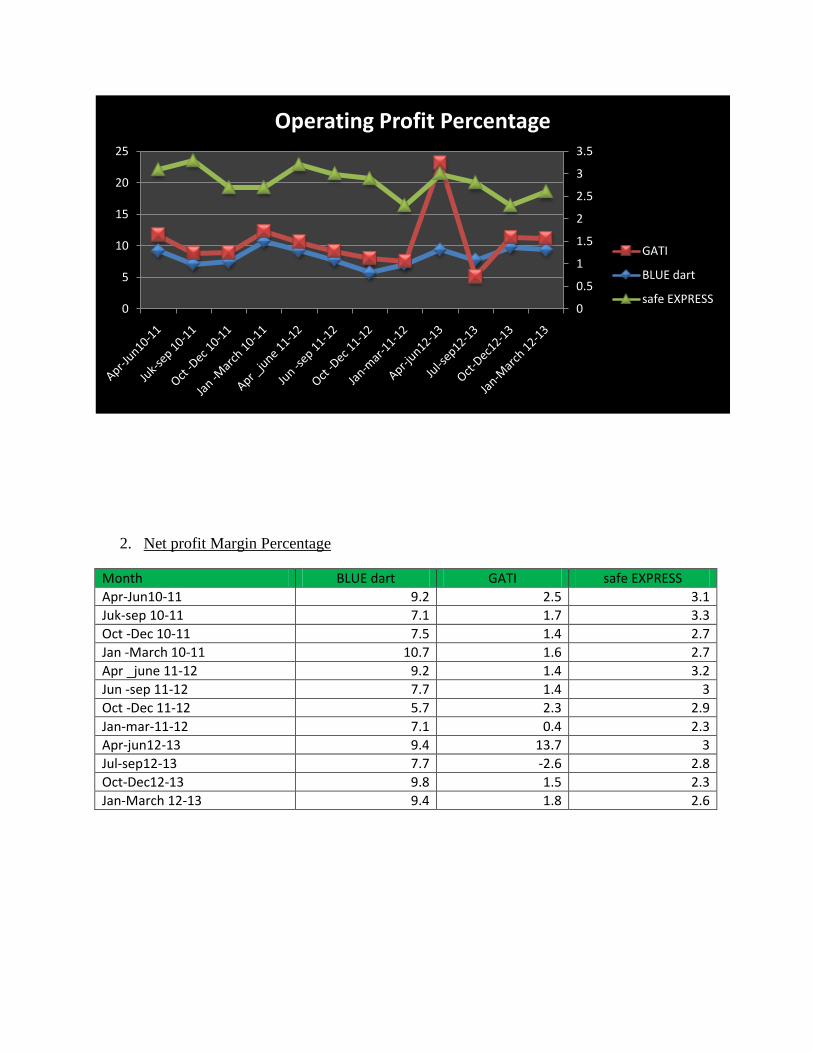
2. Net profit Margin Percentage
Month BLUE dart GATI safe EXPRESS
Apr-Jun10-11 9.2 2.5 3.1
Juk-sep 10-11 7.1 1.7 3.3
Oct -Dec 10-11 7.5 1.4 2.7
Jan -March 10-11 10.7 1.6 2.7
Apr _june 11-12 9.2 1.4 3.2
Jun -sep 11-12 7.7 1.4 3
Oct -Dec 11-12 5.7 2.3 2.9
Jan-mar-11-12 7.1 0.4 2.3
Apr-jun12-13 9.4 13.7 3
Jul-sep12-13 7.7 -2.6 2.8
Oct-Dec12-13 9.8 1.5 2.3
Jan-March 12-13 9.4 1.8 2.6
0
0.5
1
1.5
2
2.5
3
3.5
0
5
10
15
20
25
Operating Profit Percentage
GATI
BLUE dart
safe EXPRESS

Gati & Safexpress pays much interest due to which their bottom lines get affected. The interest
coverage ratio determines that how easily a company can pay interest expenses on
outstandingdebt. The lower the ratio, the more the company is burdened by debt expenses;it
should be above 1.5 In case of Gati it went 1.43 in 2011-12 which means its ability to meet
interest expenses may be questionable. Safe express has kept the ratio between3.34 to 4.14 which
is far better thanGati. It does not applicable to Blue Dart as the company has not taken any debt
which shows that company has sufficient Liquidity.
Refrences
www.bluedart.com
http://www.gati.com/ www.safeguard.com Different Logistic Magazine en.wikipedia.org/wiki/Logistics
0
0.5
1
1.5
2
2.5
3
3.5
0
5
10
15
20
25
Net Profit Margin Percentage
GATI
BLUE dart
safe EXPRESS