Author’s Name/s Goes Here Title goes here Author’s Name/s Goes Here Title goes here
Upload
arline-kennedyCategory
view
229download
1
Project Name & Number Goes Here
PI NamePI Organization
PI PhonePI E-Mail Address
EventDate
2
Project Team
• This slide should list the names of the PI and co-performer(s), and their organization(s). – For many LMR projects your team may have partnerships with other presenters, or
with ONR, SERDP or others. Please list all partner efforts that are part of enabling your project to reach your objectives.
• NOTE: Throughout this briefing/presentation template, suggestions are provided as to the number of slides that can be used to address a particular section of the brief (not including backup slides). Please keep in mind the time allocated for your presentation and allow ample time for questions. Because this is the first review of this program, expect longer than usual question-and-answer and discussion time, as reflected in the draft agenda.
• You may make slight reordering changes to fit your style, but be sure to address the basic presentation information needs in the approximate order of this template.

3
Introduction
• Outline for this brief• Include a picture or diagram if appropriate• Is your project on schedule & within budget If not,
all issues should be on slide 14• Mention if this project is a leveraged project• Introduce stakeholders, partners and end users in
the audience or on the phone• Is this a New Start or an on-going effort (say Year x
of Year x)
4
Technical Objectives
• Briefly state the overall technical objective(s) of the project
• State/explain the Navy benefits of this project
• How does it help satisfy a Navy requirement?

5
Technology Description
• Briefly describe the new knowledge, methodology, or technology that is being demonstrated in the project; if you are doing a study vice technology, describe the study
• Identify and briefly describe the demonstration site(s)/range(s) if applicable. (Note: This is not intended to be general information on a facility, but specific information on aspects of a site as they relate to the project).
• Indicate any permits that may be required• NOTES: This slide is flexible depending on the type of
your project– This section may encompass several (2-4) slides.– Liberal use of schematic diagrams, tables, and figures is
encouraged.

6
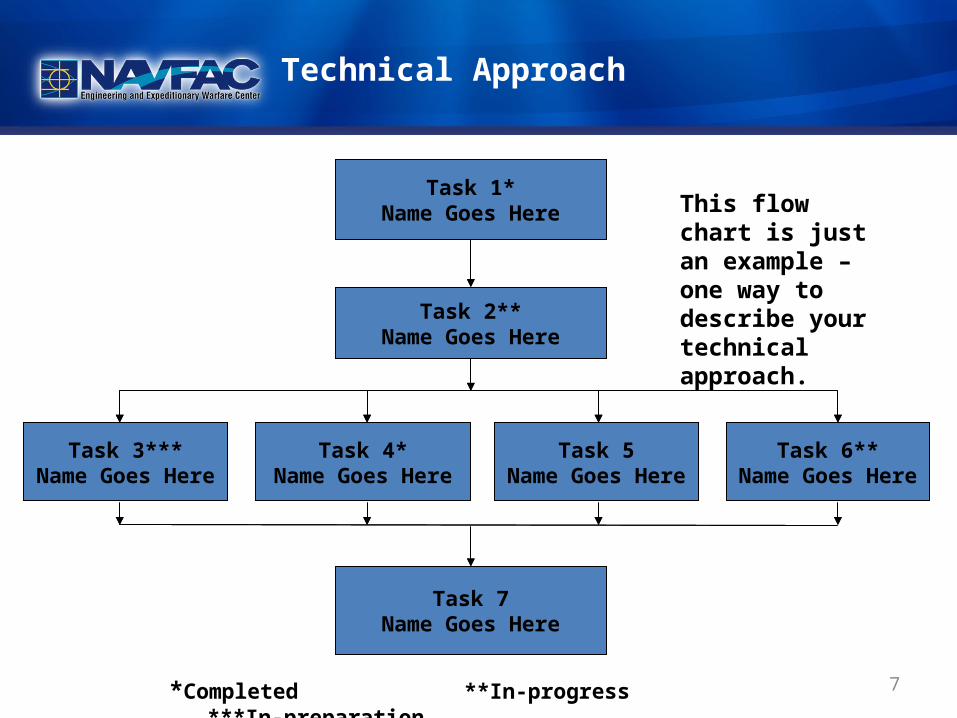
Technical Approach
• Describe your technical approach to the project
• Include a diagram if useful
7
Technical Approach
Task 1*
Task 2**
Task 3*** Task 4* Task 5 Task 6**Name Goes Here
Task 7
Task 1*Name Goes Here
Task 2**Name Goes Here
Task 3***Name Goes Here
Task 4*Name Goes Here
Task 5Name Goes Here
Task 7Name Goes Here
*Completed **In-progress ***In-preparation
This flow chart is just an example – one way to describe your technical approach.

8
Performance Criteria
Performance Objective
Metric Data Requirements Success Criteria
Quantitative Performance Objectives
Quantitative Performance Objectives

9
Performance Criteria (Example)
PerformanceObjective
MetricData
RequirementsSuccess Criteria
Quantitative Performance Objectives
Canopy landing of baitsPercentage of baits in canopy Number of baits in canopy
(radio telemetry)≥ 80% baits in canopy
Bait take of treated DNM by BTS
Percentage of baits taken by BTS Number of baits taken (radio telemetry)
Number of deployments needed for reducing treated bait take 80-90%
Monitoring of BTS activity BTS consumption of untreated DNM
Number of baits taken (bait station transects)
Deployment interval for maintaining BTS activity at 20-30%
Rodent activityIncreased rodent abundance as BTS are removed
Number of rats captured (live trap transects)
≤ 10% increase
Non-target impacts (crabs, Monitor lizards)
Number of non-targets identified Number of baits taken by non-targets
≤ 10% bait take
Qualitative Performance Objectives
Ease of bait production Efficiency of personnel to produce baits
Personnel feedback on time required to produce baits
Maximum bait production
Ease of bait delivery Efficiency of personnel to deploy baits
Personnel feedback on time required to deploy baits
Maximum bait deployment

10
Performance Criteria (Example)
Performance Objective
MetricData
RequirementsSuccess Criteria and Outcome
Quantitative Performance Objectives
Environmental
Safeguard waterways by lowering acute toxicity
LC50 Data on acute and chromic toxicity
LC50 > LC50 for KAc-RDF Success
Safeguard waterways by lowering chronic toxicity
IC25 IC25 > IC25 for KAc-RDF Success
Safeguard waterways by controlling oxidative load
COD and BOD5 Wastewater treatment load and surcharge costs
COD between COD of KAc and KAC-PG RDFsBOD between BOD for KAc and KAC-PG RDFs
Success
Corrosion
Maintain life of Cd-plated parts
Weight change mg/cm2/24 hr Data to estimate component life Lower corrosion rate per std Cd-corrosion test compared to KAc RDF
Success
Maintain life of brake pads Weight lost, % Data to estimate brake pad life Lower weight loss per C-C brake pad corrosion test compared to KAc RDF
Success
11
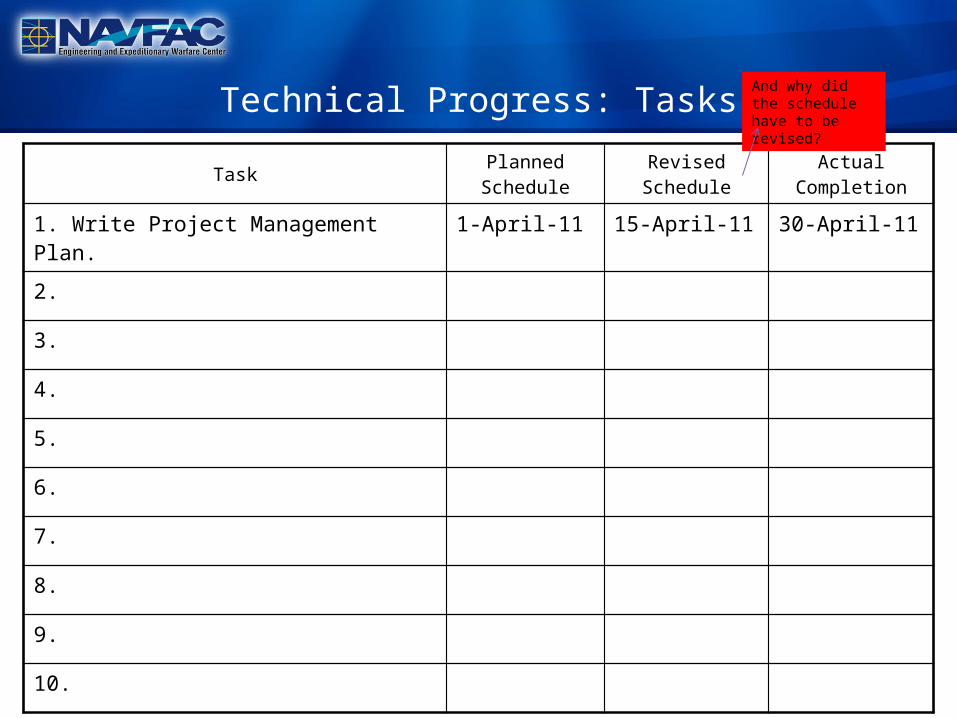
Technical Progress: Tasks
TaskPlanned Schedule
Revised Schedule
Actual Completion
1. Write Project Management Plan. 1-April-11 15-April-11 30-April-11
2.
3.
4.
5.
6.
7.
8.
9.
10.
And why did the schedule have to be revised?
12
Technical Progress: Task X
• Summarize technical progress from project inception (eg. a timeline) and detail the current year progress
• Provide the status of permits, contracts, other critical path items• Describe any significant results associated with evaluation of performance objectives
and cost analyses, if applicable.• Indicate extent to which progress is leading towards attainment of project objectives
• NOTES: – This section should be no more than 8 slides.– The use of graphics/pictures/graphs/tables is strongly encouraged. Ensure font
size on graphics/tables/graphs is large enough to be easily read by the audience and include captions, table headings, axis labels, or legends as applicable.
– Ensure that any quantitative results are accompanied by a description of appropriate statistical analyses.
– This section is expected to make up the majority of your presentation.

13
Technology Integration
• Specifically identify each applicable target audience (i.e., Navy end-users, stakeholders, etc.) and describe the planned technology transfer methodology to target that audience.
• Describe the status of the transfer/implementation of the developed technology.
• Identify obstacles to successful integration. (Where can you use help from the LMR program?)
• Describe planned future technology transfer activities.• If there are any regulatory issues associated with transfer of
the technology, then describe methodology for obtaining regulatory acceptance
• NOTE: Plan to have stakeholder(s) call in or attend the IPR.

14
Issues
• Describe any unanticipated or unresolved issues that are affecting or could possibly affect execution of the project. Include issues that caused your schedule to slip this year.
• If an issue is of such significance that the PI believes additional funding for the project is required, then the nature of the issue, the amount of additional funding required, the reason for the additional funding, and how the additional funding would be spent, should be described. The requested time frame for receipt of the additional funding should also be presented.

15
Project Funding
Performer FY10 ($K) FY11 ($K) FY12 ($K) FY13 ($K) FY14 ($K) Performer Totals ($K)Planned 200 300 250 200 200 1150
Received 200 300 250 0 0 750Planned 250 250 50 50 50 650
Received 250 250 50 0 0 550Planned 25 25 25 20 20 115
Received 25 25 25 0 0 75Planned 50 100 50 50 100 350
Received 50 100 50 0 0 200
Planned 525 675 375 320 370 2265Received 525 675 375 0 0 1575
University X
Company Y
SPAWAR -Direct Cite
Grand Totals
SPAWAR -Reimb
FY12 Expenditures Total FY12 Received
($K)
ObligatedAs of 30 Sept
%Obligated as of 30 Sept
Expended as of 30 Sept
% Expended as of 30 Sept
Planned Obligated as of
31 Mar
Planned % Obligated as of 31 March
Planned Expended
as of 31 Mar
Planned % Expended as
of 31 Mar
Reimburable 275 275 100.00% 200 72.73% 275 100.00% 275 100.00%Direct Cite 100 100 100.00% 50 50.00% 100 100.00% 90 90.00%
Benchmarks March Year 1 Sept Year 1 March Year 2 Sept Year 2
Obligations 65% 95% 97.50% 100%
Expenditures 20% 56% 81.40% 88%
Backup Material
17
Leveraged Project Support
• List the organizations providing in-kind support and include the amount of in-kind support.

18
Acronyms
• Provide a listing of all acronyms and symbols used in the presentation, with definitions
Note: A symbol would be something like Ts standing for specimen temperature. Do not list common unit designations (e.g., mm, kW, lb) or elemental symbols from the periodic table
19
Publications & Conference Presentations
• Provide a list of all publications, oral presentations, patents, awards, etc. that have resulted from this work.
• Provide a list of publications that are in progress or planned (including venue for publication) and oral presentations that are scheduled.