Project ManagementProject Management - Project Management 20 January, 2020 Kanban Features...
172
Project Management Project Management is well served by Sparx Systems Enterprise Architect, applying risk and effort management, metrics and estimation, task and resource allocation, auditing, process guidance, element reviews and discussions, running reports and charts. Enterprise Architect User Guide Series Author: Sparx Systems Date: 2020-01-20 Version: 15.1 CREATED WITH
Transcript of Project ManagementProject Management - Project Management 20 January, 2020 Kanban Features...

Project Management
Project Management is well served by Sparx Systems Enterprise Architect, applying risk andeffort management, metrics and estimation, task and resource allocation, auditing, process
guidance, element reviews and discussions, running reports and charts.
Enterprise Architect
User Guide Series
Author: Sparx Systems
Date: 2020-01-20
Version: 15.1
CREATED WITH
Table of Contents
Project Management 4Kanban Features 6
MDG Technology for Kanban 13Kanban Tasks 15Kanban Diagram Options 21
Kanban Diagram Options - Sub-Lanes 25Kanban Diagram Options - Appearance 27Kanban Diagram Options - Advanced 31Kanban Diagram Options - Filters 33
Default Kanban Diagrams 35Allocating Resources to Work Items 37Related Model Elements 44Managing a Backlog 46Elaboration and Grooming 51Alternative Views 53Other Processes and Methods 57
The Construct View 59The Construct Diagram 61Task Management 62
Project Resources 63Resource Allocation 64
Assign Multiple Resources 67Effort Management 70Risk Management 71Metrics 73Show Project Items in a Diagram 75Effort Types 77Metric Types 79Risk Types 80
Project Task Allocation 81The Project Gantt View 82
Resource View 87Element View 88Report View 89
Progress Bars 91Using Progress Bars 92
Personal Tasks 99Review Allocated Work 100Monitor Your Tasks 103
Project Window 105Testing 107
Test Management 108Create Test Records 110Show Test Script Compartments 113Properties Window for Test Items 115Move or Copy Tests Between Test Classes 116Create Maintenance Item From Test 117
Import Scenario as Test 118Import Test From Other Elements 120Import Requirement or Constraint as Test 122Test Documentation 124
Maintenance 125Working on Maintenance Items 127Create Maintenance Items 129Properties Window for Maintenance Items 132Move or Copy Maintenance Items 133Create Elements From Maintenance Item 134Show Maintenance Items in Diagram 136Changes, Defects and Issues 138
Issues 139Defects 141Changes 143Maintenance Diagram 145
Example Maintenance Diagram 147Update Package Status 148Applying Process Guidance 149Project Issues 152
Add, Delete and Modify Issues 153Report From Project Issues View 155Report Output Sample 156
Project Tasks 157Add, Modify and Delete Tasks 158
Use Case Estimation 160Technical Complexity Factors 161Environment Complexity Factors 163Default Hours 165Estimating Project Size 166
Monitor Change Events 168Model Watches 169
Project Management - Project Management 20 January, 2020
Project Management
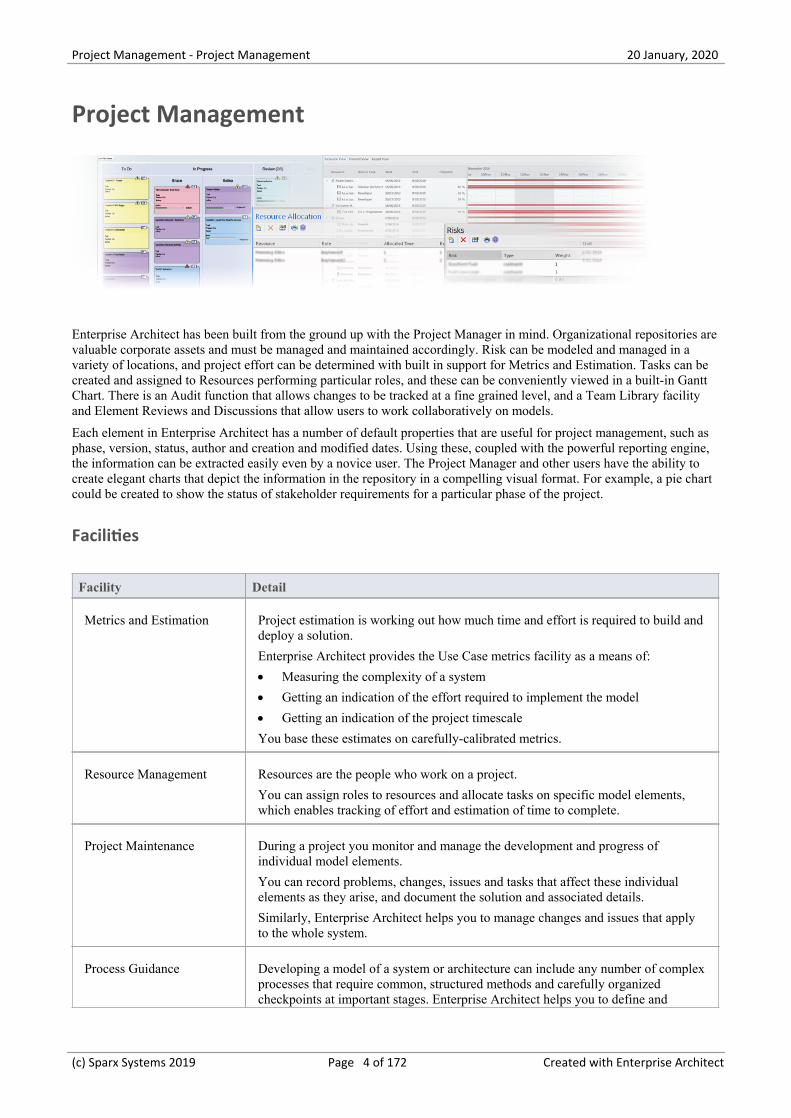
Enterprise Architect has been built from the ground up with the Project Manager in mind. Organizational repositories arevaluable corporate assets and must be managed and maintained accordingly. Risk can be modeled and managed in avariety of locations, and project effort can be determined with built in support for Metrics and Estimation. Tasks can becreated and assigned to Resources performing particular roles, and these can be conveniently viewed in a built-in GanttChart. There is an Audit function that allows changes to be tracked at a fine grained level, and a Team Library facilityand Element Reviews and Discussions that allow users to work collaboratively on models.
Each element in Enterprise Architect has a number of default properties that are useful for project management, such asphase, version, status, author and creation and modified dates. Using these, coupled with the powerful reporting engine,the information can be extracted easily even by a novice user. The Project Manager and other users have the ability tocreate elegant charts that depict the information in the repository in a compelling visual format. For example, a pie chartcould be created to show the status of stakeholder requirements for a particular phase of the project.
Facilities
Facility Detail
Metrics and Estimation Project estimation is working out how much time and effort is required to build anddeploy a solution.
Enterprise Architect provides the Use Case metrics facility as a means of:
Measuring the complexity of a system·
Getting an indication of the effort required to implement the model·
Getting an indication of the project timescale·
You base these estimates on carefully-calibrated metrics.
Resource Management Resources are the people who work on a project.
You can assign roles to resources and allocate tasks on specific model elements,which enables tracking of effort and estimation of time to complete.
Project Maintenance During a project you monitor and manage the development and progress ofindividual model elements.
You can record problems, changes, issues and tasks that affect these individualelements as they arise, and document the solution and associated details.
Similarly, Enterprise Architect helps you to manage changes and issues that applyto the whole system.
Process Guidance Developing a model of a system or architecture can include any number of complexprocesses that require common, structured methods and carefully organizedcheckpoints at important stages. Enterprise Architect helps you to define and
(c) Sparx Systems 2019 Page 4 of 172 Created with Enterprise Architect
Project Management - Project Management 20 January, 2020
represent the organization of such a process by providing a range of ProcessGuidance templates, each of which includes stages, annotated steps for theprocedures at each stage, links to supporting information, and Checklists to becompleted as the required objectives have been achieved.
Project Tasks and Issues In the course of a project, there are various non-technical tasks that are vital to thesuccessful management and completion of the project, such as meetings.
Enterprise Architect helps you to record and monitor these, and to managenon-technical project issues as they arise.
(c) Sparx Systems 2019 Page 5 of 172 Created with Enterprise Architect
Project Management - Project Management 20 January, 2020
Kanban Features
Background
Kanban, which literally translates as Visual (Kan) Card (Ban) or billboard, is an operational method used to increaseefficiency. It was originally developed by the industrial engineer Taiichi Ohno while working at Toyota. Ohno analyzedthe way supermarket shelves are stocked and applied the lessons learnt to the factory floor, creating unprecedentedefficiency. The visual card (Kanban) was used to signal the need for more items to upstream suppliers on the productionline. The Kanban method can be applied to any field, including strategic planning, sales and marketing, and human skillsmanagement, but more recently Kanban has been applied to the process of developing software-centric solutions in anattempt to ensure that value is delivered to the customer as quickly as possible. The information technology industry hasbeen plagued since its beginning with projects running over schedule and over budget, but more significantly failing todeliver value to customers in a time frame that enables them to compete and be successful. These endemic issues havebecome a critical element of business in an age dominated by digital disruption and unprecedented change.
Principles
Kanban is fundamentally very simple and relies on a small number of principles, the origins of which can be attributed tothe engineers at Toyota:
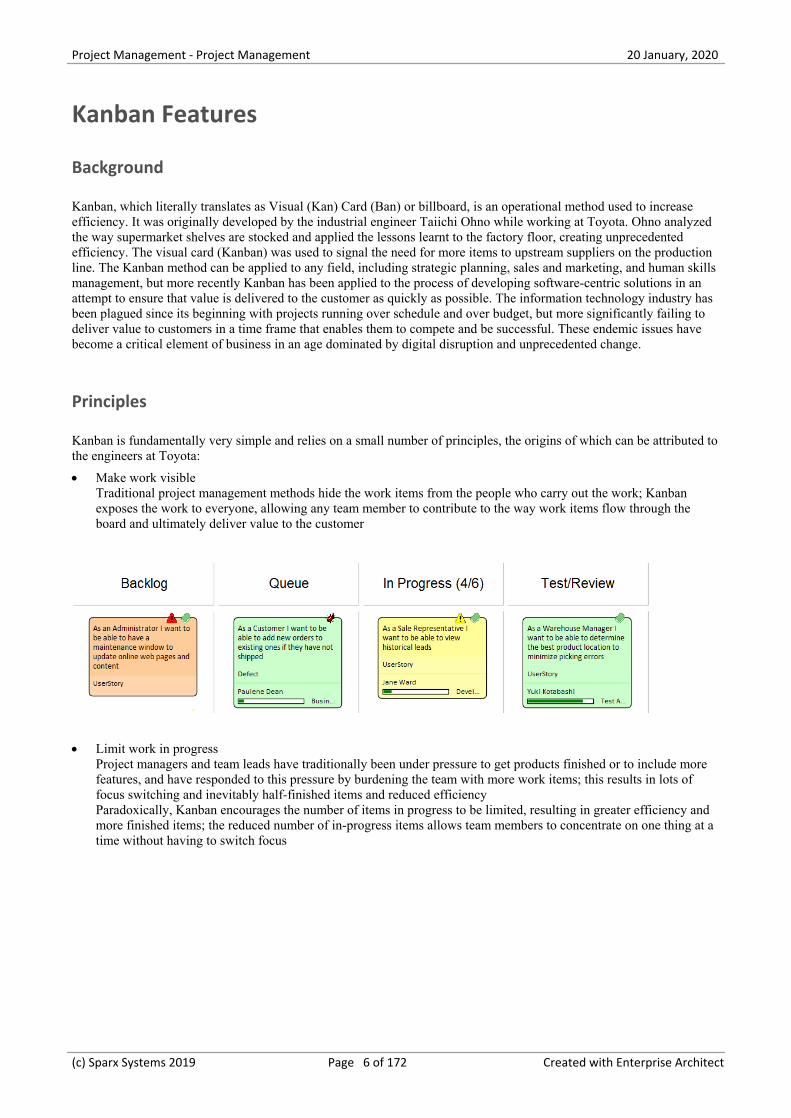
Make work visible·Traditional project management methods hide the work items from the people who carry out the work; Kanbanexposes the work to everyone, allowing any team member to contribute to the way work items flow through theboard and ultimately deliver value to the customer
Limit work in progress·Project managers and team leads have traditionally been under pressure to get products finished or to include morefeatures, and have responded to this pressure by burdening the team with more work items; this results in lots offocus switching and inevitably half-finished items and reduced efficiencyParadoxically, Kanban encourages the number of items in progress to be limited, resulting in greater efficiency andmore finished items; the reduced number of in-progress items allows team members to concentrate on one thing at atime without having to switch focus
(c) Sparx Systems 2019 Page 6 of 172 Created with Enterprise Architect
Project Management - Project Management 20 January, 2020
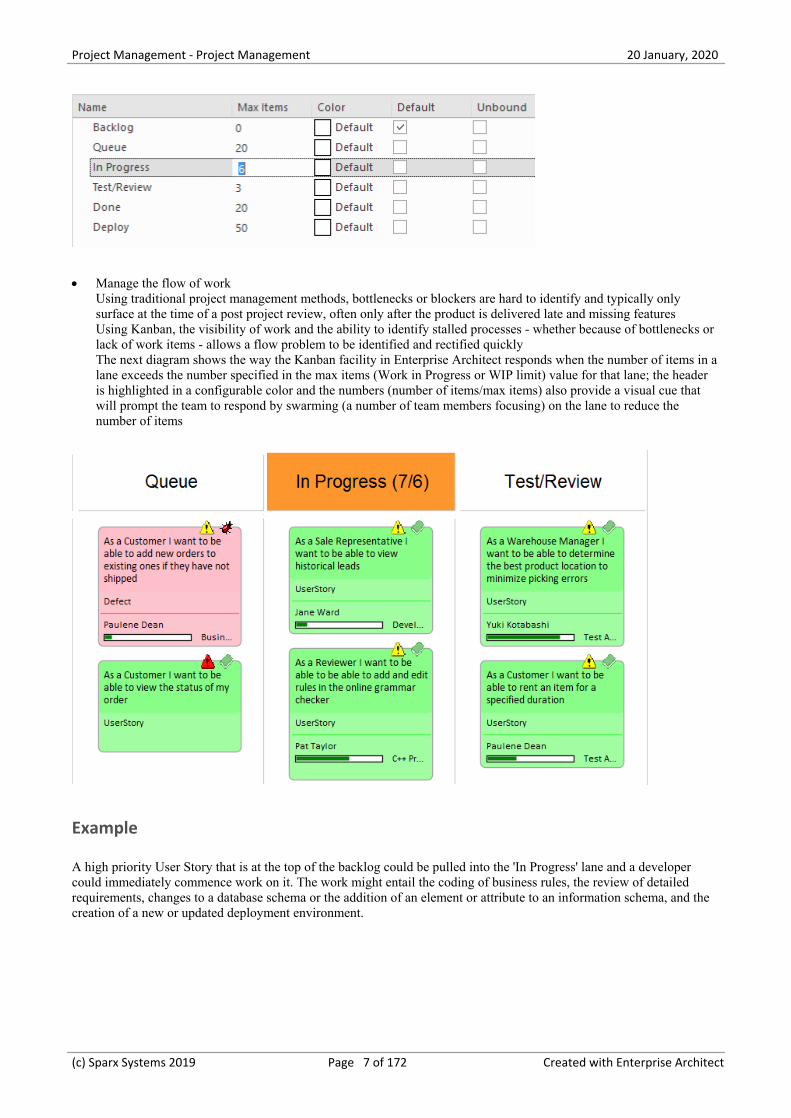
Manage the flow of work·Using traditional project management methods, bottlenecks or blockers are hard to identify and typically onlysurface at the time of a post project review, often only after the product is delivered late and missing featuresUsing Kanban, the visibility of work and the ability to identify stalled processes - whether because of bottlenecks orlack of work items - allows a flow problem to be identified and rectified quicklyThe next diagram shows the way the Kanban facility in Enterprise Architect responds when the number of items in alane exceeds the number specified in the max items (Work in Progress or WIP limit) value for that lane; the headeris highlighted in a configurable color and the numbers (number of items/max items) also provide a visual cue thatwill prompt the team to respond by swarming (a number of team members focusing) on the lane to reduce thenumber of items
Example
A high priority User Story that is at the top of the backlog could be pulled into the 'In Progress' lane and a developercould immediately commence work on it. The work might entail the coding of business rules, the review of detailedrequirements, changes to a database schema or the addition of an element or attribute to an information schema, and thecreation of a new or updated deployment environment.
(c) Sparx Systems 2019 Page 7 of 172 Created with Enterprise Architect
Project Management - Project Management 20 January, 2020
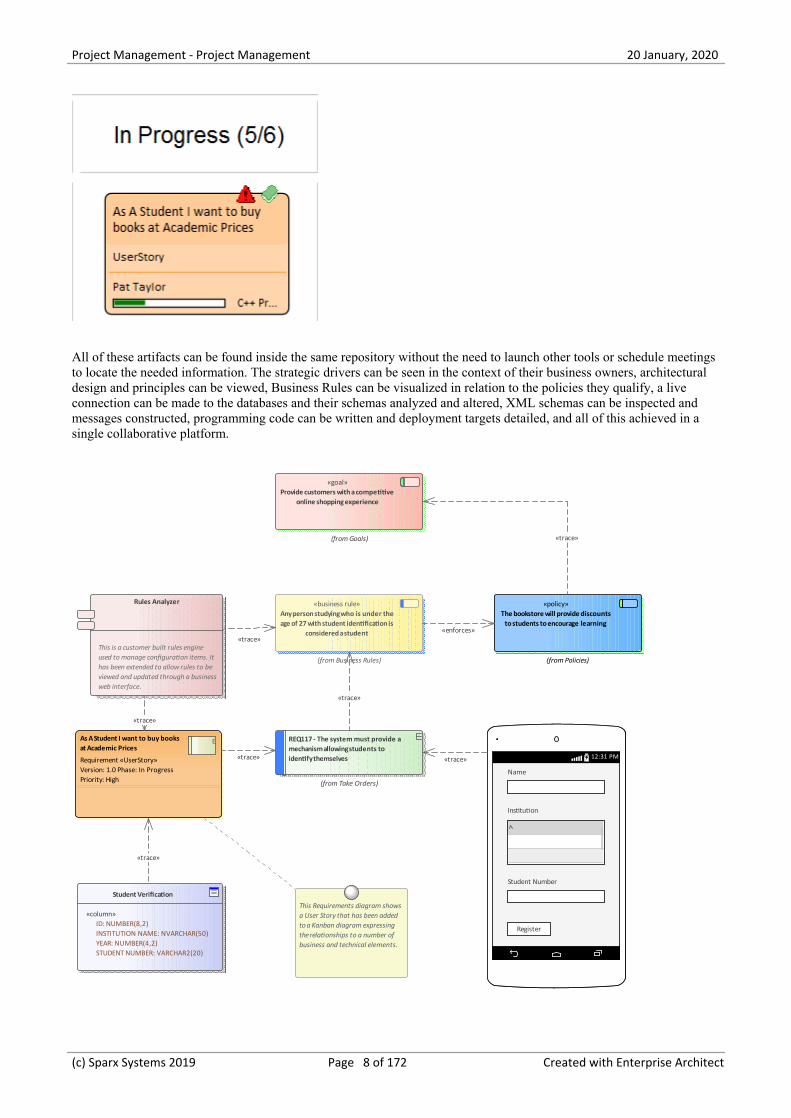
All of these artifacts can be found inside the same repository without the need to launch other tools or schedule meetingsto locate the needed information. The strategic drivers can be seen in the context of their business owners, architecturaldesign and principles can be viewed, Business Rules can be visualized in relation to the policies they qualify, a liveconnection can be made to the databases and their schemas analyzed and altered, XML schemas can be inspected andmessages constructed, programming code can be written and deployment targets detailed, and all of this achieved in asingle collaborative platform.
12:31 PM12:31 PM
REQ117 - The system must provide amechanism allowing students toidentify themselves
(from Take Orders)
As A Student I want to buy booksat Academic Prices
Requirement «UserStory»Version: 1.0 Phase: In ProgressPriority: High
E
«business rule»Any person studying who is under theage of 27 with student identification is
considered a student
(from Business Rules)
«policy»The bookstore will provide discounts
to students to encourage learning
(from Policies)
«goal»Provide customers with a competitive
online shopping experience
(from Goals)
Student Verification
«column» ID: NUMBER(8,2) INSTITUTION NAME: NVARCHAR(50) YEAR: NUMBER(4,2) STUDENT NUMBER: VARCHAR2(20)
Rules Analyzer
This is a customer built rules engine used to manage configuration items. It has been extended to allow rules to be viewed and updated through a business web interface.
This Requirements diagram shows a User Story that has been added to a Kanban diagram expressing the relationships to a number of business and technical elements.
Name
Institution
Student Number
Register
«trace»
«trace»
«enforces»
«trace»
«trace»
«trace»
«trace»
«trace»
(c) Sparx Systems 2019 Page 8 of 172 Created with Enterprise Architect
Project Management - Project Management 20 January, 2020
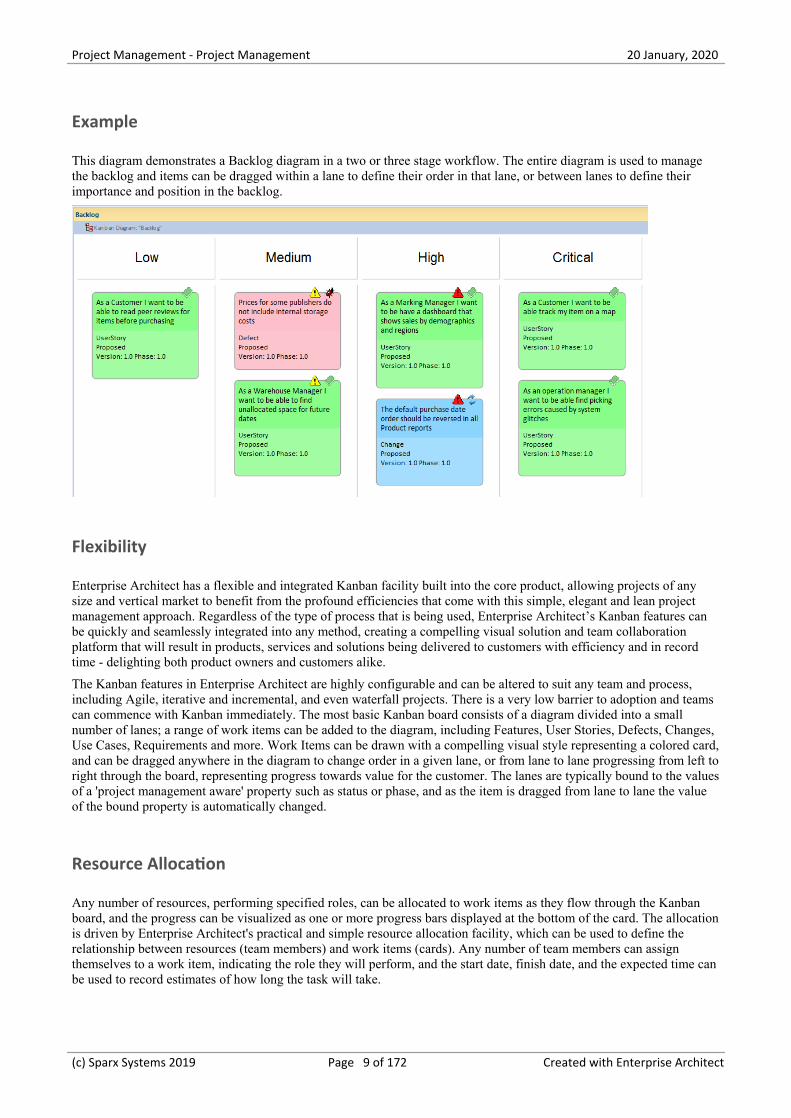
Example
This diagram demonstrates a Backlog diagram in a two or three stage workflow. The entire diagram is used to managethe backlog and items can be dragged within a lane to define their order in that lane, or between lanes to define theirimportance and position in the backlog.
Flexibility
Enterprise Architect has a flexible and integrated Kanban facility built into the core product, allowing projects of anysize and vertical market to benefit from the profound efficiencies that come with this simple, elegant and lean projectmanagement approach. Regardless of the type of process that is being used, Enterprise Architect’s Kanban features canbe quickly and seamlessly integrated into any method, creating a compelling visual solution and team collaborationplatform that will result in products, services and solutions being delivered to customers with efficiency and in recordtime - delighting both product owners and customers alike.
The Kanban features in Enterprise Architect are highly configurable and can be altered to suit any team and process,including Agile, iterative and incremental, and even waterfall projects. There is a very low barrier to adoption and teamscan commence with Kanban immediately. The most basic Kanban board consists of a diagram divided into a smallnumber of lanes; a range of work items can be added to the diagram, including Features, User Stories, Defects, Changes,Use Cases, Requirements and more. Work Items can be drawn with a compelling visual style representing a colored card,and can be dragged anywhere in the diagram to change order in a given lane, or from lane to lane progressing from left toright through the board, representing progress towards value for the customer. The lanes are typically bound to the valuesof a 'project management aware' property such as status or phase, and as the item is dragged from lane to lane the valueof the bound property is automatically changed.
Resource Allocation
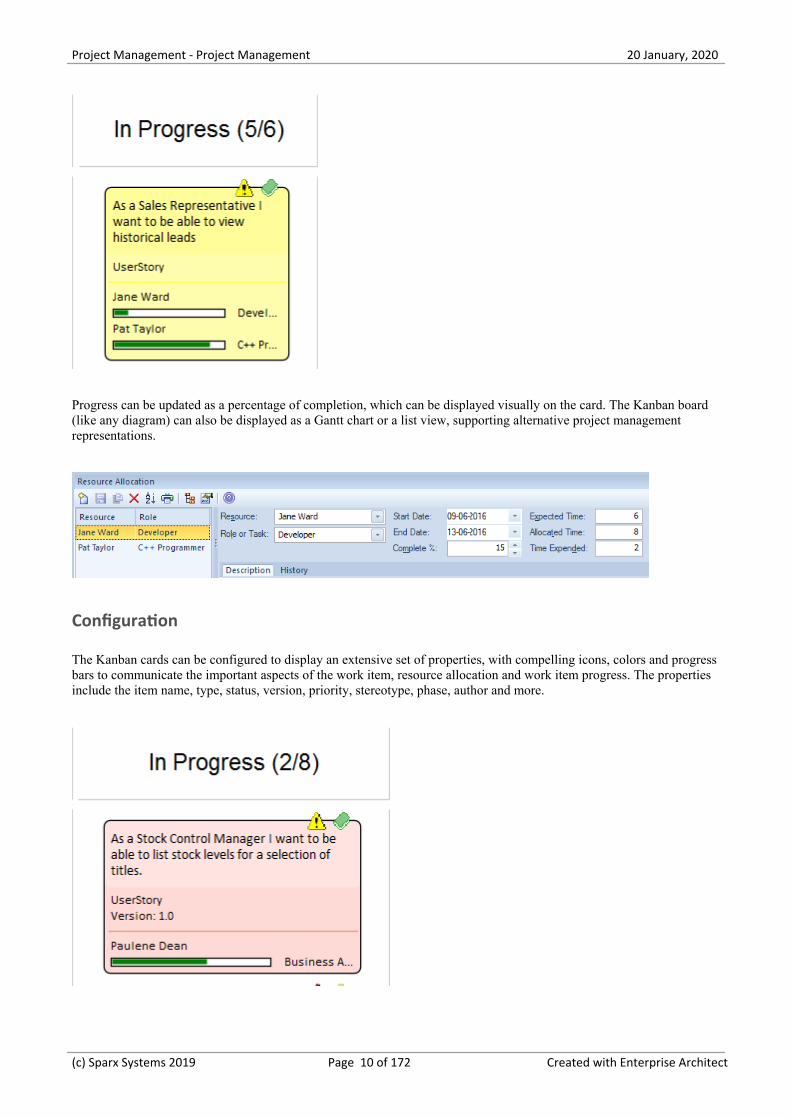
Any number of resources, performing specified roles, can be allocated to work items as they flow through the Kanbanboard, and the progress can be visualized as one or more progress bars displayed at the bottom of the card. The allocationis driven by Enterprise Architect's practical and simple resource allocation facility, which can be used to define therelationship between resources (team members) and work items (cards). Any number of team members can assignthemselves to a work item, indicating the role they will perform, and the start date, finish date, and the expected time canbe used to record estimates of how long the task will take.
(c) Sparx Systems 2019 Page 9 of 172 Created with Enterprise Architect
Project Management - Project Management 20 January, 2020
Progress can be updated as a percentage of completion, which can be displayed visually on the card. The Kanban board(like any diagram) can also be displayed as a Gantt chart or a list view, supporting alternative project managementrepresentations.
Configuration
The Kanban cards can be configured to display an extensive set of properties, with compelling icons, colors and progressbars to communicate the important aspects of the work item, resource allocation and work item progress. The propertiesinclude the item name, type, status, version, priority, stereotype, phase, author and more.
(c) Sparx Systems 2019 Page 10 of 172 Created with Enterprise Architect
Project Management - Project Management 20 January, 2020
The names, colors and number of lanes can be configured, in addition to a range of other properties such as the overfilllimits, defaults and the definition of sub-lanes. The appearance of the board and the work items can all be configured,using different colors, fonts and styles including a hand-drawn mode that might appeal to teams more accustomed tousing a physical board with colored notes. It is also possible to set the chart appearance to highlight elements that comefrom the same hierarchies.
Enterprise Architect has built-in Kanban diagrams, and a number of workflow Patterns that are pre-built and that can beused 'As-Is' or configured to suit any project or initiative. The workflow Patterns define one, two or three stageworkflows; for example, the two stage workflow defines a Kanban board solely for managing the prioritization of thebacklog, and items from the backlog are then moved from the backlog Kanban to the first lane of the iteration Kanban. Ifnecessary, the Product Owner can use Enterprise Architect's security facility to lock the backlog Kanban, ensuring thatthe order of items in the backlog is not inadvertently changed.
There are a number of commercial tools that allow Kanban to be used to manage projects visually, but EnterpriseArchitect’s Kanban facility is incredibly powerful because the tool is also a sophisticated modeling platform for strategicand business analysis, architecture, design, implementation, testing and deployment. This means that work items on aKanban Board can be linked to strategic decisions, business rules, policies, requirements, architecture and designelements, wireframes and UX models, programming code, database tables, procedures, tests, virtual or physicaldeployment nodes, and more. For the first time everyone in the team can collaborate in the same environment using atoolbox of facilities purpose built for their discipline, while at the same time being able to visualize and manage the valuebeing delivered to the customer in a powerful and visually compelling set of Kanban boards.
Charts and Dashboards
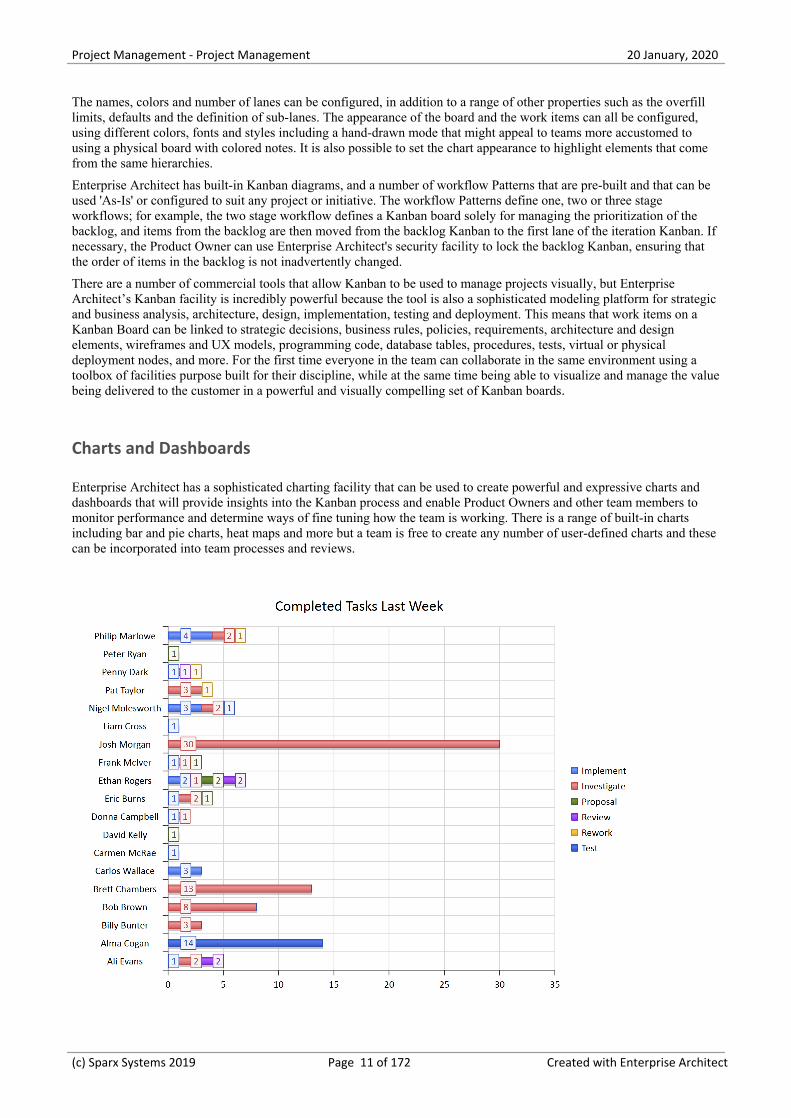
Enterprise Architect has a sophisticated charting facility that can be used to create powerful and expressive charts anddashboards that will provide insights into the Kanban process and enable Product Owners and other team members tomonitor performance and determine ways of fine tuning how the team is working. There is a range of built-in chartsincluding bar and pie charts, heat maps and more but a team is free to create any number of user-defined charts and thesecan be incorporated into team processes and reviews.
(c) Sparx Systems 2019 Page 11 of 172 Created with Enterprise Architect
Project Management - Project Management 20 January, 2020
Application
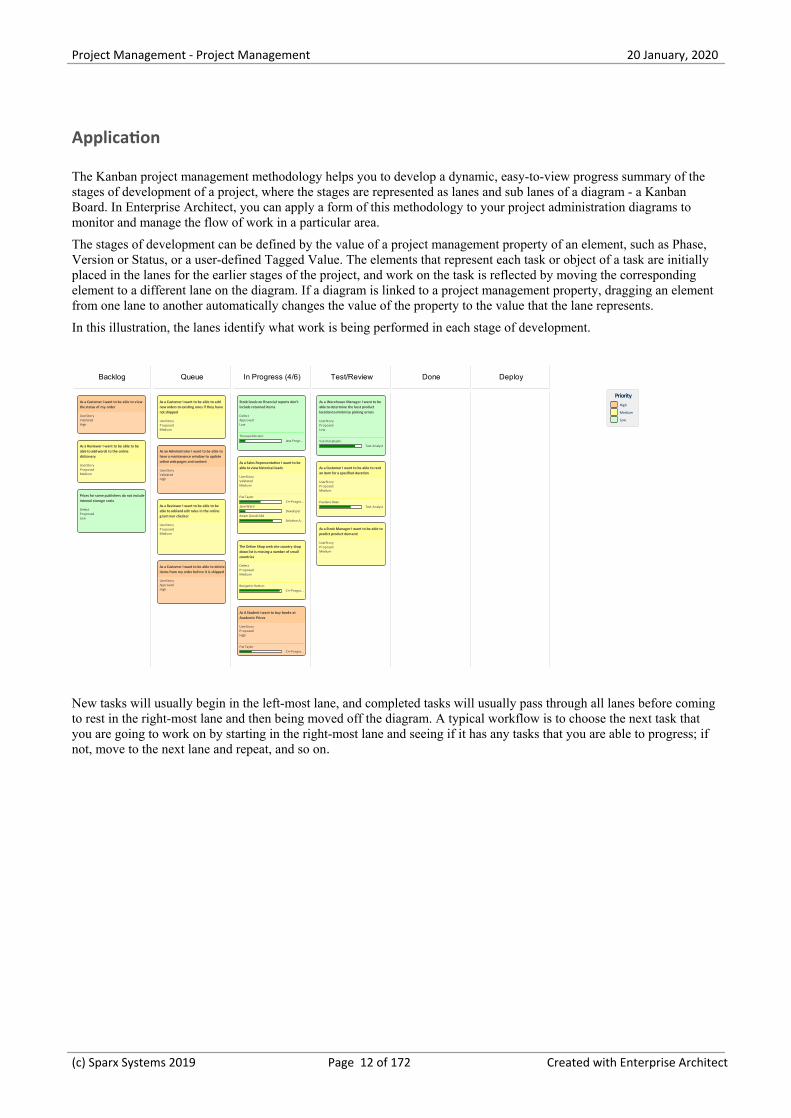
The Kanban project management methodology helps you to develop a dynamic, easy-to-view progress summary of thestages of development of a project, where the stages are represented as lanes and sub lanes of a diagram - a KanbanBoard. In Enterprise Architect, you can apply a form of this methodology to your project administration diagrams tomonitor and manage the flow of work in a particular area.
The stages of development can be defined by the value of a project management property of an element, such as Phase,Version or Status, or a user-defined Tagged Value. The elements that represent each task or object of a task are initiallyplaced in the lanes for the earlier stages of the project, and work on the task is reflected by moving the correspondingelement to a different lane on the diagram. If a diagram is linked to a project management property, dragging an elementfrom one lane to another automatically changes the value of the property to the value that the lane represents.
In this illustration, the lanes identify what work is being performed in each stage of development.
Backlog Queue In Progress (4/6) Test/Review Done Deploy
As a Customer I want to be able to viewthe status of my order
UserStoryValidatedHigh
As a Stock Manager I want to be able topredict product demand
UserStoryProposedMedium
Stock levels on financial reports don'tinclude returned items
DefectApprovedLow
Theresa MorantiJava Progr...
As a Customer I want to be able to deleteitems from my order before it is shipped
UserStoryApprovedHigh
As a Sales Representative I want to beable to view historical leads
UserStoryValidatedMedium
Pat TaylorC++ Progra...
Jane WardDeveloper
Adam GoodchildSolution A...
The Online Shop web site country dropdown list is missing a number of smallcountries
DefectProposedMedium
Benjamin HuttonC++ Progra...
As a Reviewer I want to be able to beable to add and edit rules in the onlinegrammar checker
UserStoryProposedMedium
As a Reviewer I want to be able to beable to add words to the onlinedictionary
UserStoryProposedMedium
As a Warehouse Manager I want to beable to determine the best productlocation to minimize picking errors
UserStoryProposedLow
Yuki KotabashiTest Analyst
As a Customer I want to be able to rentan item for a specified duration
UserStoryProposedMedium
Paulene DeanTest Analyst
As an Administrator I want to be able tohave a maintenance window to updateonline web pages and content
UserStoryValidatedHigh
High
Medium
Low
Priority
As A Student I want to buy books atAcademic Prices
UserStoryProposedHigh
Pat TaylorC++ Progra...
As a Customer I want to be able to addnew orders to existing ones if they havenot shipped
UserStoryProposedMedium
Prices for some publishers do not includeinternal storage costs
DefectProposedLow
New tasks will usually begin in the left-most lane, and completed tasks will usually pass through all lanes before comingto rest in the right-most lane and then being moved off the diagram. A typical workflow is to choose the next task thatyou are going to work on by starting in the right-most lane and seeing if it has any tasks that you are able to progress; ifnot, move to the next lane and repeat, and so on.
(c) Sparx Systems 2019 Page 12 of 172 Created with Enterprise Architect
Project Management - Project Management 20 January, 2020
MDG Technology for Kanban
The MDG Technology for Kanban Diagrams provides diagram types and patterns that underpin the creation of Kanbandiagrams. Whilst it is possible to create Kanban diagrams from most UML diagram types and design the workflows onthem from scratch, these diagram types and patterns help you to generate a Kanban that matches your requirements andthen adjust the settings to suit, thus saving time and effort.
Access
On the 'MDG Technologies' dialog, in the 'Technology' panel, select 'Kanban' then click on the 'Enabled' checkbox andon the OK button.
Ribbon Specialize > Technologies > Manage
Kanban Diagram Types
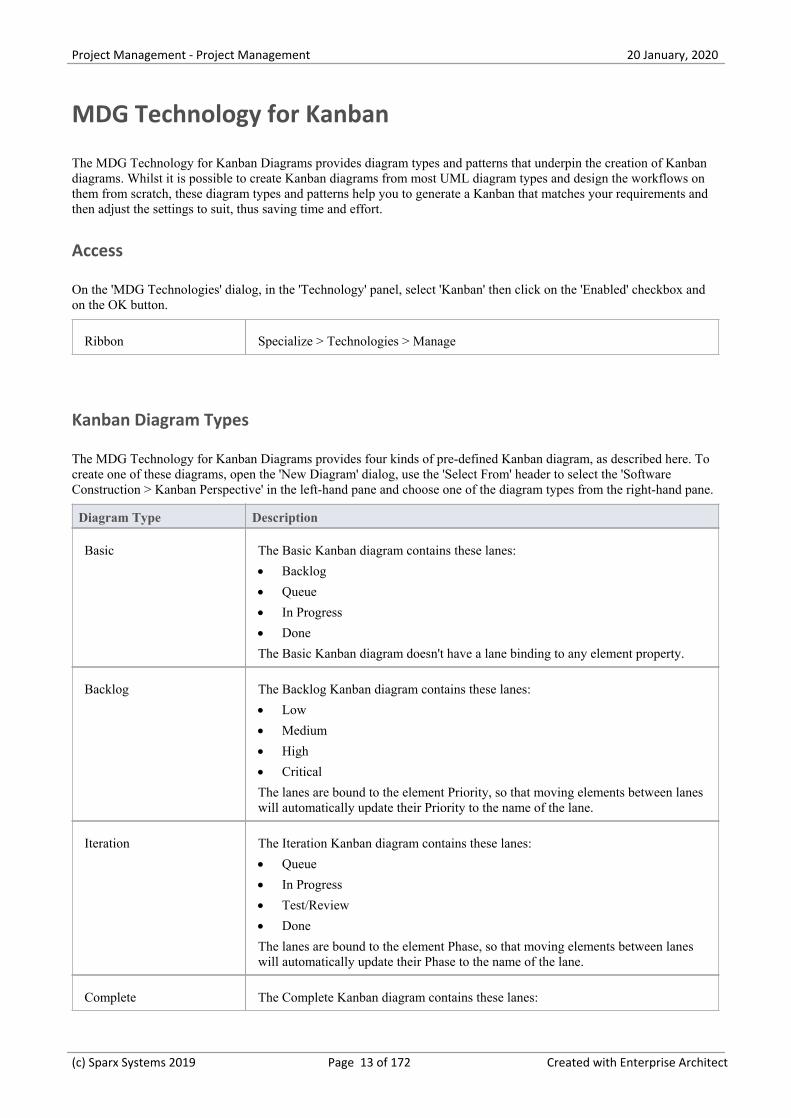
The MDG Technology for Kanban Diagrams provides four kinds of pre-defined Kanban diagram, as described here. Tocreate one of these diagrams, open the 'New Diagram' dialog, use the 'Select From' header to select the 'SoftwareConstruction > Kanban Perspective' in the left-hand pane and choose one of the diagram types from the right-hand pane.
Diagram Type Description
Basic The Basic Kanban diagram contains these lanes:
Backlog·
Queue·
In Progress·
Done·
The Basic Kanban diagram doesn't have a lane binding to any element property.
Backlog The Backlog Kanban diagram contains these lanes:
Low·
Medium·
High·
Critical·
The lanes are bound to the element Priority, so that moving elements between laneswill automatically update their Priority to the name of the lane.
Iteration The Iteration Kanban diagram contains these lanes:
Queue·
In Progress·
Test/Review·
Done·
The lanes are bound to the element Phase, so that moving elements between laneswill automatically update their Phase to the name of the lane.
Complete The Complete Kanban diagram contains these lanes:
(c) Sparx Systems 2019 Page 13 of 172 Created with Enterprise Architect
Project Management - Project Management 20 January, 2020
Ready for Release·
Staging·
Production·
Done·
The lanes are bound to the element Phase, so that moving elements between laneswill automatically update their Phase to the name of the lane.
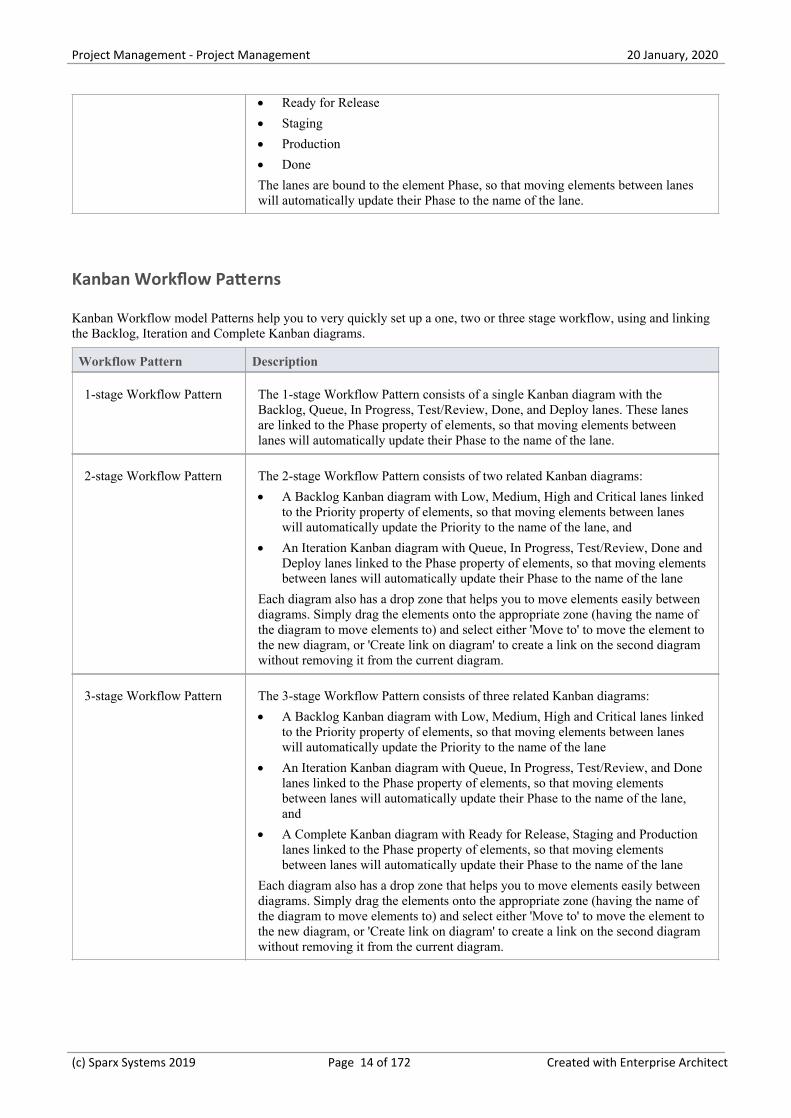
Kanban Workflow Patterns
Kanban Workflow model Patterns help you to very quickly set up a one, two or three stage workflow, using and linkingthe Backlog, Iteration and Complete Kanban diagrams.
Workflow Pattern Description
1-stage Workflow Pattern The 1-stage Workflow Pattern consists of a single Kanban diagram with theBacklog, Queue, In Progress, Test/Review, Done, and Deploy lanes. These lanesare linked to the Phase property of elements, so that moving elements betweenlanes will automatically update their Phase to the name of the lane.
2-stage Workflow Pattern The 2-stage Workflow Pattern consists of two related Kanban diagrams:
A Backlog Kanban diagram with Low, Medium, High and Critical lanes linked·to the Priority property of elements, so that moving elements between laneswill automatically update the Priority to the name of the lane, and
An Iteration Kanban diagram with Queue, In Progress, Test/Review, Done and·Deploy lanes linked to the Phase property of elements, so that moving elementsbetween lanes will automatically update their Phase to the name of the lane
Each diagram also has a drop zone that helps you to move elements easily betweendiagrams. Simply drag the elements onto the appropriate zone (having the name ofthe diagram to move elements to) and select either 'Move to' to move the element tothe new diagram, or 'Create link on diagram' to create a link on the second diagramwithout removing it from the current diagram.
3-stage Workflow Pattern The 3-stage Workflow Pattern consists of three related Kanban diagrams:
A Backlog Kanban diagram with Low, Medium, High and Critical lanes linked·to the Priority property of elements, so that moving elements between laneswill automatically update the Priority to the name of the lane
An Iteration Kanban diagram with Queue, In Progress, Test/Review, and Done·lanes linked to the Phase property of elements, so that moving elementsbetween lanes will automatically update their Phase to the name of the lane,and
A Complete Kanban diagram with Ready for Release, Staging and Production·lanes linked to the Phase property of elements, so that moving elementsbetween lanes will automatically update their Phase to the name of the lane
Each diagram also has a drop zone that helps you to move elements easily betweendiagrams. Simply drag the elements onto the appropriate zone (having the name ofthe diagram to move elements to) and select either 'Move to' to move the element tothe new diagram, or 'Create link on diagram' to create a link on the second diagramwithout removing it from the current diagram.
(c) Sparx Systems 2019 Page 14 of 172 Created with Enterprise Architect
Project Management - Project Management 20 January, 2020
Kanban Tasks
Create a Kanban Diagram
A Kanban diagram is a board that allows team members to visualize work items that are represented as colored cards.The board is divided into a number of lanes and team members move the cards from left to right as work is completedtowards providing value to the customer.
You can create a Kanban diagram by taking an existing diagram and setting its Kanban properties, but it is easier to useone of the diagram types provided by the MDG Technology for Kanban Diagrams as a starting point and then change itsproperties to suit your own project.
Step Action
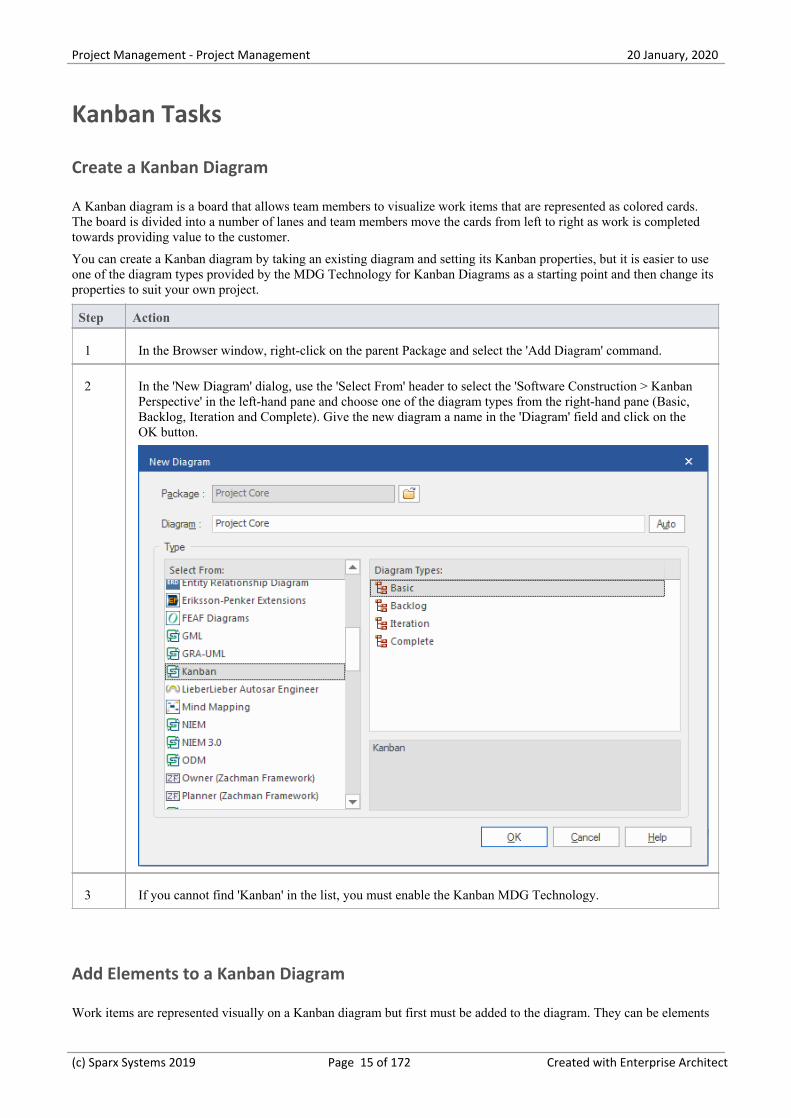
1 In the Browser window, right-click on the parent Package and select the 'Add Diagram' command.
2 In the 'New Diagram' dialog, use the 'Select From' header to select the 'Software Construction > KanbanPerspective' in the left-hand pane and choose one of the diagram types from the right-hand pane (Basic,Backlog, Iteration and Complete). Give the new diagram a name in the 'Diagram' field and click on theOK button.
3 If you cannot find 'Kanban' in the list, you must enable the Kanban MDG Technology.
Add Elements to a Kanban Diagram
Work items are represented visually on a Kanban diagram but first must be added to the diagram. They can be elements
(c) Sparx Systems 2019 Page 15 of 172 Created with Enterprise Architect
Project Management - Project Management 20 January, 2020
that already exist in the repository or new elements dragged from the Kanban toolbox and dropped onto the diagram.Any element type can appear on a Kanban board but the most typical types are Features, User Stories, Defects andChanges, Use Cases, Scenarios and Requirements are also sometimes added.
When you drop an element onto a Kanban diagram, the lane it is added to depends on whether the diagram has a propertyvalue defined, and also whether it has a default lane. If the Kanban diagram has a property value defined and the newelement's property matches one of the lanes, then it will be added to that lane. Otherwise, it will be moved into thedefault lane, or to the right of the last lane if no default lane has been nominated.
You can define the Default lane on the 'Lanes' page of the 'Kanban Options' dialog.
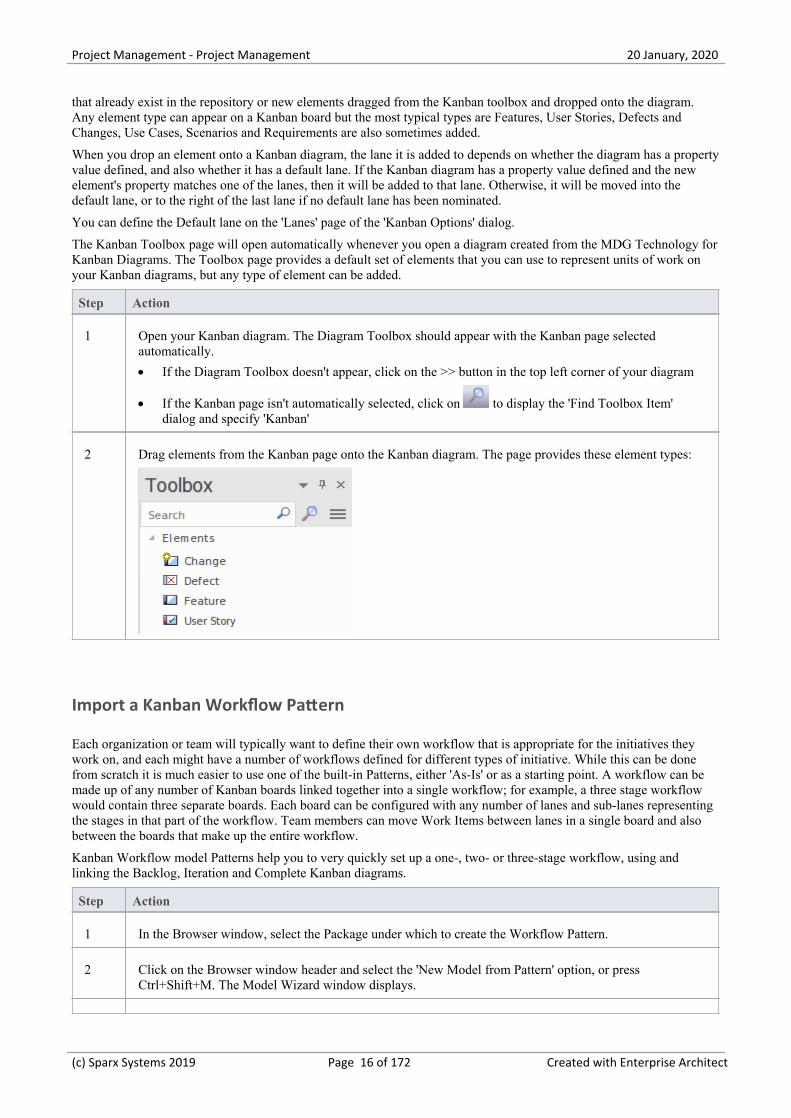
The Kanban Toolbox page will open automatically whenever you open a diagram created from the MDG Technology forKanban Diagrams. The Toolbox page provides a default set of elements that you can use to represent units of work onyour Kanban diagrams, but any type of element can be added.
Step Action
1 Open your Kanban diagram. The Diagram Toolbox should appear with the Kanban page selectedautomatically.
If the Diagram Toolbox doesn't appear, click on the >> button in the top left corner of your diagram·
If the Kanban page isn't automatically selected, click on to display the 'Find Toolbox Item'·dialog and specify 'Kanban'
2 Drag elements from the Kanban page onto the Kanban diagram. The page provides these element types:
Import a Kanban Workflow Pattern
Each organization or team will typically want to define their own workflow that is appropriate for the initiatives theywork on, and each might have a number of workflows defined for different types of initiative. While this can be donefrom scratch it is much easier to use one of the built-in Patterns, either 'As-Is' or as a starting point. A workflow can bemade up of any number of Kanban boards linked together into a single workflow; for example, a three stage workflowwould contain three separate boards. Each board can be configured with any number of lanes and sub-lanes representingthe stages in that part of the workflow. Team members can move Work Items between lanes in a single board and alsobetween the boards that make up the entire workflow.
Kanban Workflow model Patterns help you to very quickly set up a one-, two- or three-stage workflow, using andlinking the Backlog, Iteration and Complete Kanban diagrams.
Step Action
1 In the Browser window, select the Package under which to create the Workflow Pattern.
2 Click on the Browser window header and select the 'New Model from Pattern' option, or pressCtrl+Shift+M. The Model Wizard window displays.
(c) Sparx Systems 2019 Page 16 of 172 Created with Enterprise Architect
Project Management - Project Management 20 January, 2020
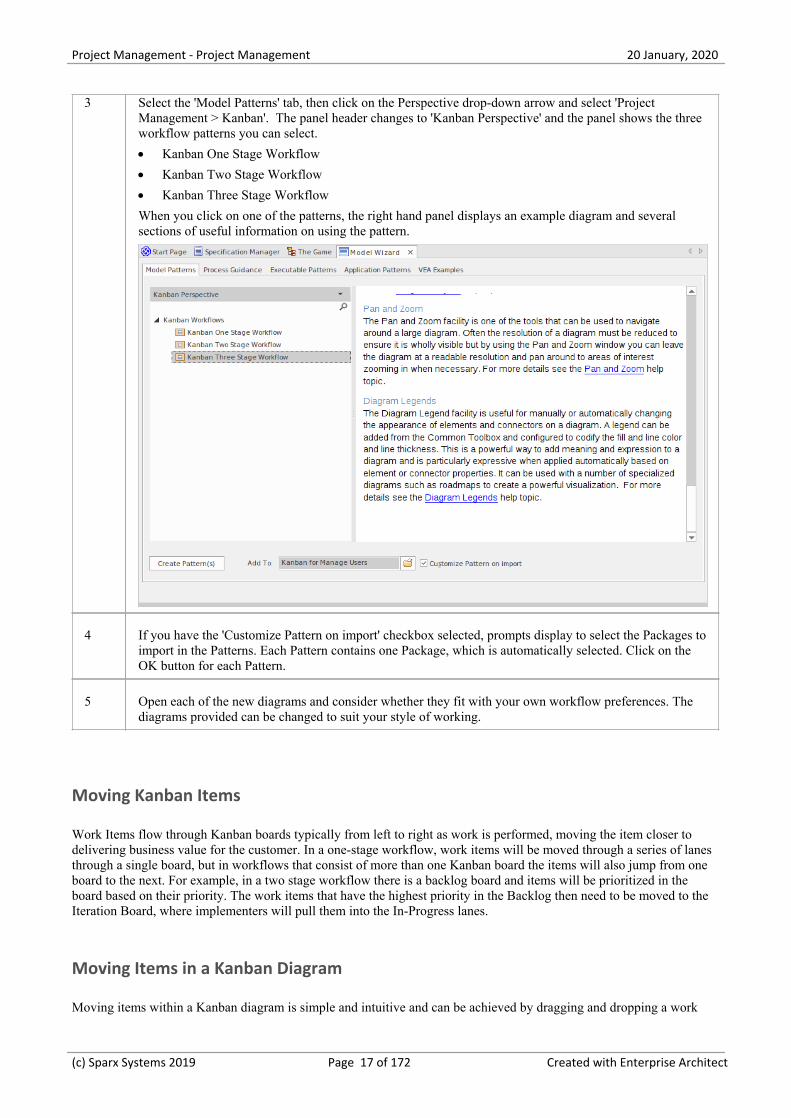
3 Select the 'Model Patterns' tab, then click on the Perspective drop-down arrow and select 'ProjectManagement > Kanban'. The panel header changes to 'Kanban Perspective' and the panel shows the threeworkflow patterns you can select.
Kanban One Stage Workflow·
Kanban Two Stage Workflow·
Kanban Three Stage Workflow·
When you click on one of the patterns, the right hand panel displays an example diagram and severalsections of useful information on using the pattern.
4 If you have the 'Customize Pattern on import' checkbox selected, prompts display to select the Packages toimport in the Patterns. Each Pattern contains one Package, which is automatically selected. Click on theOK button for each Pattern.
5 Open each of the new diagrams and consider whether they fit with your own workflow preferences. Thediagrams provided can be changed to suit your style of working.
Moving Kanban Items
Work Items flow through Kanban boards typically from left to right as work is performed, moving the item closer todelivering business value for the customer. In a one-stage workflow, work items will be moved through a series of lanesthrough a single board, but in workflows that consist of more than one Kanban board the items will also jump from oneboard to the next. For example, in a two stage workflow there is a backlog board and items will be prioritized in theboard based on their priority. The work items that have the highest priority in the Backlog then need to be moved to theIteration Board, where implementers will pull them into the In-Progress lanes.
Moving Items in a Kanban Diagram
Moving items within a Kanban diagram is simple and intuitive and can be achieved by dragging and dropping a work
(c) Sparx Systems 2019 Page 17 of 172 Created with Enterprise Architect
Project Management - Project Management 20 January, 2020
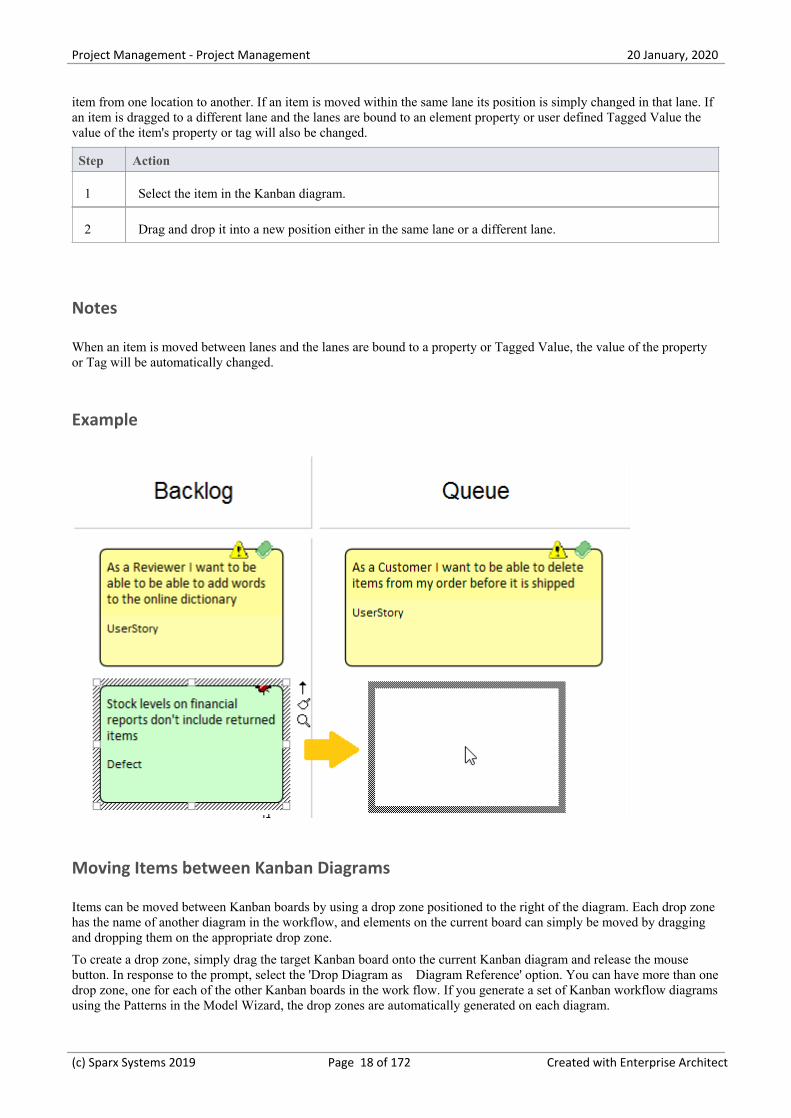
item from one location to another. If an item is moved within the same lane its position is simply changed in that lane. Ifan item is dragged to a different lane and the lanes are bound to an element property or user defined Tagged Value thevalue of the item's property or tag will also be changed.
Step Action
1 Select the item in the Kanban diagram.
2 Drag and drop it into a new position either in the same lane or a different lane.
Notes
When an item is moved between lanes and the lanes are bound to a property or Tagged Value, the value of the propertyor Tag will be automatically changed.
Example
Moving Items between Kanban Diagrams
Items can be moved between Kanban boards by using a drop zone positioned to the right of the diagram. Each drop zonehas the name of another diagram in the workflow, and elements on the current board can simply be moved by draggingand dropping them on the appropriate drop zone.
To create a drop zone, simply drag the target Kanban board onto the current Kanban diagram and release the mousebutton. In response to the prompt, select the 'Drop Diagram as Diagram Reference' option. You can have more than onedrop zone, one for each of the other Kanban boards in the work flow. If you generate a set of Kanban workflow diagramsusing the Patterns in the Model Wizard, the drop zones are automatically generated on each diagram.
(c) Sparx Systems 2019 Page 18 of 172 Created with Enterprise Architect
Project Management - Project Management 20 January, 2020
Step Action
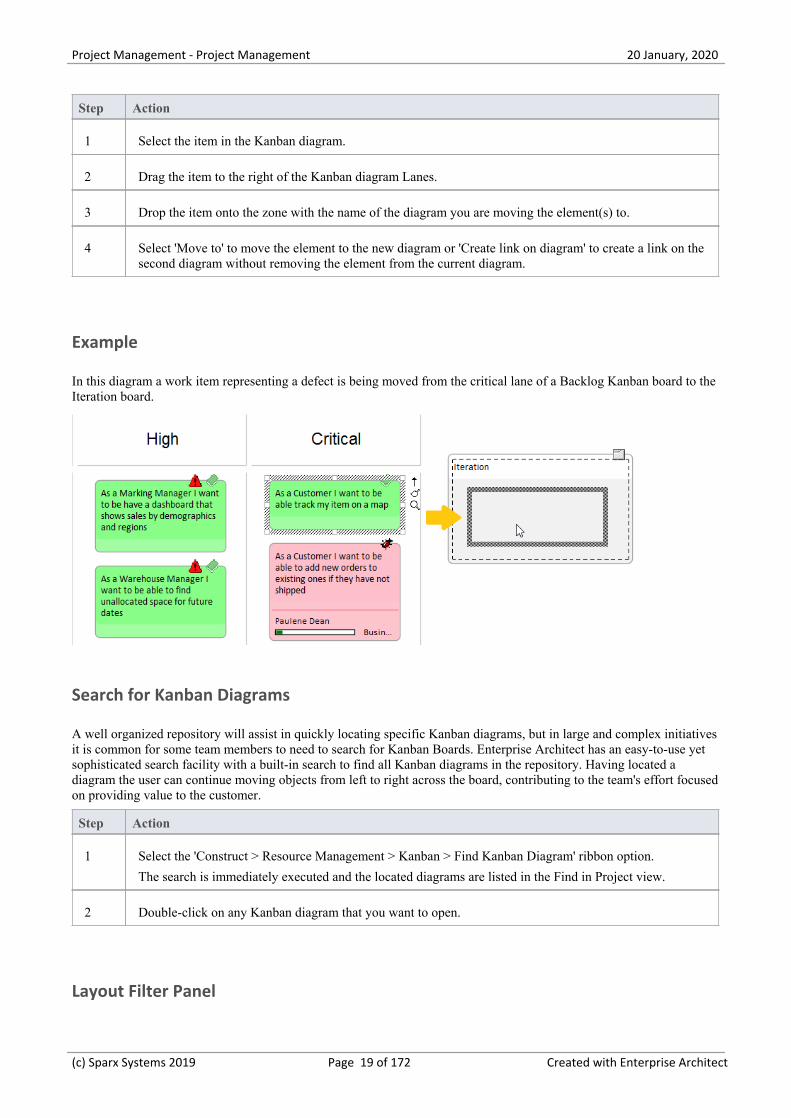
1 Select the item in the Kanban diagram.
2 Drag the item to the right of the Kanban diagram Lanes.
3 Drop the item onto the zone with the name of the diagram you are moving the element(s) to.
4 Select 'Move to' to move the element to the new diagram or 'Create link on diagram' to create a link on thesecond diagram without removing the element from the current diagram.
Example
In this diagram a work item representing a defect is being moved from the critical lane of a Backlog Kanban board to theIteration board.
Search for Kanban Diagrams
A well organized repository will assist in quickly locating specific Kanban diagrams, but in large and complex initiativesit is common for some team members to need to search for Kanban Boards. Enterprise Architect has an easy-to-use yetsophisticated search facility with a built-in search to find all Kanban diagrams in the repository. Having located adiagram the user can continue moving objects from left to right across the board, contributing to the team's effort focusedon providing value to the customer.
Step Action
1 Select the 'Construct > Resource Management > Kanban > Find Kanban Diagram' ribbon option.
The search is immediately executed and the located diagrams are listed in the Find in Project view.
2 Double-click on any Kanban diagram that you want to open.
Layout Filter Panel
(c) Sparx Systems 2019 Page 19 of 172 Created with Enterprise Architect
Project Management - Project Management 20 January, 2020
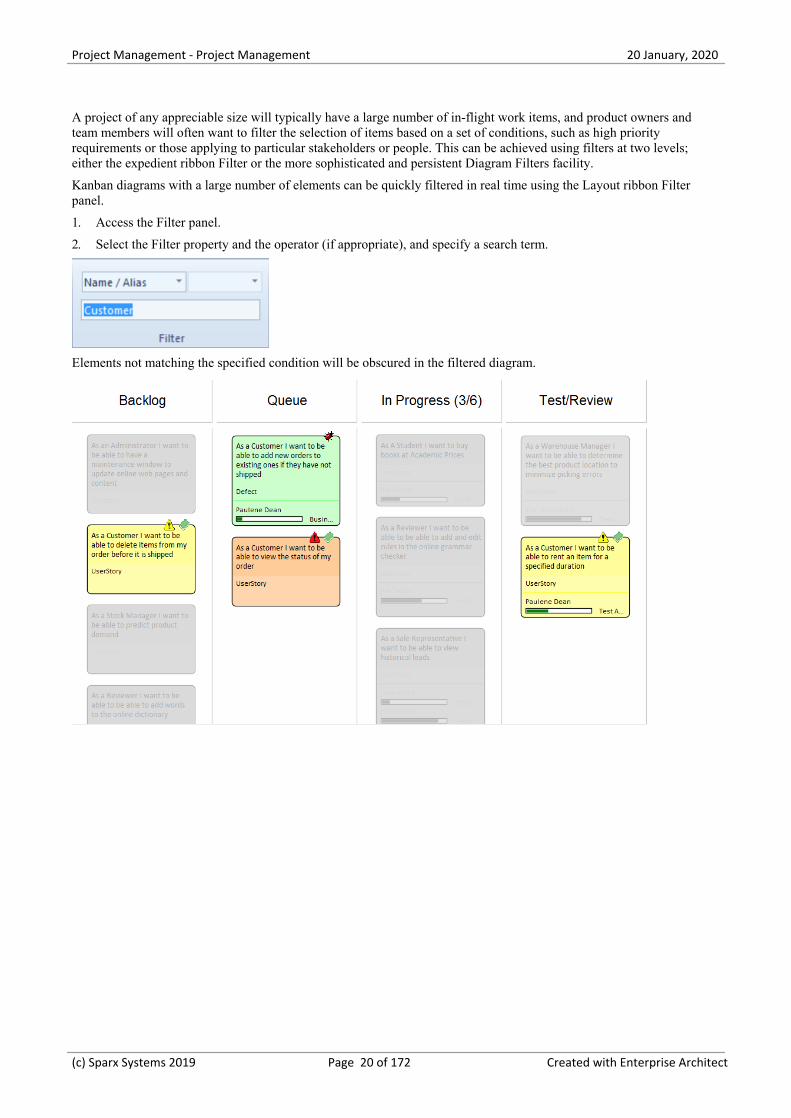
A project of any appreciable size will typically have a large number of in-flight work items, and product owners andteam members will often want to filter the selection of items based on a set of conditions, such as high priorityrequirements or those applying to particular stakeholders or people. This can be achieved using filters at two levels;either the expedient ribbon Filter or the more sophisticated and persistent Diagram Filters facility.
Kanban diagrams with a large number of elements can be quickly filtered in real time using the Layout ribbon Filterpanel.
Access the Filter panel.1.
Select the Filter property and the operator (if appropriate), and specify a search term.2.
Elements not matching the specified condition will be obscured in the filtered diagram.
(c) Sparx Systems 2019 Page 20 of 172 Created with Enterprise Architect
Project Management - Project Management 20 January, 2020
Kanban Diagram Options
Enterprise Architect provides a number of options for generating a new Kanban diagram or for opening an existingKanban diagram. Having opened the diagram, you can define its structure, content and appearance. It is also possible toconfigure a diagram of any other type to be a Kanban diagram, by simply adding Kanban properties to it. This powerfuldesign feature means that a diagram containing, for example, a set of User Stories could simply be changed to a Kanbandiagram and the team could immediately begin using this flexible, lean, project management method.
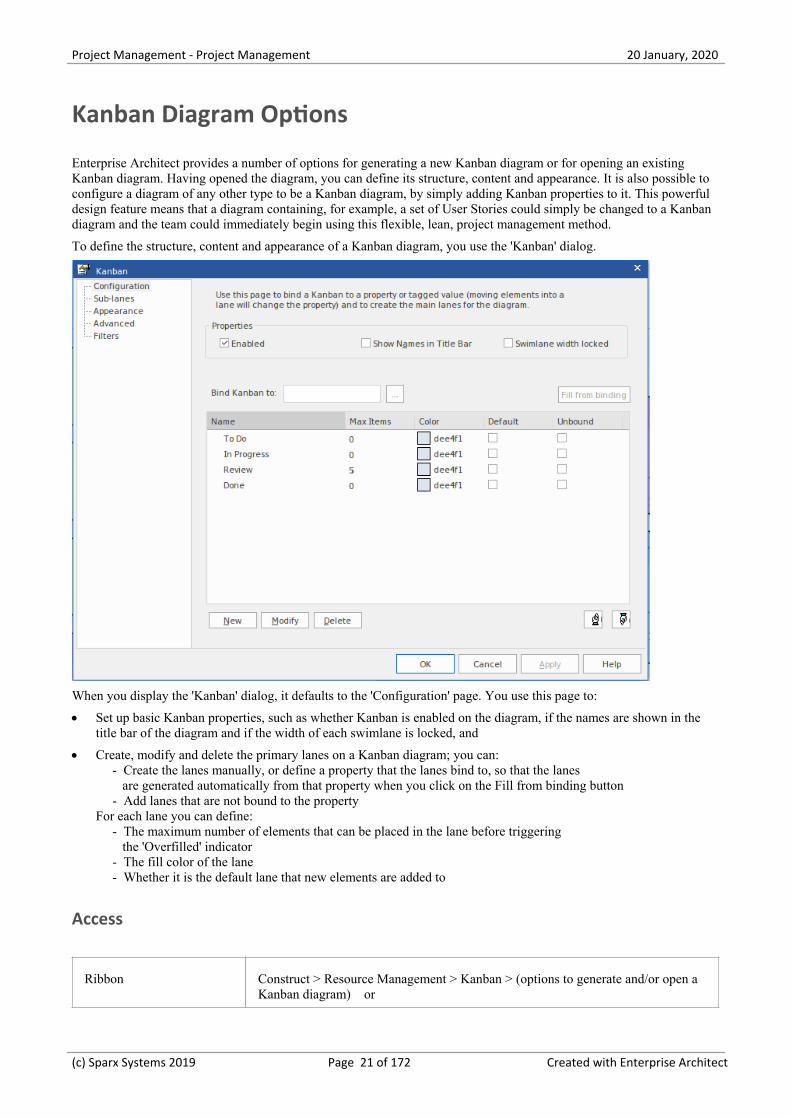
To define the structure, content and appearance of a Kanban diagram, you use the 'Kanban' dialog.
When you display the 'Kanban' dialog, it defaults to the 'Configuration' page. You use this page to:
Set up basic Kanban properties, such as whether Kanban is enabled on the diagram, if the names are shown in the·title bar of the diagram and if the width of each swimlane is locked, and
Create, modify and delete the primary lanes on a Kanban diagram; you can:· - Create the lanes manually, or define a property that the lanes bind to, so that the lanes are generated automatically from that property when you click on the Fill from binding button - Add lanes that are not bound to the propertyFor each lane you can define: - The maximum number of elements that can be placed in the lane before triggering the 'Overfilled' indicator - The fill color of the lane - Whether it is the default lane that new elements are added to
Access
Ribbon Construct > Resource Management > Kanban > (options to generate and/or open aKanban diagram) or
(c) Sparx Systems 2019 Page 21 of 172 Created with Enterprise Architect

Project Management - Project Management 20 January, 2020
Start > Collaborate > My Kanban (displays personal default Kanban diagram)
Then
Design > Diagram > Manage > Kanban (on an open Kanban diagram)
Context Menu On a Kanban diagram, double-click on a lane
On any other type of diagram, right-click on background | Kanban
Configuration Options
Option Action
EnabledSelect the checkbox to apply any of the Kanban functionality to the diagram. If thecheckbox is not selected, the diagram will behave as a non-Kanban diagram.
Show Names in Title BarSelect this checkbox to display the lane names (but not the sub-lane names) in thediagram title bar, above the lanes. These will be visible once the lanes are defined.
Swimlane width lockedSelect this checkbox to prevent the lanes in the diagram from being made narroweror wider.
Bind Kanban to
Click on the button and select the property to bind lanes to. This will be oneof:
Element, or·
Tagged Value (enumeration or string types only), or·
None (makes all lanes unbound).·
If you select 'Element', also select one of the properties 'Phase', 'Version', 'Priority'(for Requirement-type elements), 'Status' or 'Author'.
If you select 'Tagged Value', also choose to either 'Create' a new tag (and simplytype in the name) or 'Select' an existing one.
In the latter case, the 'Kanban Tagged Value selection' dialog displays, on whichyou click on the appropriate radio button to select either from a list of 'GlobalTagged Values', or from a list of 'Tagged Values from a selected element'. Click onthe Select Element button to browse for the element anywhere in the model.
The Global Tagged Values or those from the element are provided to the 'TaggedValue' field. Click on the drop-down arrow on the right of the field and select thereference Tagged Value from those listed. Click on the OK button.
The 'Bind Kanban to' field now displays either the element property or the TaggedValue you have selected.
Fill from bindingIf you have chosen an element property to bind the Kanban lanes to, click on theFill from binding button to fill the lane list with existing values of that property.This will delete all old lanes before creating a new lane for each of the new values.Once the lanes have been created in this way, they can be renamed, reordered andadded to.
NameThe name of each lane can be filled automatically using the Fill from bindingbutton. You can overtype the names; these do not have to be unique but they cannotbe blank.
Max Items
(c) Sparx Systems 2019 Page 22 of 172 Created with Enterprise Architect
Project Management - Project Management 20 January, 2020
You can set the maximum number of elements that can be placed in each lane. Ifsomeone tries to move an element into a lane that has reached or exceeded itsmaximum number, the heading of the lane will be displayed in the 'Overfilled' coloryou define and enable on the 'Appearance' page. This gives a visual indication thataction might have to be taken to clear what appears to be a bottleneck in theworkflow process.
ColorSeveral or all of the lanes can have the same fill color, or you can set a differentcolor for each lane independent of the other lanes. Either:
Leave the 'Color' value set to 'Default' (set on the 'Preferences' dialog,·'Gradients and Background' page), or
Overtype 'Default' with the hex code number for the required color, or·
Click on the drop-down arrow and select a color from the displayed palette·
The actual color is shown in the box at the left of the field.
DefaultYou can nominate one of your lanes as the default; that is, the lane to which newelements are added if they don't match the binding property. For example, if aKanban diagram is bound to 'Priority' and has the lanes 'Low', 'Medium' and 'High',with 'Low' as the default, when an element with a Priority of 'Undetermined' isadded, it will be placed into the default 'Low' lane. You can only select one 'Default'checkbox; clicking on a checkbox clears any previously-selected checkbox.
UnboundThe Unbound property essentially makes a primary lane the same as a sub-lane.Moving an element into an unbound lane will set the element's bound property tothe left most bound lane. Consider a 'Phase' Kanban diagram with these lanes, inorder:
To Do (Default, Unbound)·
Implement (Bound)·
To Do (Unbound)·
Review (Bound)·
To Do (Unbound)·
Deploy (Bound)·
Newly added elements will be added to the left-most 'To Do' lane with whateverpriority value they previously had. Moving them to the 'Implement' lane will thenset the phase to 'Implement'. When the implementation is complete, the element canbe moved to the 'To Do' lane before 'Review' without updating the element's phaseuntil it is moved into the 'Review' lane.
NewClick on this button to define a new lane on the Kanban diagram.
ModifyClick on a line in the 'Lanes' list and click on this button to position the cursor inthe 'Name' field in update mode, and to highlight the lane you are modifying tomake it easier to focus on the fields you might change.
DeleteClick on a line in the 'Lanes' list and click on this button to delete the lane.
Click on an entry in the 'Lanes' list and click on this button to move the entry oneline up in the list, and one lane to the left on the diagram.
Click on an entry in the 'Lanes' list and click on this button to move the entry oneline down in the list, and one lane to the right on the diagram.
(c) Sparx Systems 2019 Page 23 of 172 Created with Enterprise Architect
Project Management - Project Management 20 January, 2020
Notes
The elements in a Kanban diagram individually represent work in progress; you cannot create connectors between·elements on the diagram
If you apply a Kanban definition to a current diagram, all connectors on the diagram are hidden; when you·de-activate the definition, the connectors are shown again
When you first set up a Kanban diagram, any element on the diagram that does not have one of the defined property·values is moved to the right-hand side of the diagram
Moving an element into a lane automatically sets the appropriate property of that element to the value represented by·the lane; for a Tagged Value, if the element does not have that tag, adding the element to the lane adds the tag andsets it to the lane value
Elements on a Kanban diagram are automatically adjusted to match the width of the lane they are in, both when the·element is moved into a lane and when the lane width is changed
Certain types of element are automatically excluded from a Kanban diagram search; these are:· - Constraint - Port - ProvidedInterface - RequiredInterface - Boundary - Hyperlink - State Node (such as Choice and Junction) - Text - Win32 - Wireframing - Package - Diagram Frame - Activity Region - Sequence Element - Note - Standard Chart - Model View - Time Series Chart
(c) Sparx Systems 2019 Page 24 of 172 Created with Enterprise Architect
Project Management - Project Management 20 January, 2020
Kanban Diagram Options - Sub-Lanes
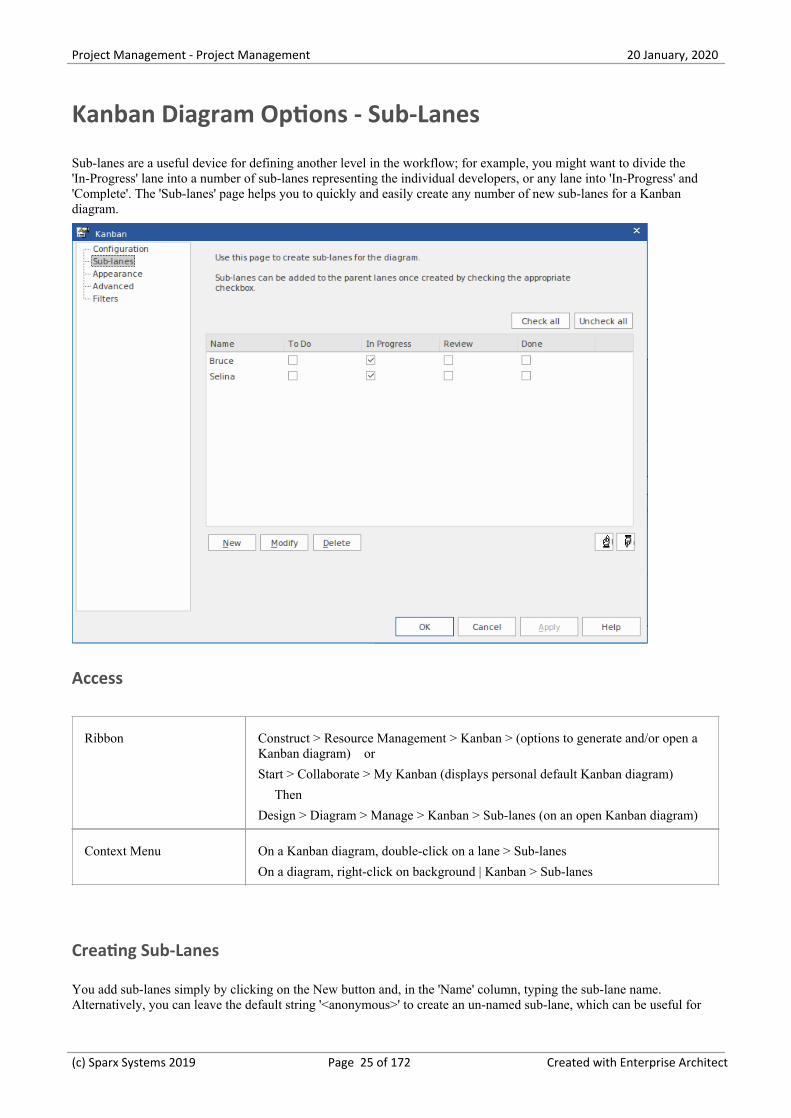
Sub-lanes are a useful device for defining another level in the workflow; for example, you might want to divide the'In-Progress' lane into a number of sub-lanes representing the individual developers, or any lane into 'In-Progress' and'Complete'. The 'Sub-lanes' page helps you to quickly and easily create any number of new sub-lanes for a Kanbandiagram.
Access
Ribbon Construct > Resource Management > Kanban > (options to generate and/or open aKanban diagram) or
Start > Collaborate > My Kanban (displays personal default Kanban diagram)
Then
Design > Diagram > Manage > Kanban > Sub-lanes (on an open Kanban diagram)
Context Menu On a Kanban diagram, double-click on a lane > Sub-lanes
On a diagram, right-click on background | Kanban > Sub-lanes
Creating Sub-Lanes
You add sub-lanes simply by clicking on the New button and, in the 'Name' column, typing the sub-lane name.Alternatively, you can leave the default string '<anonymous>' to create an un-named sub-lane, which can be useful for
(c) Sparx Systems 2019 Page 25 of 172 Created with Enterprise Architect
Project Management - Project Management 20 January, 2020
organizing lanes that have lots of elements. The names of the lanes on the diagram are then automatically added acrossthe panel.
Once you have created sub-lanes, you apply each one to one or more parent lanes, by selecting the checkbox under thename of each lane that is to contain the sub-lane. To assign every sub-lane to every lane, you can click on the Check allbutton, and to clear this total assignment click on the Uncheck all button. You can also change the order of the sub-lanesacross all their parent lanes in the Kanban diagram, by clicking on the sub-lane names and on the up-hand anddown-hand buttons.
Within a specific parent lane column you can apply custom sorting to the sub-lanes, so that the sub-lanes in that lane arein a different sequence to the same sub-lanes in a different lane. For a column that has assigned sub-lanes (that is, itcontains selected checkboxes) right-click on the header and select the 'Set lane order' option. A small dialog displays, inwhich you click on the sub-lane names and use the up-hand and down-hand buttons to put them in the required sequence.Click on the OK button to clear the dialog and apply the sub-lane. If a sub-lane order has been customized, you canreturn it to the 'across-the-board' order by right-clicking the header again and selecting the 'Reset lane order' option.
Notes
Sub-lanes are not backwards compatible with earlier releases of Enterprise Architect; if you open a Kanban diagram·containing sub-lanes in a release of the system earlier than Release 12.1, the sub-lanes will be permanently deletedfrom the diagram
Elements on a Kanban diagram are automatically adjusted to match the width of the sub-lane they are in, both when·the element is moved into a sub-lane and when the sub-lane width is changed
(c) Sparx Systems 2019 Page 26 of 172 Created with Enterprise Architect
Project Management - Project Management 20 January, 2020
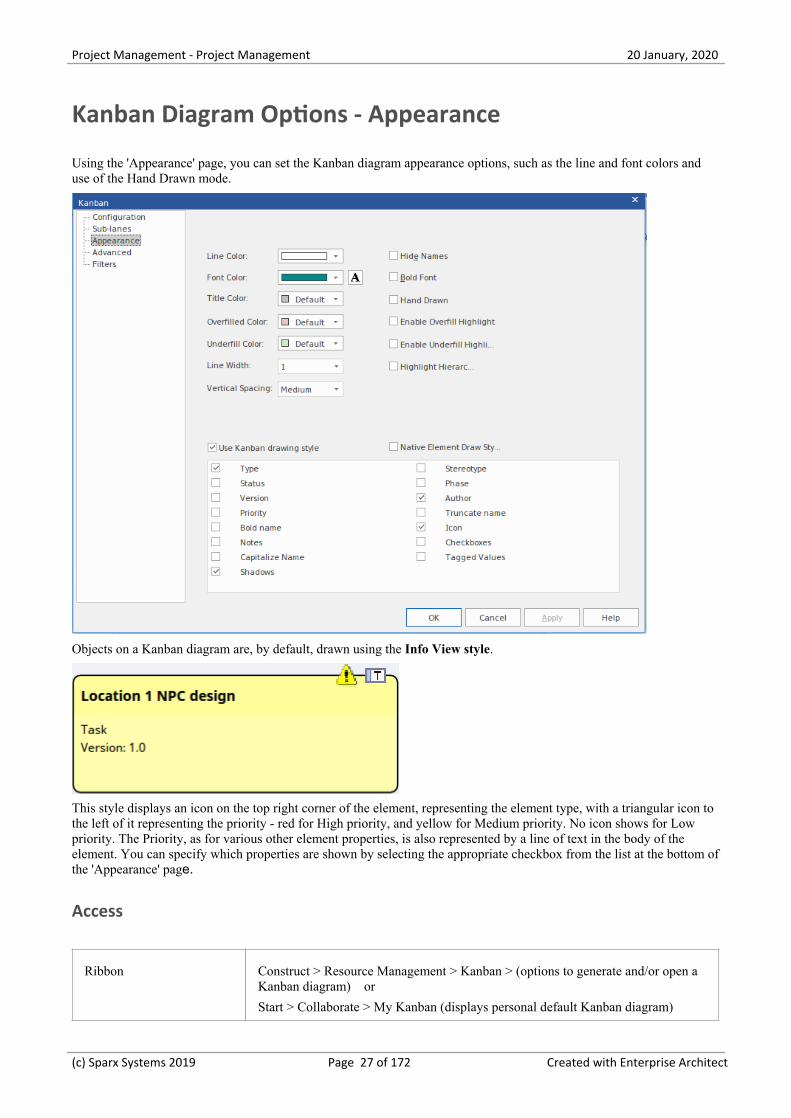
Kanban Diagram Options - Appearance
Using the 'Appearance' page, you can set the Kanban diagram appearance options, such as the line and font colors anduse of the Hand Drawn mode.
Objects on a Kanban diagram are, by default, drawn using the Info View style.
This style displays an icon on the top right corner of the element, representing the element type, with a triangular icon tothe left of it representing the priority - red for High priority, and yellow for Medium priority. No icon shows for Lowpriority. The Priority, as for various other element properties, is also represented by a line of text in the body of theelement. You can specify which properties are shown by selecting the appropriate checkbox from the list at the bottom ofthe 'Appearance' page.
Access
Ribbon Construct > Resource Management > Kanban > (options to generate and/or open aKanban diagram) or
Start > Collaborate > My Kanban (displays personal default Kanban diagram)
(c) Sparx Systems 2019 Page 27 of 172 Created with Enterprise Architect
Project Management - Project Management 20 January, 2020
Then
Design > Diagram > Manage > Kanban > Appearance (on an open Kanbandiagram)
Context Menu On a Kanban diagram, double-click on a lane > Appearance
On a diagram, right-click on background | Kanban > Appearance
Appearance Options
Option Action
Line Color Click on the drop-down arrow and select the color in which to display lane borders.This color does not apply to sub lane borders, which are automatically set to a paleor dark color to contrast with the lane fill color.
If the color you require is not shown, click on the More colors button and eitherselect from a wider range of standard colors or define a custom color.
The border style is automatically set to the 'chiseled' effect to give the appearanceof 3D blocks on a background, the color of the background being the line color. Theeffect is more obvious if you set the line to a pale color and not black.
Font Color Click on the drop-down arrow and select the color in which to display the text inthe Kanban lane and sub lane headings.
If the color you require is not shown, click on the More Colors button and eitherselect from a wider range of standard colors or define a custom color.
A Click on this button to display the 'Font' dialog, through which you define the fontand the style, size and effects of the text in the Kanban lane and sub lane headings.
If you also change the text color here, it overrides the setting of the 'Font Color'field.
Title Color Click on the drop-down arrow and select the color to use across the lane headingcells (separate from the fill colors you can apply individually to each of the lanesthemselves).
If the color you require is not shown, click on the More Colors button and eitherselect from a wider range of standard colors or define a custom color.
Overfilled Color Click on the drop-down arrow and select the color with which to fill a lane headingcell if the lane contains more than the maximum number of elements. You set themaximum number of elements when you define the lanes to work with, in the'Lanes' page.
If the color you require is not shown, click on the More colors button and eitherselect from a wider range of standard colors or define a custom color.
Underfill Color Click on the drop-down arrow and select the color with which to fill a lane headingcell if the column contains fewer than the maximum number of elements, in otherwords there is available capacity. You set the maximum number of elements whenyou define the lanes to work with, in the 'Lanes' page.
If the color you require is not shown, click on the More Colors button and eitherselect from a wider range of standard colors or define a custom color.
(c) Sparx Systems 2019 Page 28 of 172 Created with Enterprise Architect
Project Management - Project Management 20 January, 2020
Line Width Click on the drop-down arrow and select the line width of the Kanban lane borders- either 1 (thinnest), 2 or 3 (thickest).
Vertical Spacing Set this to 'Small', 'Medium' or 'Large' to define the degree of vertical separationbetween elements in a Kanban lane.
Hide Names Select this checkbox to hide the lane names and the column heading cells.
Bold Font Select this checkbox to display the lane headings in bold (if their font definitiondoes not already set them to bold).
Hand Drawn Select this checkbox to display the Kanban lanes and the elements on the diagramin 'Hand-drawn' mode.
Enable Overfill Highlight Select this checkbox to apply the 'overfilled' color to the lane header cell if itcontains more elements than the defined maximum number (see New).
Enable Underfill Highlight Select this checkbox to apply the 'underfilled' color to the lane header cell if thelane contains fewer elements than the defined maximum number; that is, if it hasany spare capacity.
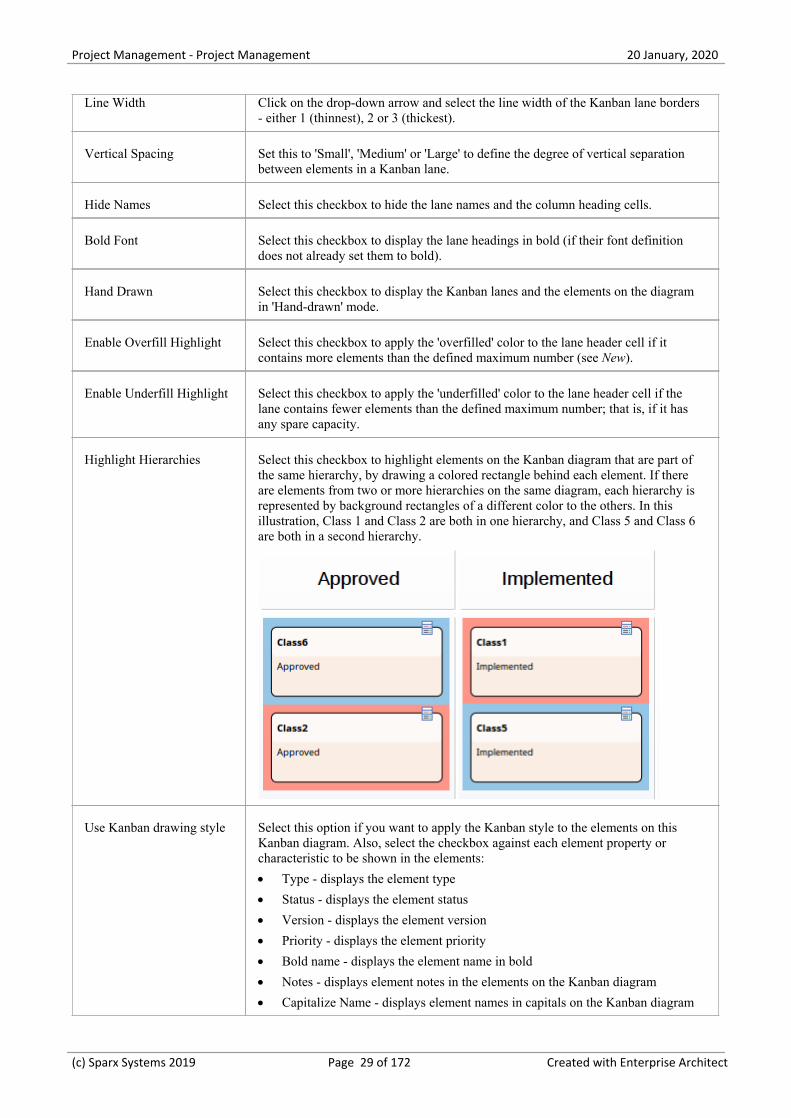
Highlight Hierarchies Select this checkbox to highlight elements on the Kanban diagram that are part ofthe same hierarchy, by drawing a colored rectangle behind each element. If thereare elements from two or more hierarchies on the same diagram, each hierarchy isrepresented by background rectangles of a different color to the others. In thisillustration, Class 1 and Class 2 are both in one hierarchy, and Class 5 and Class 6are both in a second hierarchy.
Use Kanban drawing style Select this option if you want to apply the Kanban style to the elements on thisKanban diagram. Also, select the checkbox against each element property orcharacteristic to be shown in the elements:
Type - displays the element type·
Status - displays the element status·
Version - displays the element version·
Priority - displays the element priority·
Bold name - displays the element name in bold·
Notes - displays element notes in the elements on the Kanban diagram·
Capitalize Name - displays element names in capitals on the Kanban diagram·
(c) Sparx Systems 2019 Page 29 of 172 Created with Enterprise Architect
Project Management - Project Management 20 January, 2020
Shadows - displays a shadow on the right and bottom edges of each element on·the diagram; this effect is not affected by the 'Element Shadows On' option onthe 'Preferences' dialog
Stereotype - displays the element stereotype·
Phase - displays the element phase·
Author - displays the name of the element's author·
Truncate name - cuts off the element name as it approaches the element border,·instead of allowing it to wrap around
Icon - selected by default; deselecting this checkbox hides the Type and·Priority icons in the top right corner of the element
Checkboxes - when Checklist elements are displayed on the Kanban diagram,·shows the Checklist checkboxes and items; Checklist Artifacts can be bound toPriority on a Kanban diagram, and this option makes it easy to view anyChecklists organized by Priority
Tagged Values - shows the Tagged Values of each element on the diagram, in·an element compartment
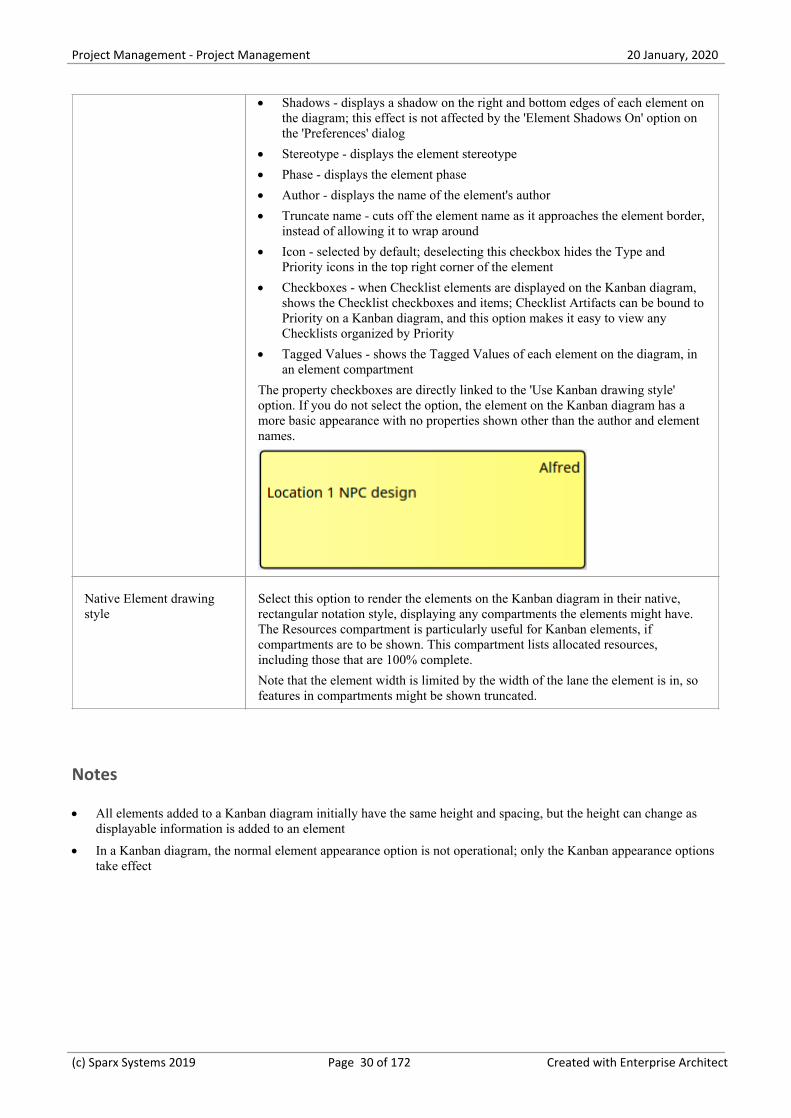
The property checkboxes are directly linked to the 'Use Kanban drawing style'option. If you do not select the option, the element on the Kanban diagram has amore basic appearance with no properties shown other than the author and elementnames.
Native Element drawingstyle
Select this option to render the elements on the Kanban diagram in their native,rectangular notation style, displaying any compartments the elements might have.The Resources compartment is particularly useful for Kanban elements, ifcompartments are to be shown. This compartment lists allocated resources,including those that are 100% complete.
Note that the element width is limited by the width of the lane the element is in, sofeatures in compartments might be shown truncated.
Notes
All elements added to a Kanban diagram initially have the same height and spacing, but the height can change as·displayable information is added to an element
In a Kanban diagram, the normal element appearance option is not operational; only the Kanban appearance options·take effect
(c) Sparx Systems 2019 Page 30 of 172 Created with Enterprise Architect
Project Management - Project Management 20 January, 2020
Kanban Diagram Options - Advanced
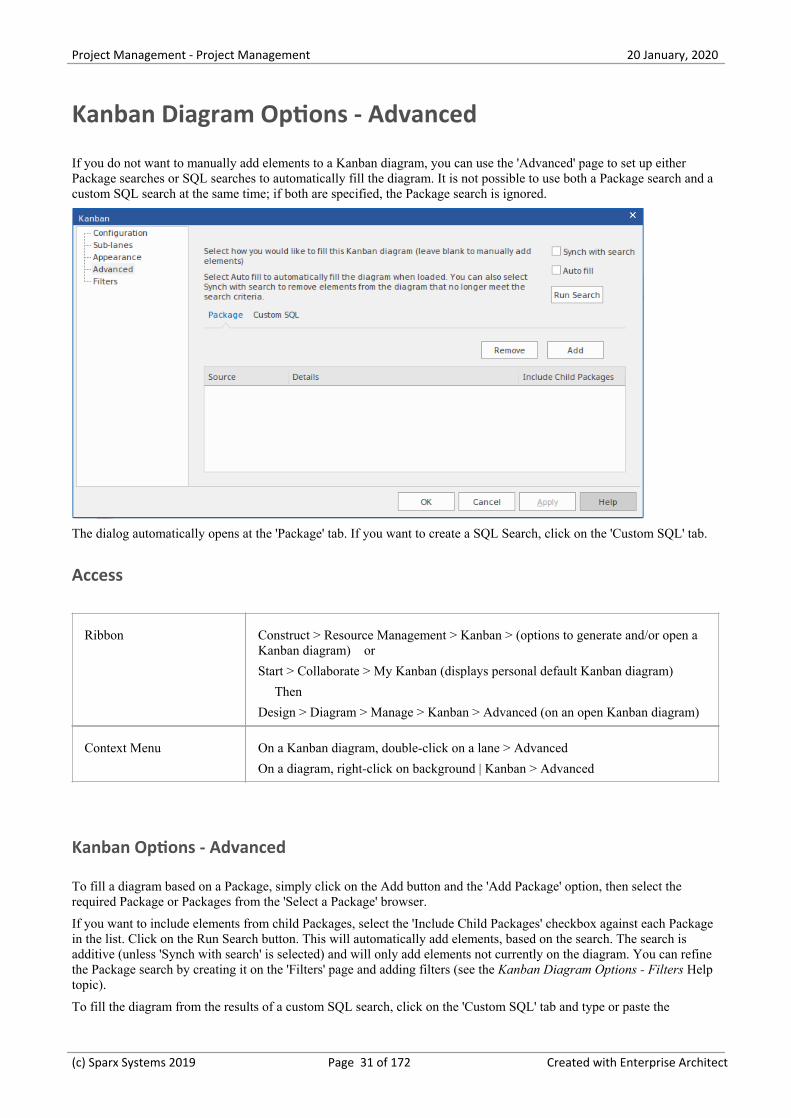
If you do not want to manually add elements to a Kanban diagram, you can use the 'Advanced' page to set up eitherPackage searches or SQL searches to automatically fill the diagram. It is not possible to use both a Package search and acustom SQL search at the same time; if both are specified, the Package search is ignored.
The dialog automatically opens at the 'Package' tab. If you want to create a SQL Search, click on the 'Custom SQL' tab.
Access
Ribbon Construct > Resource Management > Kanban > (options to generate and/or open aKanban diagram) or
Start > Collaborate > My Kanban (displays personal default Kanban diagram)
Then
Design > Diagram > Manage > Kanban > Advanced (on an open Kanban diagram)
Context Menu On a Kanban diagram, double-click on a lane > Advanced
On a diagram, right-click on background | Kanban > Advanced
Kanban Options - Advanced
To fill a diagram based on a Package, simply click on the Add button and the 'Add Package' option, then select therequired Package or Packages from the 'Select a Package' browser.
If you want to include elements from child Packages, select the 'Include Child Packages' checkbox against each Packagein the list. Click on the Run Search button. This will automatically add elements, based on the search. The search isadditive (unless 'Synch with search' is selected) and will only add elements not currently on the diagram. You can refinethe Package search by creating it on the 'Filters' page and adding filters (see the Kanban Diagram Options - Filters Helptopic).
To fill the diagram from the results of a custom SQL search, click on the 'Custom SQL' tab and type or paste the
(c) Sparx Systems 2019 Page 31 of 172 Created with Enterprise Architect
Project Management - Project Management 20 January, 2020
appropriate SQL. In order for the diagram to be filled, you must include in the SQL Select statement:
Object_ID as Element_ID
For example:
Select Object_ID as Element_ID From t_object Where Object_Type = 'Requirement'
Option Action
Add On the 'Package' tab, if you are using a search or filter (from the 'Filters' page of thedialog) you must define a Package or Packages for the search or filter to work on.You do this by clicking the Add button and choosing either 'Add Package' tobrowse to a selected Package, or 'Search Model' to search or filter from all elementsin the current model.
Remove If you want to clear a Package from the list (or the whole-model selection) click onthe item line and click on this button.
Include Child Packages If you have selected a Package with a child structure, select this checkbox to alsoinclude the elements from the structure in the Kanban diagram, or clear thecheckbox to include elements from the selected Package only.
Auto fill When you select this option, the search configured for the Kanban diagram willautomatically run whenever the diagram is opened or reloaded.
Synch with search Selecting this option will synchronize the diagram with the current search when it isrun. That is:
New elements that match the search but are not currently on the diagram will·be added and
Elements on the diagram that now do not match the search will be removed·
Run Search When you have set up either a Package search or a custom SQL search, click on theRun Search button to fill the diagram. All elements found by the SQL search areadded to the diagram.
If you have not applied a filter to a Package Search, all elements from the selectedPackages are added to the diagram. If you have used a filter, only those elementsthat meet the filter criteria are added.
A 'Progress' dialog displays during the search. If the search is taking a long time oris finding too many elements, click on the Cancel button; any objects already addedto the diagram are removed.
(c) Sparx Systems 2019 Page 32 of 172 Created with Enterprise Architect
Project Management - Project Management 20 January, 2020
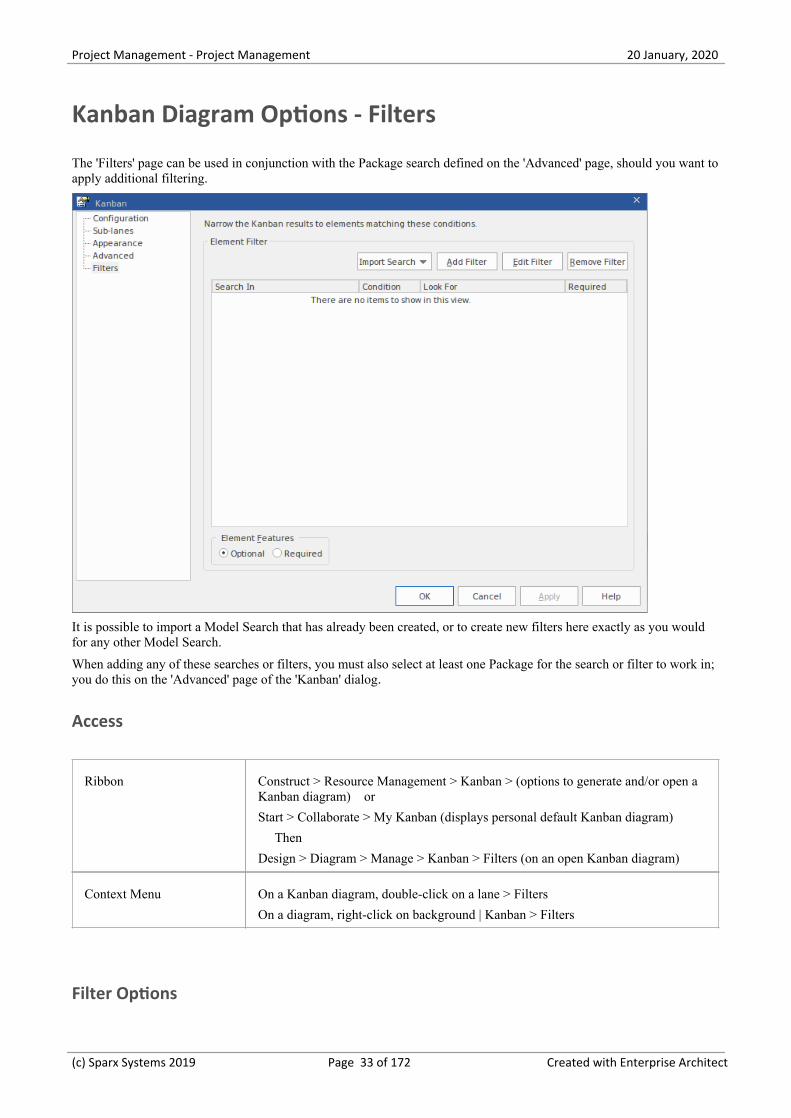
Kanban Diagram Options - Filters
The 'Filters' page can be used in conjunction with the Package search defined on the 'Advanced' page, should you want toapply additional filtering.
It is possible to import a Model Search that has already been created, or to create new filters here exactly as you wouldfor any other Model Search.
When adding any of these searches or filters, you must also select at least one Package for the search or filter to work in;you do this on the 'Advanced' page of the 'Kanban' dialog.
Access
Ribbon Construct > Resource Management > Kanban > (options to generate and/or open aKanban diagram) or
Start > Collaborate > My Kanban (displays personal default Kanban diagram)
Then
Design > Diagram > Manage > Kanban > Filters (on an open Kanban diagram)
Context Menu On a Kanban diagram, double-click on a lane > Filters
On a diagram, right-click on background | Kanban > Filters
Filter Options
(c) Sparx Systems 2019 Page 33 of 172 Created with Enterprise Architect
Project Management - Project Management 20 January, 2020
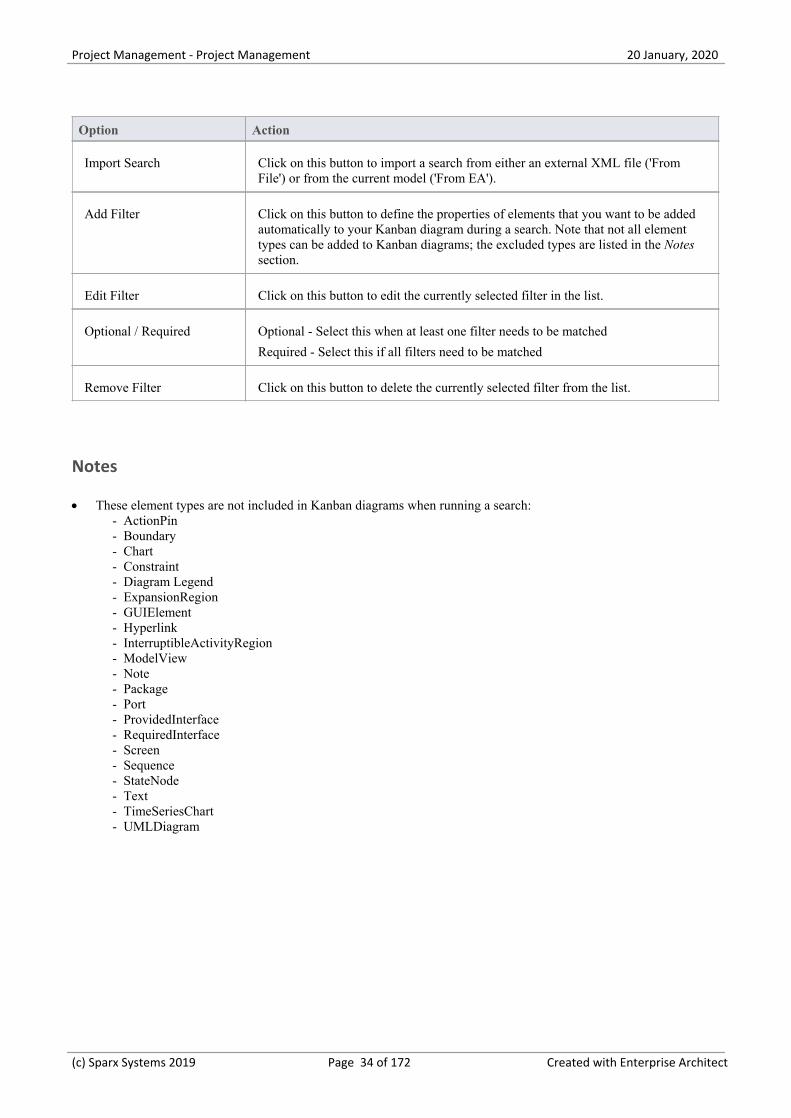
Option Action
Import Search Click on this button to import a search from either an external XML file ('FromFile') or from the current model ('From EA').
Add Filter Click on this button to define the properties of elements that you want to be addedautomatically to your Kanban diagram during a search. Note that not all elementtypes can be added to Kanban diagrams; the excluded types are listed in the Notessection.
Edit Filter Click on this button to edit the currently selected filter in the list.
Optional / Required Optional - Select this when at least one filter needs to be matched
Required - Select this if all filters need to be matched
Remove Filter Click on this button to delete the currently selected filter from the list.
Notes
These element types are not included in Kanban diagrams when running a search:· - ActionPin - Boundary - Chart - Constraint - Diagram Legend - ExpansionRegion - GUIElement - Hyperlink - InterruptibleActivityRegion - ModelView - Note - Package - Port - ProvidedInterface - RequiredInterface - Screen - Sequence - StateNode - Text - TimeSeriesChart - UMLDiagram
(c) Sparx Systems 2019 Page 34 of 172 Created with Enterprise Architect
Project Management - Project Management 20 January, 2020
Default Kanban Diagrams
A default Kanban diagram can be set for the entire repository, and each individual user can also set their own defaultKanban diagram; in both cases there are specific options to locate and open the diagrams. These defaults help you toquickly and easily get access to a Kanban board and immediately start contributing to work items that will deliver valueto the customer.
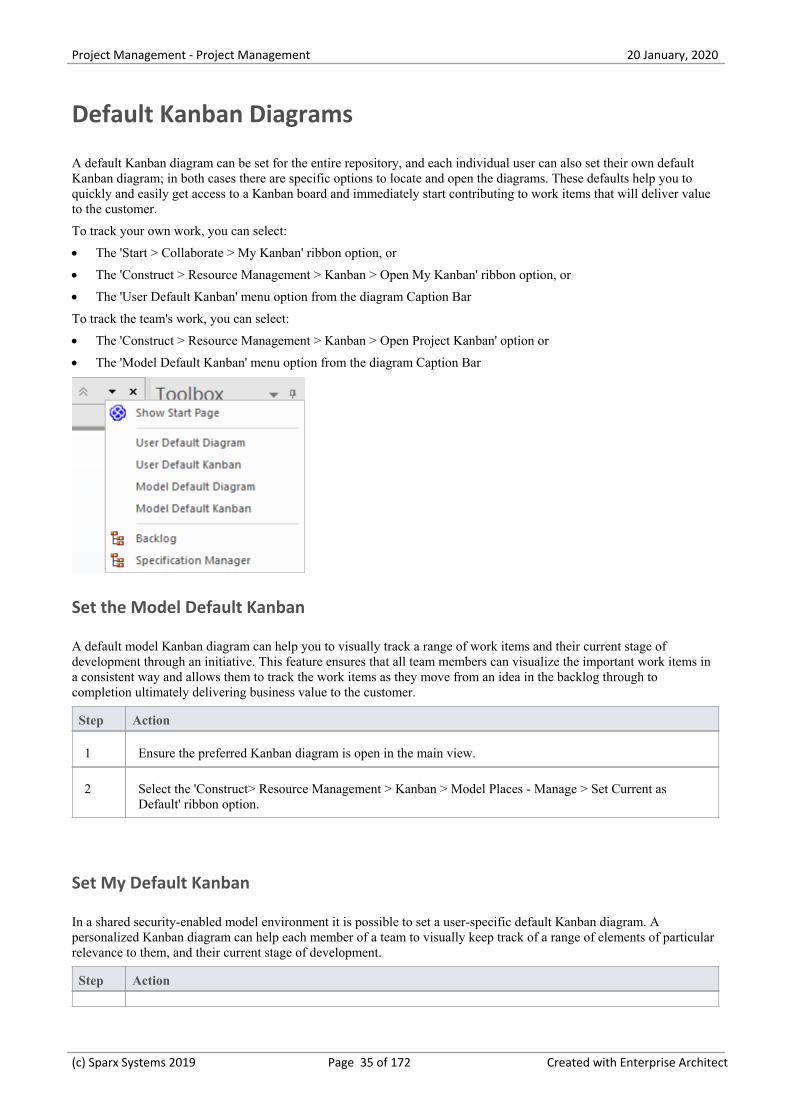
To track your own work, you can select:
The 'Start > Collaborate > My Kanban' ribbon option, or·
The 'Construct > Resource Management > Kanban > Open My Kanban' ribbon option, or·
The 'User Default Kanban' menu option from the diagram Caption Bar·
To track the team's work, you can select:
The 'Construct > Resource Management > Kanban > Open Project Kanban' option or·
The 'Model Default Kanban' menu option from the diagram Caption Bar·
Set the Model Default Kanban
A default model Kanban diagram can help you to visually track a range of work items and their current stage ofdevelopment through an initiative. This feature ensures that all team members can visualize the important work items ina consistent way and allows them to track the work items as they move from an idea in the backlog through tocompletion ultimately delivering business value to the customer.
Step Action
1 Ensure the preferred Kanban diagram is open in the main view.
2 Select the 'Construct> Resource Management > Kanban > Model Places - Manage > Set Current asDefault' ribbon option.
Set My Default Kanban
In a shared security-enabled model environment it is possible to set a user-specific default Kanban diagram. Apersonalized Kanban diagram can help each member of a team to visually keep track of a range of elements of particularrelevance to them, and their current stage of development.
Step Action
(c) Sparx Systems 2019 Page 35 of 172 Created with Enterprise Architect
Project Management - Project Management 20 January, 2020
1 Ensure your preferred Kanban diagram is open in the main view.
2 Select the 'Construct> Resource Management > Kanban > My Places - Manage > Set Current as Default'ribbon option.
Notes
The model must have user security enabled in order to define a user default Kanban diagram·
(c) Sparx Systems 2019 Page 36 of 172 Created with Enterprise Architect
Project Management - Project Management 20 January, 2020
Allocating Resources to Work Items
Enterprise Architect not only helps you to define the work items for a Kanban diagram or workflow but also acts as asophisticated platform for the allocation and management of resources and the flow of items through the board. Thisfunctionality uses both Kanban diagrams and the Resource Allocation features.
Resources are the people who work on a project; they can be assigned roles and allocated tasks, and these roles and taskscan be visualized on a Kanban diagram.
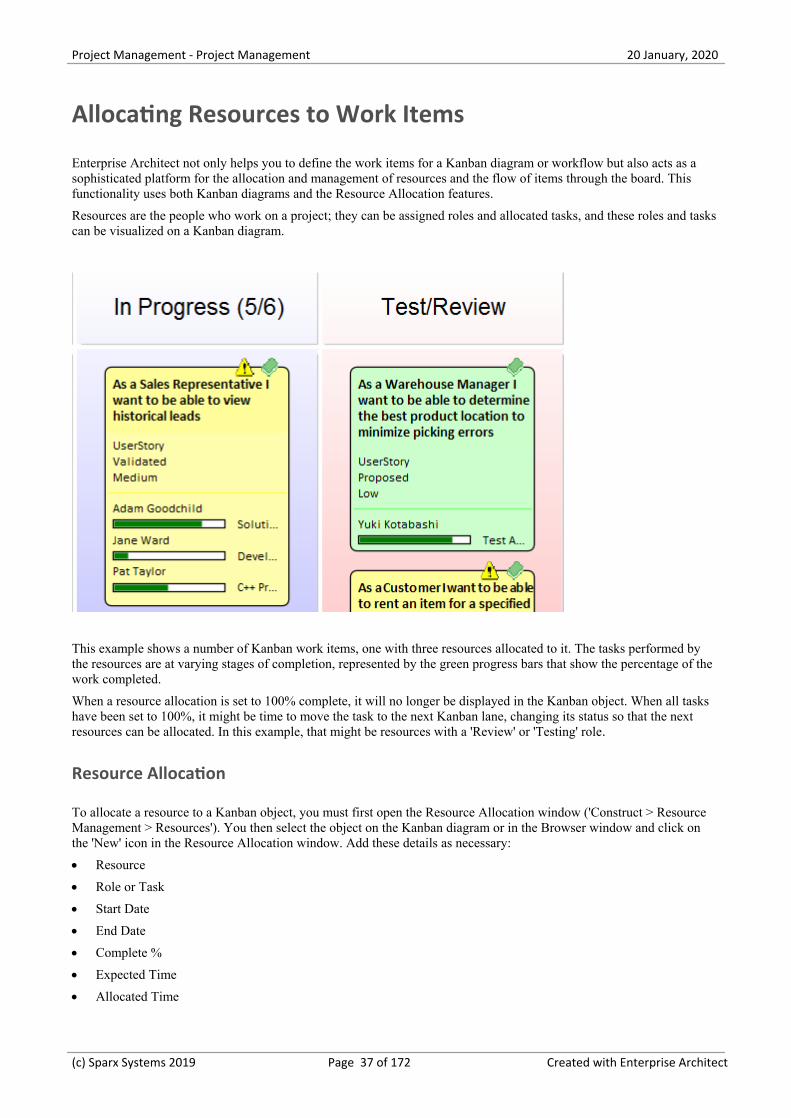
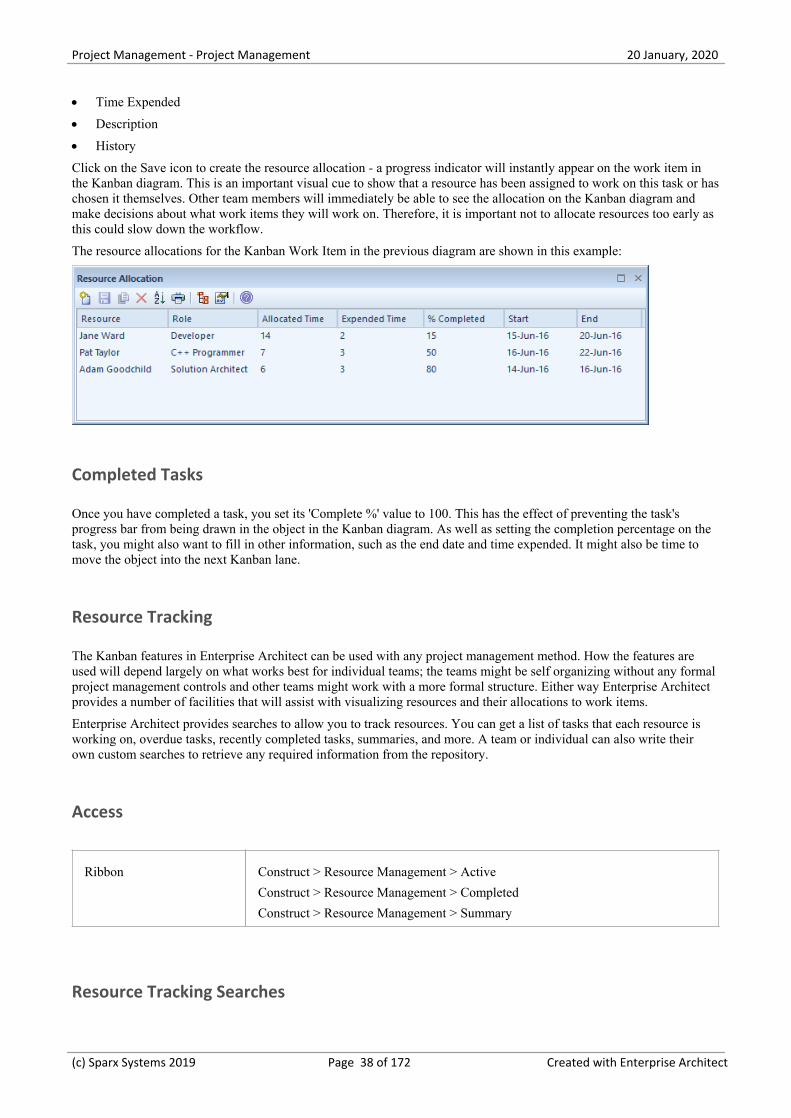
This example shows a number of Kanban work items, one with three resources allocated to it. The tasks performed bythe resources are at varying stages of completion, represented by the green progress bars that show the percentage of thework completed.
When a resource allocation is set to 100% complete, it will no longer be displayed in the Kanban object. When all taskshave been set to 100%, it might be time to move the task to the next Kanban lane, changing its status so that the nextresources can be allocated. In this example, that might be resources with a 'Review' or 'Testing' role.
Resource Allocation
To allocate a resource to a Kanban object, you must first open the Resource Allocation window ('Construct > ResourceManagement > Resources'). You then select the object on the Kanban diagram or in the Browser window and click onthe 'New' icon in the Resource Allocation window. Add these details as necessary:
Resource·
Role or Task·
Start Date·
End Date·
Complete %·
Expected Time·
Allocated Time·
(c) Sparx Systems 2019 Page 37 of 172 Created with Enterprise Architect
Project Management - Project Management 20 January, 2020
Time Expended·
Description·
History·
Click on the Save icon to create the resource allocation - a progress indicator will instantly appear on the work item inthe Kanban diagram. This is an important visual cue to show that a resource has been assigned to work on this task or haschosen it themselves. Other team members will immediately be able to see the allocation on the Kanban diagram andmake decisions about what work items they will work on. Therefore, it is important not to allocate resources too early asthis could slow down the workflow.
The resource allocations for the Kanban Work Item in the previous diagram are shown in this example:
Completed Tasks
Once you have completed a task, you set its 'Complete %' value to 100. This has the effect of preventing the task'sprogress bar from being drawn in the object in the Kanban diagram. As well as setting the completion percentage on thetask, you might also want to fill in other information, such as the end date and time expended. It might also be time tomove the object into the next Kanban lane.
Resource Tracking
The Kanban features in Enterprise Architect can be used with any project management method. How the features areused will depend largely on what works best for individual teams; the teams might be self organizing without any formalproject management controls and other teams might work with a more formal structure. Either way Enterprise Architectprovides a number of facilities that will assist with visualizing resources and their allocations to work items.
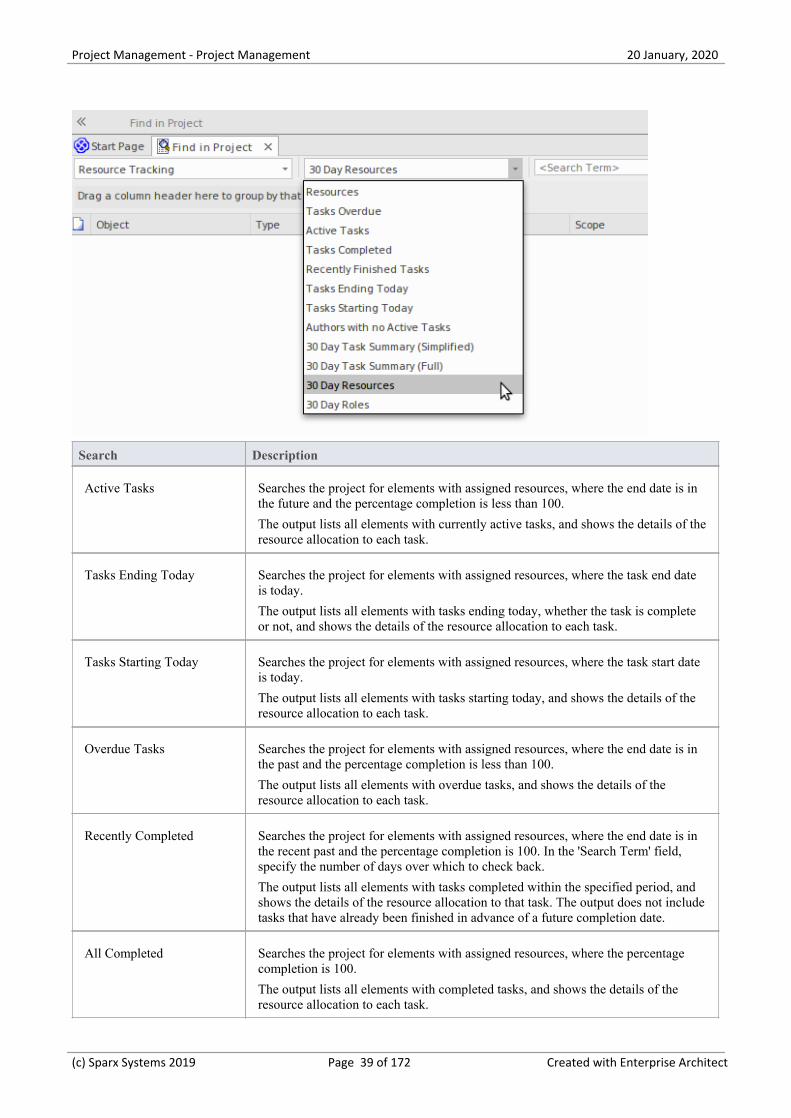
Enterprise Architect provides searches to allow you to track resources. You can get a list of tasks that each resource isworking on, overdue tasks, recently completed tasks, summaries, and more. A team or individual can also write theirown custom searches to retrieve any required information from the repository.
Access
Ribbon Construct > Resource Management > Active
Construct > Resource Management > Completed
Construct > Resource Management > Summary
Resource Tracking Searches
(c) Sparx Systems 2019 Page 38 of 172 Created with Enterprise Architect
Project Management - Project Management 20 January, 2020
Search Description
Active Tasks Searches the project for elements with assigned resources, where the end date is inthe future and the percentage completion is less than 100.
The output lists all elements with currently active tasks, and shows the details of theresource allocation to each task.
Tasks Ending Today Searches the project for elements with assigned resources, where the task end dateis today.
The output lists all elements with tasks ending today, whether the task is completeor not, and shows the details of the resource allocation to each task.
Tasks Starting Today Searches the project for elements with assigned resources, where the task start dateis today.
The output lists all elements with tasks starting today, and shows the details of theresource allocation to each task.
Overdue Tasks Searches the project for elements with assigned resources, where the end date is inthe past and the percentage completion is less than 100.
The output lists all elements with overdue tasks, and shows the details of theresource allocation to each task.
Recently Completed Searches the project for elements with assigned resources, where the end date is inthe recent past and the percentage completion is 100. In the 'Search Term' field,specify the number of days over which to check back.
The output lists all elements with tasks completed within the specified period, andshows the details of the resource allocation to that task. The output does not includetasks that have already been finished in advance of a future completion date.
All Completed Searches the project for elements with assigned resources, where the percentagecompletion is 100.
The output lists all elements with completed tasks, and shows the details of theresource allocation to each task.
(c) Sparx Systems 2019 Page 39 of 172 Created with Enterprise Architect
Project Management - Project Management 20 January, 2020
30 Day Task Summary(Brief)
Provides a brief summary of the tasks performed by resources over the previousmonth.
The output groups tasks with similar project role and calculates for each resource:the count, the sum of expected time, and the sum of expended time for all tasks thathave started in the last 30 days. To look at or change the master list of project rolesthat this search uses for grouping tasks, select 'Configure > Reference Data >Model Types > People > Project Roles'. Grouping by similar project role meansthat, for example, 'Review 1' and 'Review 2' would be grouped together under'Review' if and only if the current project's list of project roles includes one called'Review'.
30 Day Task Summary(Full)
Provides a full summary of the tasks performed by resources over the previousmonth.
The output groups tasks by project role and resource, and lists the count, sum ofexpected time, and sum of expended time for all tasks that have started in the last30 days.
30 Day Resources Searches the project for tasks that have started in the last 30 days where theresource name matches (fully or partially) the text in the <Search Term>.
30 Day Roles Searches the project for tasks that have started in the last 30 days where the rolename matches (fully or partially) the text in the <Search Term>.
Charts and Dashboards
Enterprise Architect has a sophisticated charting facility that allows a wide range of charts to be created, through whichyou can visualize and analyze repository information. This is particularly useful with Kanban diagrams and resourceallocations, and provides an alternative view of the Kanban cards, allowing a Product Owner, Project Manager or otherteam member to get a visual image of things such as the Number of Active Tasks by developer, the Phases the WorkItems are in by developer, the Number of Work Items at each stage of a Kanban Board and much more. The charts canprovide powerful information that will help improve the teams performance and ultimately result in high value productor service features being available to customers in the shortest possible time frame. Any number of charts can be createdfrom built-in Patterns, but a team is also free to create user defined charts, dashboards and reports.
Example - Active Work Items by Team Member
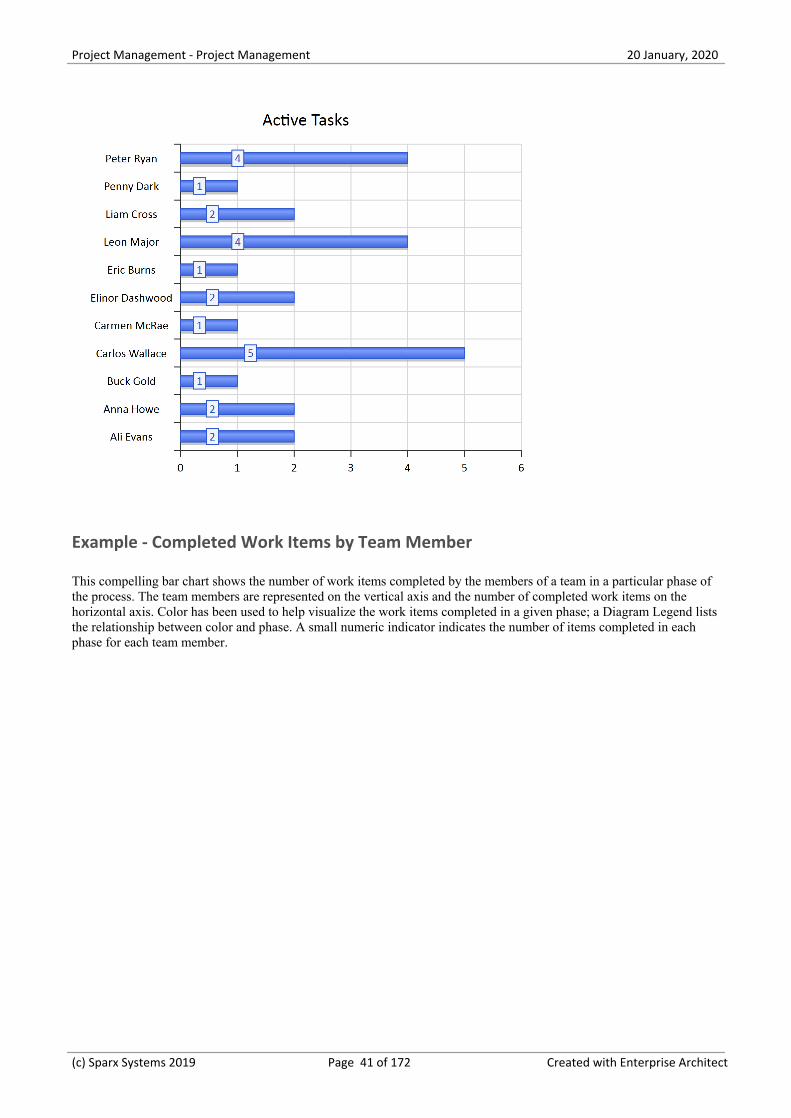
This bar chart shows the number of active tasks by team member. The names of the team members are listed on thevertical axis and the Number of Tasks on the horizontal axis. A small numerical value indicates the number of activetasks allocated to each team member.
(c) Sparx Systems 2019 Page 40 of 172 Created with Enterprise Architect
Project Management - Project Management 20 January, 2020
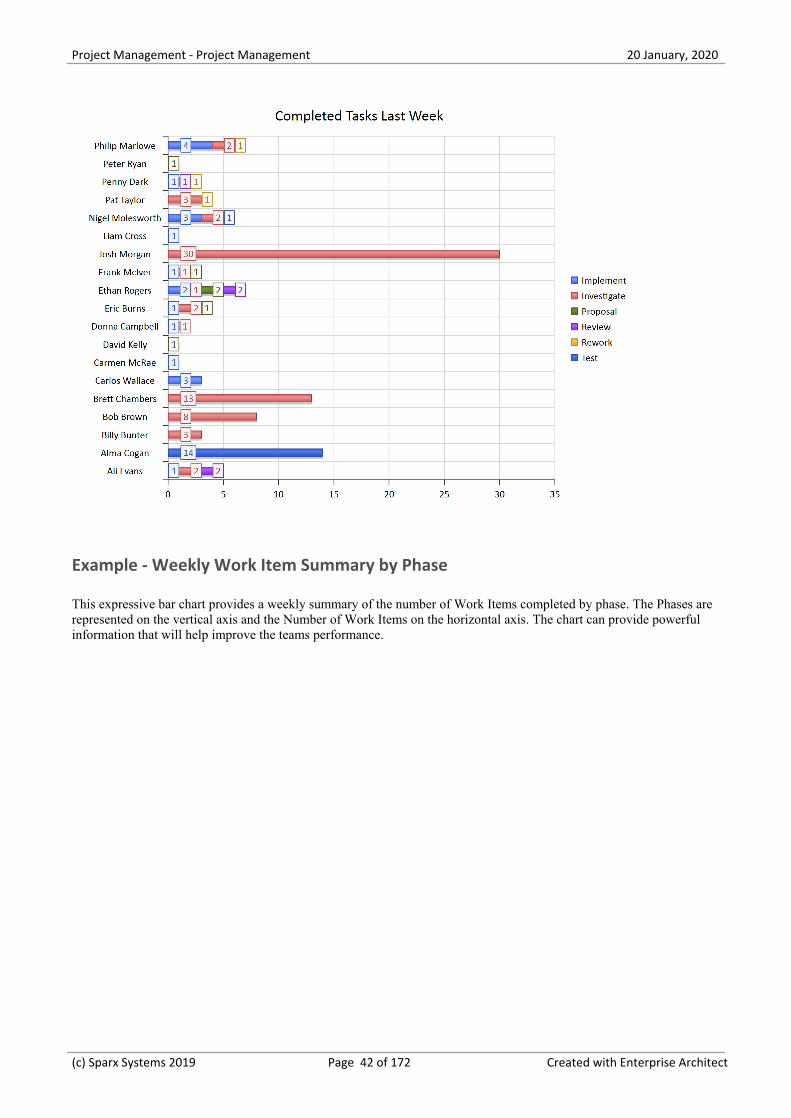
Example - Completed Work Items by Team Member
This compelling bar chart shows the number of work items completed by the members of a team in a particular phase ofthe process. The team members are represented on the vertical axis and the number of completed work items on thehorizontal axis. Color has been used to help visualize the work items completed in a given phase; a Diagram Legend liststhe relationship between color and phase. A small numeric indicator indicates the number of items completed in eachphase for each team member.
(c) Sparx Systems 2019 Page 41 of 172 Created with Enterprise Architect
Project Management - Project Management 20 January, 2020
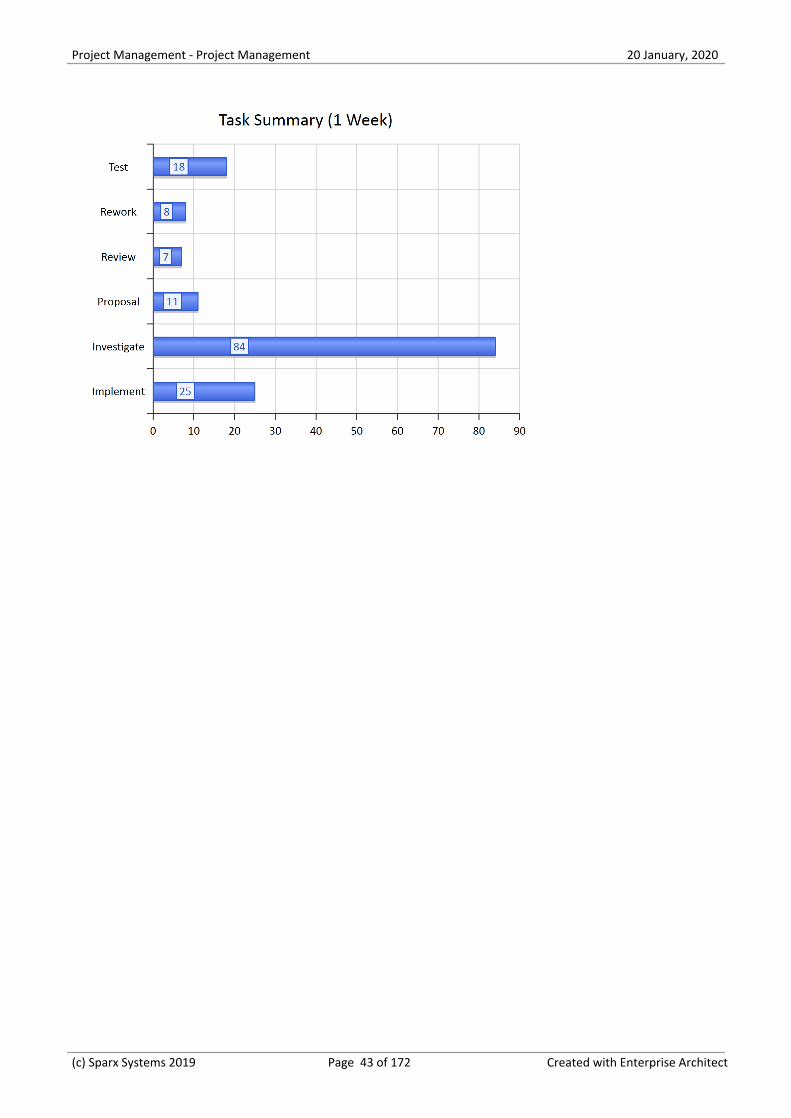
Example - Weekly Work Item Summary by Phase
This expressive bar chart provides a weekly summary of the number of Work Items completed by phase. The Phases arerepresented on the vertical axis and the Number of Work Items on the horizontal axis. The chart can provide powerfulinformation that will help improve the teams performance.
(c) Sparx Systems 2019 Page 42 of 172 Created with Enterprise Architect
Project Management - Project Management 20 January, 2020
(c) Sparx Systems 2019 Page 43 of 172 Created with Enterprise Architect
Project Management - Project Management 20 January, 2020
Related Model Elements
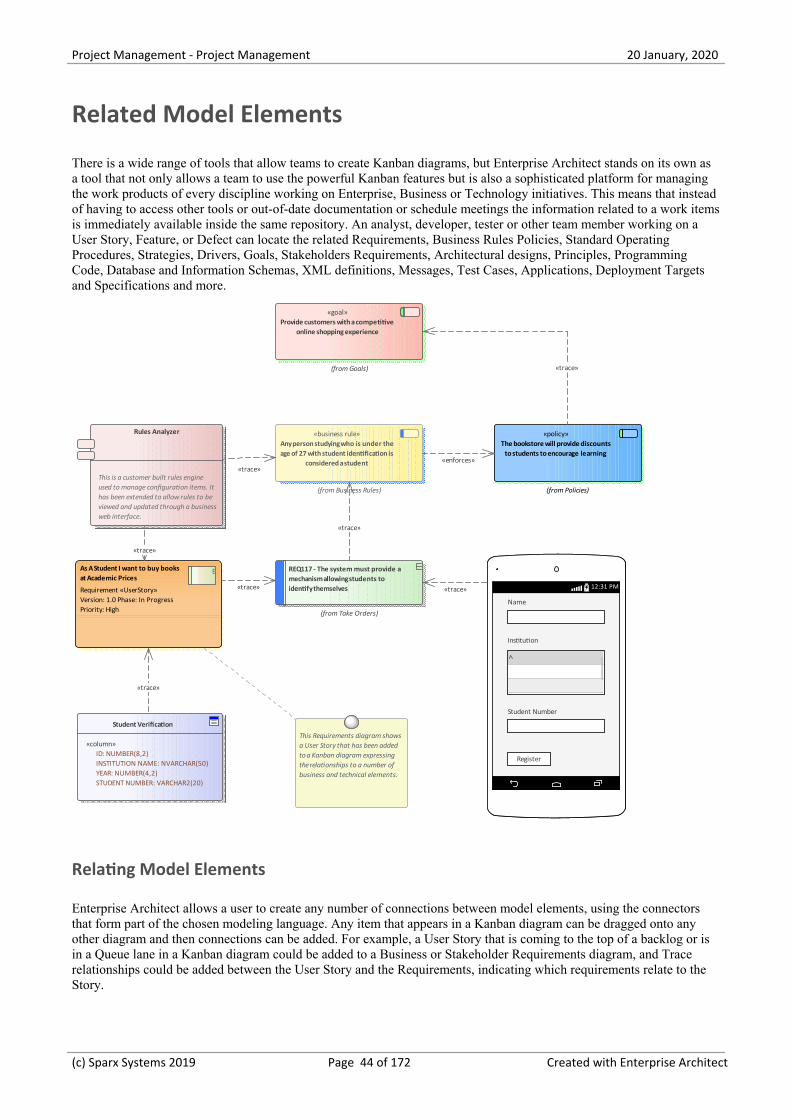
There is a wide range of tools that allow teams to create Kanban diagrams, but Enterprise Architect stands on its own asa tool that not only allows a team to use the powerful Kanban features but is also a sophisticated platform for managingthe work products of every discipline working on Enterprise, Business or Technology initiatives. This means that insteadof having to access other tools or out-of-date documentation or schedule meetings the information related to a work itemsis immediately available inside the same repository. An analyst, developer, tester or other team member working on aUser Story, Feature, or Defect can locate the related Requirements, Business Rules Policies, Standard OperatingProcedures, Strategies, Drivers, Goals, Stakeholders Requirements, Architectural designs, Principles, ProgrammingCode, Database and Information Schemas, XML definitions, Messages, Test Cases, Applications, Deployment Targetsand Specifications and more.
12:31 PM12:31 PM
REQ117 - The system must provide amechanism allowing students toidentify themselves
(from Take Orders)
As A Student I want to buy booksat Academic Prices
Requirement «UserStory»Version: 1.0 Phase: In ProgressPriority: High
E
«business rule»Any person studying who is under theage of 27 with student identification is
considered a student
(from Business Rules)
«policy»The bookstore will provide discounts
to students to encourage learning
(from Policies)
«goal»Provide customers with a competitive
online shopping experience
(from Goals)
Student Verification
«column» ID: NUMBER(8,2) INSTITUTION NAME: NVARCHAR(50) YEAR: NUMBER(4,2) STUDENT NUMBER: VARCHAR2(20)
Rules Analyzer
This is a customer built rules engine used to manage configuration items. It has been extended to allow rules to be viewed and updated through a business web interface.
This Requirements diagram shows a User Story that has been added to a Kanban diagram expressing the relationships to a number of business and technical elements.
Name
Institution
Student Number
Register
«trace»
«trace»
«trace»
«trace»
«trace»
«trace»
«enforces»«trace»
Relating Model Elements
Enterprise Architect allows a user to create any number of connections between model elements, using the connectorsthat form part of the chosen modeling language. Any item that appears in a Kanban diagram can be dragged onto anyother diagram and then connections can be added. For example, a User Story that is coming to the top of a backlog or isin a Queue lane in a Kanban diagram could be added to a Business or Stakeholder Requirements diagram, and Tracerelationships could be added between the User Story and the Requirements, indicating which requirements relate to theStory.
(c) Sparx Systems 2019 Page 44 of 172 Created with Enterprise Architect
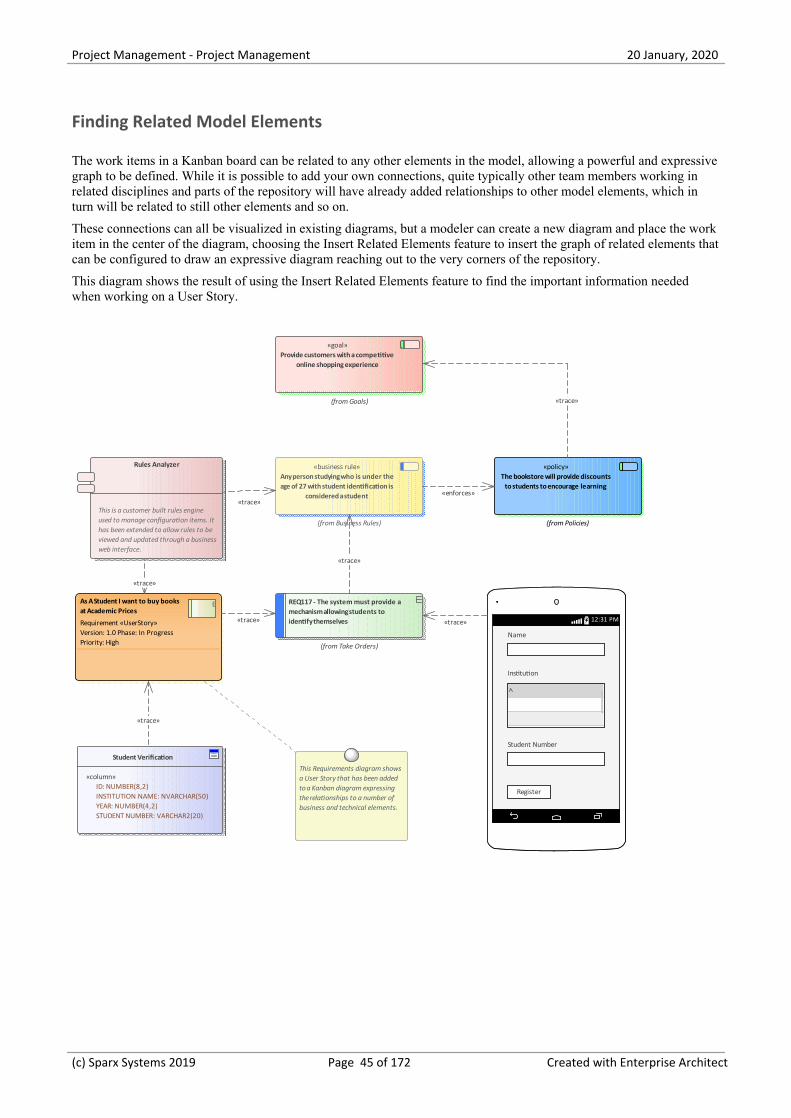
Project Management - Project Management 20 January, 2020
Finding Related Model Elements
The work items in a Kanban board can be related to any other elements in the model, allowing a powerful and expressivegraph to be defined. While it is possible to add your own connections, quite typically other team members working inrelated disciplines and parts of the repository will have already added relationships to other model elements, which inturn will be related to still other elements and so on.
These connections can all be visualized in existing diagrams, but a modeler can create a new diagram and place the workitem in the center of the diagram, choosing the Insert Related Elements feature to insert the graph of related elements thatcan be configured to draw an expressive diagram reaching out to the very corners of the repository.
This diagram shows the result of using the Insert Related Elements feature to find the important information neededwhen working on a User Story.
12:31 PM12:31 PM
REQ117 - The system must provide amechanism allowing students toidentify themselves
(from Take Orders)
As A Student I want to buy booksat Academic Prices
Requirement «UserStory»Version: 1.0 Phase: In ProgressPriority: High
E
«business rule»Any person studying who is under theage of 27 with student identification is
considered a student
(from Business Rules)
«policy»The bookstore will provide discounts
to students to encourage learning
(from Policies)
«goal»Provide customers with a competitive
online shopping experience
(from Goals)
Student Verification
«column» ID: NUMBER(8,2) INSTITUTION NAME: NVARCHAR(50) YEAR: NUMBER(4,2) STUDENT NUMBER: VARCHAR2(20)
Rules Analyzer
This is a customer built rules engine used to manage configuration items. It has been extended to allow rules to be viewed and updated through a business web interface.
This Requirements diagram shows a User Story that has been added to a Kanban diagram expressing the relationships to a number of business and technical elements.
Name
Institution
Student Number
Register
«trace»
«trace»
«enforces»
«trace»
«trace»
«trace»
«trace»
«trace»
(c) Sparx Systems 2019 Page 45 of 172 Created with Enterprise Architect
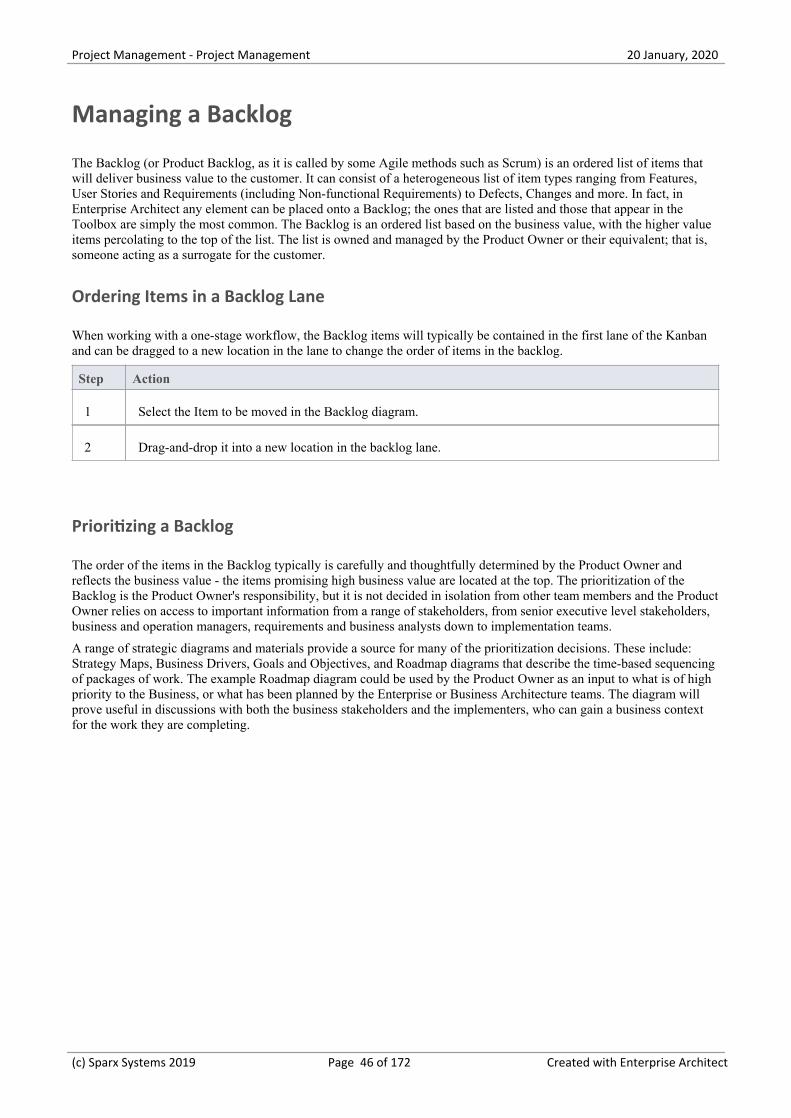
Project Management - Project Management 20 January, 2020
Managing a Backlog
The Backlog (or Product Backlog, as it is called by some Agile methods such as Scrum) is an ordered list of items thatwill deliver business value to the customer. It can consist of a heterogeneous list of item types ranging from Features,User Stories and Requirements (including Non-functional Requirements) to Defects, Changes and more. In fact, inEnterprise Architect any element can be placed onto a Backlog; the ones that are listed and those that appear in theToolbox are simply the most common. The Backlog is an ordered list based on the business value, with the higher valueitems percolating to the top of the list. The list is owned and managed by the Product Owner or their equivalent; that is,someone acting as a surrogate for the customer.
Ordering Items in a Backlog Lane
When working with a one-stage workflow, the Backlog items will typically be contained in the first lane of the Kanbanand can be dragged to a new location in the lane to change the order of items in the backlog.
Step Action
1 Select the Item to be moved in the Backlog diagram.
2 Drag-and-drop it into a new location in the backlog lane.
Prioritizing a Backlog
The order of the items in the Backlog typically is carefully and thoughtfully determined by the Product Owner andreflects the business value - the items promising high business value are located at the top. The prioritization of theBacklog is the Product Owner's responsibility, but it is not decided in isolation from other team members and the ProductOwner relies on access to important information from a range of stakeholders, from senior executive level stakeholders,business and operation managers, requirements and business analysts down to implementation teams.
A range of strategic diagrams and materials provide a source for many of the prioritization decisions. These include:Strategy Maps, Business Drivers, Goals and Objectives, and Roadmap diagrams that describe the time-based sequencingof packages of work. The example Roadmap diagram could be used by the Product Owner as an input to what is of highpriority to the Business, or what has been planned by the Enterprise or Business Architecture teams. The diagram willprove useful in discussions with both the business stakeholders and the implementers, who can gain a business contextfor the work they are completing.
(c) Sparx Systems 2019 Page 46 of 172 Created with Enterprise Architect
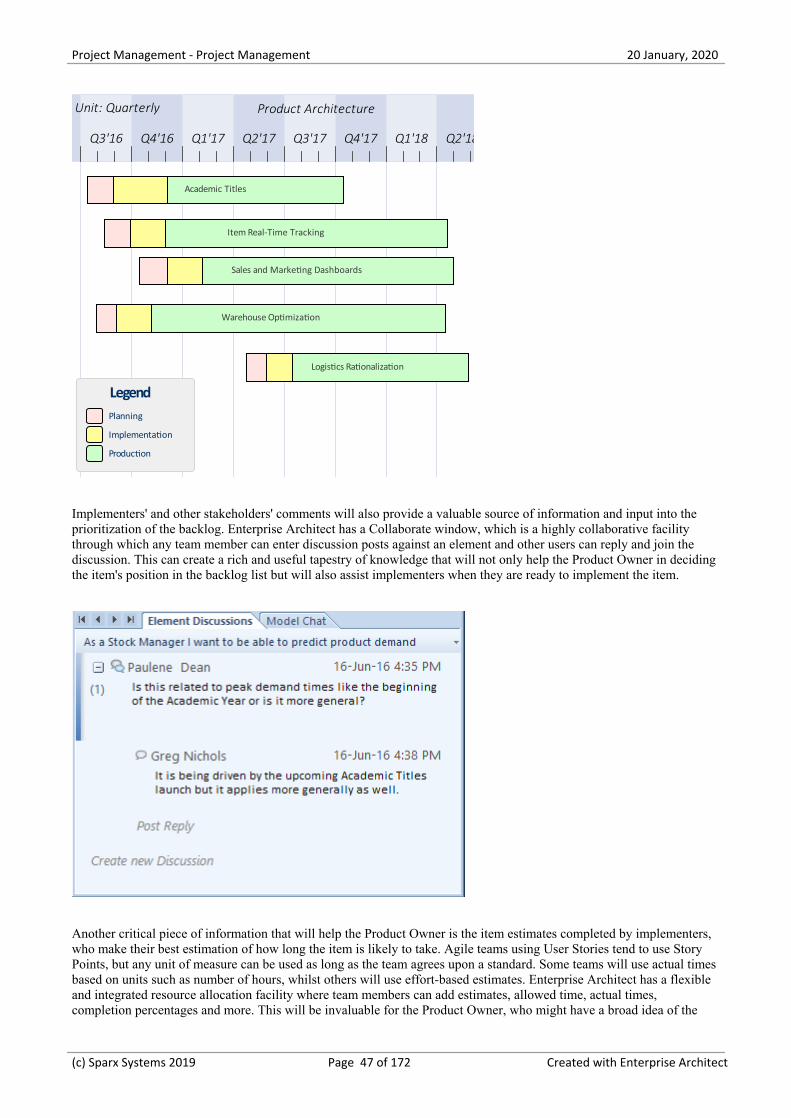
Project Management - Project Management 20 January, 2020
Item Real-Time Tracking
Academic Titles
Sales and Marketing Dashboards
Warehouse Optimization
Logistics Rationalization
Planning
Implementation
Production
Legend
Q3'16 Q4'16 Q1'17 Q2'17 Q3'17 Q4'17 Q1'18 Q2'18
Unit: Quarterly Product Architecture
Implementers' and other stakeholders' comments will also provide a valuable source of information and input into theprioritization of the backlog. Enterprise Architect has a Collaborate window, which is a highly collaborative facilitythrough which any team member can enter discussion posts against an element and other users can reply and join thediscussion. This can create a rich and useful tapestry of knowledge that will not only help the Product Owner in decidingthe item's position in the backlog list but will also assist implementers when they are ready to implement the item.
Another critical piece of information that will help the Product Owner is the item estimates completed by implementers,who make their best estimation of how long the item is likely to take. Agile teams using User Stories tend to use StoryPoints, but any unit of measure can be used as long as the team agrees upon a standard. Some teams will use actual timesbased on units such as number of hours, whilst others will use effort-based estimates. Enterprise Architect has a flexibleand integrated resource allocation facility where team members can add estimates, allowed time, actual times,completion percentages and more. This will be invaluable for the Product Owner, who might have a broad idea of the
(c) Sparx Systems 2019 Page 47 of 172 Created with Enterprise Architect
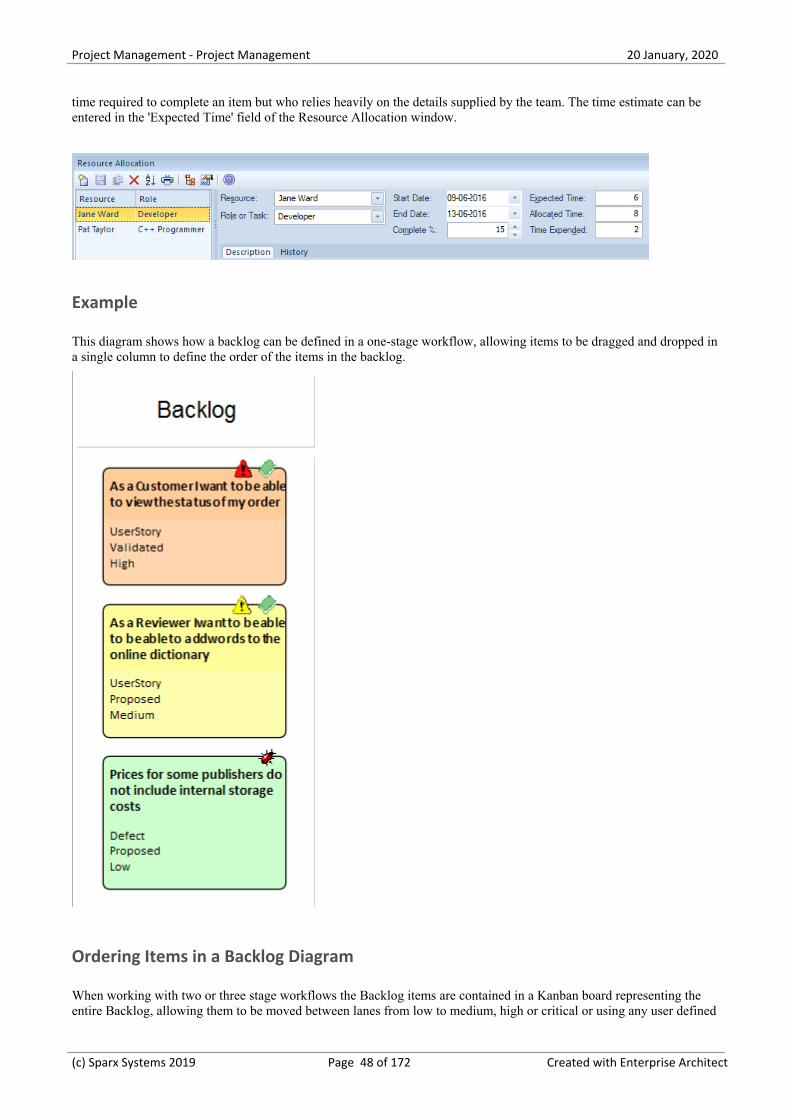
Project Management - Project Management 20 January, 2020
time required to complete an item but who relies heavily on the details supplied by the team. The time estimate can beentered in the 'Expected Time' field of the Resource Allocation window.
Example
This diagram shows how a backlog can be defined in a one-stage workflow, allowing items to be dragged and dropped ina single column to define the order of the items in the backlog.
Ordering Items in a Backlog Diagram
When working with two or three stage workflows the Backlog items are contained in a Kanban board representing theentire Backlog, allowing them to be moved between lanes from low to medium, high or critical or using any user defined
(c) Sparx Systems 2019 Page 48 of 172 Created with Enterprise Architect
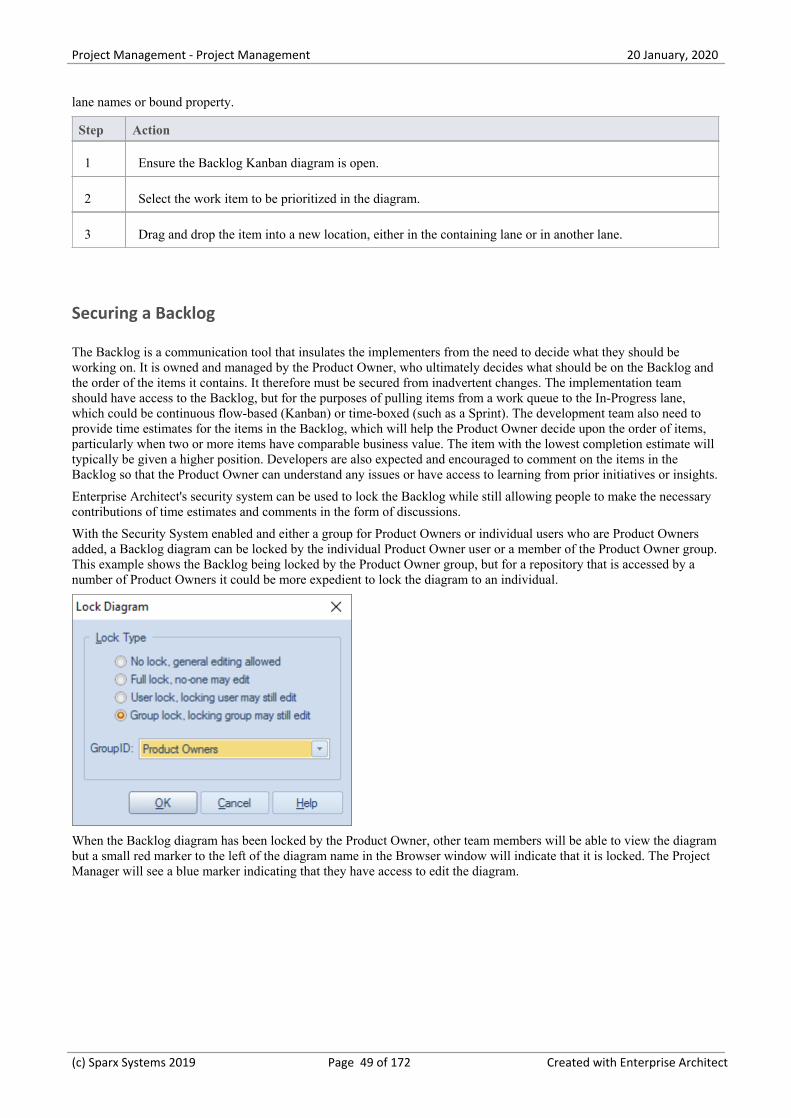
Project Management - Project Management 20 January, 2020
lane names or bound property.
Step Action
1 Ensure the Backlog Kanban diagram is open.
2 Select the work item to be prioritized in the diagram.
3 Drag and drop the item into a new location, either in the containing lane or in another lane.
Securing a Backlog
The Backlog is a communication tool that insulates the implementers from the need to decide what they should beworking on. It is owned and managed by the Product Owner, who ultimately decides what should be on the Backlog andthe order of the items it contains. It therefore must be secured from inadvertent changes. The implementation teamshould have access to the Backlog, but for the purposes of pulling items from a work queue to the In-Progress lane,which could be continuous flow-based (Kanban) or time-boxed (such as a Sprint). The development team also need toprovide time estimates for the items in the Backlog, which will help the Product Owner decide upon the order of items,particularly when two or more items have comparable business value. The item with the lowest completion estimate willtypically be given a higher position. Developers are also expected and encouraged to comment on the items in theBacklog so that the Product Owner can understand any issues or have access to learning from prior initiatives or insights.
Enterprise Architect's security system can be used to lock the Backlog while still allowing people to make the necessarycontributions of time estimates and comments in the form of discussions.
With the Security System enabled and either a group for Product Owners or individual users who are Product Ownersadded, a Backlog diagram can be locked by the individual Product Owner user or a member of the Product Owner group.This example shows the Backlog being locked by the Product Owner group, but for a repository that is accessed by anumber of Product Owners it could be more expedient to lock the diagram to an individual.
When the Backlog diagram has been locked by the Product Owner, other team members will be able to view the diagrambut a small red marker to the left of the diagram name in the Browser window will indicate that it is locked. The ProjectManager will see a blue marker indicating that they have access to edit the diagram.
(c) Sparx Systems 2019 Page 49 of 172 Created with Enterprise Architect
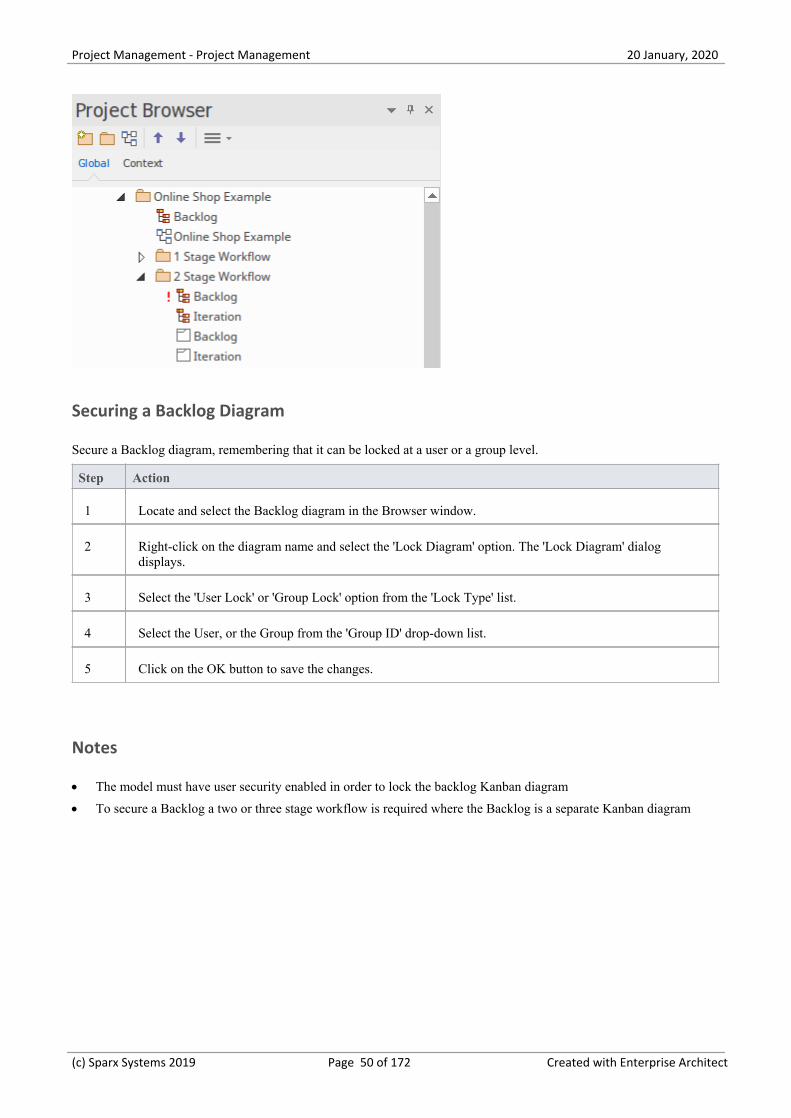
Project Management - Project Management 20 January, 2020
Securing a Backlog Diagram
Secure a Backlog diagram, remembering that it can be locked at a user or a group level.
Step Action
1 Locate and select the Backlog diagram in the Browser window.
2 Right-click on the diagram name and select the 'Lock Diagram' option. The 'Lock Diagram' dialogdisplays.
3 Select the 'User Lock' or 'Group Lock' option from the 'Lock Type' list.
4 Select the User, or the Group from the 'Group ID' drop-down list.
5 Click on the OK button to save the changes.
Notes
The model must have user security enabled in order to lock the backlog Kanban diagram·
To secure a Backlog a two or three stage workflow is required where the Backlog is a separate Kanban diagram·
(c) Sparx Systems 2019 Page 50 of 172 Created with Enterprise Architect
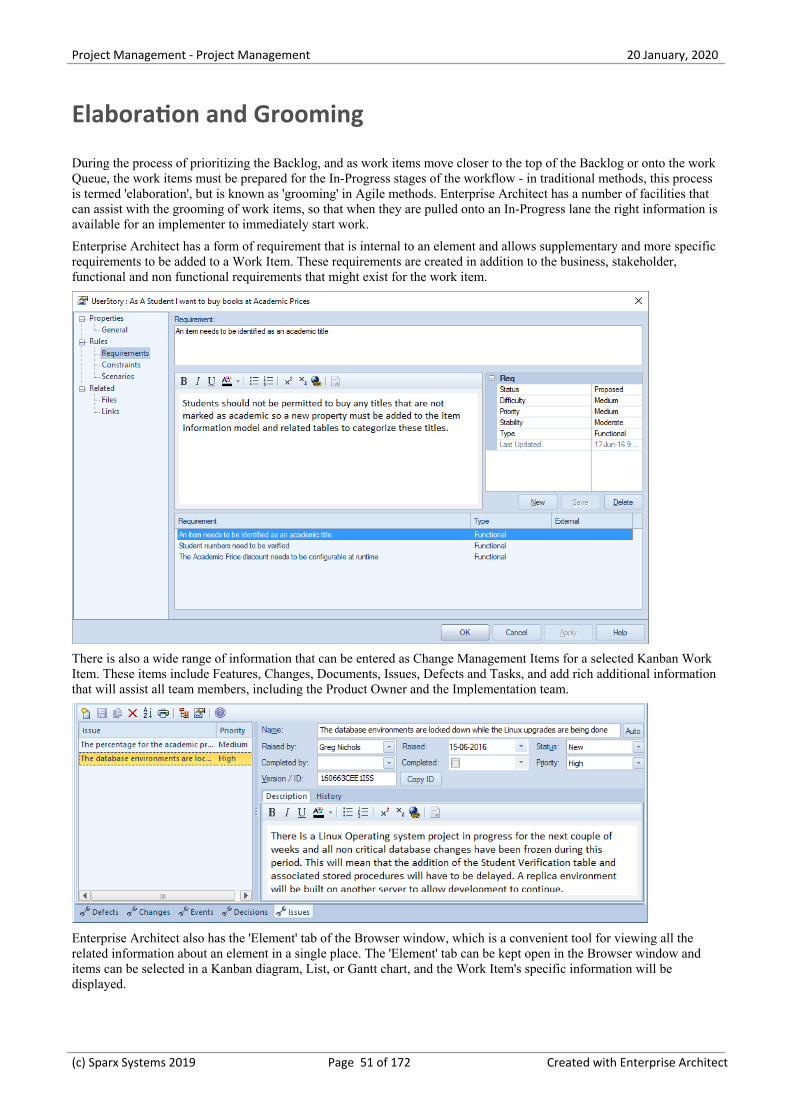
Project Management - Project Management 20 January, 2020
Elaboration and Grooming
During the process of prioritizing the Backlog, and as work items move closer to the top of the Backlog or onto the workQueue, the work items must be prepared for the In-Progress stages of the workflow - in traditional methods, this processis termed 'elaboration', but is known as 'grooming' in Agile methods. Enterprise Architect has a number of facilities thatcan assist with the grooming of work items, so that when they are pulled onto an In-Progress lane the right information isavailable for an implementer to immediately start work.
Enterprise Architect has a form of requirement that is internal to an element and allows supplementary and more specificrequirements to be added to a Work Item. These requirements are created in addition to the business, stakeholder,functional and non functional requirements that might exist for the work item.
There is also a wide range of information that can be entered as Change Management Items for a selected Kanban WorkItem. These items include Features, Changes, Documents, Issues, Defects and Tasks, and add rich additional informationthat will assist all team members, including the Product Owner and the Implementation team.
Enterprise Architect also has the 'Element' tab of the Browser window, which is a convenient tool for viewing all therelated information about an element in a single place. The 'Element' tab can be kept open in the Browser window anditems can be selected in a Kanban diagram, List, or Gantt chart, and the Work Item's specific information will bedisplayed.
(c) Sparx Systems 2019 Page 51 of 172 Created with Enterprise Architect
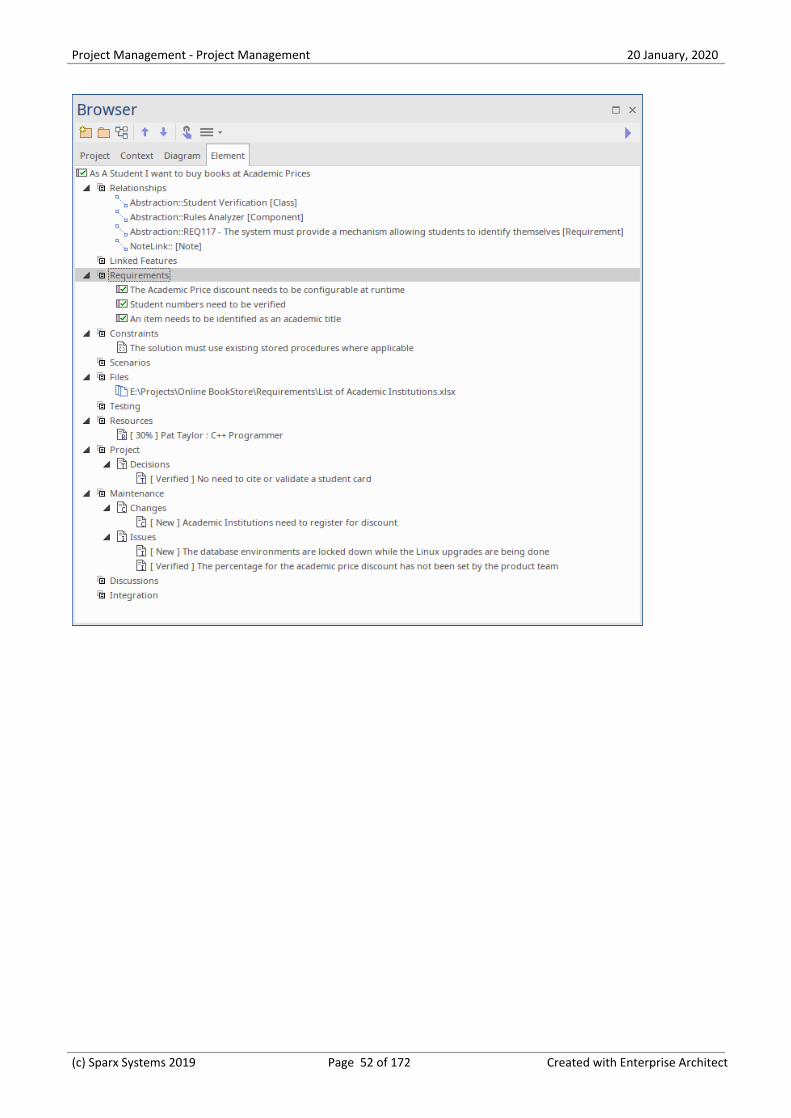
Project Management - Project Management 20 January, 2020
(c) Sparx Systems 2019 Page 52 of 172 Created with Enterprise Architect
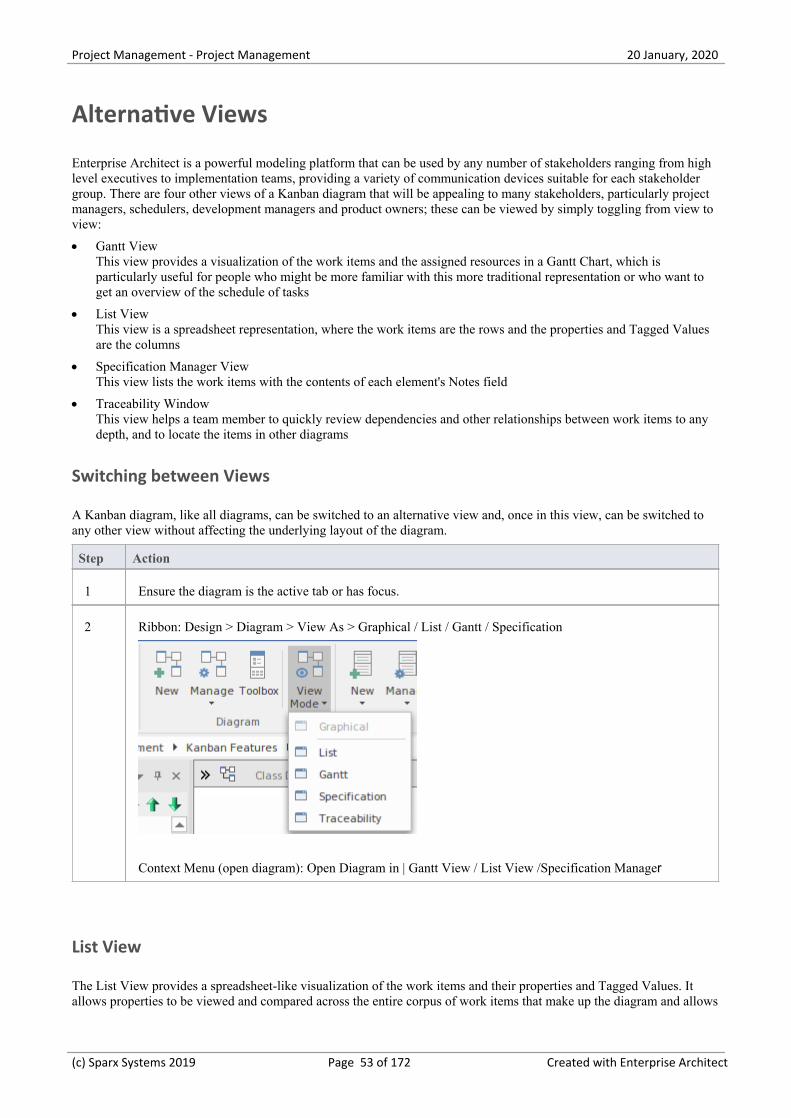
Project Management - Project Management 20 January, 2020
Alternative Views
Enterprise Architect is a powerful modeling platform that can be used by any number of stakeholders ranging from highlevel executives to implementation teams, providing a variety of communication devices suitable for each stakeholdergroup. There are four other views of a Kanban diagram that will be appealing to many stakeholders, particularly projectmanagers, schedulers, development managers and product owners; these can be viewed by simply toggling from view toview:
Gantt View·This view provides a visualization of the work items and the assigned resources in a Gantt Chart, which isparticularly useful for people who might be more familiar with this more traditional representation or who want toget an overview of the schedule of tasks
List View·This view is a spreadsheet representation, where the work items are the rows and the properties and Tagged Valuesare the columns
Specification Manager View·This view lists the work items with the contents of each element's Notes field
Traceability Window·This view helps a team member to quickly review dependencies and other relationships between work items to anydepth, and to locate the items in other diagrams
Switching between Views
A Kanban diagram, like all diagrams, can be switched to an alternative view and, once in this view, can be switched toany other view without affecting the underlying layout of the diagram.
Step Action
1 Ensure the diagram is the active tab or has focus.
2 Ribbon: Design > Diagram > View As > Graphical / List / Gantt / Specification
Context Menu (open diagram): Open Diagram in | Gantt View / List View /Specification Manager
List View
The List View provides a spreadsheet-like visualization of the work items and their properties and Tagged Values. Itallows properties to be viewed and compared across the entire corpus of work items that make up the diagram and allows
(c) Sparx Systems 2019 Page 53 of 172 Created with Enterprise Architect
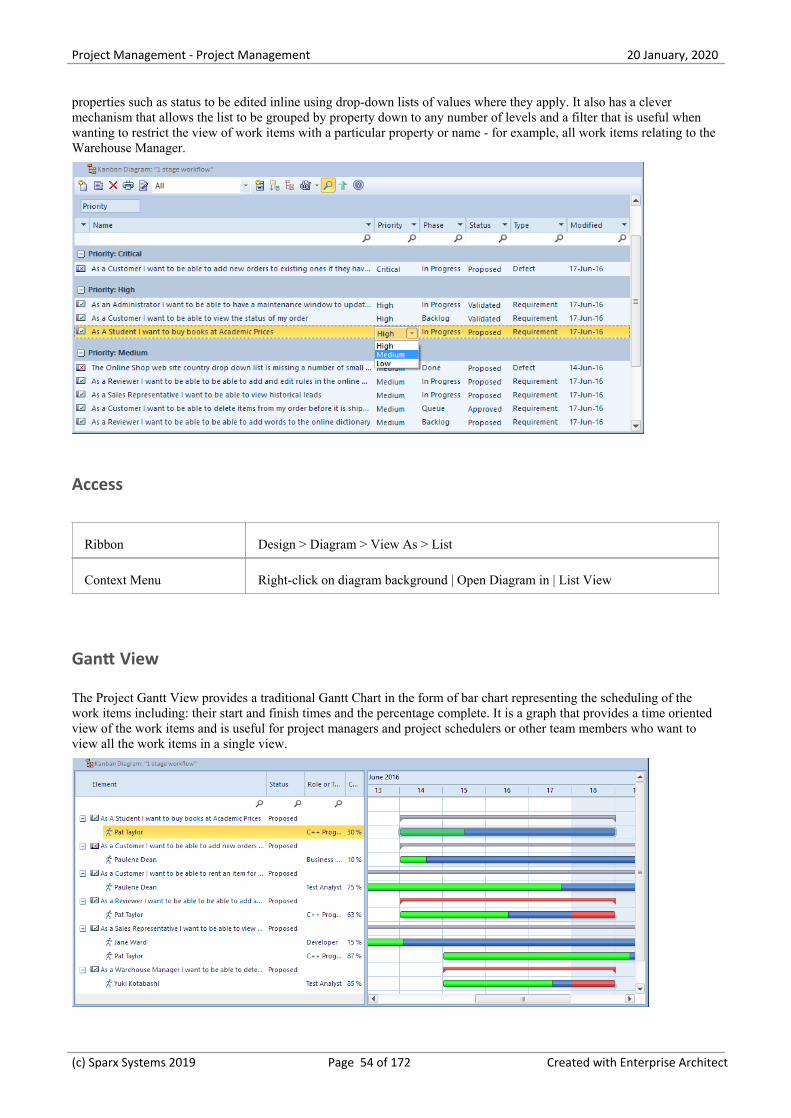
Project Management - Project Management 20 January, 2020
properties such as status to be edited inline using drop-down lists of values where they apply. It also has a clevermechanism that allows the list to be grouped by property down to any number of levels and a filter that is useful whenwanting to restrict the view of work items with a particular property or name - for example, all work items relating to theWarehouse Manager.
Access
Ribbon Design > Diagram > View As > List
Context Menu Right-click on diagram background | Open Diagram in | List View
Gantt View
The Project Gantt View provides a traditional Gantt Chart in the form of bar chart representing the scheduling of thework items including: their start and finish times and the percentage complete. It is a graph that provides a time orientedview of the work items and is useful for project managers and project schedulers or other team members who want toview all the work items in a single view.
(c) Sparx Systems 2019 Page 54 of 172 Created with Enterprise Architect

Project Management - Project Management 20 January, 2020
Access
Ribbon Design > Diagram > View As > Gantt View
Context Menu Right-click on diagram background | Open Diagram in | Gantt View
Specification Manager View
The Specification Manager is a simple document-based interface to a selected diagram (or Package) in the model,providing the means of creating and reviewing elements as text representations of objects in the model, using a processthat is familiar to all users including business professionals and management, who might not have expertise in modeldevelopment.
The Specification Manager is also an interactive reporting tool for displaying, in icon form, the status of various otherfeatures against each entry and providing access to edit each feature.
Access
Ribbon Design > Diagram > View As > Specification
Context Menu Right-click on diagram background | Open Diagram in | Specification Manager
Traceability View
The Traceability Window provides an insightful view of how a work item is connected to other elements in the modelincluding other work items and how these connected elements are themselves connected down to any level. It is a generalpurpose mechanism and so can be used with any type of element but is particularly useful when working with Kanbanboards and for product owners and other team members who need to understand the dependenies between work itemsand to find the related information that will help with the analysis, grooming, testing and implementation of a work item.
(c) Sparx Systems 2019 Page 55 of 172 Created with Enterprise Architect
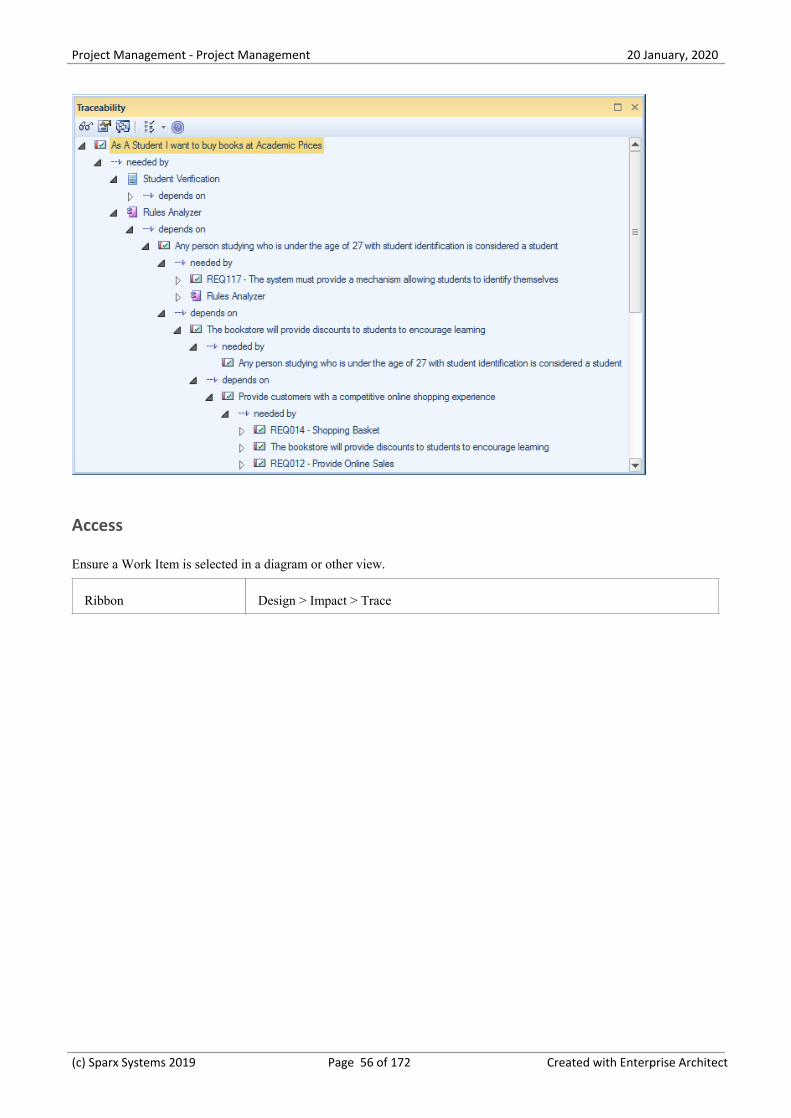
Project Management - Project Management 20 January, 2020
Access
Ensure a Work Item is selected in a diagram or other view.
Ribbon Design > Impact > Trace
(c) Sparx Systems 2019 Page 56 of 172 Created with Enterprise Architect
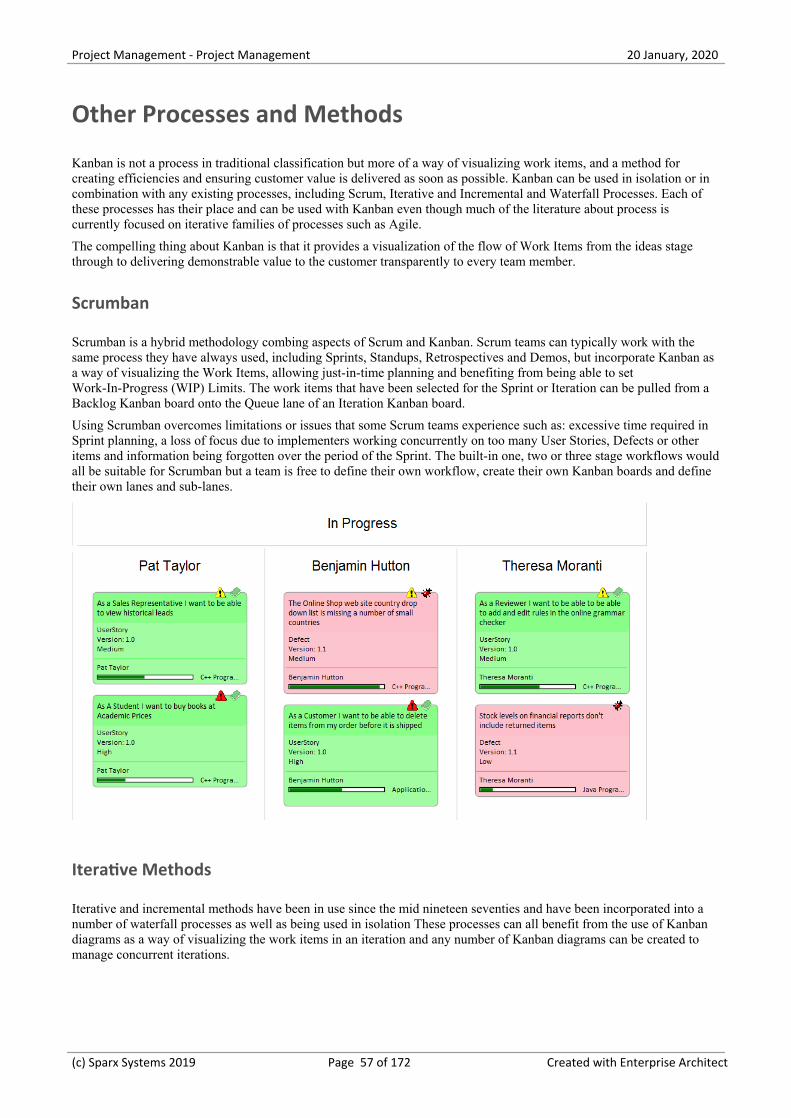
Project Management - Project Management 20 January, 2020
Other Processes and Methods
Kanban is not a process in traditional classification but more of a way of visualizing work items, and a method forcreating efficiencies and ensuring customer value is delivered as soon as possible. Kanban can be used in isolation or incombination with any existing processes, including Scrum, Iterative and Incremental and Waterfall Processes. Each ofthese processes has their place and can be used with Kanban even though much of the literature about process iscurrently focused on iterative families of processes such as Agile.
The compelling thing about Kanban is that it provides a visualization of the flow of Work Items from the ideas stagethrough to delivering demonstrable value to the customer transparently to every team member.
Scrumban
Scrumban is a hybrid methodology combing aspects of Scrum and Kanban. Scrum teams can typically work with thesame process they have always used, including Sprints, Standups, Retrospectives and Demos, but incorporate Kanban asa way of visualizing the Work Items, allowing just-in-time planning and benefiting from being able to setWork-In-Progress (WIP) Limits. The work items that have been selected for the Sprint or Iteration can be pulled from aBacklog Kanban board onto the Queue lane of an Iteration Kanban board.
Using Scrumban overcomes limitations or issues that some Scrum teams experience such as: excessive time required inSprint planning, a loss of focus due to implementers working concurrently on too many User Stories, Defects or otheritems and information being forgotten over the period of the Sprint. The built-in one, two or three stage workflows wouldall be suitable for Scrumban but a team is free to define their own workflow, create their own Kanban boards and definetheir own lanes and sub-lanes.
Iterative Methods
Iterative and incremental methods have been in use since the mid nineteen seventies and have been incorporated into anumber of waterfall processes as well as being used in isolation These processes can all benefit from the use of Kanbandiagrams as a way of visualizing the work items in an iteration and any number of Kanban diagrams can be created tomanage concurrent iterations.
(c) Sparx Systems 2019 Page 57 of 172 Created with Enterprise Architect
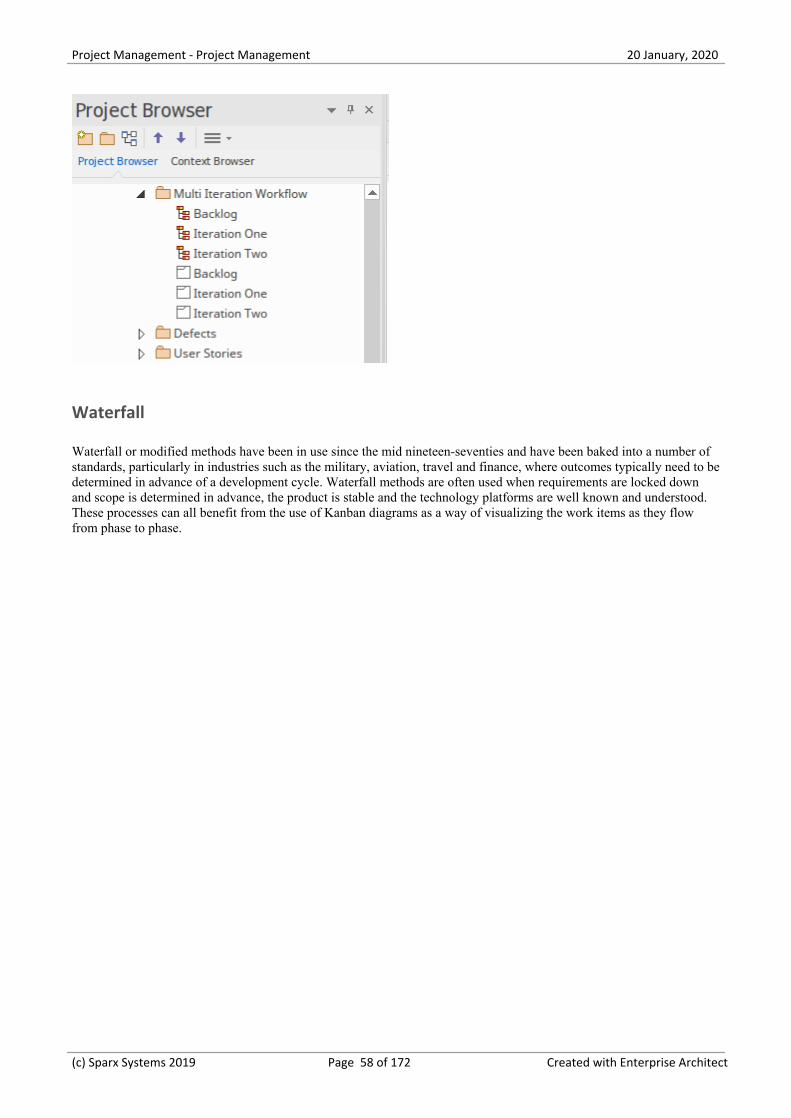
Project Management - Project Management 20 January, 2020
Waterfall
Waterfall or modified methods have been in use since the mid nineteen-seventies and have been baked into a number ofstandards, particularly in industries such as the military, aviation, travel and finance, where outcomes typically need to bedetermined in advance of a development cycle. Waterfall methods are often used when requirements are locked downand scope is determined in advance, the product is stable and the technology platforms are well known and understood.These processes can all benefit from the use of Kanban diagrams as a way of visualizing the work items as they flowfrom phase to phase.
(c) Sparx Systems 2019 Page 58 of 172 Created with Enterprise Architect
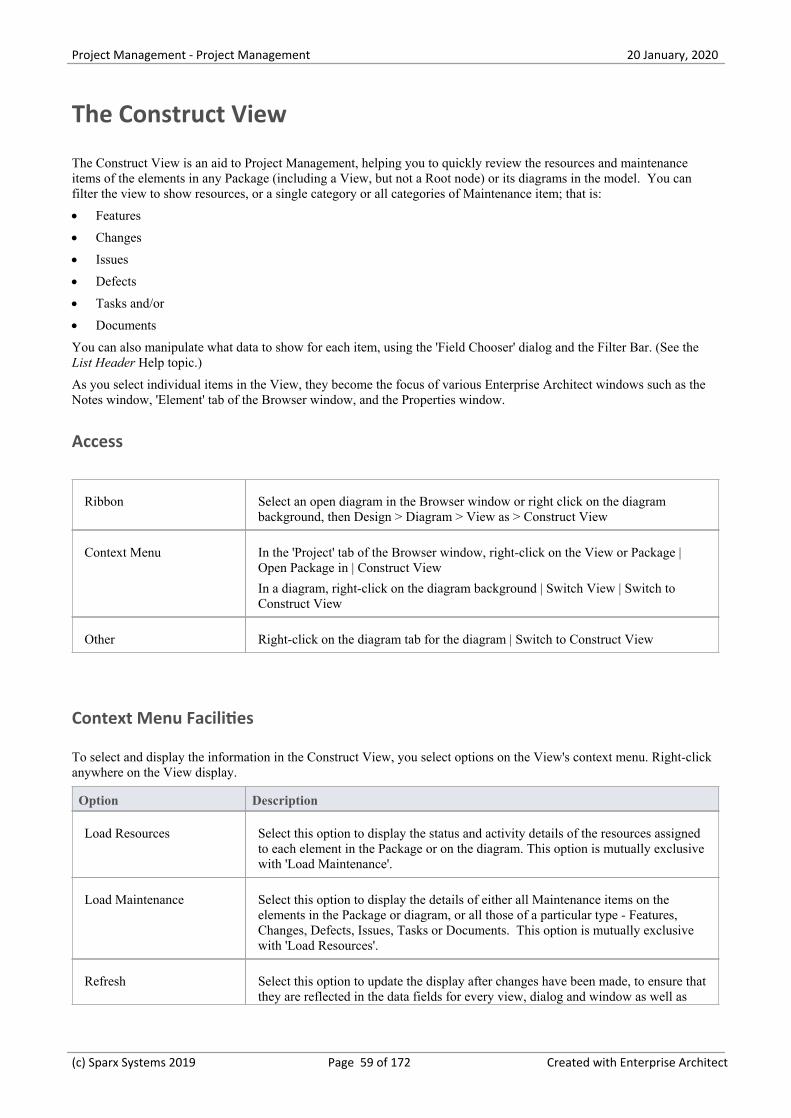
Project Management - Project Management 20 January, 2020
The Construct View
The Construct View is an aid to Project Management, helping you to quickly review the resources and maintenanceitems of the elements in any Package (including a View, but not a Root node) or its diagrams in the model. You canfilter the view to show resources, or a single category or all categories of Maintenance item; that is:
Features·
Changes·
Issues·
Defects·
Tasks and/or·
Documents·
You can also manipulate what data to show for each item, using the 'Field Chooser' dialog and the Filter Bar. (See theList Header Help topic.)
As you select individual items in the View, they become the focus of various Enterprise Architect windows such as theNotes window, 'Element' tab of the Browser window, and the Properties window.
Access
Ribbon Select an open diagram in the Browser window or right click on the diagrambackground, then Design > Diagram > View as > Construct View
Context Menu In the 'Project' tab of the Browser window, right-click on the View or Package |Open Package in | Construct View
In a diagram, right-click on the diagram background | Switch View | Switch toConstruct View
Other Right-click on the diagram tab for the diagram | Switch to Construct View
Context Menu Facilities
To select and display the information in the Construct View, you select options on the View's context menu. Right-clickanywhere on the View display.
Option Description
Load Resources Select this option to display the status and activity details of the resources assignedto each element in the Package or on the diagram. This option is mutually exclusivewith 'Load Maintenance'.
Load Maintenance Select this option to display the details of either all Maintenance items on theelements in the Package or diagram, or all those of a particular type - Features,Changes, Defects, Issues, Tasks or Documents. This option is mutually exclusivewith 'Load Resources'.
Refresh Select this option to update the display after changes have been made, to ensure thatthey are reflected in the data fields for every view, dialog and window as well as
(c) Sparx Systems 2019 Page 59 of 172 Created with Enterprise Architect
Project Management - Project Management 20 January, 2020
the Construct View.
Clear Window Select this option to remove all data from the window.
Collapse All / Expand All The display initially shows the data in an expanded hierarchy of elements, childelements and maintenance items or resources. Select the 'Collapse All' option toshow just the top-level elements with no data, and select the 'Expand All' option toreveal the full hierarchy again.
Display as flat list Select this option to display only those elements that have resources or maintenanceitems, with those items. The elements are listed in alphabetical order at the samelevel, regardless of where they occur in the model hierarchy.
(c) Sparx Systems 2019 Page 60 of 172 Created with Enterprise Architect
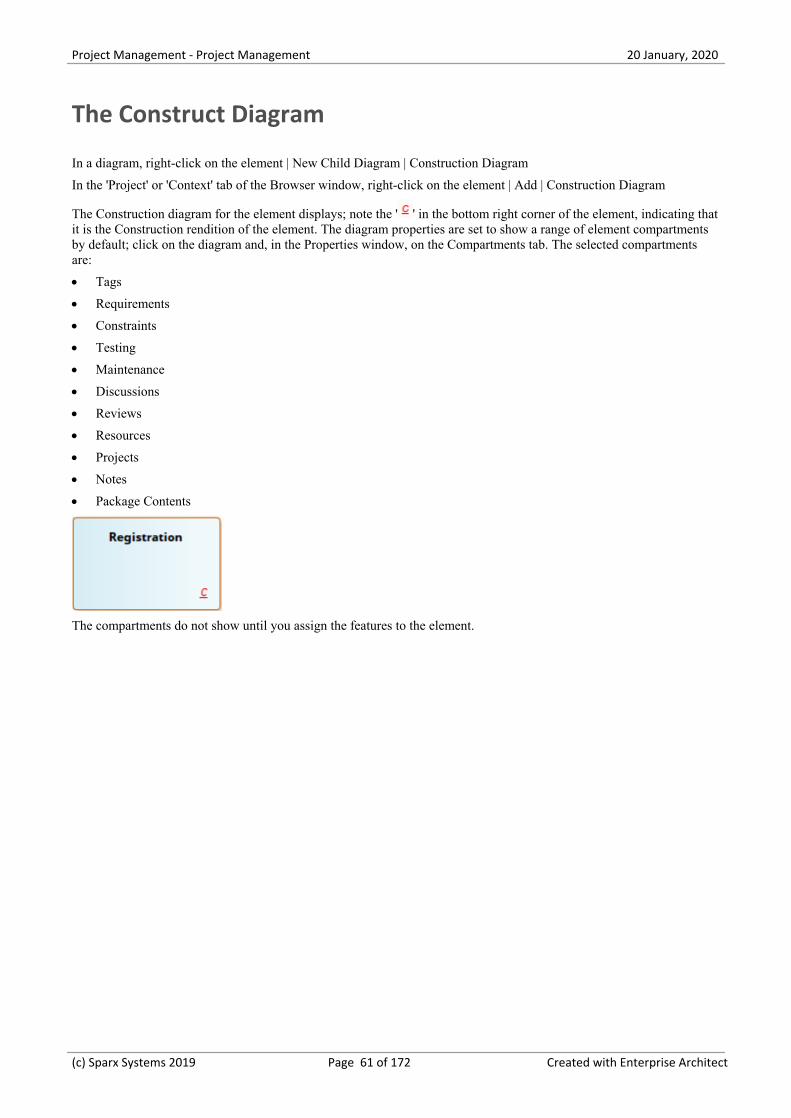
Project Management - Project Management 20 January, 2020
The Construct Diagram
In a diagram, right-click on the element | New Child Diagram | Construction Diagram
In the 'Project' or 'Context' tab of the Browser window, right-click on the element | Add | Construction Diagram
The Construction diagram for the element displays; note the ' ' in the bottom right corner of the element, indicating thatit is the Construction rendition of the element. The diagram properties are set to show a range of element compartmentsby default; click on the diagram and, in the Properties window, on the Compartments tab. The selected compartmentsare:
Tags·
Requirements·
Constraints·
Testing·
Maintenance·
Discussions·
Reviews·
Resources·
Projects·
Notes·
Package Contents·
The compartments do not show until you assign the features to the element.
(c) Sparx Systems 2019 Page 61 of 172 Created with Enterprise Architect
Project Management - Project Management 20 January, 2020
Task Management
In the life cycle of a project, there are various non-technical tasks that are vital to the successful management andcompletion of the project, such as allocation of resources and allocation of time to the tasks and to meetings. EnterpriseArchitect helps you as a project manager or as a team member to record and monitor such tasks.
Facilities
Enterprise Architect provides a range of project management facilities as described in this table.
Facility Description
Manage Project Resources Resources are the people who work on a project. You can assign roles and allocatetasks to them, which helps you to track effort and estimate time to complete tasks.You can also define the effort, risks and metrics to support resource management.You add, modify and delete resources using the Resource Allocation window.
The Project Gantt View In Enterprise Architect, you can visualize elements and assigned project resourceseasily in a Gantt Chart format, to review the breakdown of work for a specificproject and for specific sections of the project. The Project Gantt View illustrates aproject schedule by showing the start and finish dates of assigned resources, so thatyou as Project Manager can quickly see the current project status using thepercent-complete bar shading and the percent-complete, resource name and statuscolumns. Information can be filtered, and overdue items can quickly be highlightedand identified. You can also access specialized versions of the Gantt View fromdiagrams, Packages and the Personal Tasks list.
Project Task Allocation A particular feature of the Project Gantt View is the facility to review the allocationof work to elements in the project, focusing on either the elements that requirework, or the resources required to perform the work.
Review Personal Tasks Using the Personal Tasks view, each team member can record, review and managetheir personal work within the project.
Project ManagementWindows
Enterprise Architect provides five specialized tabs in the Project window to helpyou to define each of the management quantities associated with an element in themodel, namely:
Decisions - the choice made on a requirement of the element·
Events - the action taken on a requirement of the element·
Effort - the effort expended in work on the element·
Risks - the risks associated with the element, and·
Metrics - the metrics measured for an element·
Notes
In the Corporate, Unified and Ultimate editions of Enterprise Architect, if User Security is enabled, you must have·'Manage Project Settings' permission to perform Resource Allocation
(c) Sparx Systems 2019 Page 62 of 172 Created with Enterprise Architect
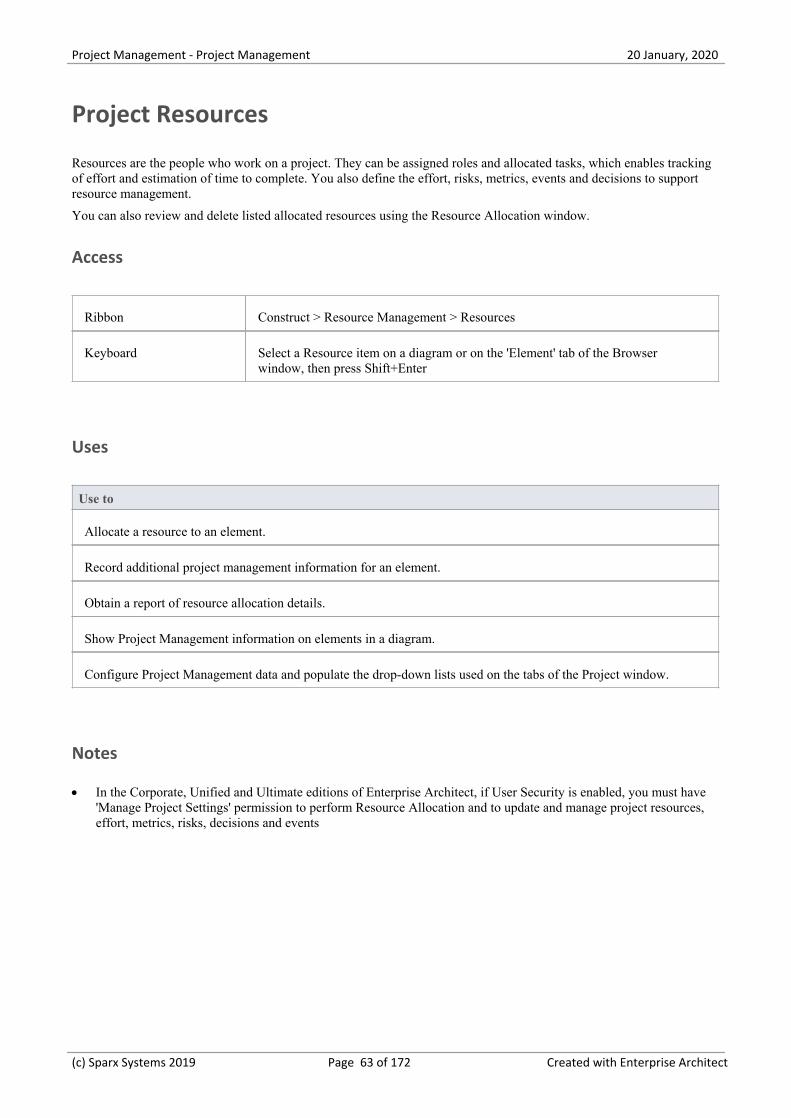
Project Management - Project Management 20 January, 2020
Project Resources
Resources are the people who work on a project. They can be assigned roles and allocated tasks, which enables trackingof effort and estimation of time to complete. You also define the effort, risks, metrics, events and decisions to supportresource management.
You can also review and delete listed allocated resources using the Resource Allocation window.
Access
Ribbon Construct > Resource Management > Resources
Keyboard Select a Resource item on a diagram or on the 'Element' tab of the Browserwindow, then press Shift+Enter
Uses
Use to
Allocate a resource to an element.
Record additional project management information for an element.
Obtain a report of resource allocation details.
Show Project Management information on elements in a diagram.
Configure Project Management data and populate the drop-down lists used on the tabs of the Project window.
Notes
In the Corporate, Unified and Ultimate editions of Enterprise Architect, if User Security is enabled, you must have·'Manage Project Settings' permission to perform Resource Allocation and to update and manage project resources,effort, metrics, risks, decisions and events
(c) Sparx Systems 2019 Page 63 of 172 Created with Enterprise Architect
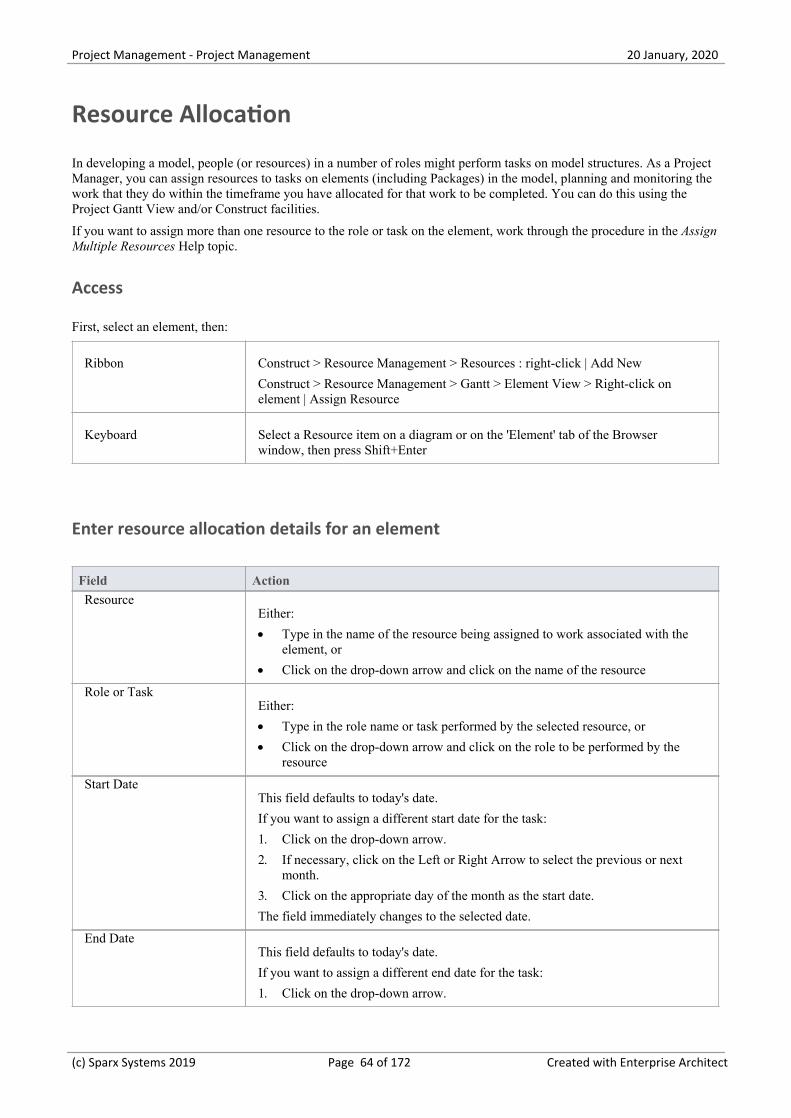
Project Management - Project Management 20 January, 2020
Resource Allocation
In developing a model, people (or resources) in a number of roles might perform tasks on model structures. As a ProjectManager, you can assign resources to tasks on elements (including Packages) in the model, planning and monitoring thework that they do within the timeframe you have allocated for that work to be completed. You can do this using theProject Gantt View and/or Construct facilities.
If you want to assign more than one resource to the role or task on the element, work through the procedure in the AssignMultiple Resources Help topic.
Access
First, select an element, then:
Ribbon Construct > Resource Management > Resources : right-click | Add New
Construct > Resource Management > Gantt > Element View > Right-click onelement | Assign Resource
Keyboard Select a Resource item on a diagram or on the 'Element' tab of the Browserwindow, then press Shift+Enter
Enter resource allocation details for an element
Field Action
ResourceEither:
Type in the name of the resource being assigned to work associated with the·element, or
Click on the drop-down arrow and click on the name of the resource·
Role or TaskEither:
Type in the role name or task performed by the selected resource, or·
Click on the drop-down arrow and click on the role to be performed by the·resource
Start DateThis field defaults to today's date.
If you want to assign a different start date for the task:
Click on the drop-down arrow.1.
If necessary, click on the Left or Right Arrow to select the previous or next2.month.
Click on the appropriate day of the month as the start date.3.
The field immediately changes to the selected date.
End DateThis field defaults to today's date.
If you want to assign a different end date for the task:
Click on the drop-down arrow.1.
(c) Sparx Systems 2019 Page 64 of 172 Created with Enterprise Architect
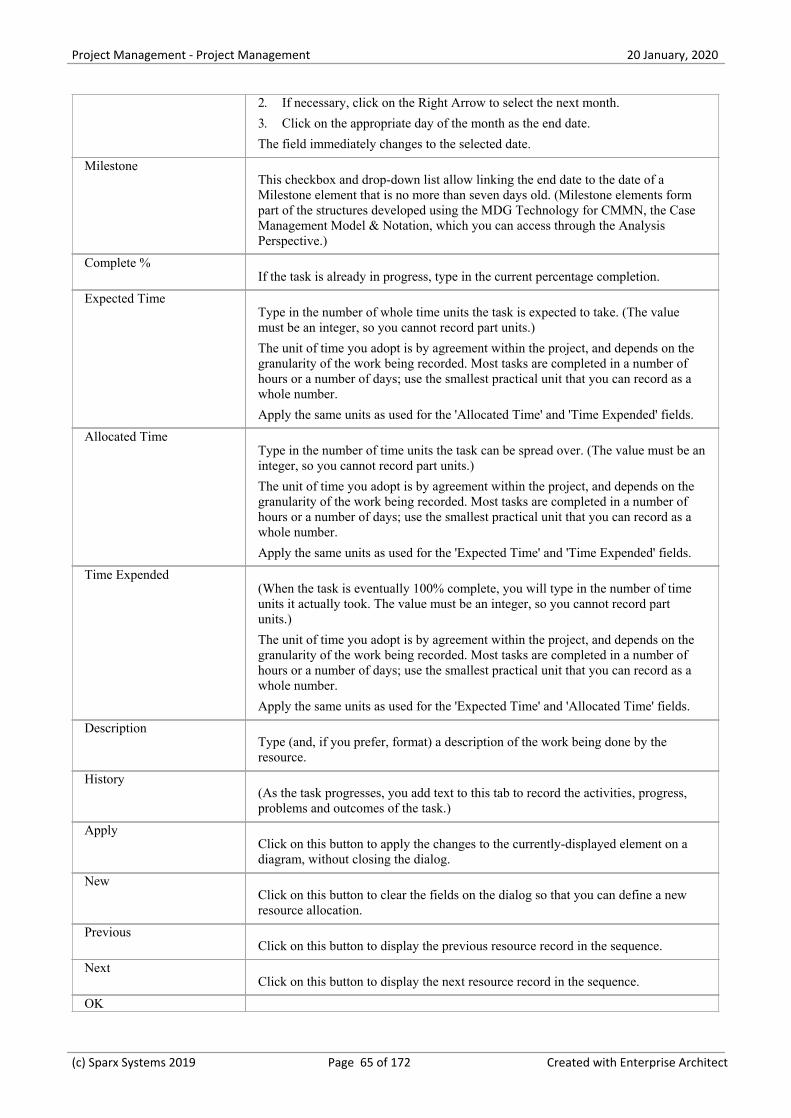
Project Management - Project Management 20 January, 2020
If necessary, click on the Right Arrow to select the next month.2.
Click on the appropriate day of the month as the end date.3.
The field immediately changes to the selected date.
MilestoneThis checkbox and drop-down list allow linking the end date to the date of aMilestone element that is no more than seven days old. (Milestone elements formpart of the structures developed using the MDG Technology for CMMN, the CaseManagement Model & Notation, which you can access through the AnalysisPerspective.)
Complete %If the task is already in progress, type in the current percentage completion.
Expected TimeType in the number of whole time units the task is expected to take. (The valuemust be an integer, so you cannot record part units.)
The unit of time you adopt is by agreement within the project, and depends on thegranularity of the work being recorded. Most tasks are completed in a number ofhours or a number of days; use the smallest practical unit that you can record as awhole number.
Apply the same units as used for the 'Allocated Time' and 'Time Expended' fields.
Allocated TimeType in the number of time units the task can be spread over. (The value must be aninteger, so you cannot record part units.)
The unit of time you adopt is by agreement within the project, and depends on thegranularity of the work being recorded. Most tasks are completed in a number ofhours or a number of days; use the smallest practical unit that you can record as awhole number.
Apply the same units as used for the 'Expected Time' and 'Time Expended' fields.
Time Expended(When the task is eventually 100% complete, you will type in the number of timeunits it actually took. The value must be an integer, so you cannot record partunits.)
The unit of time you adopt is by agreement within the project, and depends on thegranularity of the work being recorded. Most tasks are completed in a number ofhours or a number of days; use the smallest practical unit that you can record as awhole number.
Apply the same units as used for the 'Expected Time' and 'Allocated Time' fields.
DescriptionType (and, if you prefer, format) a description of the work being done by theresource.
History(As the task progresses, you add text to this tab to record the activities, progress,problems and outcomes of the task.)
ApplyClick on this button to apply the changes to the currently-displayed element on adiagram, without closing the dialog.
NewClick on this button to clear the fields on the dialog so that you can define a newresource allocation.
PreviousClick on this button to display the previous resource record in the sequence.
NextClick on this button to display the next resource record in the sequence.
OK
(c) Sparx Systems 2019 Page 65 of 172 Created with Enterprise Architect
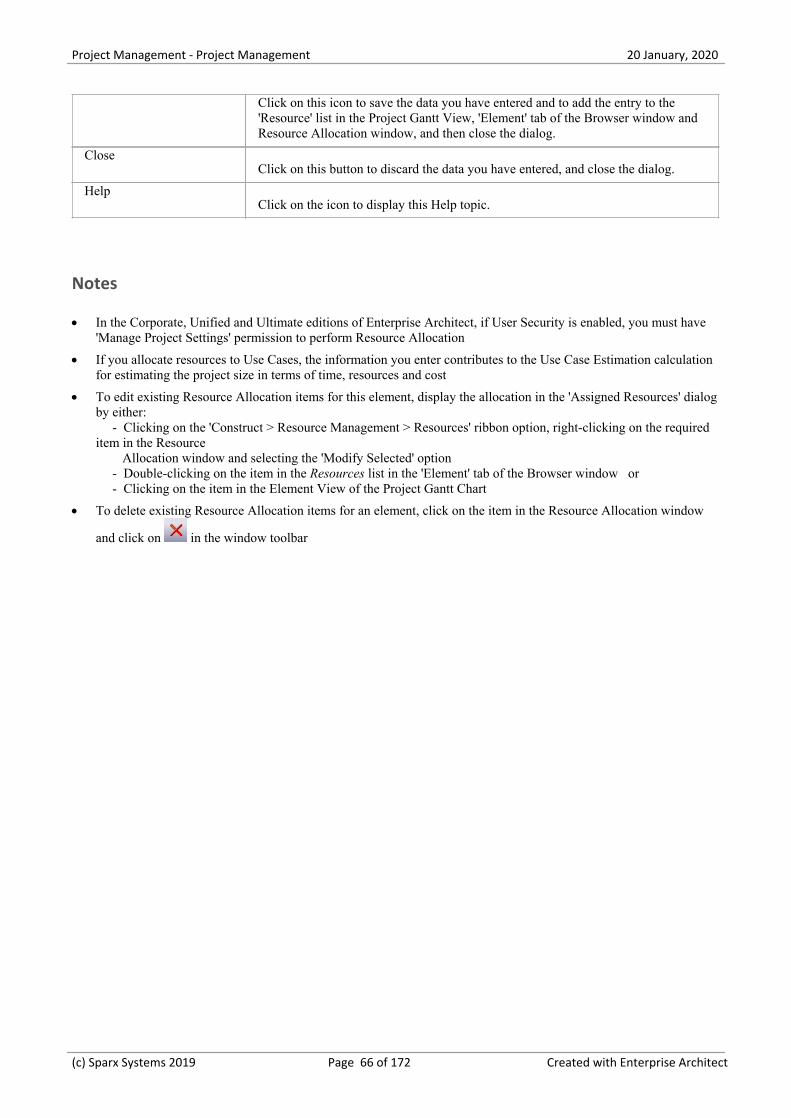
Project Management - Project Management 20 January, 2020
Click on this icon to save the data you have entered and to add the entry to the'Resource' list in the Project Gantt View, 'Element' tab of the Browser window andResource Allocation window, and then close the dialog.
CloseClick on this button to discard the data you have entered, and close the dialog.
HelpClick on the icon to display this Help topic.
Notes
In the Corporate, Unified and Ultimate editions of Enterprise Architect, if User Security is enabled, you must have·'Manage Project Settings' permission to perform Resource Allocation
If you allocate resources to Use Cases, the information you enter contributes to the Use Case Estimation calculation·for estimating the project size in terms of time, resources and cost
To edit existing Resource Allocation items for this element, display the allocation in the 'Assigned Resources' dialog·by either: - Clicking on the 'Construct > Resource Management > Resources' ribbon option, right-clicking on the requireditem in the Resource Allocation window and selecting the 'Modify Selected' option - Double-clicking on the item in the Resources list in the 'Element' tab of the Browser window or - Clicking on the item in the Element View of the Project Gantt Chart
To delete existing Resource Allocation items for an element, click on the item in the Resource Allocation window·
and click on in the window toolbar
(c) Sparx Systems 2019 Page 66 of 172 Created with Enterprise Architect
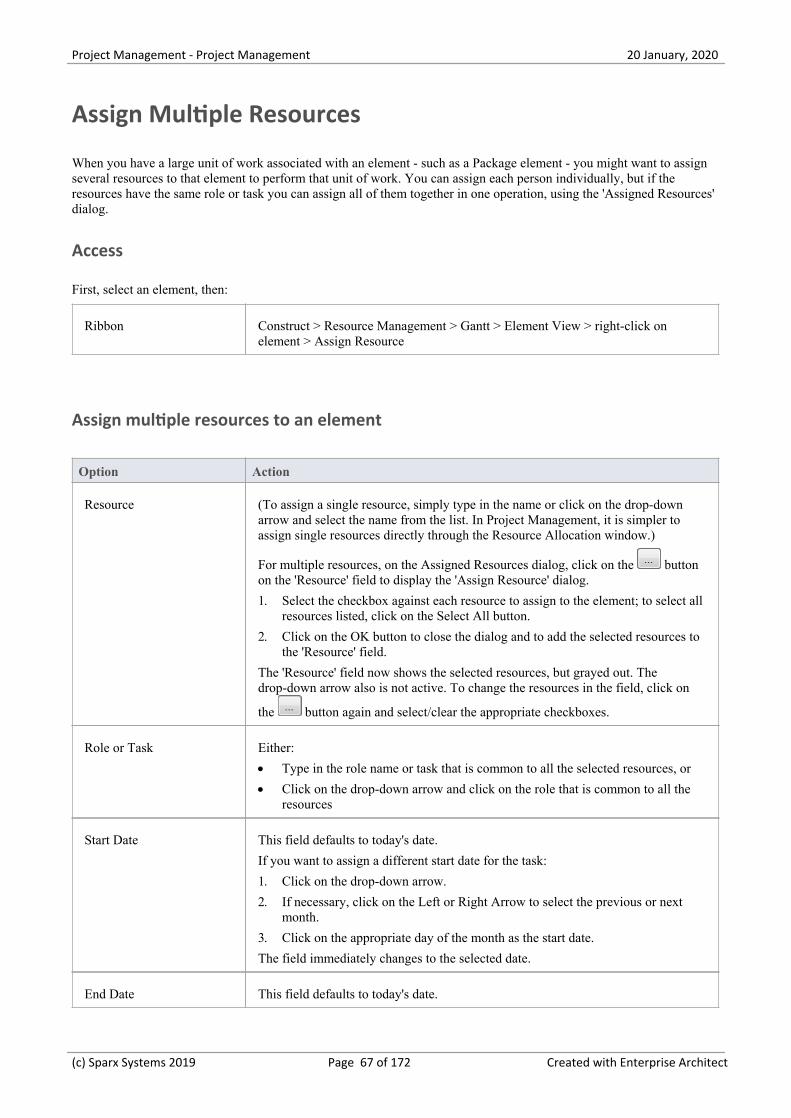
Project Management - Project Management 20 January, 2020
Assign Multiple Resources
When you have a large unit of work associated with an element - such as a Package element - you might want to assignseveral resources to that element to perform that unit of work. You can assign each person individually, but if theresources have the same role or task you can assign all of them together in one operation, using the 'Assigned Resources'dialog.
Access
First, select an element, then:
Ribbon Construct > Resource Management > Gantt > Element View > right-click onelement > Assign Resource
Assign multiple resources to an element
Option Action
Resource (To assign a single resource, simply type in the name or click on the drop-downarrow and select the name from the list. In Project Management, it is simpler toassign single resources directly through the Resource Allocation window.)
For multiple resources, on the Assigned Resources dialog, click on the buttonon the 'Resource' field to display the 'Assign Resource' dialog.
Select the checkbox against each resource to assign to the element; to select all1.resources listed, click on the Select All button.
Click on the OK button to close the dialog and to add the selected resources to2.the 'Resource' field.
The 'Resource' field now shows the selected resources, but grayed out. Thedrop-down arrow also is not active. To change the resources in the field, click on
the button again and select/clear the appropriate checkboxes.
Role or Task Either:
Type in the role name or task that is common to all the selected resources, or·
Click on the drop-down arrow and click on the role that is common to all the·resources
Start Date This field defaults to today's date.
If you want to assign a different start date for the task:
Click on the drop-down arrow.1.
If necessary, click on the Left or Right Arrow to select the previous or next2.month.
Click on the appropriate day of the month as the start date.3.
The field immediately changes to the selected date.
End Date This field defaults to today's date.
(c) Sparx Systems 2019 Page 67 of 172 Created with Enterprise Architect
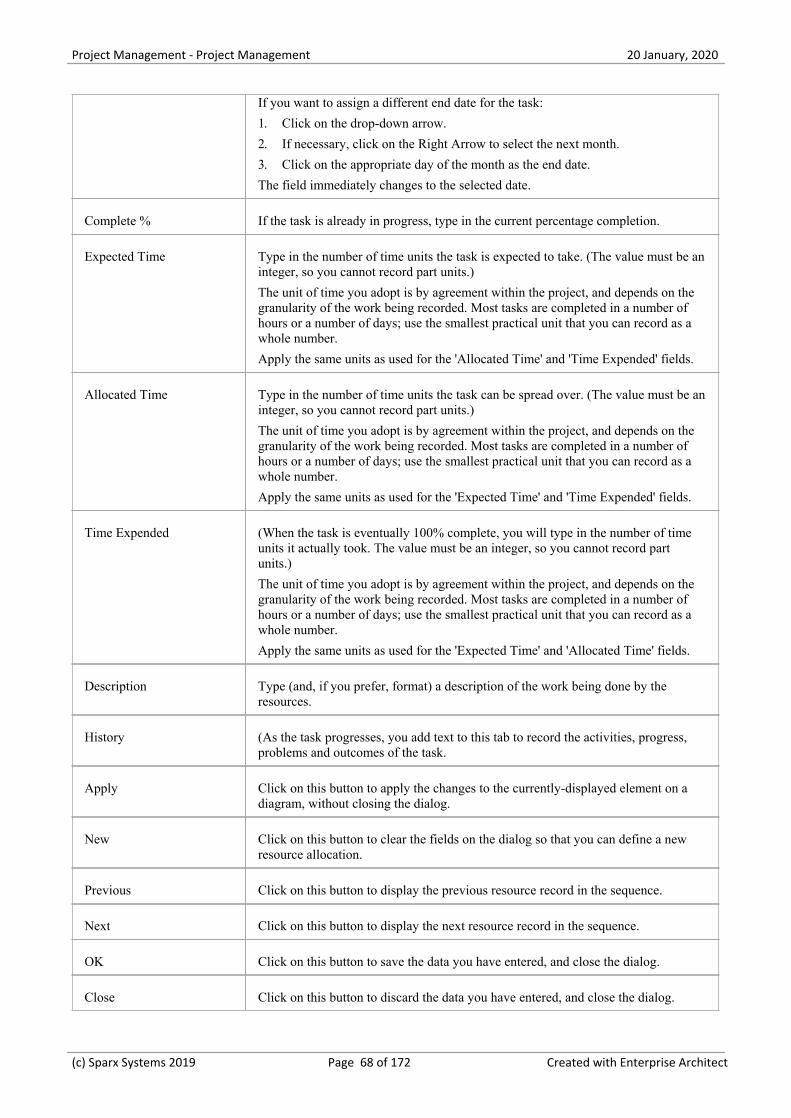
Project Management - Project Management 20 January, 2020
If you want to assign a different end date for the task:
Click on the drop-down arrow.1.
If necessary, click on the Right Arrow to select the next month.2.
Click on the appropriate day of the month as the end date.3.
The field immediately changes to the selected date.
Complete % If the task is already in progress, type in the current percentage completion.
Expected Time Type in the number of time units the task is expected to take. (The value must be aninteger, so you cannot record part units.)
The unit of time you adopt is by agreement within the project, and depends on thegranularity of the work being recorded. Most tasks are completed in a number ofhours or a number of days; use the smallest practical unit that you can record as awhole number.
Apply the same units as used for the 'Allocated Time' and 'Time Expended' fields.
Allocated Time Type in the number of time units the task can be spread over. (The value must be aninteger, so you cannot record part units.)
The unit of time you adopt is by agreement within the project, and depends on thegranularity of the work being recorded. Most tasks are completed in a number ofhours or a number of days; use the smallest practical unit that you can record as awhole number.
Apply the same units as used for the 'Expected Time' and 'Time Expended' fields.
Time Expended (When the task is eventually 100% complete, you will type in the number of timeunits it actually took. The value must be an integer, so you cannot record partunits.)
The unit of time you adopt is by agreement within the project, and depends on thegranularity of the work being recorded. Most tasks are completed in a number ofhours or a number of days; use the smallest practical unit that you can record as awhole number.
Apply the same units as used for the 'Expected Time' and 'Allocated Time' fields.
Description Type (and, if you prefer, format) a description of the work being done by theresources.
History (As the task progresses, you add text to this tab to record the activities, progress,problems and outcomes of the task.
Apply Click on this button to apply the changes to the currently-displayed element on adiagram, without closing the dialog.
New Click on this button to clear the fields on the dialog so that you can define a newresource allocation.
Previous Click on this button to display the previous resource record in the sequence.
Next Click on this button to display the next resource record in the sequence.
OK Click on this button to save the data you have entered, and close the dialog.
Close Click on this button to discard the data you have entered, and close the dialog.
(c) Sparx Systems 2019 Page 68 of 172 Created with Enterprise Architect
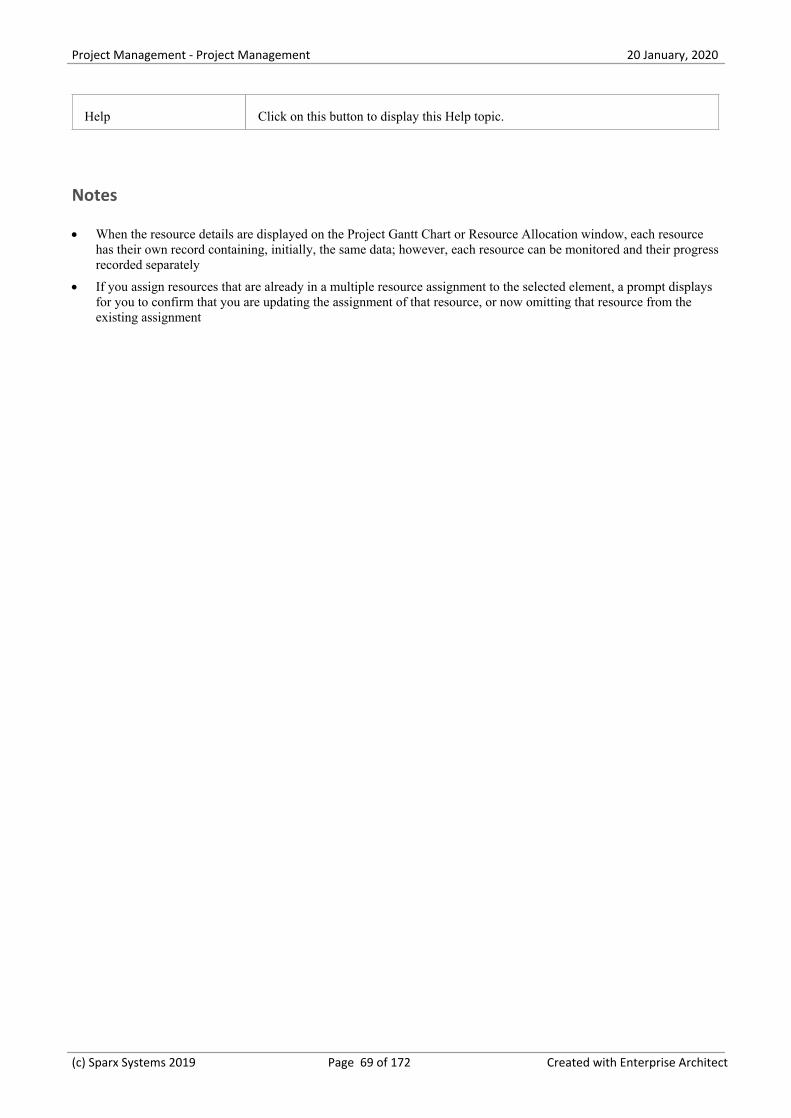
Project Management - Project Management 20 January, 2020
Help Click on this button to display this Help topic.
Notes
When the resource details are displayed on the Project Gantt Chart or Resource Allocation window, each resource·has their own record containing, initially, the same data; however, each resource can be monitored and their progressrecorded separately
If you assign resources that are already in a multiple resource assignment to the selected element, a prompt displays·for you to confirm that you are updating the assignment of that resource, or now omitting that resource from theexisting assignment
(c) Sparx Systems 2019 Page 69 of 172 Created with Enterprise Architect
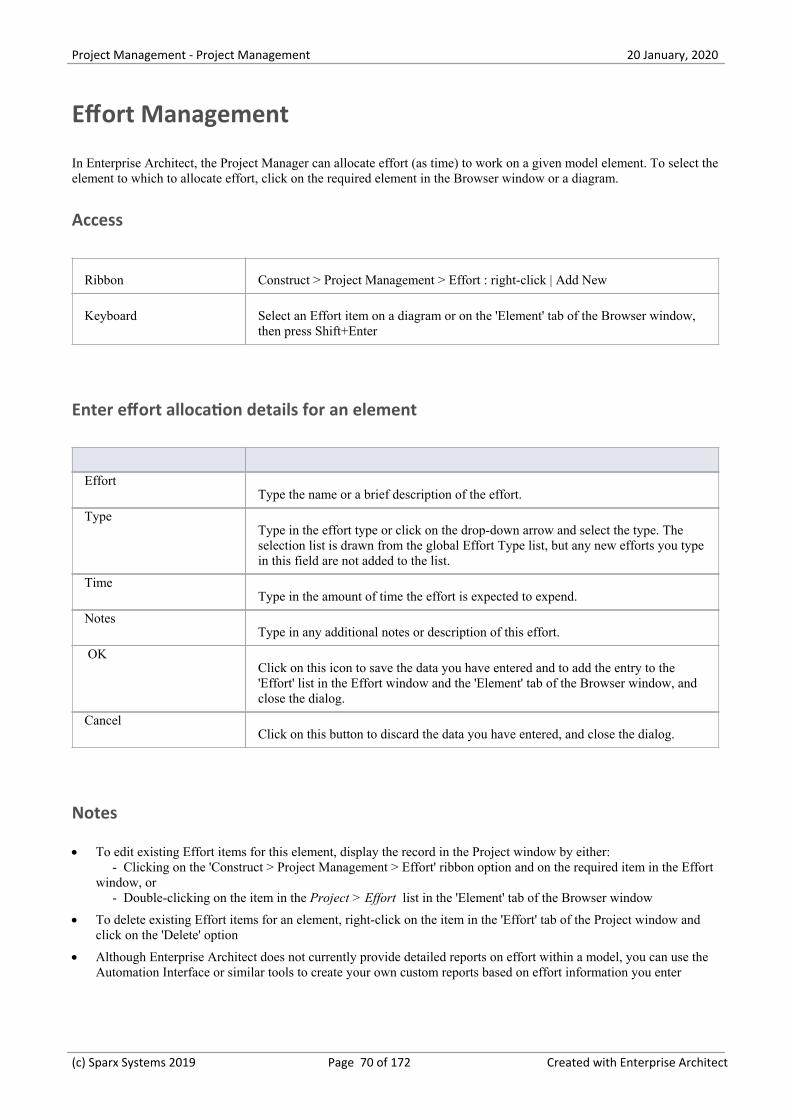
Project Management - Project Management 20 January, 2020
Effort Management
In Enterprise Architect, the Project Manager can allocate effort (as time) to work on a given model element. To select theelement to which to allocate effort, click on the required element in the Browser window or a diagram.
Access
Ribbon Construct > Project Management > Effort : right-click | Add New
Keyboard Select an Effort item on a diagram or on the 'Element' tab of the Browser window,then press Shift+Enter
Enter effort allocation details for an element
EffortType the name or a brief description of the effort.
TypeType in the effort type or click on the drop-down arrow and select the type. Theselection list is drawn from the global Effort Type list, but any new efforts you typein this field are not added to the list.
TimeType in the amount of time the effort is expected to expend.
NotesType in any additional notes or description of this effort.
OKClick on this icon to save the data you have entered and to add the entry to the'Effort' list in the Effort window and the 'Element' tab of the Browser window, andclose the dialog.
CancelClick on this button to discard the data you have entered, and close the dialog.
Notes
To edit existing Effort items for this element, display the record in the Project window by either:· - Clicking on the 'Construct > Project Management > Effort' ribbon option and on the required item in the Effortwindow, or - Double-clicking on the item in the Project > Effort list in the 'Element' tab of the Browser window
To delete existing Effort items for an element, right-click on the item in the 'Effort' tab of the Project window and·click on the 'Delete' option
Although Enterprise Architect does not currently provide detailed reports on effort within a model, you can use the·Automation Interface or similar tools to create your own custom reports based on effort information you enter
(c) Sparx Systems 2019 Page 70 of 172 Created with Enterprise Architect
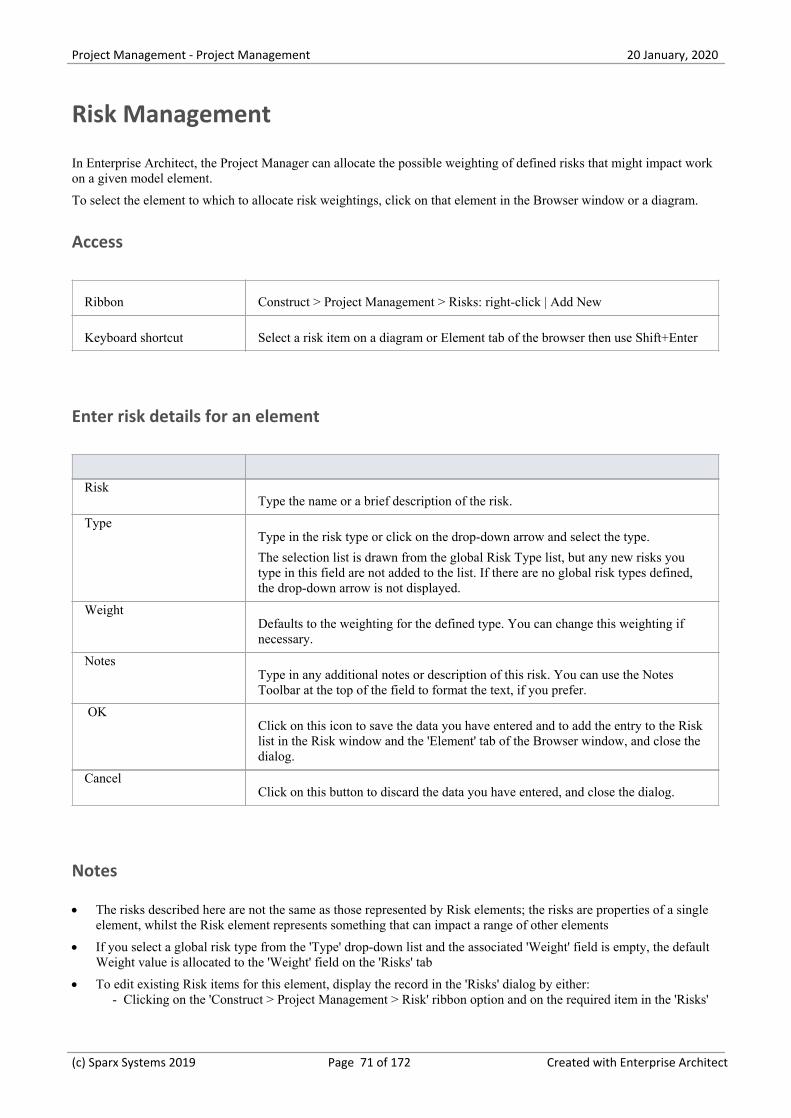
Project Management - Project Management 20 January, 2020
Risk Management
In Enterprise Architect, the Project Manager can allocate the possible weighting of defined risks that might impact workon a given model element.
To select the element to which to allocate risk weightings, click on that element in the Browser window or a diagram.
Access
Ribbon Construct > Project Management > Risks: right-click | Add New
Keyboard shortcut Select a risk item on a diagram or Element tab of the browser then use Shift+Enter
Enter risk details for an element
RiskType the name or a brief description of the risk.
TypeType in the risk type or click on the drop-down arrow and select the type.
The selection list is drawn from the global Risk Type list, but any new risks youtype in this field are not added to the list. If there are no global risk types defined,the drop-down arrow is not displayed.
WeightDefaults to the weighting for the defined type. You can change this weighting ifnecessary.
NotesType in any additional notes or description of this risk. You can use the NotesToolbar at the top of the field to format the text, if you prefer.
OKClick on this icon to save the data you have entered and to add the entry to the Risklist in the Risk window and the 'Element' tab of the Browser window, and close thedialog.
CancelClick on this button to discard the data you have entered, and close the dialog.
Notes
The risks described here are not the same as those represented by Risk elements; the risks are properties of a single·element, whilst the Risk element represents something that can impact a range of other elements
If you select a global risk type from the 'Type' drop-down list and the associated 'Weight' field is empty, the default·Weight value is allocated to the 'Weight' field on the 'Risks' tab
To edit existing Risk items for this element, display the record in the 'Risks' dialog by either:· - Clicking on the 'Construct > Project Management > Risk' ribbon option and on the required item in the 'Risks'
(c) Sparx Systems 2019 Page 71 of 172 Created with Enterprise Architect
Project Management - Project Management 20 January, 2020
tab of the Project window, or - Double-clicking on the item in the Project > Risk list in the 'Element' tab of the Browser window
To delete existing Risk items for an element, right-click on the item in the 'Risk' tab of the Project window and click·on the 'Delete' option
Although Enterprise Architect does not currently provide detailed reports on risks within a model, you can use the·Automation Interface or similar tools to create your own custom reports based on risk information you enter
(c) Sparx Systems 2019 Page 72 of 172 Created with Enterprise Architect
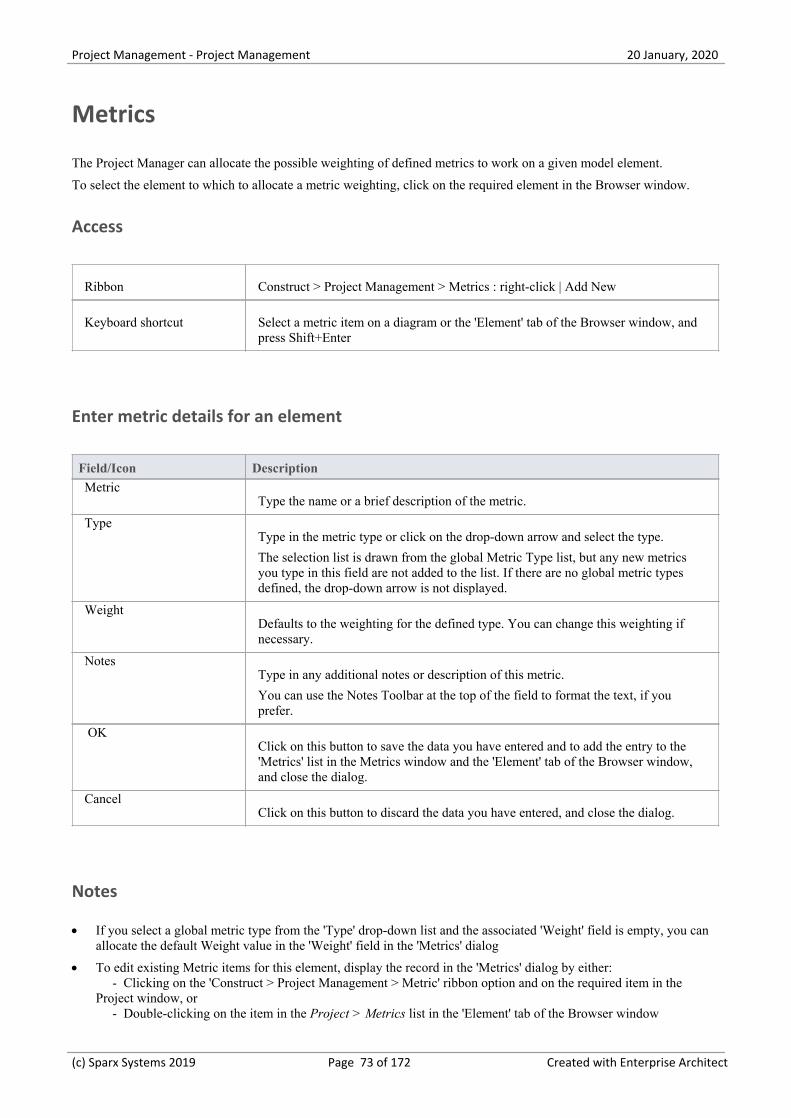
Project Management - Project Management 20 January, 2020
Metrics
The Project Manager can allocate the possible weighting of defined metrics to work on a given model element.
To select the element to which to allocate a metric weighting, click on the required element in the Browser window.
Access
Ribbon Construct > Project Management > Metrics : right-click | Add New
Keyboard shortcut Select a metric item on a diagram or the 'Element' tab of the Browser window, andpress Shift+Enter
Enter metric details for an element
Field/Icon Description
MetricType the name or a brief description of the metric.
TypeType in the metric type or click on the drop-down arrow and select the type.
The selection list is drawn from the global Metric Type list, but any new metricsyou type in this field are not added to the list. If there are no global metric typesdefined, the drop-down arrow is not displayed.
WeightDefaults to the weighting for the defined type. You can change this weighting ifnecessary.
NotesType in any additional notes or description of this metric.
You can use the Notes Toolbar at the top of the field to format the text, if youprefer.
OKClick on this button to save the data you have entered and to add the entry to the'Metrics' list in the Metrics window and the 'Element' tab of the Browser window,and close the dialog.
CancelClick on this button to discard the data you have entered, and close the dialog.
Notes
If you select a global metric type from the 'Type' drop-down list and the associated 'Weight' field is empty, you can·allocate the default Weight value in the 'Weight' field in the 'Metrics' dialog
To edit existing Metric items for this element, display the record in the 'Metrics' dialog by either:· - Clicking on the 'Construct > Project Management > Metric' ribbon option and on the required item in theProject window, or - Double-clicking on the item in the Project > Metrics list in the 'Element' tab of the Browser window
(c) Sparx Systems 2019 Page 73 of 172 Created with Enterprise Architect
Project Management - Project Management 20 January, 2020
To delete existing Metric items for an element, right-click on the item in the Project window or the 'Element' tab and·select the 'Delete' option
Although Enterprise Architect does not currently provide detailed reports on metrics within a model, you can use the·Automation Interface or similar tools to create your own custom reports based on metric information you enter
(c) Sparx Systems 2019 Page 74 of 172 Created with Enterprise Architect
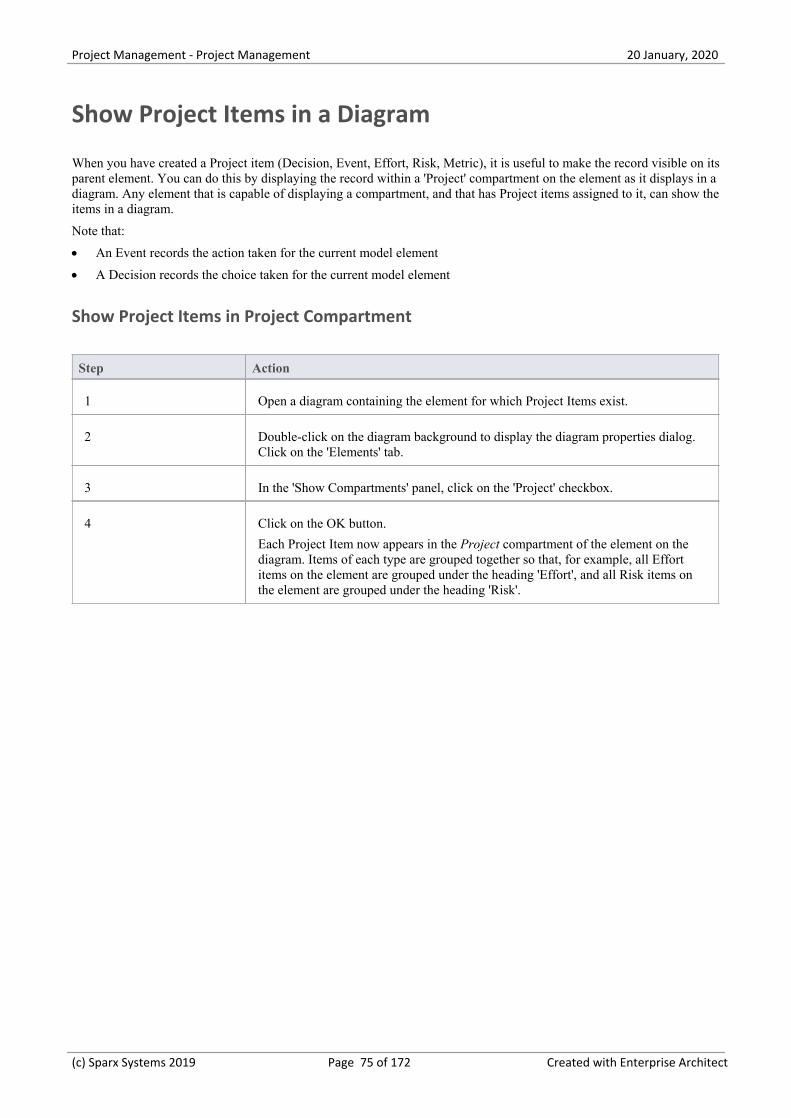
Project Management - Project Management 20 January, 2020
Show Project Items in a Diagram
When you have created a Project item (Decision, Event, Effort, Risk, Metric), it is useful to make the record visible on itsparent element. You can do this by displaying the record within a 'Project' compartment on the element as it displays in adiagram. Any element that is capable of displaying a compartment, and that has Project items assigned to it, can show theitems in a diagram.
Note that:
An Event records the action taken for the current model element·
A Decision records the choice taken for the current model element·
Show Project Items in Project Compartment
Step Action
1 Open a diagram containing the element for which Project Items exist.
2 Double-click on the diagram background to display the diagram properties dialog.Click on the 'Elements' tab.
3 In the 'Show Compartments' panel, click on the 'Project' checkbox.
4 Click on the OK button.
Each Project Item now appears in the Project compartment of the element on thediagram. Items of each type are grouped together so that, for example, all Effortitems on the element are grouped under the heading 'Effort', and all Risk items onthe element are grouped under the heading 'Risk'.
(c) Sparx Systems 2019 Page 75 of 172 Created with Enterprise Architect
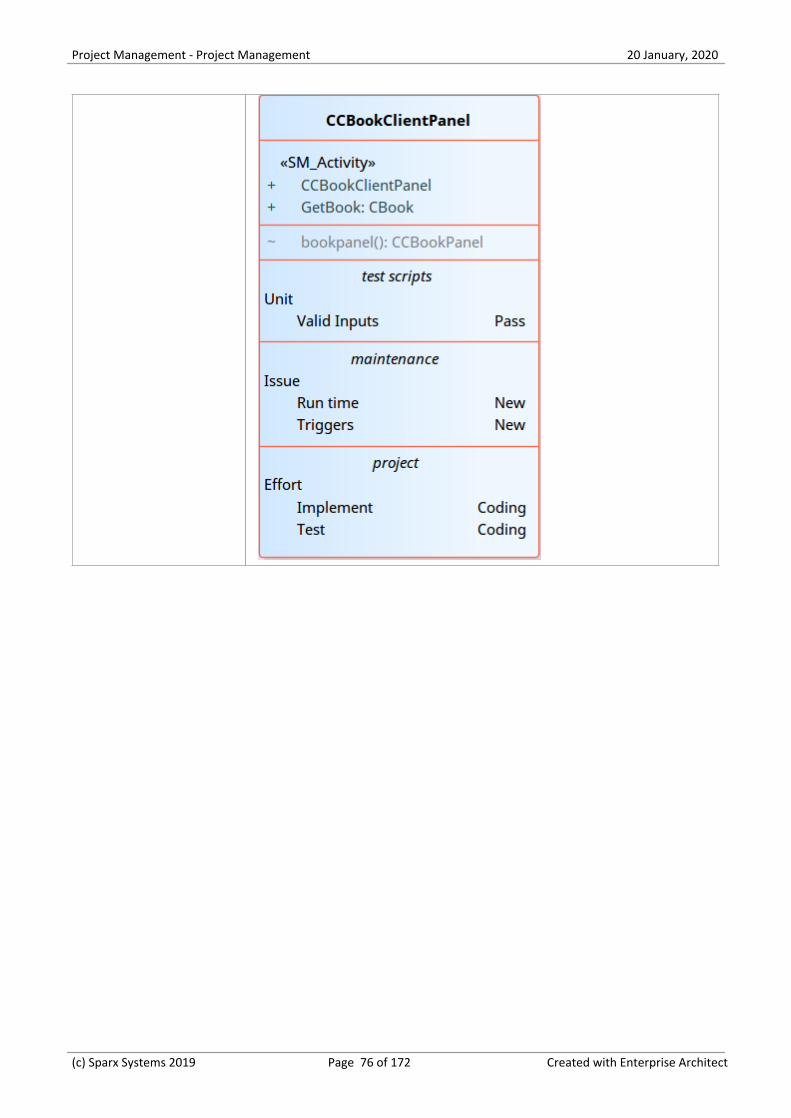
Project Management - Project Management 20 January, 2020
(c) Sparx Systems 2019 Page 76 of 172 Created with Enterprise Architect
Project Management - Project Management 20 January, 2020
Effort Types
When setting up the project management parameters for monitoring work on elements, you can create types of effort toadd to the global list of effort types that can be assigned to any element in the model. You can also select and editexisting effort types. The global list of effort types displays in the 'Type' drop-down list on the 'Effort' page of the ProjectIndicators window.
Access
Open the 'Project Indicators' dialog using one of the methods outlined here, then select the 'Effort' tab.
Ribbon Configure > Reference Data > Model Types > Project Indicators : Effort
Keyboard shortcut Select an Effort item on a diagram or the 'Element' tab of the Browser window, thenpress Shift+Enter
Add a new effort type to the global list
Click the 'New' button to define a new Effort type
Option Action
Effort Type the name of the effort type. (Or, to edit an existing effort type, click on theeffort name in the Defined Effort Types panel.)
Description Type a short description of the effort type.
Weight Type the default weighting to apply to the effort type.
<note> Type any additional information on the effort type.
Save Click on this button to save the changes that you have made to the dialog.
New Click on this button to clear the data fields ready to define a new effort type.
Delete Click on an entry in the Defined Effort Types panel, and click on this button toimmediately delete the effort type.
Close Click on this button to close the 'Project Indicators' dialog. If you have not savedyour changes, the system prompts you to save or abort those changes.
Notes
Although Enterprise Architect does not currently provide detailed reports on effort within a model, you can use the·Automation Interface or similar tools to create your own custom reports based on effort information you enter
You can transport effort types between models, using the 'Configure > Model > Transfer > Export Reference Data'·
(c) Sparx Systems 2019 Page 77 of 172 Created with Enterprise Architect
Project Management - Project Management 20 January, 2020
and 'Import Reference Data' ribbon options
(c) Sparx Systems 2019 Page 78 of 172 Created with Enterprise Architect
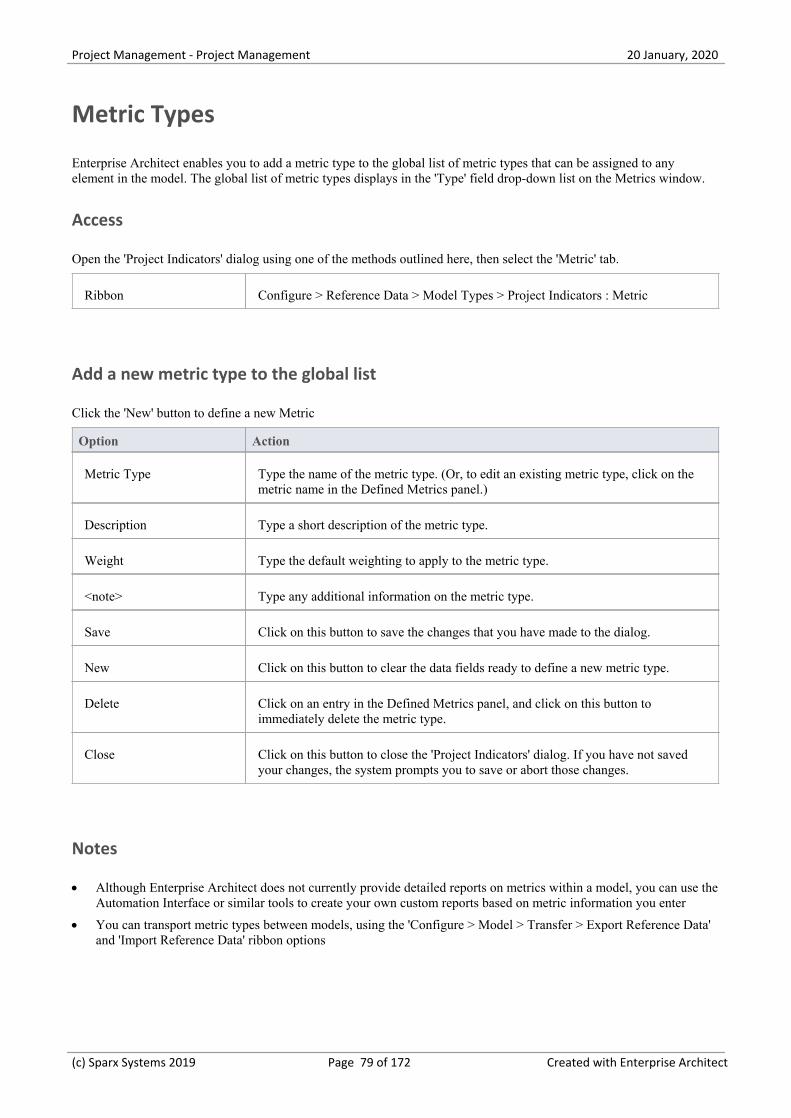
Project Management - Project Management 20 January, 2020
Metric Types
Enterprise Architect enables you to add a metric type to the global list of metric types that can be assigned to anyelement in the model. The global list of metric types displays in the 'Type' field drop-down list on the Metrics window.
Access
Open the 'Project Indicators' dialog using one of the methods outlined here, then select the 'Metric' tab.
Ribbon Configure > Reference Data > Model Types > Project Indicators : Metric
Add a new metric type to the global list
Click the 'New' button to define a new Metric
Option Action
Metric Type Type the name of the metric type. (Or, to edit an existing metric type, click on themetric name in the Defined Metrics panel.)
Description Type a short description of the metric type.
Weight Type the default weighting to apply to the metric type.
<note> Type any additional information on the metric type.
Save Click on this button to save the changes that you have made to the dialog.
New Click on this button to clear the data fields ready to define a new metric type.
Delete Click on an entry in the Defined Metrics panel, and click on this button toimmediately delete the metric type.
Close Click on this button to close the 'Project Indicators' dialog. If you have not savedyour changes, the system prompts you to save or abort those changes.
Notes
Although Enterprise Architect does not currently provide detailed reports on metrics within a model, you can use the·Automation Interface or similar tools to create your own custom reports based on metric information you enter
You can transport metric types between models, using the 'Configure > Model > Transfer > Export Reference Data'·and 'Import Reference Data' ribbon options
(c) Sparx Systems 2019 Page 79 of 172 Created with Enterprise Architect
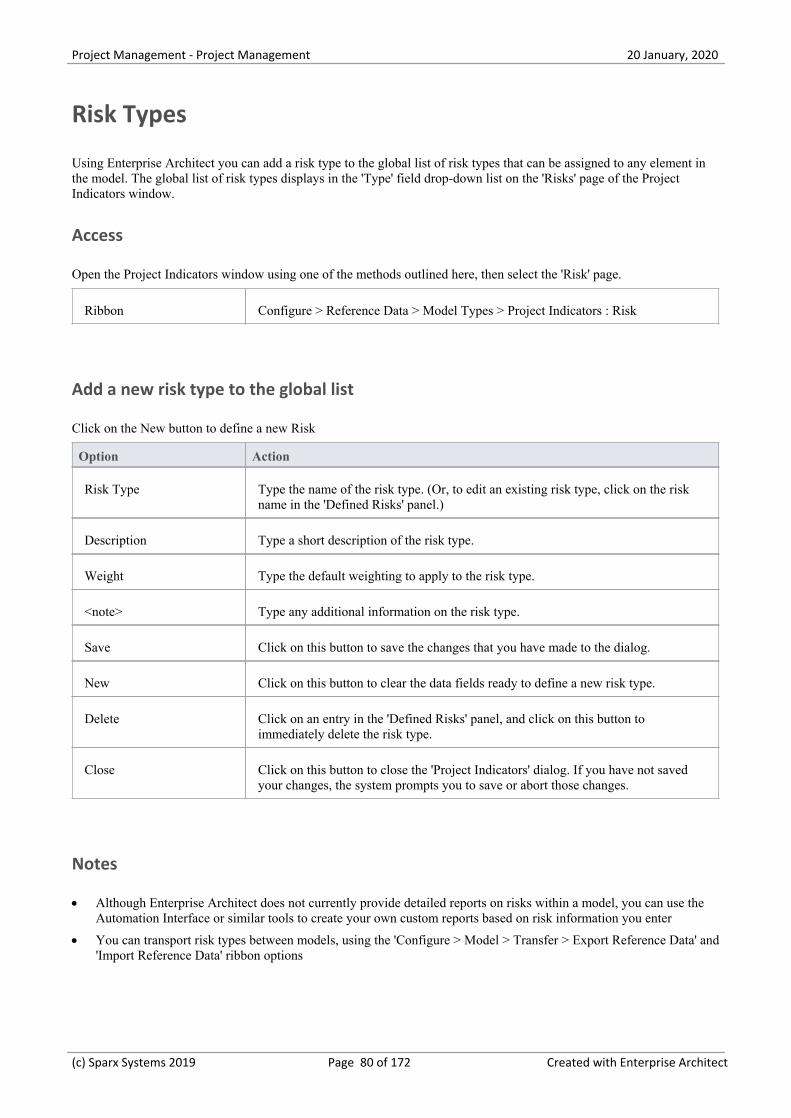
Project Management - Project Management 20 January, 2020
Risk Types
Using Enterprise Architect you can add a risk type to the global list of risk types that can be assigned to any element inthe model. The global list of risk types displays in the 'Type' field drop-down list on the 'Risks' page of the ProjectIndicators window.
Access
Open the Project Indicators window using one of the methods outlined here, then select the 'Risk' page.
Ribbon Configure > Reference Data > Model Types > Project Indicators : Risk
Add a new risk type to the global list
Click on the New button to define a new Risk
Option Action
Risk Type Type the name of the risk type. (Or, to edit an existing risk type, click on the riskname in the 'Defined Risks' panel.)
Description Type a short description of the risk type.
Weight Type the default weighting to apply to the risk type.
<note> Type any additional information on the risk type.
Save Click on this button to save the changes that you have made to the dialog.
New Click on this button to clear the data fields ready to define a new risk type.
Delete Click on an entry in the 'Defined Risks' panel, and click on this button toimmediately delete the risk type.
Close Click on this button to close the 'Project Indicators' dialog. If you have not savedyour changes, the system prompts you to save or abort those changes.
Notes
Although Enterprise Architect does not currently provide detailed reports on risks within a model, you can use the·Automation Interface or similar tools to create your own custom reports based on risk information you enter
You can transport risk types between models, using the 'Configure > Model > Transfer > Export Reference Data' and·'Import Reference Data' ribbon options
(c) Sparx Systems 2019 Page 80 of 172 Created with Enterprise Architect
Project Management - Project Management 20 January, 2020
Project Task Allocation
Using the Project Gantt View, you can review the allocation of work to elements in the project, focusing on either theelements that require work, or the resources required to perform the work. The view primarily shows information that isentered through other windows and dialogs, but once a record exists in the view you can edit it and, for example, add toor change the resources on an element.
Access
Ribbon Construct > Resource Management > Gantt
(c) Sparx Systems 2019 Page 81 of 172 Created with Enterprise Architect
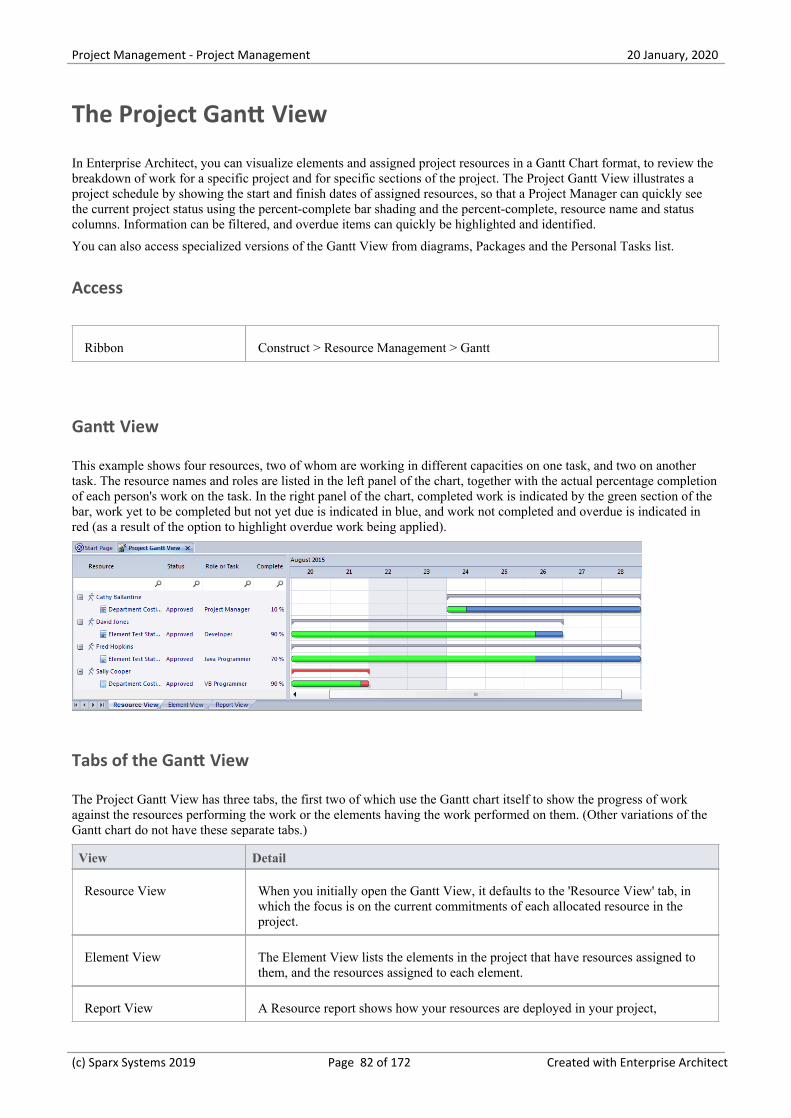
Project Management - Project Management 20 January, 2020
The Project Gantt View
In Enterprise Architect, you can visualize elements and assigned project resources in a Gantt Chart format, to review thebreakdown of work for a specific project and for specific sections of the project. The Project Gantt View illustrates aproject schedule by showing the start and finish dates of assigned resources, so that a Project Manager can quickly seethe current project status using the percent-complete bar shading and the percent-complete, resource name and statuscolumns. Information can be filtered, and overdue items can quickly be highlighted and identified.
You can also access specialized versions of the Gantt View from diagrams, Packages and the Personal Tasks list.
Access
Ribbon Construct > Resource Management > Gantt
Gantt View
This example shows four resources, two of whom are working in different capacities on one task, and two on anothertask. The resource names and roles are listed in the left panel of the chart, together with the actual percentage completionof each person's work on the task. In the right panel of the chart, completed work is indicated by the green section of thebar, work yet to be completed but not yet due is indicated in blue, and work not completed and overdue is indicated inred (as a result of the option to highlight overdue work being applied).
Tabs of the Gantt View
The Project Gantt View has three tabs, the first two of which use the Gantt chart itself to show the progress of workagainst the resources performing the work or the elements having the work performed on them. (Other variations of theGantt chart do not have these separate tabs.)
View Detail
Resource View When you initially open the Gantt View, it defaults to the 'Resource View' tab, inwhich the focus is on the current commitments of each allocated resource in theproject.
Element View The Element View lists the elements in the project that have resources assigned tothem, and the resources assigned to each element.
Report View A Resource report shows how your resources are deployed in your project,
(c) Sparx Systems 2019 Page 82 of 172 Created with Enterprise Architect
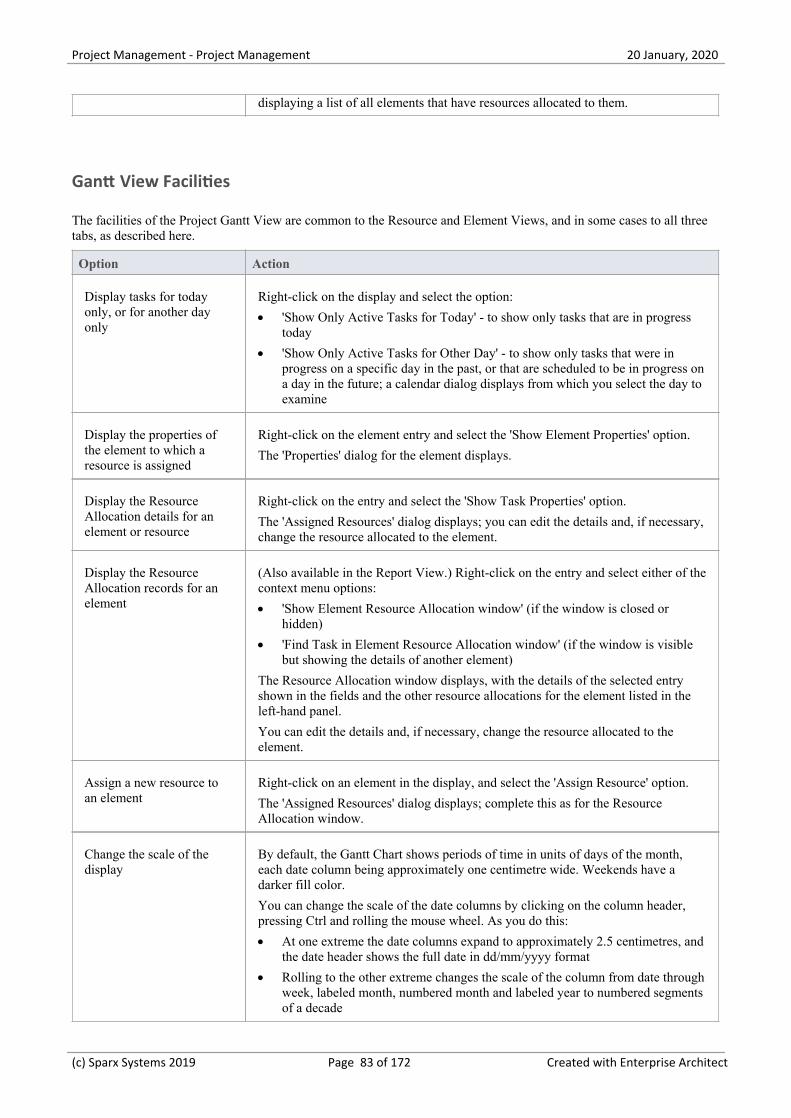
Project Management - Project Management 20 January, 2020
displaying a list of all elements that have resources allocated to them.
Gantt View Facilities
The facilities of the Project Gantt View are common to the Resource and Element Views, and in some cases to all threetabs, as described here.
Option Action
Display tasks for todayonly, or for another dayonly
Right-click on the display and select the option:
'Show Only Active Tasks for Today' - to show only tasks that are in progress·today
'Show Only Active Tasks for Other Day' - to show only tasks that were in·progress on a specific day in the past, or that are scheduled to be in progress ona day in the future; a calendar dialog displays from which you select the day toexamine
Display the properties ofthe element to which aresource is assigned
Right-click on the element entry and select the 'Show Element Properties' option.
The 'Properties' dialog for the element displays.
Display the ResourceAllocation details for anelement or resource
Right-click on the entry and select the 'Show Task Properties' option.
The 'Assigned Resources' dialog displays; you can edit the details and, if necessary,change the resource allocated to the element.
Display the ResourceAllocation records for anelement
(Also available in the Report View.) Right-click on the entry and select either of thecontext menu options:
'Show Element Resource Allocation window' (if the window is closed or·hidden)
'Find Task in Element Resource Allocation window' (if the window is visible·but showing the details of another element)
The Resource Allocation window displays, with the details of the selected entryshown in the fields and the other resource allocations for the element listed in theleft-hand panel.
You can edit the details and, if necessary, change the resource allocated to theelement.
Assign a new resource toan element
Right-click on an element in the display, and select the 'Assign Resource' option.
The 'Assigned Resources' dialog displays; complete this as for the ResourceAllocation window.
Change the scale of thedisplay
By default, the Gantt Chart shows periods of time in units of days of the month,each date column being approximately one centimetre wide. Weekends have adarker fill color.
You can change the scale of the date columns by clicking on the column header,pressing Ctrl and rolling the mouse wheel. As you do this:
At one extreme the date columns expand to approximately 2.5 centimetres, and·the date header shows the full date in dd/mm/yyyy format
Rolling to the other extreme changes the scale of the column from date through·week, labeled month, numbered month and labeled year to numbered segmentsof a decade
(c) Sparx Systems 2019 Page 83 of 172 Created with Enterprise Architect
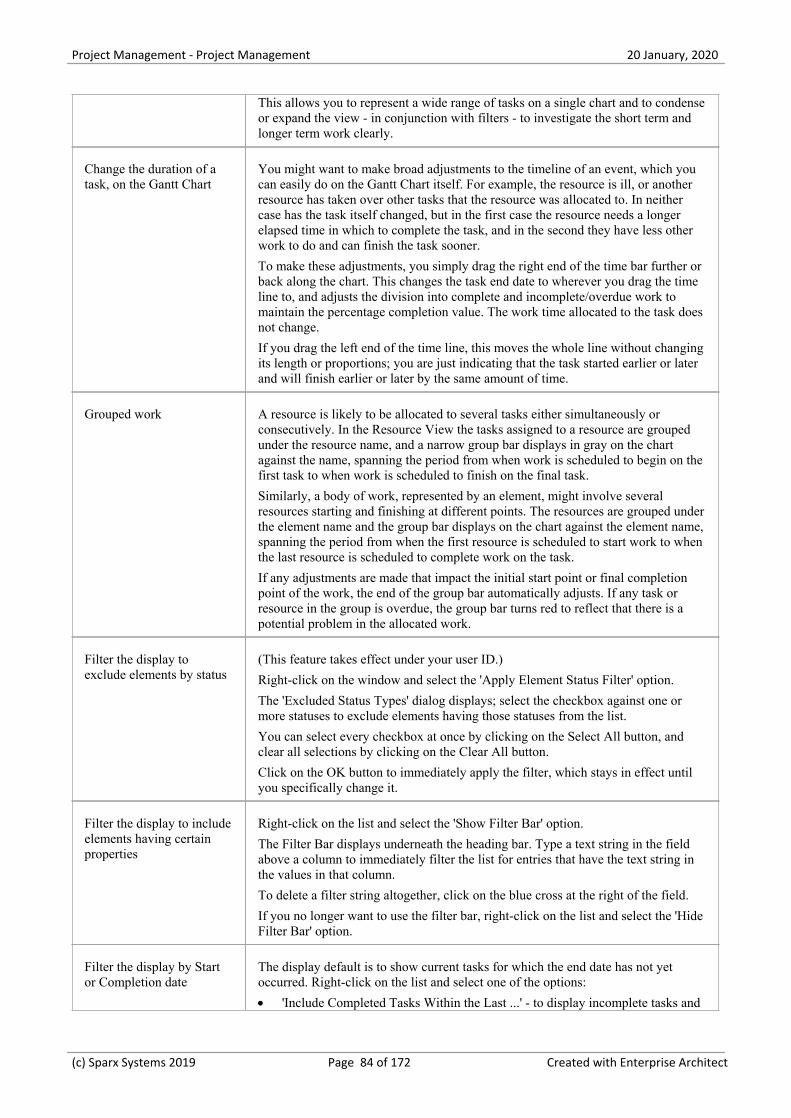
Project Management - Project Management 20 January, 2020
This allows you to represent a wide range of tasks on a single chart and to condenseor expand the view - in conjunction with filters - to investigate the short term andlonger term work clearly.
Change the duration of atask, on the Gantt Chart
You might want to make broad adjustments to the timeline of an event, which youcan easily do on the Gantt Chart itself. For example, the resource is ill, or anotherresource has taken over other tasks that the resource was allocated to. In neithercase has the task itself changed, but in the first case the resource needs a longerelapsed time in which to complete the task, and in the second they have less otherwork to do and can finish the task sooner.
To make these adjustments, you simply drag the right end of the time bar further orback along the chart. This changes the task end date to wherever you drag the timeline to, and adjusts the division into complete and incomplete/overdue work tomaintain the percentage completion value. The work time allocated to the task doesnot change.
If you drag the left end of the time line, this moves the whole line without changingits length or proportions; you are just indicating that the task started earlier or laterand will finish earlier or later by the same amount of time.
Grouped work A resource is likely to be allocated to several tasks either simultaneously orconsecutively. In the Resource View the tasks assigned to a resource are groupedunder the resource name, and a narrow group bar displays in gray on the chartagainst the name, spanning the period from when work is scheduled to begin on thefirst task to when work is scheduled to finish on the final task.
Similarly, a body of work, represented by an element, might involve severalresources starting and finishing at different points. The resources are grouped underthe element name and the group bar displays on the chart against the element name,spanning the period from when the first resource is scheduled to start work to whenthe last resource is scheduled to complete work on the task.
If any adjustments are made that impact the initial start point or final completionpoint of the work, the end of the group bar automatically adjusts. If any task orresource in the group is overdue, the group bar turns red to reflect that there is apotential problem in the allocated work.
Filter the display toexclude elements by status
(This feature takes effect under your user ID.)
Right-click on the window and select the 'Apply Element Status Filter' option.
The 'Excluded Status Types' dialog displays; select the checkbox against one ormore statuses to exclude elements having those statuses from the list.
You can select every checkbox at once by clicking on the Select All button, andclear all selections by clicking on the Clear All button.
Click on the OK button to immediately apply the filter, which stays in effect untilyou specifically change it.
Filter the display to includeelements having certainproperties
Right-click on the list and select the 'Show Filter Bar' option.
The Filter Bar displays underneath the heading bar. Type a text string in the fieldabove a column to immediately filter the list for entries that have the text string inthe values in that column.
To delete a filter string altogether, click on the blue cross at the right of the field.
If you no longer want to use the filter bar, right-click on the list and select the 'HideFilter Bar' option.
Filter the display by Startor Completion date
The display default is to show current tasks for which the end date has not yetoccurred. Right-click on the list and select one of the options:
'Include Completed Tasks Within the Last ...' - to display incomplete tasks and·
(c) Sparx Systems 2019 Page 84 of 172 Created with Enterprise Architect
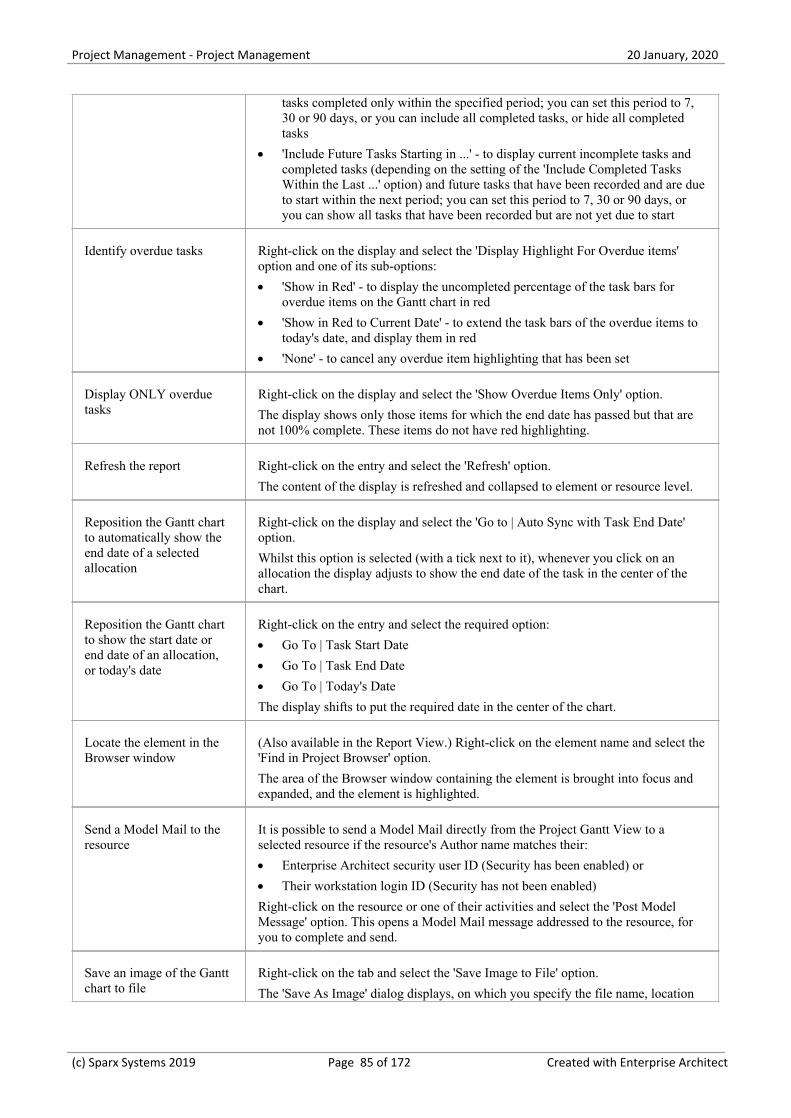
Project Management - Project Management 20 January, 2020
tasks completed only within the specified period; you can set this period to 7,30 or 90 days, or you can include all completed tasks, or hide all completedtasks
'Include Future Tasks Starting in ...' - to display current incomplete tasks and·completed tasks (depending on the setting of the 'Include Completed TasksWithin the Last ...' option) and future tasks that have been recorded and are dueto start within the next period; you can set this period to 7, 30 or 90 days, oryou can show all tasks that have been recorded but are not yet due to start
Identify overdue tasks Right-click on the display and select the 'Display Highlight For Overdue items'option and one of its sub-options:
'Show in Red' - to display the uncompleted percentage of the task bars for·overdue items on the Gantt chart in red
'Show in Red to Current Date' - to extend the task bars of the overdue items to·today's date, and display them in red
'None' - to cancel any overdue item highlighting that has been set·
Display ONLY overduetasks
Right-click on the display and select the 'Show Overdue Items Only' option.
The display shows only those items for which the end date has passed but that arenot 100% complete. These items do not have red highlighting.
Refresh the report Right-click on the entry and select the 'Refresh' option.
The content of the display is refreshed and collapsed to element or resource level.
Reposition the Gantt chartto automatically show theend date of a selectedallocation
Right-click on the display and select the 'Go to | Auto Sync with Task End Date'option.
Whilst this option is selected (with a tick next to it), whenever you click on anallocation the display adjusts to show the end date of the task in the center of thechart.
Reposition the Gantt chartto show the start date orend date of an allocation,or today's date
Right-click on the entry and select the required option:
Go To | Task Start Date·
Go To | Task End Date·
Go To | Today's Date·
The display shifts to put the required date in the center of the chart.
Locate the element in theBrowser window
(Also available in the Report View.) Right-click on the element name and select the'Find in Project Browser' option.
The area of the Browser window containing the element is brought into focus andexpanded, and the element is highlighted.
Send a Model Mail to theresource
It is possible to send a Model Mail directly from the Project Gantt View to aselected resource if the resource's Author name matches their:
Enterprise Architect security user ID (Security has been enabled) or·
Their workstation login ID (Security has not been enabled)·
Right-click on the resource or one of their activities and select the 'Post ModelMessage' option. This opens a Model Mail message addressed to the resource, foryou to complete and send.
Save an image of the Ganttchart to file
Right-click on the tab and select the 'Save Image to File' option.
The 'Save As Image' dialog displays, on which you specify the file name, location
(c) Sparx Systems 2019 Page 85 of 172 Created with Enterprise Architect
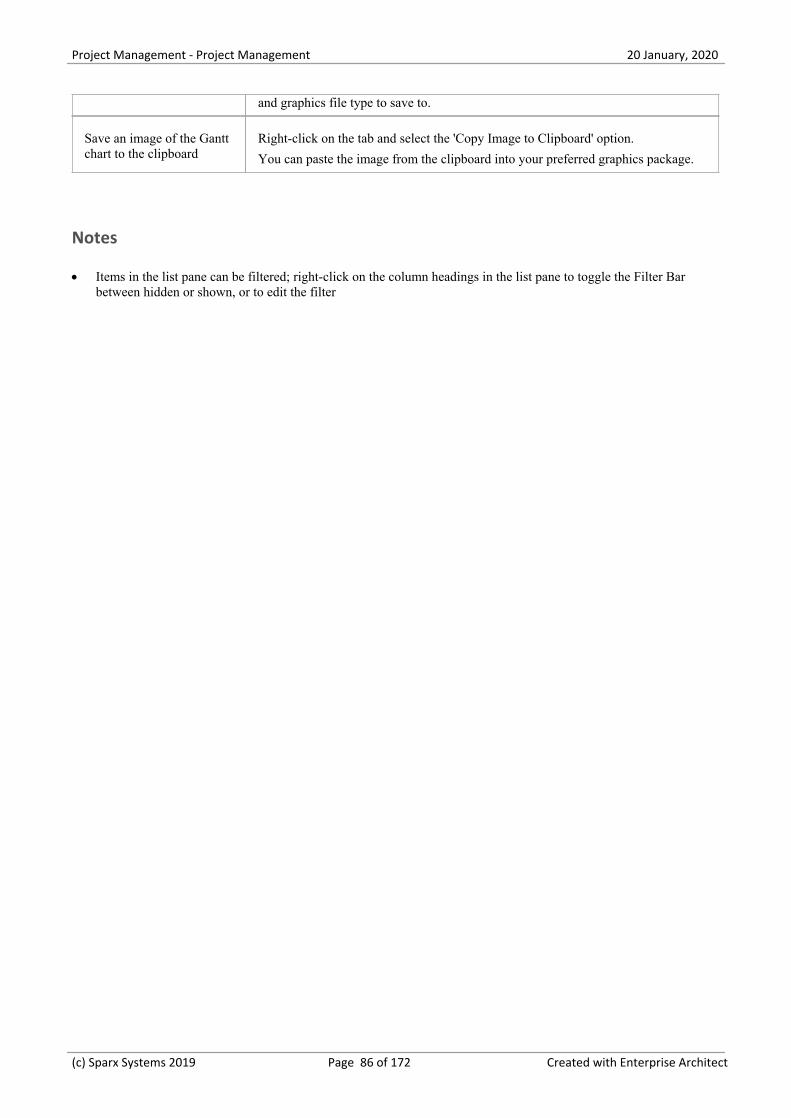
Project Management - Project Management 20 January, 2020
and graphics file type to save to.
Save an image of the Ganttchart to the clipboard
Right-click on the tab and select the 'Copy Image to Clipboard' option.
You can paste the image from the clipboard into your preferred graphics package.
Notes
Items in the list pane can be filtered; right-click on the column headings in the list pane to toggle the Filter Bar·between hidden or shown, or to edit the filter
(c) Sparx Systems 2019 Page 86 of 172 Created with Enterprise Architect
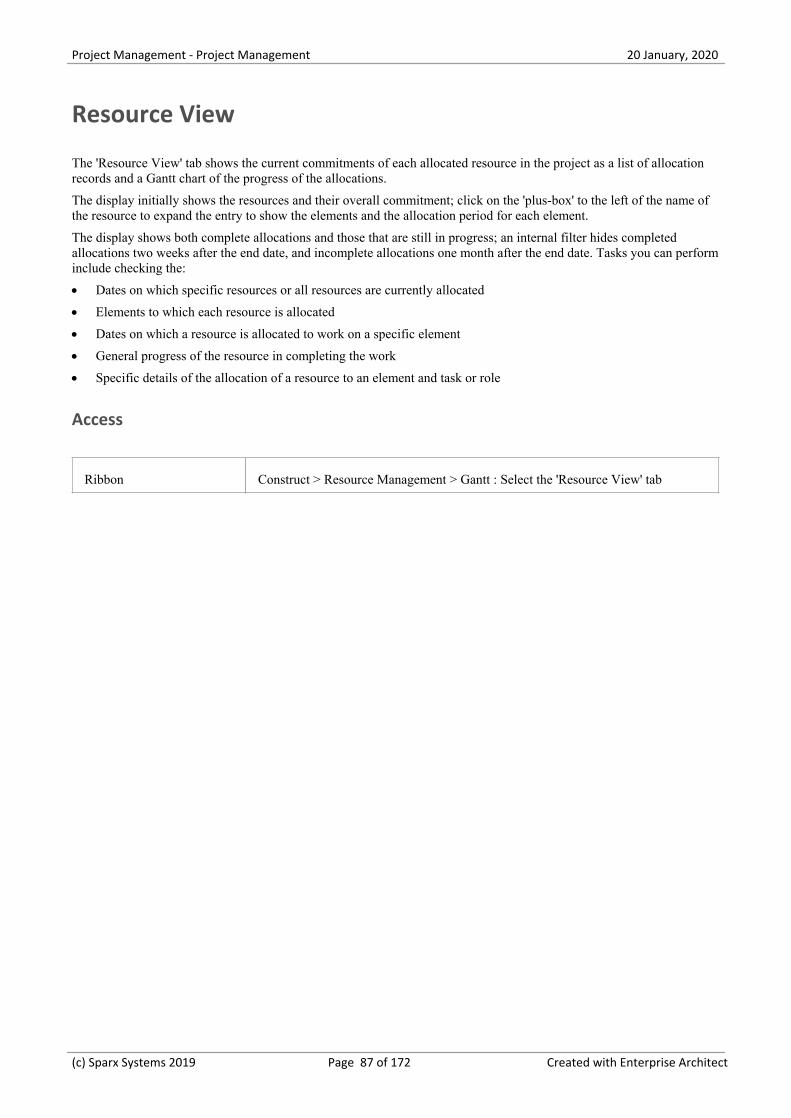
Project Management - Project Management 20 January, 2020
Resource View
The 'Resource View' tab shows the current commitments of each allocated resource in the project as a list of allocationrecords and a Gantt chart of the progress of the allocations.
The display initially shows the resources and their overall commitment; click on the 'plus-box' to the left of the name ofthe resource to expand the entry to show the elements and the allocation period for each element.
The display shows both complete allocations and those that are still in progress; an internal filter hides completedallocations two weeks after the end date, and incomplete allocations one month after the end date. Tasks you can performinclude checking the:
Dates on which specific resources or all resources are currently allocated·
Elements to which each resource is allocated·
Dates on which a resource is allocated to work on a specific element·
General progress of the resource in completing the work·
Specific details of the allocation of a resource to an element and task or role·
Access
Ribbon Construct > Resource Management > Gantt : Select the 'Resource View' tab
(c) Sparx Systems 2019 Page 87 of 172 Created with Enterprise Architect
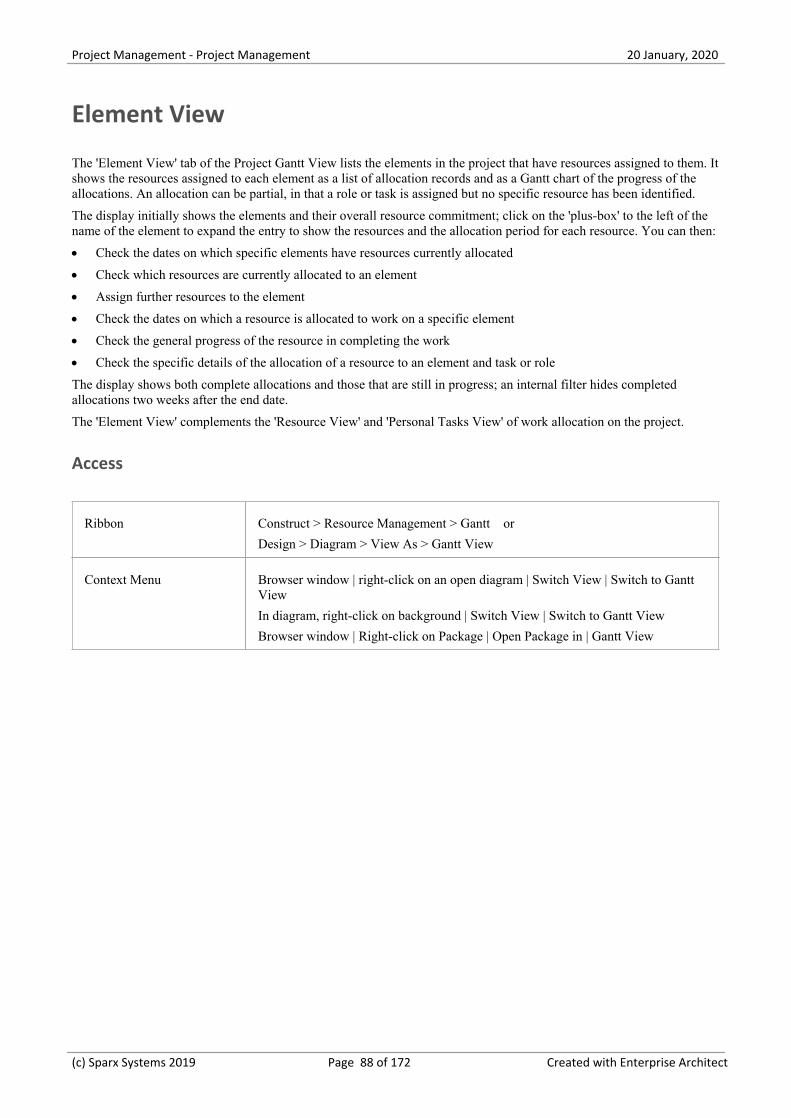
Project Management - Project Management 20 January, 2020
Element View
The 'Element View' tab of the Project Gantt View lists the elements in the project that have resources assigned to them. Itshows the resources assigned to each element as a list of allocation records and as a Gantt chart of the progress of theallocations. An allocation can be partial, in that a role or task is assigned but no specific resource has been identified.
The display initially shows the elements and their overall resource commitment; click on the 'plus-box' to the left of thename of the element to expand the entry to show the resources and the allocation period for each resource. You can then:
Check the dates on which specific elements have resources currently allocated·
Check which resources are currently allocated to an element·
Assign further resources to the element·
Check the dates on which a resource is allocated to work on a specific element·
Check the general progress of the resource in completing the work·
Check the specific details of the allocation of a resource to an element and task or role·
The display shows both complete allocations and those that are still in progress; an internal filter hides completedallocations two weeks after the end date.
The 'Element View' complements the 'Resource View' and 'Personal Tasks View' of work allocation on the project.
Access
Ribbon Construct > Resource Management > Gantt or
Design > Diagram > View As > Gantt View
Context Menu Browser window | right-click on an open diagram | Switch View | Switch to GanttView
In diagram, right-click on background | Switch View | Switch to Gantt View
Browser window | Right-click on Package | Open Package in | Gantt View
(c) Sparx Systems 2019 Page 88 of 172 Created with Enterprise Architect
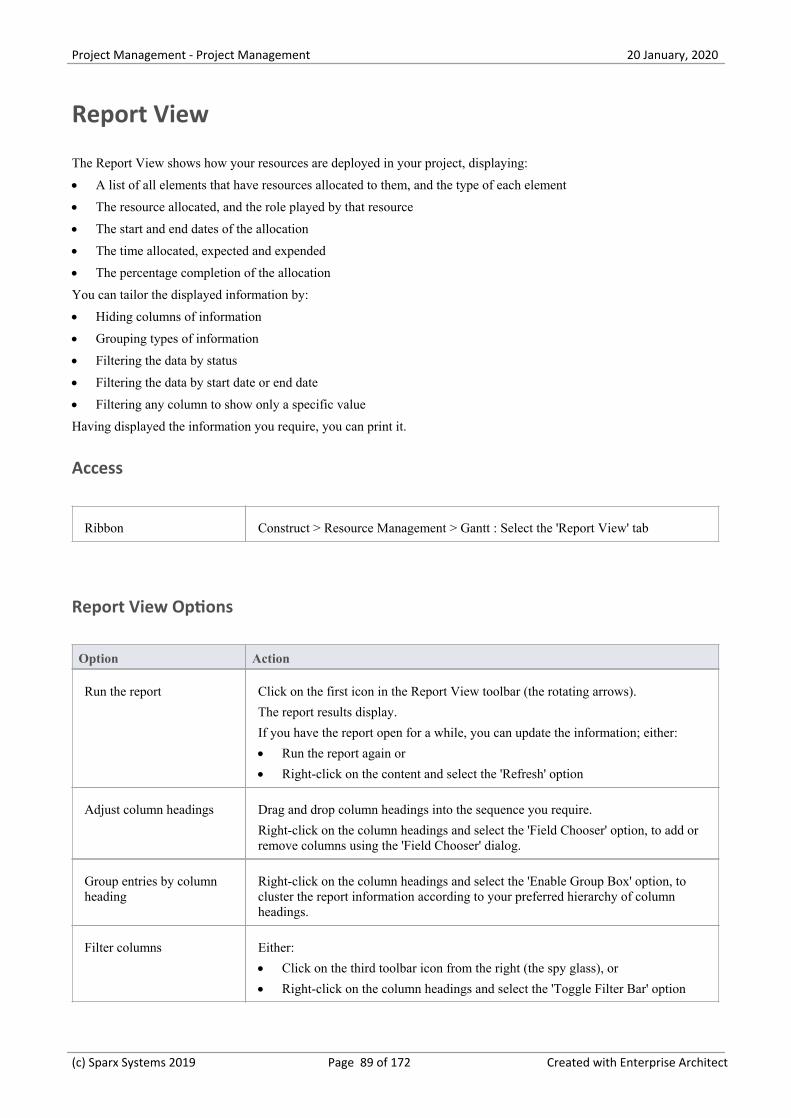
Project Management - Project Management 20 January, 2020
Report View
The Report View shows how your resources are deployed in your project, displaying:
A list of all elements that have resources allocated to them, and the type of each element·
The resource allocated, and the role played by that resource·
The start and end dates of the allocation·
The time allocated, expected and expended·
The percentage completion of the allocation·
You can tailor the displayed information by:
Hiding columns of information·
Grouping types of information·
Filtering the data by status·
Filtering the data by start date or end date·
Filtering any column to show only a specific value·
Having displayed the information you require, you can print it.
Access
Ribbon Construct > Resource Management > Gantt : Select the 'Report View' tab
Report View Options
Option Action
Run the report Click on the first icon in the Report View toolbar (the rotating arrows).
The report results display.
If you have the report open for a while, you can update the information; either:
Run the report again or·
Right-click on the content and select the 'Refresh' option·
Adjust column headings Drag and drop column headings into the sequence you require.
Right-click on the column headings and select the 'Field Chooser' option, to add orremove columns using the 'Field Chooser' dialog.
Group entries by columnheading
Right-click on the column headings and select the 'Enable Group Box' option, tocluster the report information according to your preferred hierarchy of columnheadings.
Filter columns Either:
Click on the third toolbar icon from the right (the spy glass), or·
Right-click on the column headings and select the 'Toggle Filter Bar' option·
(c) Sparx Systems 2019 Page 89 of 172 Created with Enterprise Architect
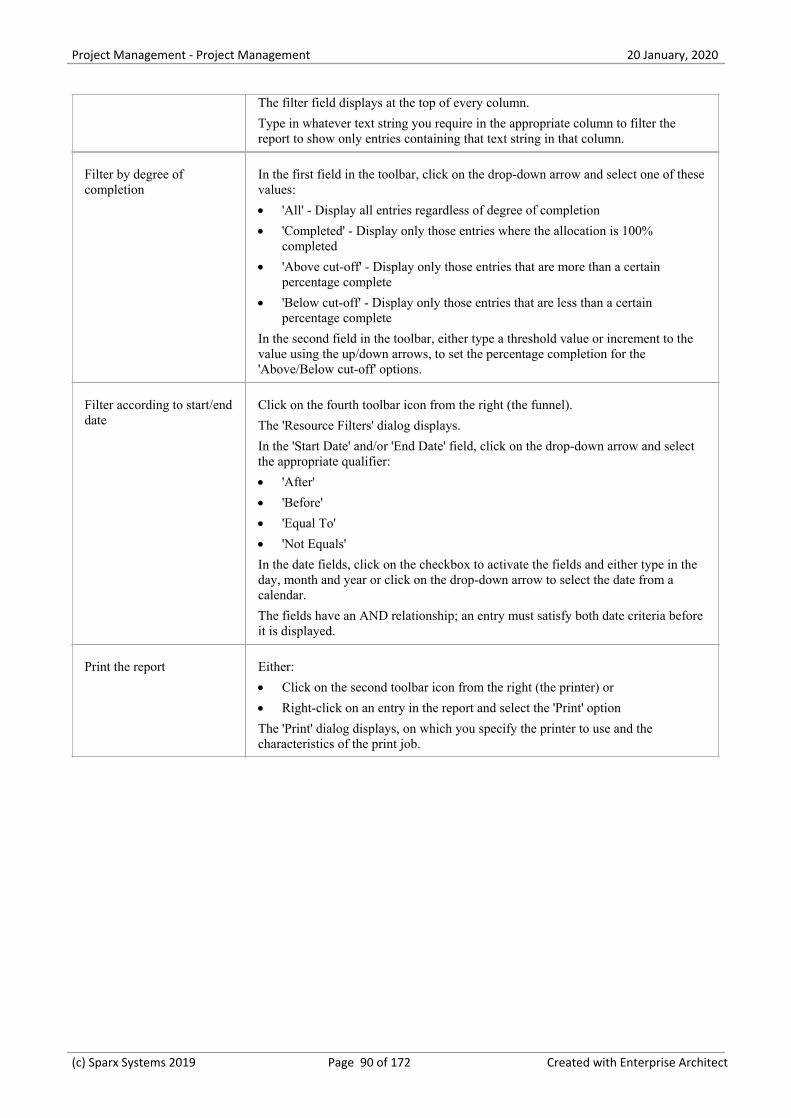
Project Management - Project Management 20 January, 2020
The filter field displays at the top of every column.
Type in whatever text string you require in the appropriate column to filter thereport to show only entries containing that text string in that column.
Filter by degree ofcompletion
In the first field in the toolbar, click on the drop-down arrow and select one of thesevalues:
'All' - Display all entries regardless of degree of completion·
'Completed' - Display only those entries where the allocation is 100%·completed
'Above cut-off' - Display only those entries that are more than a certain·percentage complete
'Below cut-off' - Display only those entries that are less than a certain·percentage complete
In the second field in the toolbar, either type a threshold value or increment to thevalue using the up/down arrows, to set the percentage completion for the'Above/Below cut-off' options.
Filter according to start/enddate
Click on the fourth toolbar icon from the right (the funnel).
The 'Resource Filters' dialog displays.
In the 'Start Date' and/or 'End Date' field, click on the drop-down arrow and selectthe appropriate qualifier:
'After'·
'Before'·
'Equal To'·
'Not Equals'·
In the date fields, click on the checkbox to activate the fields and either type in theday, month and year or click on the drop-down arrow to select the date from acalendar.
The fields have an AND relationship; an entry must satisfy both date criteria beforeit is displayed.
Print the report Either:
Click on the second toolbar icon from the right (the printer) or·
Right-click on an entry in the report and select the 'Print' option·
The 'Print' dialog displays, on which you specify the printer to use and thecharacteristics of the print job.
(c) Sparx Systems 2019 Page 90 of 172 Created with Enterprise Architect
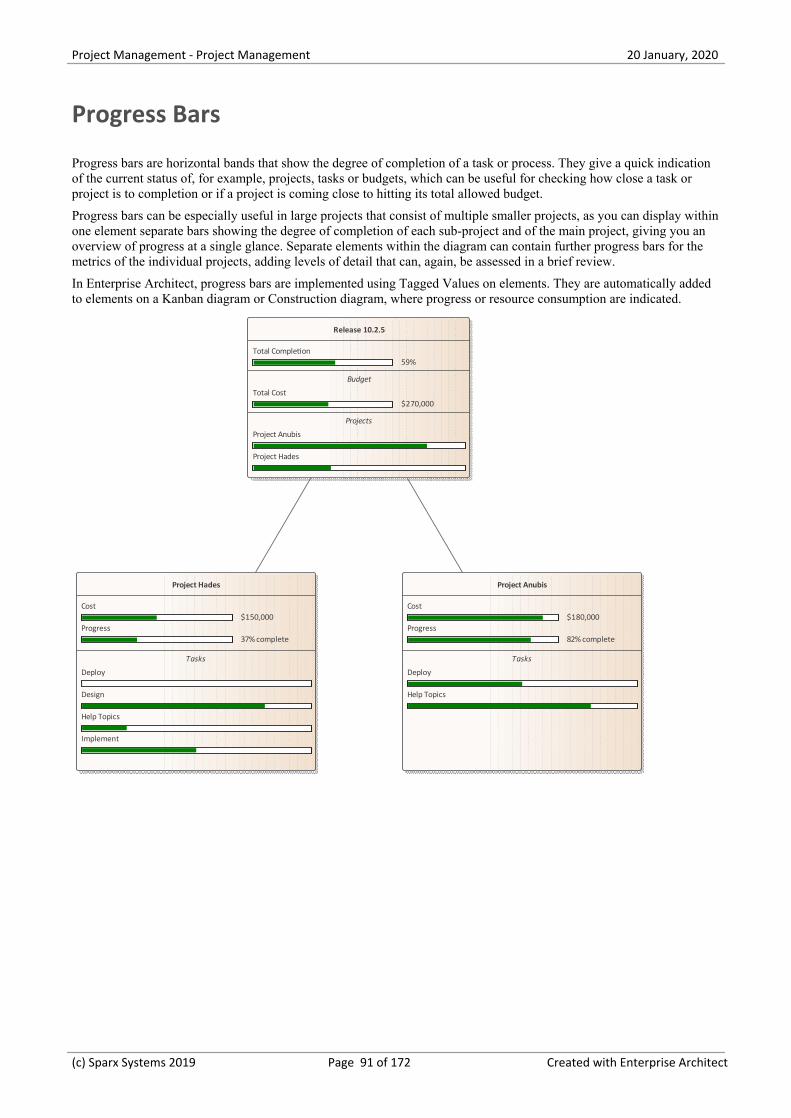
Project Management - Project Management 20 January, 2020
Progress Bars
Progress bars are horizontal bands that show the degree of completion of a task or process. They give a quick indicationof the current status of, for example, projects, tasks or budgets, which can be useful for checking how close a task orproject is to completion or if a project is coming close to hitting its total allowed budget.
Progress bars can be especially useful in large projects that consist of multiple smaller projects, as you can display withinone element separate bars showing the degree of completion of each sub-project and of the main project, giving you anoverview of progress at a single glance. Separate elements within the diagram can contain further progress bars for themetrics of the individual projects, adding levels of detail that can, again, be assessed in a brief review.
In Enterprise Architect, progress bars are implemented using Tagged Values on elements. They are automatically addedto elements on a Kanban diagram or Construction diagram, where progress or resource consumption are indicated.
Project Hades
Cost$150,000
Progress37% complete
Tasks
Deploy
Design
Help Topics
Implement
Project Anubis
Cost$180,000
Progress82% complete
Tasks
Deploy
Help Topics
Release 10.2.5
Total Completion59%
Budget
Total Cost$270,000
Projects
Project Anubis
Project Hades
(c) Sparx Systems 2019 Page 91 of 172 Created with Enterprise Architect

Project Management - Project Management 20 January, 2020
Using Progress Bars
You can add progress bars to any element that can show compartments and that can display any numerical value within arange, when displayed on a diagram.
Progress bars can be used to display things such as:
The current progress of a task or project·
How much of project's budget has been used·
By default a progress bar will display a value between 0 and 100 (inclusive); however, it is possible to adjust both theminimum and maximum values to set any range of values required.
This illustration shows an example of a default progress bar:
Project Alpha
Progress
Creating a Progress Bar using a new Tagged Value
Use this procedure to create a progress bar using a simple Tagged Value that you create immediately from scratch.
Step Action
1 On a diagram, create an element that can display compartments (such as a Requirement or Feature) andadd a simple Tagged Value to it.
2 From the 'Tags' tab of the Properties window open the tag's notes and add 'Type=ProgressBar;' (includingthe semi-colon) and then click on the OK button.
(You can add further options to the Tagged Value, as described in the Additional Progress Bar Optionstable.)
3 Click on the element and either press Ctrl+Shift+Y or right-click and select the 'Compartment Visibility'option. The 'Compartment Visibility' dialog displays.
4 Select the 'Tags' checkbox in the 'Show Element Compartments' panel, then click on the OK button.
(c) Sparx Systems 2019 Page 92 of 172 Created with Enterprise Architect
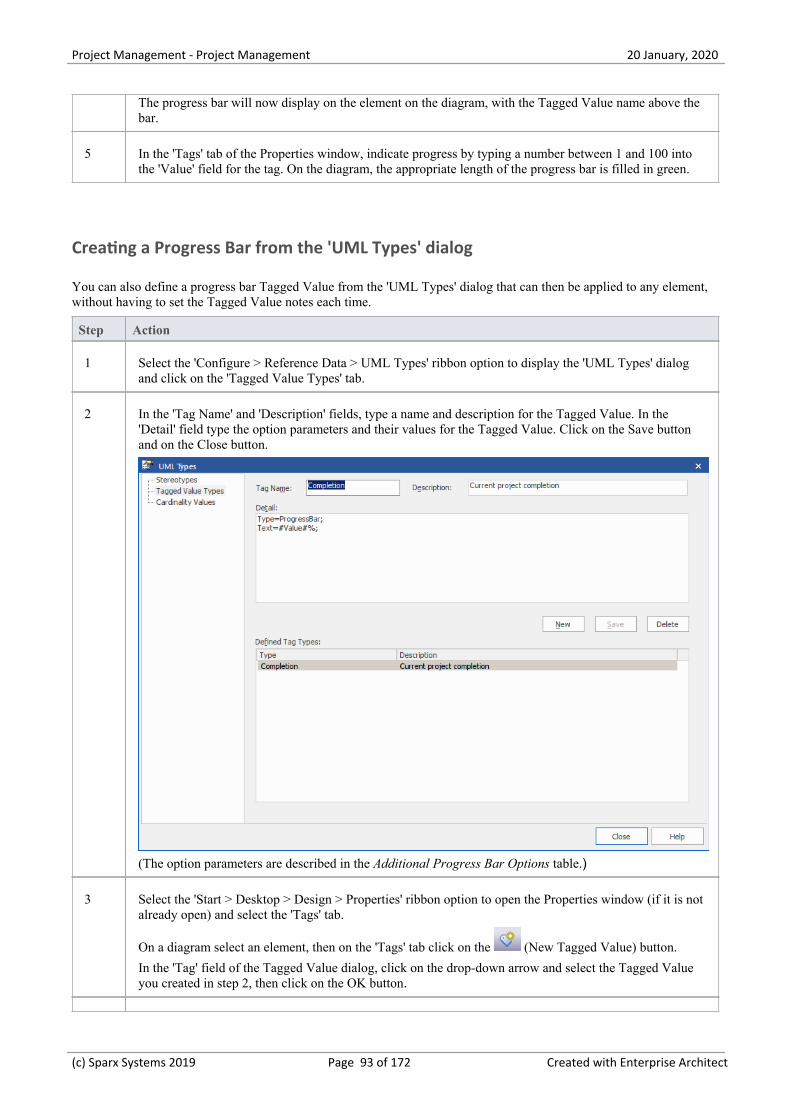
Project Management - Project Management 20 January, 2020
The progress bar will now display on the element on the diagram, with the Tagged Value name above thebar.
5 In the 'Tags' tab of the Properties window, indicate progress by typing a number between 1 and 100 intothe 'Value' field for the tag. On the diagram, the appropriate length of the progress bar is filled in green.
Creating a Progress Bar from the 'UML Types' dialog
You can also define a progress bar Tagged Value from the 'UML Types' dialog that can then be applied to any element,without having to set the Tagged Value notes each time.
Step Action
1 Select the 'Configure > Reference Data > UML Types' ribbon option to display the 'UML Types' dialogand click on the 'Tagged Value Types' tab.
2 In the 'Tag Name' and 'Description' fields, type a name and description for the Tagged Value. In the'Detail' field type the option parameters and their values for the Tagged Value. Click on the Save buttonand on the Close button.
(The option parameters are described in the Additional Progress Bar Options table.)
3 Select the 'Start > Desktop > Design > Properties' ribbon option to open the Properties window (if it is notalready open) and select the 'Tags' tab.
On a diagram select an element, then on the 'Tags' tab click on the (New Tagged Value) button.
In the 'Tag' field of the Tagged Value dialog, click on the drop-down arrow and select the Tagged Valueyou created in step 2, then click on the OK button.
(c) Sparx Systems 2019 Page 93 of 172 Created with Enterprise Architect
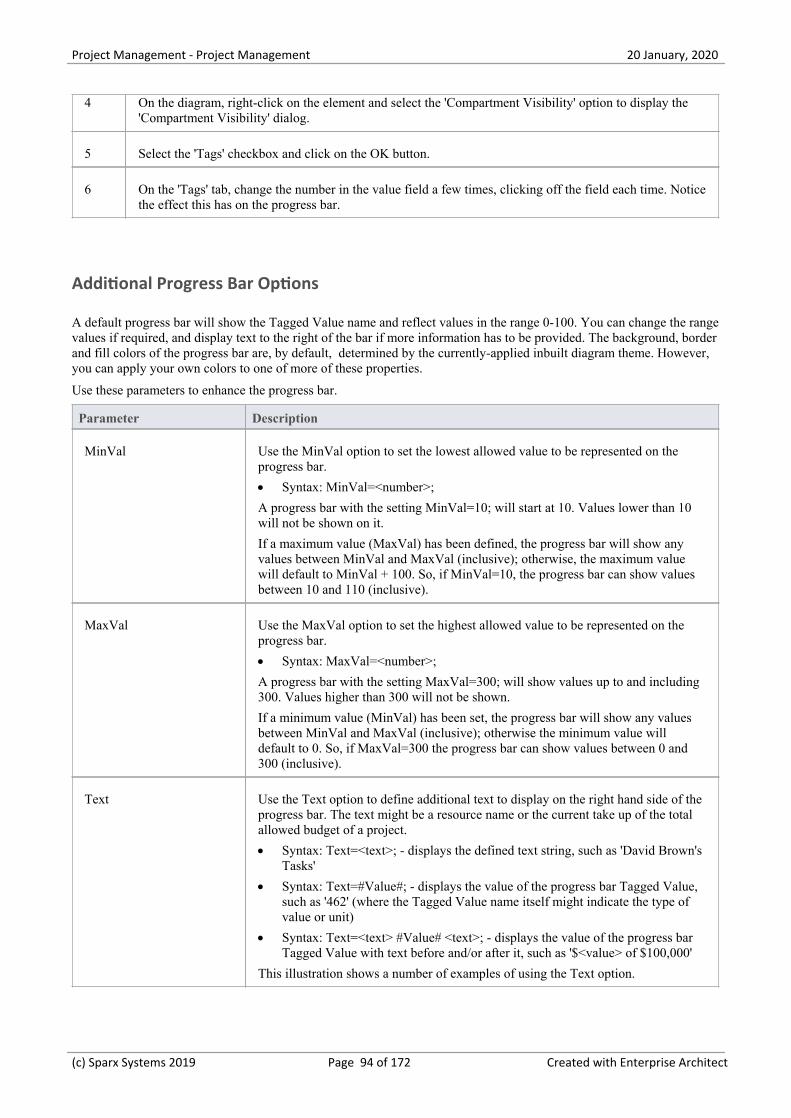
Project Management - Project Management 20 January, 2020
4 On the diagram, right-click on the element and select the 'Compartment Visibility' option to display the'Compartment Visibility' dialog.
5 Select the 'Tags' checkbox and click on the OK button.
6 On the 'Tags' tab, change the number in the value field a few times, clicking off the field each time. Noticethe effect this has on the progress bar.
Additional Progress Bar Options
A default progress bar will show the Tagged Value name and reflect values in the range 0-100. You can change the rangevalues if required, and display text to the right of the bar if more information has to be provided. The background, borderand fill colors of the progress bar are, by default, determined by the currently-applied inbuilt diagram theme. However,you can apply your own colors to one of more of these properties.
Use these parameters to enhance the progress bar.
Parameter Description
MinVal Use the MinVal option to set the lowest allowed value to be represented on theprogress bar.
Syntax: MinVal=<number>;·
A progress bar with the setting MinVal=10; will start at 10. Values lower than 10will not be shown on it.
If a maximum value (MaxVal) has been defined, the progress bar will show anyvalues between MinVal and MaxVal (inclusive); otherwise, the maximum valuewill default to MinVal + 100. So, if MinVal=10, the progress bar can show valuesbetween 10 and 110 (inclusive).
MaxVal Use the MaxVal option to set the highest allowed value to be represented on theprogress bar.
Syntax: MaxVal=<number>;·
A progress bar with the setting MaxVal=300; will show values up to and including300. Values higher than 300 will not be shown.
If a minimum value (MinVal) has been set, the progress bar will show any valuesbetween MinVal and MaxVal (inclusive); otherwise the minimum value willdefault to 0. So, if MaxVal=300 the progress bar can show values between 0 and300 (inclusive).
Text Use the Text option to define additional text to display on the right hand side of theprogress bar. The text might be a resource name or the current take up of the totalallowed budget of a project.
Syntax: Text=<text>; - displays the defined text string, such as 'David Brown's·Tasks'
Syntax: Text=#Value#; - displays the value of the progress bar Tagged Value,·such as '462' (where the Tagged Value name itself might indicate the type ofvalue or unit)
Syntax: Text=<text> #Value# <text>; - displays the value of the progress bar·Tagged Value with text before and/or after it, such as '$<value> of $100,000'
This illustration shows a number of examples of using the Text option.
(c) Sparx Systems 2019 Page 94 of 172 Created with Enterprise Architect
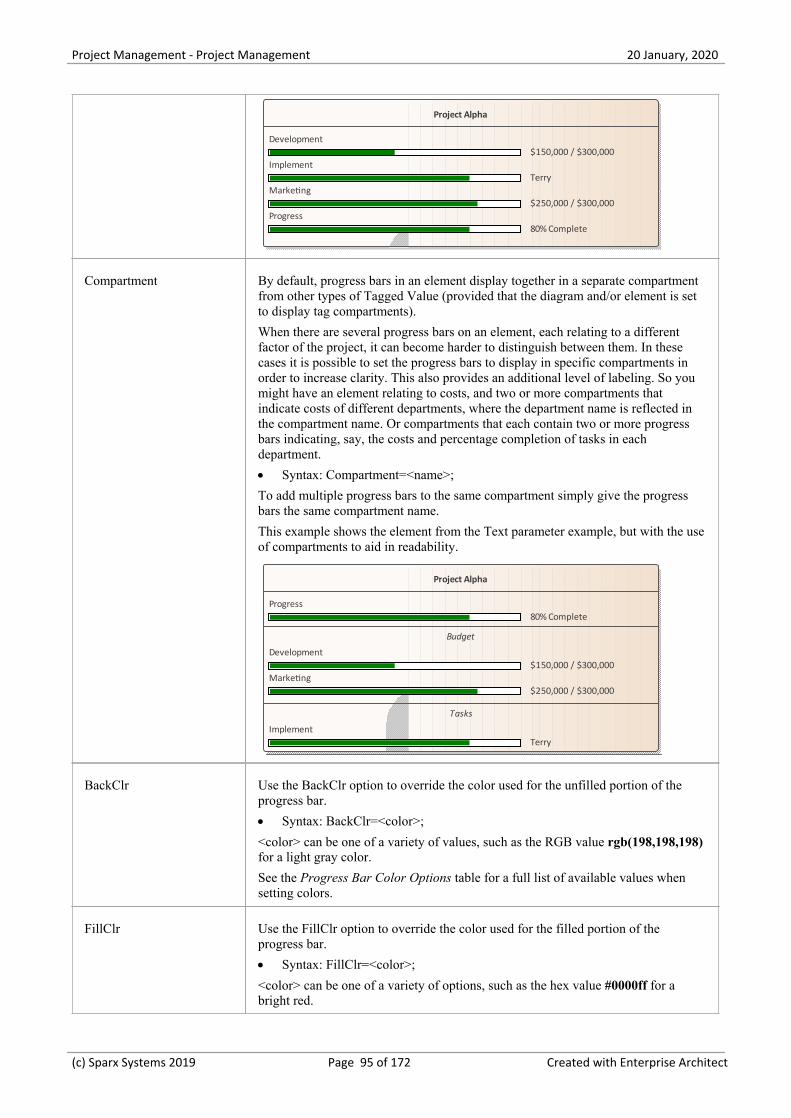
Project Management - Project Management 20 January, 2020
Project Alpha
Development$150,000 / $300,000
ImplementTerry
Marketing$250,000 / $300,000
Progress80% Complete
Compartment By default, progress bars in an element display together in a separate compartmentfrom other types of Tagged Value (provided that the diagram and/or element is setto display tag compartments).
When there are several progress bars on an element, each relating to a differentfactor of the project, it can become harder to distinguish between them. In thesecases it is possible to set the progress bars to display in specific compartments inorder to increase clarity. This also provides an additional level of labeling. So youmight have an element relating to costs, and two or more compartments thatindicate costs of different departments, where the department name is reflected inthe compartment name. Or compartments that each contain two or more progressbars indicating, say, the costs and percentage completion of tasks in eachdepartment.
Syntax: Compartment=<name>;·
To add multiple progress bars to the same compartment simply give the progressbars the same compartment name.
This example shows the element from the Text parameter example, but with the useof compartments to aid in readability.
Project Alpha
Progress80% Complete
Budget
Development$150,000 / $300,000
Marketing$250,000 / $300,000
Tasks
ImplementTerry
BackClr Use the BackClr option to override the color used for the unfilled portion of theprogress bar.
Syntax: BackClr=<color>;·
<color> can be one of a variety of values, such as the RGB value rgb(198,198,198)for a light gray color.
See the Progress Bar Color Options table for a full list of available values whensetting colors.
FillClr Use the FillClr option to override the color used for the filled portion of theprogress bar.
Syntax: FillClr=<color>;·
<color> can be one of a variety of options, such as the hex value #0000ff for abright red.
(c) Sparx Systems 2019 Page 95 of 172 Created with Enterprise Architect
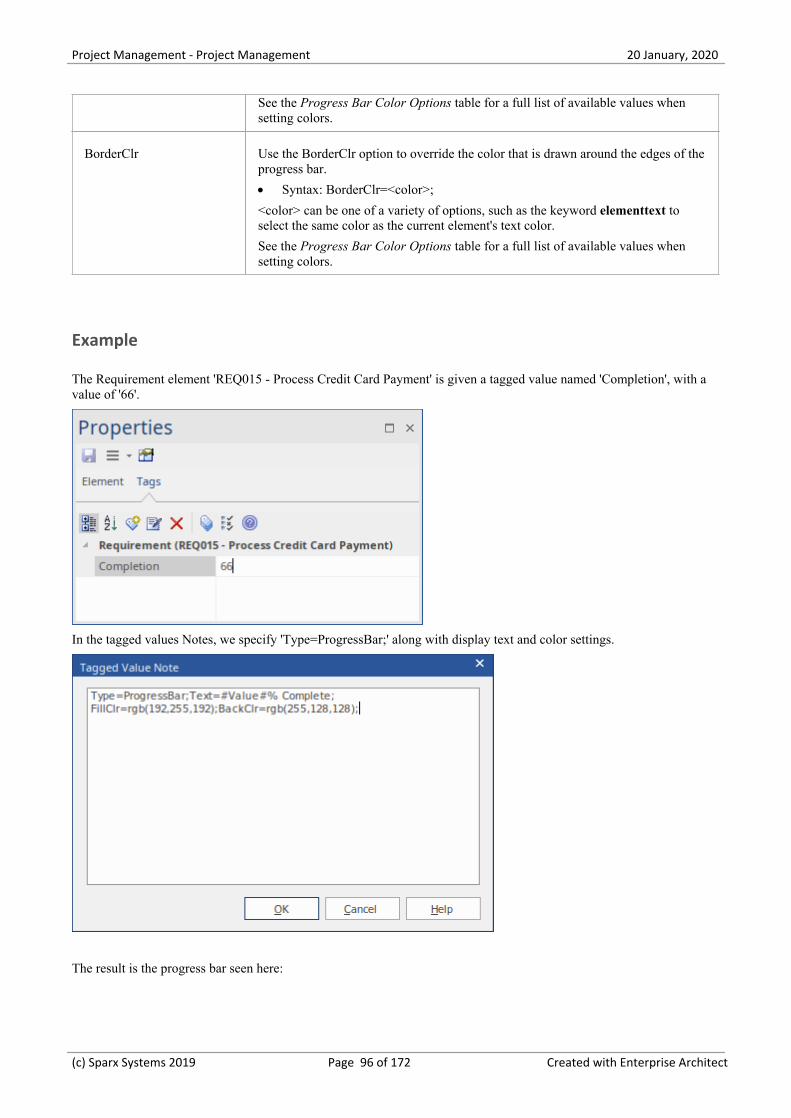
Project Management - Project Management 20 January, 2020
See the Progress Bar Color Options table for a full list of available values whensetting colors.
BorderClr Use the BorderClr option to override the color that is drawn around the edges of theprogress bar.
Syntax: BorderClr=<color>;·
<color> can be one of a variety of options, such as the keyword elementtext toselect the same color as the current element's text color.
See the Progress Bar Color Options table for a full list of available values whensetting colors.
Example
The Requirement element 'REQ015 - Process Credit Card Payment' is given a tagged value named 'Completion', with avalue of '66'.
In the tagged values Notes, we specify 'Type=ProgressBar;' along with display text and color settings.
The result is the progress bar seen here:
(c) Sparx Systems 2019 Page 96 of 172 Created with Enterprise Architect
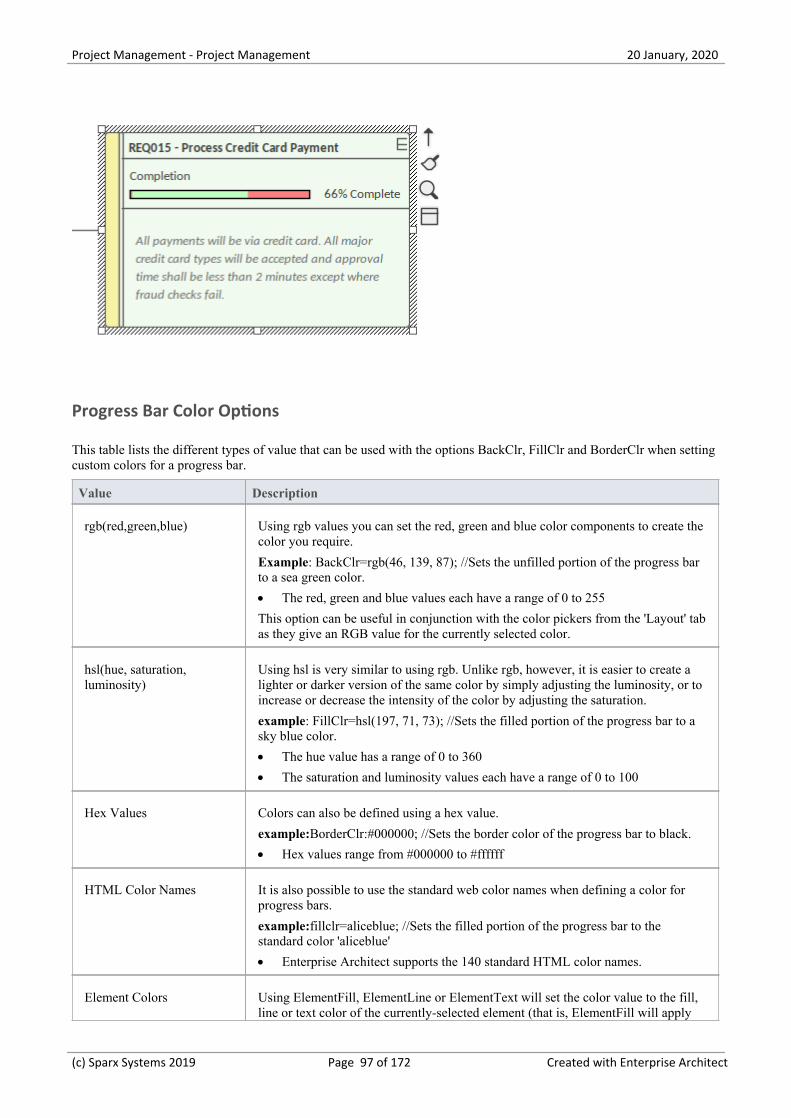
Project Management - Project Management 20 January, 2020
Progress Bar Color Options
This table lists the different types of value that can be used with the options BackClr, FillClr and BorderClr when settingcustom colors for a progress bar.
Value Description
rgb(red,green,blue) Using rgb values you can set the red, green and blue color components to create thecolor you require.
Example: BackClr=rgb(46, 139, 87); //Sets the unfilled portion of the progress barto a sea green color.
The red, green and blue values each have a range of 0 to 255·
This option can be useful in conjunction with the color pickers from the 'Layout' tabas they give an RGB value for the currently selected color.
hsl(hue, saturation,luminosity)
Using hsl is very similar to using rgb. Unlike rgb, however, it is easier to create alighter or darker version of the same color by simply adjusting the luminosity, or toincrease or decrease the intensity of the color by adjusting the saturation.
example: FillClr=hsl(197, 71, 73); //Sets the filled portion of the progress bar to asky blue color.
The hue value has a range of 0 to 360·
The saturation and luminosity values each have a range of 0 to 100·
Hex Values Colors can also be defined using a hex value.
example:BorderClr:#000000; //Sets the border color of the progress bar to black.
Hex values range from #000000 to #ffffff·
HTML Color Names It is also possible to use the standard web color names when defining a color forprogress bars.
example:fillclr=aliceblue; //Sets the filled portion of the progress bar to thestandard color 'aliceblue'
Enterprise Architect supports the 140 standard HTML color names.·
Element Colors Using ElementFill, ElementLine or ElementText will set the color value to the fill,line or text color of the currently-selected element (that is, ElementFill will apply
(c) Sparx Systems 2019 Page 97 of 172 Created with Enterprise Architect
Project Management - Project Management 20 January, 2020
the element's current fill color).
Colors set this way can be further refined by using the modifiers s:=<value> andl:=<value> to modify the color's saturation and luminosity, making the colorassigned to the progress bar a slightly altered version of the currently selectedelement color.
These settings can be useful if the element is expected to change color (such asfrom the use of a Diagram Legend) to keep the progress bars themed correctly withthe element.
example:backclr=elementfill:s=-10:l=20:; //Sets the unfilled portion of theprogress bar to be the same as the element's fill color but with a 10% decrease inthe color's saturation and a 20% increase in the luminosity.
s and l can be any value; however, the results can vary depending on the·currently selected color (for example, a luminosity increase of 20% might notbe as noticeable on a very light color compared to a darker color)
none The none keyword is used to indicate that no color should be applied to the selectedfield.
example:borderClr=none; //Removes the border from the progress bar.
Progress Bars with MDG Technologies
Progress bars can also be created within MDG Technologies to define a consistent set of progress bars for use withmultiple projects.
(c) Sparx Systems 2019 Page 98 of 172 Created with Enterprise Architect
Project Management - Project Management 20 January, 2020
Personal Tasks
Using the Personal Tasks view, you can record and manage your personal work within the project. This view displaysinformation based upon your identity as a defined Author on the project.
Access
Ribbon Start > Collaborate > My Gantt
Work Category
Category Detail
Allocated Work Presents a Gantt chart on which you record the work that you are currently engagedin.
Project Tasks Enables you to monitor and maintain the work tasks that have been assigned to you,or that you have created yourself.
(c) Sparx Systems 2019 Page 99 of 172 Created with Enterprise Architect
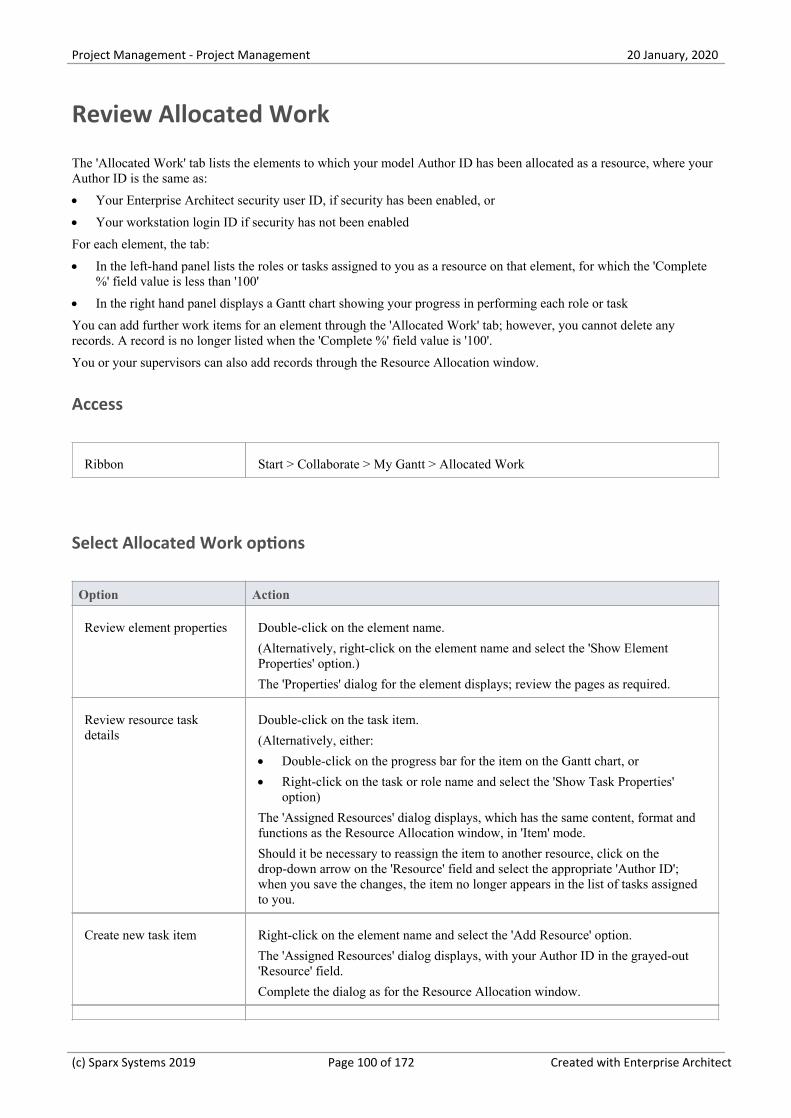
Project Management - Project Management 20 January, 2020
Review Allocated Work
The 'Allocated Work' tab lists the elements to which your model Author ID has been allocated as a resource, where yourAuthor ID is the same as:
Your Enterprise Architect security user ID, if security has been enabled, or·
Your workstation login ID if security has not been enabled·
For each element, the tab:
In the left-hand panel lists the roles or tasks assigned to you as a resource on that element, for which the 'Complete·%' field value is less than '100'
In the right hand panel displays a Gantt chart showing your progress in performing each role or task·
You can add further work items for an element through the 'Allocated Work' tab; however, you cannot delete anyrecords. A record is no longer listed when the 'Complete %' field value is '100'.
You or your supervisors can also add records through the Resource Allocation window.
Access
Ribbon Start > Collaborate > My Gantt > Allocated Work
Select Allocated Work options
Option Action
Review element properties Double-click on the element name.
(Alternatively, right-click on the element name and select the 'Show ElementProperties' option.)
The 'Properties' dialog for the element displays; review the pages as required.
Review resource taskdetails
Double-click on the task item.
(Alternatively, either:
Double-click on the progress bar for the item on the Gantt chart, or·
Right-click on the task or role name and select the 'Show Task Properties'·option)
The 'Assigned Resources' dialog displays, which has the same content, format andfunctions as the Resource Allocation window, in 'Item' mode.
Should it be necessary to reassign the item to another resource, click on thedrop-down arrow on the 'Resource' field and select the appropriate 'Author ID';when you save the changes, the item no longer appears in the list of tasks assignedto you.
Create new task item Right-click on the element name and select the 'Add Resource' option.
The 'Assigned Resources' dialog displays, with your Author ID in the grayed-out'Resource' field.
Complete the dialog as for the Resource Allocation window.
(c) Sparx Systems 2019 Page 100 of 172 Created with Enterprise Architect
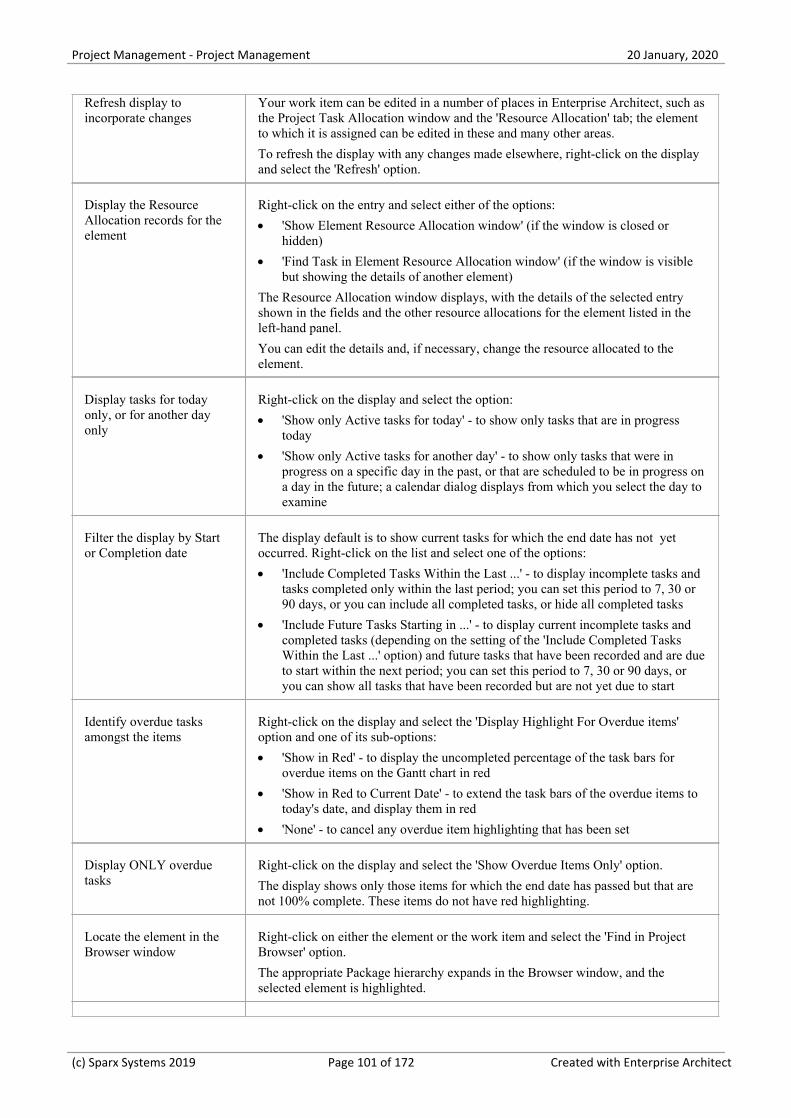
Project Management - Project Management 20 January, 2020
Refresh display toincorporate changes
Your work item can be edited in a number of places in Enterprise Architect, such asthe Project Task Allocation window and the 'Resource Allocation' tab; the elementto which it is assigned can be edited in these and many other areas.
To refresh the display with any changes made elsewhere, right-click on the displayand select the 'Refresh' option.
Display the ResourceAllocation records for theelement
Right-click on the entry and select either of the options:
'Show Element Resource Allocation window' (if the window is closed or·hidden)
'Find Task in Element Resource Allocation window' (if the window is visible·but showing the details of another element)
The Resource Allocation window displays, with the details of the selected entryshown in the fields and the other resource allocations for the element listed in theleft-hand panel.
You can edit the details and, if necessary, change the resource allocated to theelement.
Display tasks for todayonly, or for another dayonly
Right-click on the display and select the option:
'Show only Active tasks for today' - to show only tasks that are in progress·today
'Show only Active tasks for another day' - to show only tasks that were in·progress on a specific day in the past, or that are scheduled to be in progress ona day in the future; a calendar dialog displays from which you select the day toexamine
Filter the display by Startor Completion date
The display default is to show current tasks for which the end date has not yetoccurred. Right-click on the list and select one of the options:
'Include Completed Tasks Within the Last ...' - to display incomplete tasks and·tasks completed only within the last period; you can set this period to 7, 30 or90 days, or you can include all completed tasks, or hide all completed tasks
'Include Future Tasks Starting in ...' - to display current incomplete tasks and·completed tasks (depending on the setting of the 'Include Completed TasksWithin the Last ...' option) and future tasks that have been recorded and are dueto start within the next period; you can set this period to 7, 30 or 90 days, oryou can show all tasks that have been recorded but are not yet due to start
Identify overdue tasksamongst the items
Right-click on the display and select the 'Display Highlight For Overdue items'option and one of its sub-options:
'Show in Red' - to display the uncompleted percentage of the task bars for·overdue items on the Gantt chart in red
'Show in Red to Current Date' - to extend the task bars of the overdue items to·today's date, and display them in red
'None' - to cancel any overdue item highlighting that has been set·
Display ONLY overduetasks
Right-click on the display and select the 'Show Overdue Items Only' option.
The display shows only those items for which the end date has passed but that arenot 100% complete. These items do not have red highlighting.
Locate the element in theBrowser window
Right-click on either the element or the work item and select the 'Find in ProjectBrowser' option.
The appropriate Package hierarchy expands in the Browser window, and theselected element is highlighted.
(c) Sparx Systems 2019 Page 101 of 172 Created with Enterprise Architect

Project Management - Project Management 20 January, 2020
Reposition the Gantt chartto automatically show theend date of a selectedallocation
Right-click on the display and select the 'Go to | Auto Sync with Task End Date'option.
Whilst this option is selected (with a tick next to it), whenever you click on anallocation in the 'Allocated Work' tab the display adjusts to show the end date of thetask in the center of the chart.
Expose hidden sections ofthe work item progress
Some items might operate over a long period of time, and you might not be able todisplay the complete progress line for the item in the Gantt chart.
To locate the start point, expected end point, or today's date on the progress line foran item, right-click on either the item or the progress line and select the appropriateoption:
Go To | Task Start Date·
Go To | Task End Date·
Go To | Today's Date·
The Gantt chart shifts left or right to position the required point in the center of thedisplay.
Execute Scripts If scripts have been defined for analyzing the task data, click on the 'Scripts' optionto display the list of script names. Click on the appropriate name to execute thescript on the selected item or items.
Filter the work items You can refine the list of work items to show only those containing text thatmatches the filter item.
Right-click on the tab and select the 'Show Filter Bar' option.
The filter bar displays at the top of the panel; type in the filter text.
As you type, the items listed and the Gantt chart are filtered to show only itemswhere the item names match the text string.
The filter does not operate on the element names.
If you do not want to use the filter, right-click on the tab and select the 'Hide FilterBar' option.
Capture an image of theAllocated Work data as agraphics file
Right-click on the tab and select the 'Save Image to File' option.
The 'Save As Image' dialog displays, on which you specify the file name, locationand graphics file type to save to.
Copy an image of theAllocated Work data to theclipboard
Right-click on the tab and select the 'Copy Image to Clipboard' option.
You can paste the image from the clipboard into your preferred graphics package.
(c) Sparx Systems 2019 Page 102 of 172 Created with Enterprise Architect
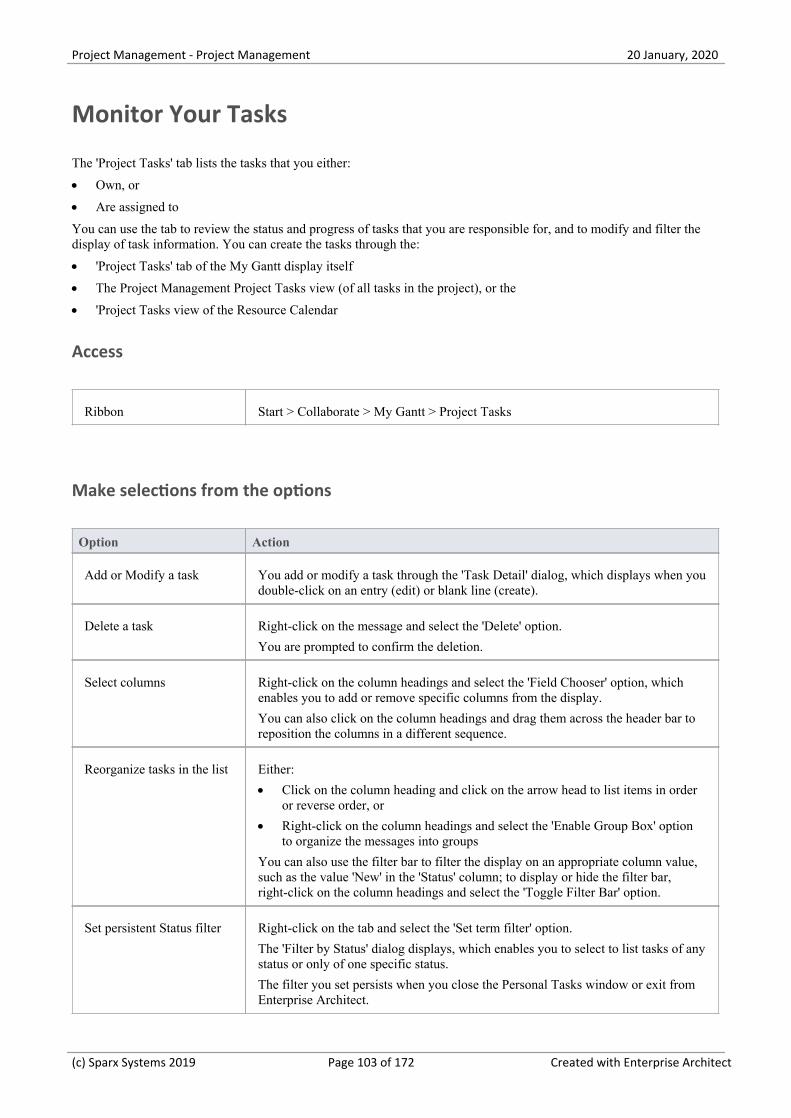
Project Management - Project Management 20 January, 2020
Monitor Your Tasks
The 'Project Tasks' tab lists the tasks that you either:
Own, or·
Are assigned to·
You can use the tab to review the status and progress of tasks that you are responsible for, and to modify and filter thedisplay of task information. You can create the tasks through the:
'Project Tasks' tab of the My Gantt display itself·
The Project Management Project Tasks view (of all tasks in the project), or the·
'Project Tasks view of the Resource Calendar·
Access
Ribbon Start > Collaborate > My Gantt > Project Tasks
Make selections from the options
Option Action
Add or Modify a task You add or modify a task through the 'Task Detail' dialog, which displays when youdouble-click on an entry (edit) or blank line (create).
Delete a task Right-click on the message and select the 'Delete' option.
You are prompted to confirm the deletion.
Select columns Right-click on the column headings and select the 'Field Chooser' option, whichenables you to add or remove specific columns from the display.
You can also click on the column headings and drag them across the header bar toreposition the columns in a different sequence.
Reorganize tasks in the list Either:
Click on the column heading and click on the arrow head to list items in order·or reverse order, or
Right-click on the column headings and select the 'Enable Group Box' option·to organize the messages into groups
You can also use the filter bar to filter the display on an appropriate column value,such as the value 'New' in the 'Status' column; to display or hide the filter bar,right-click on the column headings and select the 'Toggle Filter Bar' option.
Set persistent Status filter Right-click on the tab and select the 'Set term filter' option.
The 'Filter by Status' dialog displays, which enables you to select to list tasks of anystatus or only of one specific status.
The filter you set persists when you close the Personal Tasks window or exit fromEnterprise Architect.
(c) Sparx Systems 2019 Page 103 of 172 Created with Enterprise Architect
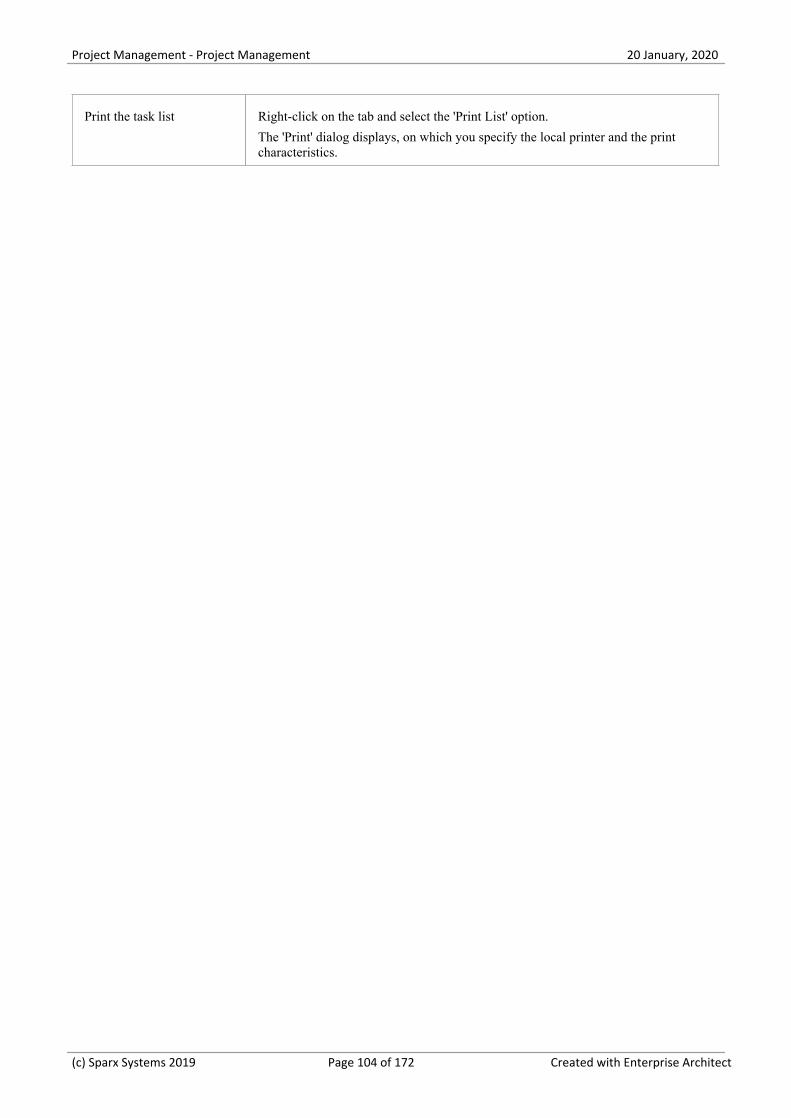
Project Management - Project Management 20 January, 2020
Print the task list Right-click on the tab and select the 'Print List' option.
The 'Print' dialog displays, on which you specify the local printer and the printcharacteristics.
(c) Sparx Systems 2019 Page 104 of 172 Created with Enterprise Architect
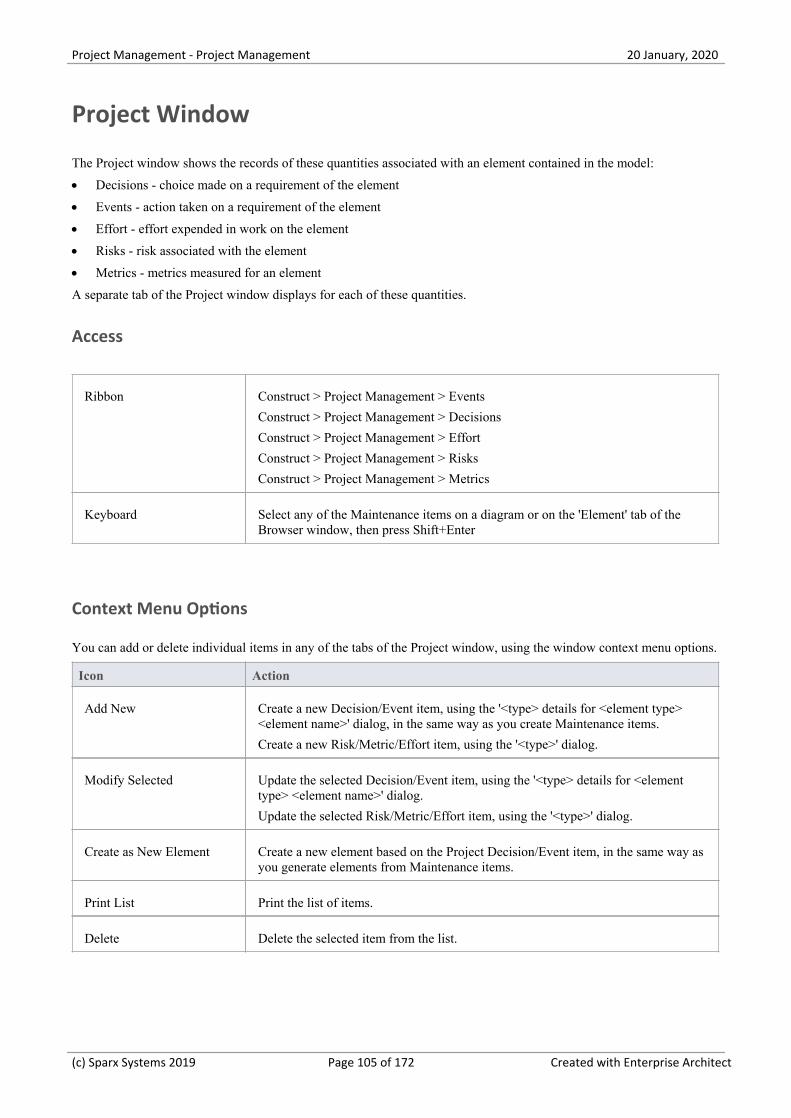
Project Management - Project Management 20 January, 2020
Project Window
The Project window shows the records of these quantities associated with an element contained in the model:
Decisions - choice made on a requirement of the element·
Events - action taken on a requirement of the element·
Effort - effort expended in work on the element·
Risks - risk associated with the element·
Metrics - metrics measured for an element·
A separate tab of the Project window displays for each of these quantities.
Access
Ribbon Construct > Project Management > Events
Construct > Project Management > Decisions
Construct > Project Management > Effort
Construct > Project Management > Risks
Construct > Project Management > Metrics
Keyboard Select any of the Maintenance items on a diagram or on the 'Element' tab of theBrowser window, then press Shift+Enter
Context Menu Options
You can add or delete individual items in any of the tabs of the Project window, using the window context menu options.
Icon Action
Add New Create a new Decision/Event item, using the '<type> details for <element type><element name>' dialog, in the same way as you create Maintenance items.
Create a new Risk/Metric/Effort item, using the '<type>' dialog.
Modify Selected Update the selected Decision/Event item, using the '<type> details for <elementtype> <element name>' dialog.
Update the selected Risk/Metric/Effort item, using the '<type>' dialog.
Create as New Element Create a new element based on the Project Decision/Event item, in the same way asyou generate elements from Maintenance items.
Print List Print the list of items.
Delete Delete the selected item from the list.
(c) Sparx Systems 2019 Page 105 of 172 Created with Enterprise Architect
Project Management - Project Management 20 January, 2020
Notes
Click on an element in the Browser window to switch to the project management items for that element in the·Project window
Columns in the item list can be reorganized, added, removed, grouped, filtered and sorted using the options provided·in the List Header facilities
Right-click on the list to view the context menu, which you can use to also add and delete items in the window·
(c) Sparx Systems 2019 Page 106 of 172 Created with Enterprise Architect
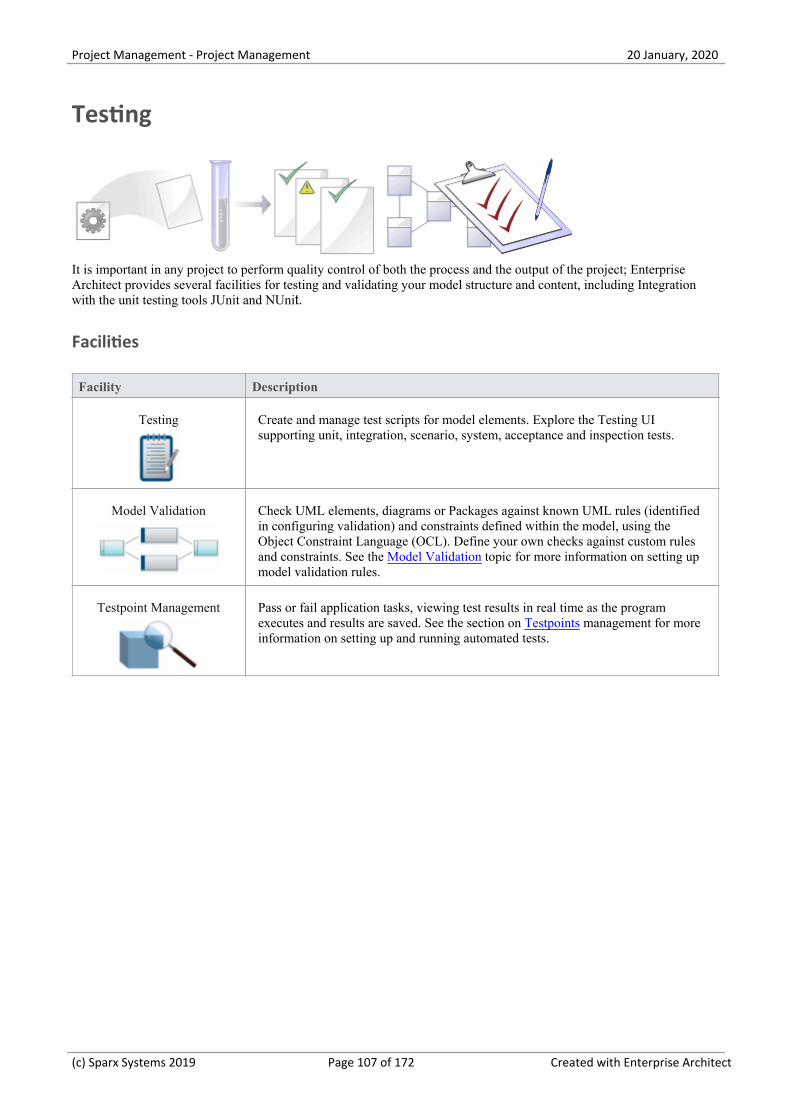
Project Management - Project Management 20 January, 2020
Testing
It is important in any project to perform quality control of both the process and the output of the project; EnterpriseArchitect provides several facilities for testing and validating your model structure and content, including Integrationwith the unit testing tools JUnit and NUnit.
Facilities
Facility Description
Testing Create and manage test scripts for model elements. Explore the Testing UIsupporting unit, integration, scenario, system, acceptance and inspection tests.
Model Validation Check UML elements, diagrams or Packages against known UML rules (identifiedin configuring validation) and constraints defined within the model, using theObject Constraint Language (OCL). Define your own checks against custom rulesand constraints. See the Model Validation topic for more information on setting upmodel validation rules.
Testpoint Management Pass or fail application tasks, viewing test results in real time as the programexecutes and results are saved. See the section on Testpoints management for moreinformation on setting up and running automated tests.
(c) Sparx Systems 2019 Page 107 of 172 Created with Enterprise Architect
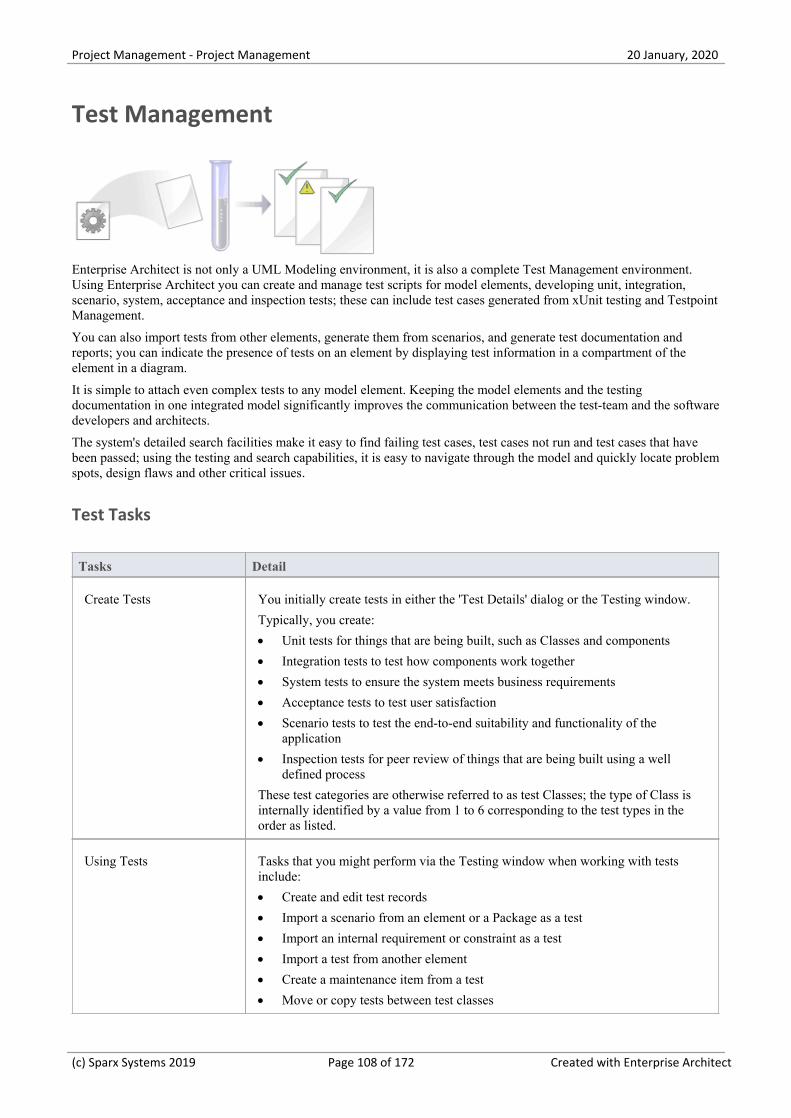
Project Management - Project Management 20 January, 2020
Test Management
Enterprise Architect is not only a UML Modeling environment, it is also a complete Test Management environment.Using Enterprise Architect you can create and manage test scripts for model elements, developing unit, integration,scenario, system, acceptance and inspection tests; these can include test cases generated from xUnit testing and TestpointManagement.
You can also import tests from other elements, generate them from scenarios, and generate test documentation andreports; you can indicate the presence of tests on an element by displaying test information in a compartment of theelement in a diagram.
It is simple to attach even complex tests to any model element. Keeping the model elements and the testingdocumentation in one integrated model significantly improves the communication between the test-team and the softwaredevelopers and architects.
The system's detailed search facilities make it easy to find failing test cases, test cases not run and test cases that havebeen passed; using the testing and search capabilities, it is easy to navigate through the model and quickly locate problemspots, design flaws and other critical issues.
Test Tasks
Tasks Detail
Create Tests You initially create tests in either the 'Test Details' dialog or the Testing window.
Typically, you create:
Unit tests for things that are being built, such as Classes and components·
Integration tests to test how components work together·
System tests to ensure the system meets business requirements·
Acceptance tests to test user satisfaction·
Scenario tests to test the end-to-end suitability and functionality of the·application
Inspection tests for peer review of things that are being built using a well·defined process
These test categories are otherwise referred to as test Classes; the type of Class isinternally identified by a value from 1 to 6 corresponding to the test types in theorder as listed.
Using Tests Tasks that you might perform via the Testing window when working with testsinclude:
Create and edit test records·
Import a scenario from an element or a Package as a test·
Import an internal requirement or constraint as a test·
Import a test from another element·
Create a maintenance item from a test·
Move or copy tests between test classes·
(c) Sparx Systems 2019 Page 108 of 172 Created with Enterprise Architect

Project Management - Project Management 20 January, 2020
Print the list of tests of the current test class for the element·
Delete the test·
Notes
Most of the listed tasks relate to a tests for a single element·
You can display the Testing window for an element on a diagram, by clicking on the element and pressing the T key·
You can make a set of tests available to a number of elements by performing the listed tasks on a Test Case element·and then associating that Test Case with each of the other elements; the Test Case element also helps to make testsmore visible in diagrams, the Browser window, windows and searches
(c) Sparx Systems 2019 Page 109 of 172 Created with Enterprise Architect
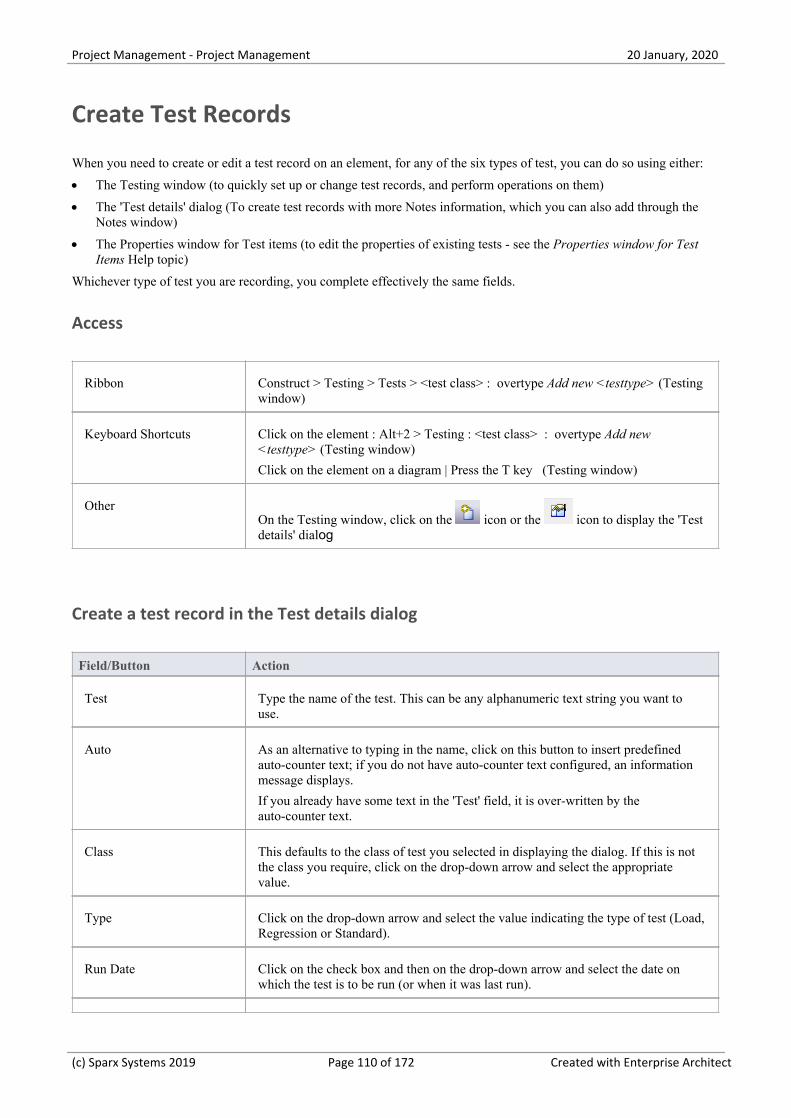
Project Management - Project Management 20 January, 2020
Create Test Records
When you need to create or edit a test record on an element, for any of the six types of test, you can do so using either:
The Testing window (to quickly set up or change test records, and perform operations on them)·
The 'Test details' dialog (To create test records with more Notes information, which you can also add through the·Notes window)
The Properties window for Test items (to edit the properties of existing tests - see the Properties window for Test·Items Help topic)
Whichever type of test you are recording, you complete effectively the same fields.
Access
Ribbon Construct > Testing > Tests > <test class> : overtype Add new <testtype> (Testingwindow)
Keyboard Shortcuts Click on the element : Alt+2 > Testing : <test class> : overtype Add new<testtype> (Testing window)
Click on the element on a diagram | Press the T key (Testing window)
OtherOn the Testing window, click on the icon or the icon to display the 'Testdetails' dialog
Create a test record in the Test details dialog
Field/Button Action
Test Type the name of the test. This can be any alphanumeric text string you want touse.
Auto As an alternative to typing in the name, click on this button to insert predefinedauto-counter text; if you do not have auto-counter text configured, an informationmessage displays.
If you already have some text in the 'Test' field, it is over-written by theauto-counter text.
Class This defaults to the class of test you selected in displaying the dialog. If this is notthe class you require, click on the drop-down arrow and select the appropriatevalue.
Type Click on the drop-down arrow and select the value indicating the type of test (Load,Regression or Standard).
Run Date Click on the check box and then on the drop-down arrow and select the date onwhich the test is to be run (or when it was last run).
(c) Sparx Systems 2019 Page 110 of 172 Created with Enterprise Architect
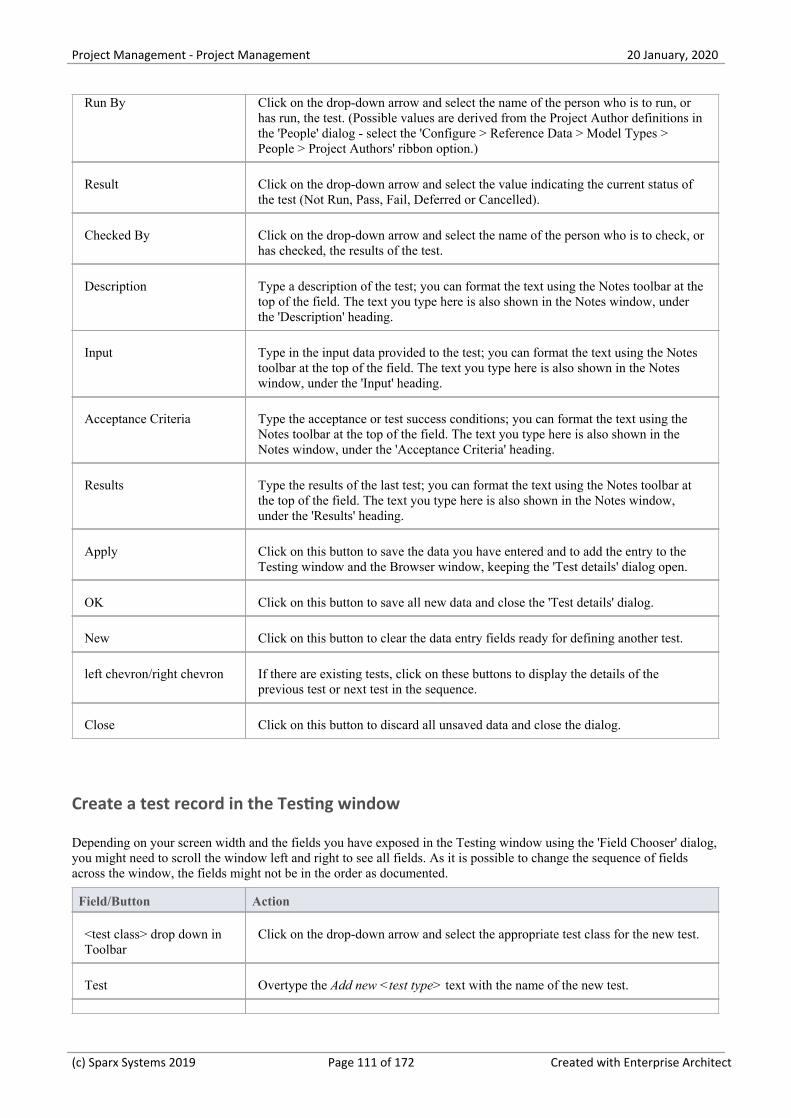
Project Management - Project Management 20 January, 2020
Run By Click on the drop-down arrow and select the name of the person who is to run, orhas run, the test. (Possible values are derived from the Project Author definitions inthe 'People' dialog - select the 'Configure > Reference Data > Model Types >People > Project Authors' ribbon option.)
Result Click on the drop-down arrow and select the value indicating the current status ofthe test (Not Run, Pass, Fail, Deferred or Cancelled).
Checked By Click on the drop-down arrow and select the name of the person who is to check, orhas checked, the results of the test.
Description Type a description of the test; you can format the text using the Notes toolbar at thetop of the field. The text you type here is also shown in the Notes window, underthe 'Description' heading.
Input Type in the input data provided to the test; you can format the text using the Notestoolbar at the top of the field. The text you type here is also shown in the Noteswindow, under the 'Input' heading.
Acceptance Criteria Type the acceptance or test success conditions; you can format the text using theNotes toolbar at the top of the field. The text you type here is also shown in theNotes window, under the 'Acceptance Criteria' heading.
Results Type the results of the last test; you can format the text using the Notes toolbar atthe top of the field. The text you type here is also shown in the Notes window,under the 'Results' heading.
Apply Click on this button to save the data you have entered and to add the entry to theTesting window and the Browser window, keeping the 'Test details' dialog open.
OK Click on this button to save all new data and close the 'Test details' dialog.
New Click on this button to clear the data entry fields ready for defining another test.
left chevron/right chevron If there are existing tests, click on these buttons to display the details of theprevious test or next test in the sequence.
Close Click on this button to discard all unsaved data and close the dialog.
Create a test record in the Testing window
Depending on your screen width and the fields you have exposed in the Testing window using the 'Field Chooser' dialog,you might need to scroll the window left and right to see all fields. As it is possible to change the sequence of fieldsacross the window, the fields might not be in the order as documented.
Field/Button Action
<test class> drop down inToolbar
Click on the drop-down arrow and select the appropriate test class for the new test.
Test Overtype the Add new <test type> text with the name of the new test.
(c) Sparx Systems 2019 Page 111 of 172 Created with Enterprise Architect
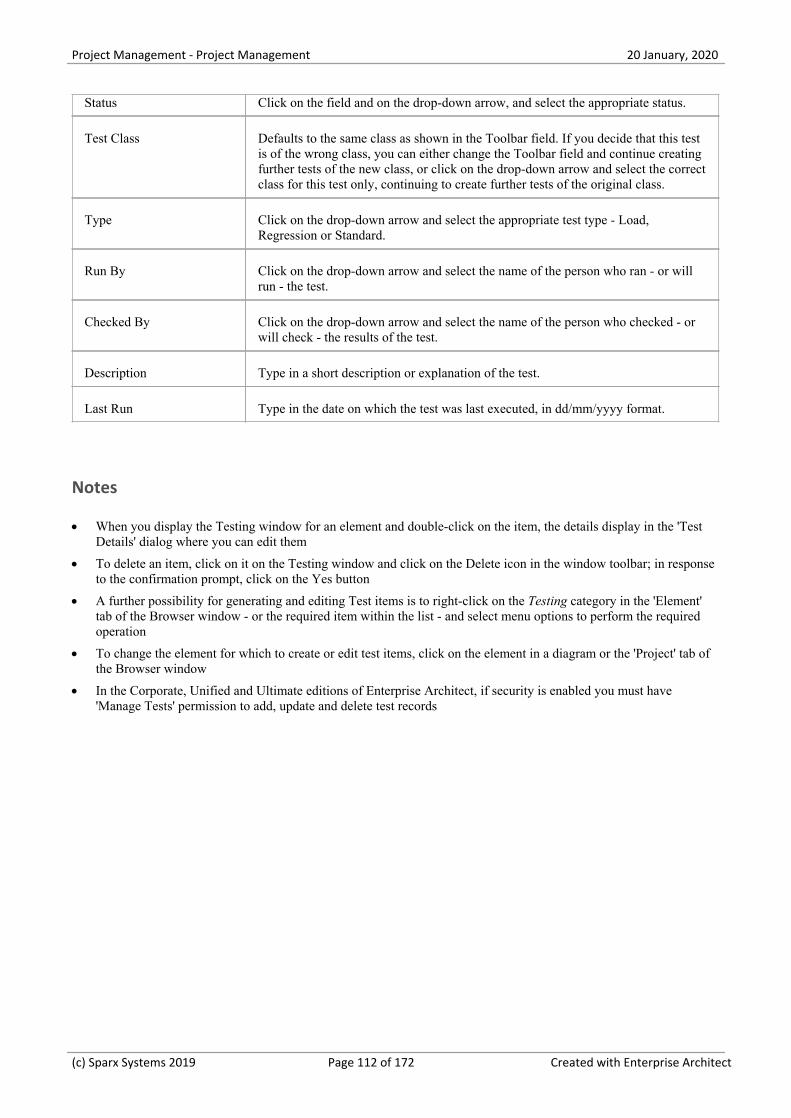
Project Management - Project Management 20 January, 2020
Status Click on the field and on the drop-down arrow, and select the appropriate status.
Test Class Defaults to the same class as shown in the Toolbar field. If you decide that this testis of the wrong class, you can either change the Toolbar field and continue creatingfurther tests of the new class, or click on the drop-down arrow and select the correctclass for this test only, continuing to create further tests of the original class.
Type Click on the drop-down arrow and select the appropriate test type - Load,Regression or Standard.
Run By Click on the drop-down arrow and select the name of the person who ran - or willrun - the test.
Checked By Click on the drop-down arrow and select the name of the person who checked - orwill check - the results of the test.
Description Type in a short description or explanation of the test.
Last Run Type in the date on which the test was last executed, in dd/mm/yyyy format.
Notes
When you display the Testing window for an element and double-click on the item, the details display in the 'Test·Details' dialog where you can edit them
To delete an item, click on it on the Testing window and click on the Delete icon in the window toolbar; in response·to the confirmation prompt, click on the Yes button
A further possibility for generating and editing Test items is to right-click on the Testing category in the 'Element'·tab of the Browser window - or the required item within the list - and select menu options to perform the requiredoperation
To change the element for which to create or edit test items, click on the element in a diagram or the 'Project' tab of·the Browser window
In the Corporate, Unified and Ultimate editions of Enterprise Architect, if security is enabled you must have·'Manage Tests' permission to add, update and delete test records
(c) Sparx Systems 2019 Page 112 of 172 Created with Enterprise Architect
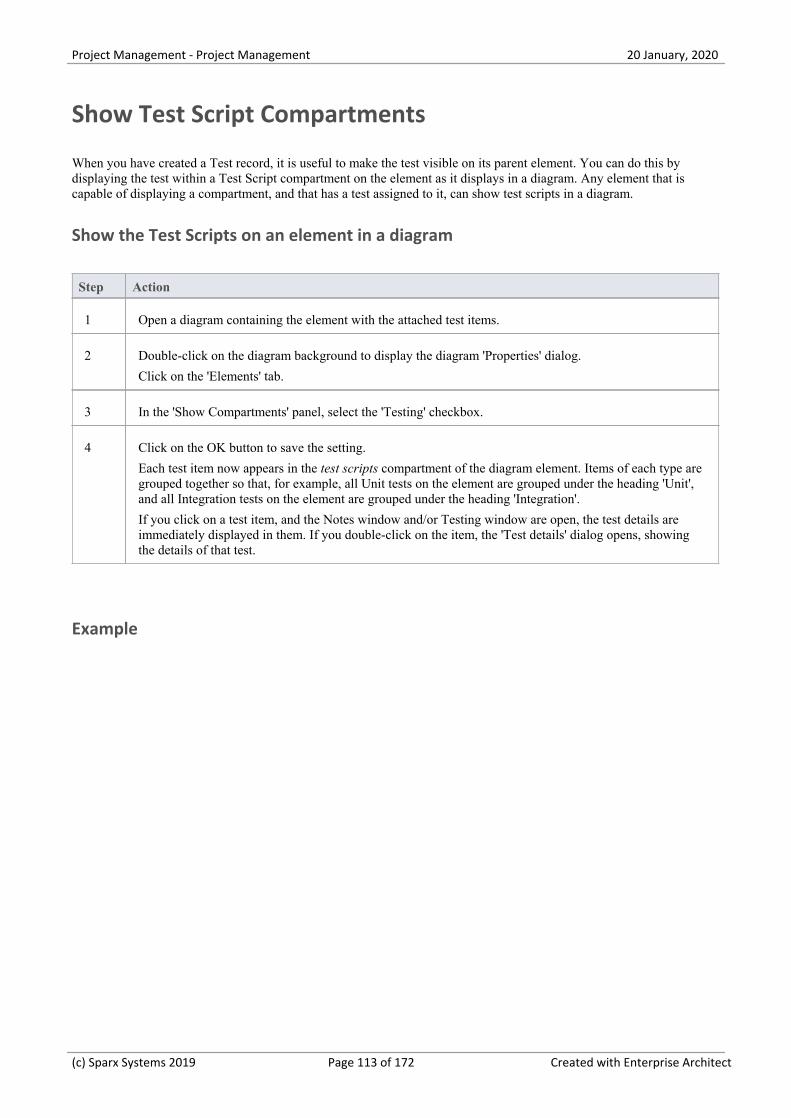
Project Management - Project Management 20 January, 2020
Show Test Script Compartments
When you have created a Test record, it is useful to make the test visible on its parent element. You can do this bydisplaying the test within a Test Script compartment on the element as it displays in a diagram. Any element that iscapable of displaying a compartment, and that has a test assigned to it, can show test scripts in a diagram.
Show the Test Scripts on an element in a diagram
Step Action
1 Open a diagram containing the element with the attached test items.
2 Double-click on the diagram background to display the diagram 'Properties' dialog.
Click on the 'Elements' tab.
3 In the 'Show Compartments' panel, select the 'Testing' checkbox.
4 Click on the OK button to save the setting.
Each test item now appears in the test scripts compartment of the diagram element. Items of each type aregrouped together so that, for example, all Unit tests on the element are grouped under the heading 'Unit',and all Integration tests on the element are grouped under the heading 'Integration'.
If you click on a test item, and the Notes window and/or Testing window are open, the test details areimmediately displayed in them. If you double-click on the item, the 'Test details' dialog opens, showingthe details of that test.
Example
(c) Sparx Systems 2019 Page 113 of 172 Created with Enterprise Architect

Project Management - Project Management 20 January, 2020
(c) Sparx Systems 2019 Page 114 of 172 Created with Enterprise Architect
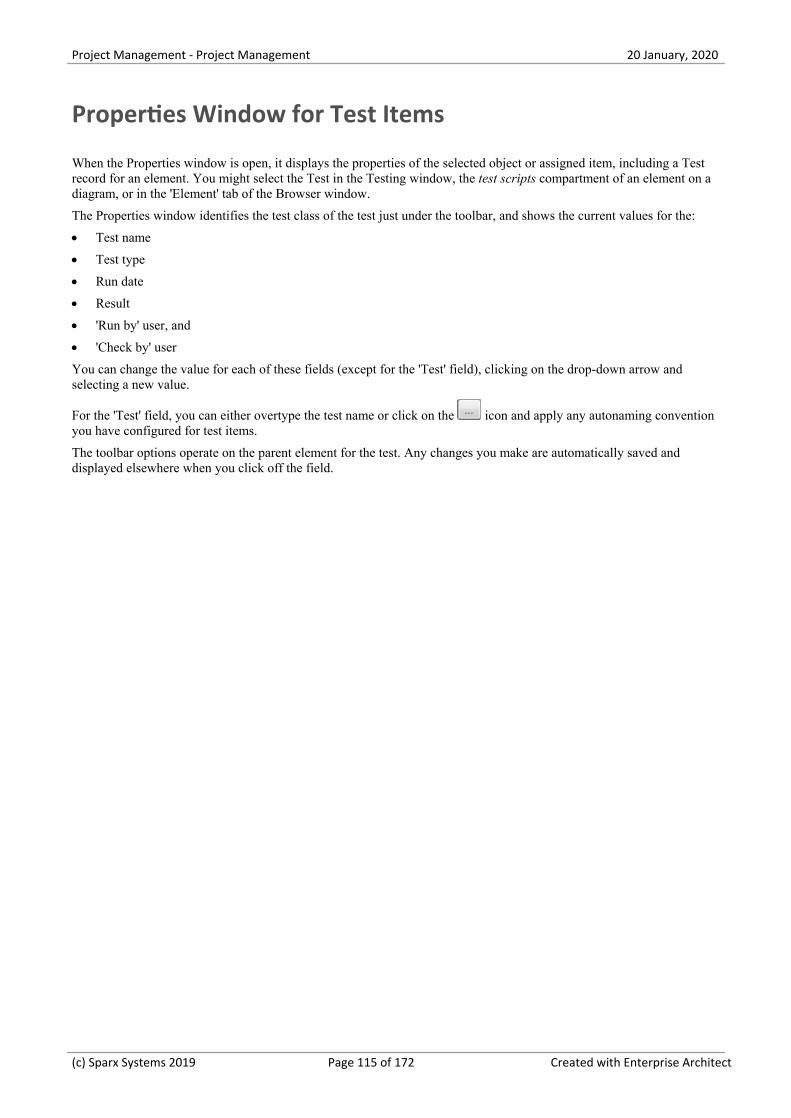
Project Management - Project Management 20 January, 2020
Properties Window for Test Items
When the Properties window is open, it displays the properties of the selected object or assigned item, including a Testrecord for an element. You might select the Test in the Testing window, the test scripts compartment of an element on adiagram, or in the 'Element' tab of the Browser window.
The Properties window identifies the test class of the test just under the toolbar, and shows the current values for the:
Test name·
Test type·
Run date·
Result·
'Run by' user, and·
'Check by' user·
You can change the value for each of these fields (except for the 'Test' field), clicking on the drop-down arrow andselecting a new value.
For the 'Test' field, you can either overtype the test name or click on the icon and apply any autonaming conventionyou have configured for test items.
The toolbar options operate on the parent element for the test. Any changes you make are automatically saved anddisplayed elsewhere when you click off the field.
(c) Sparx Systems 2019 Page 115 of 172 Created with Enterprise Architect
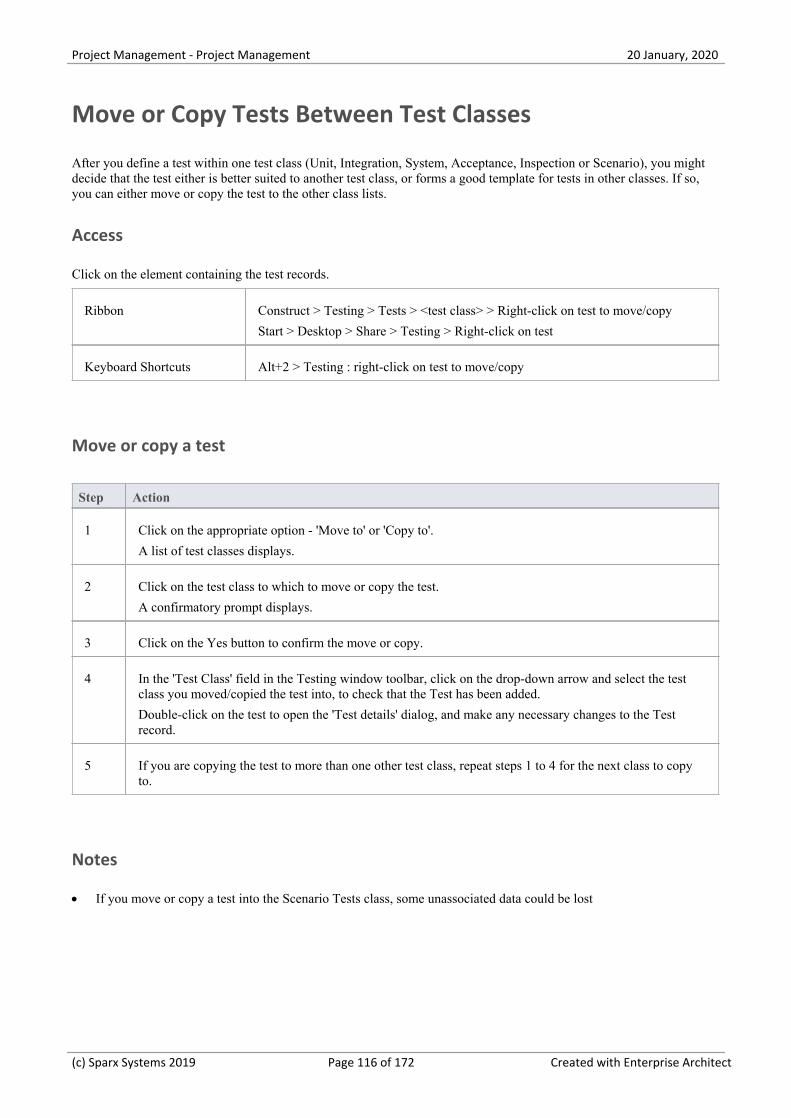
Project Management - Project Management 20 January, 2020
Move or Copy Tests Between Test Classes
After you define a test within one test class (Unit, Integration, System, Acceptance, Inspection or Scenario), you mightdecide that the test either is better suited to another test class, or forms a good template for tests in other classes. If so,you can either move or copy the test to the other class lists.
Access
Click on the element containing the test records.
Ribbon Construct > Testing > Tests > <test class> > Right-click on test to move/copy
Start > Desktop > Share > Testing > Right-click on test
Keyboard Shortcuts Alt+2 > Testing : right-click on test to move/copy
Move or copy a test
Step Action
1 Click on the appropriate option - 'Move to' or 'Copy to'.
A list of test classes displays.
2 Click on the test class to which to move or copy the test.
A confirmatory prompt displays.
3 Click on the Yes button to confirm the move or copy.
4 In the 'Test Class' field in the Testing window toolbar, click on the drop-down arrow and select the testclass you moved/copied the test into, to check that the Test has been added.
Double-click on the test to open the 'Test details' dialog, and make any necessary changes to the Testrecord.
5 If you are copying the test to more than one other test class, repeat steps 1 to 4 for the next class to copyto.
Notes
If you move or copy a test into the Scenario Tests class, some unassociated data could be lost·
(c) Sparx Systems 2019 Page 116 of 172 Created with Enterprise Architect
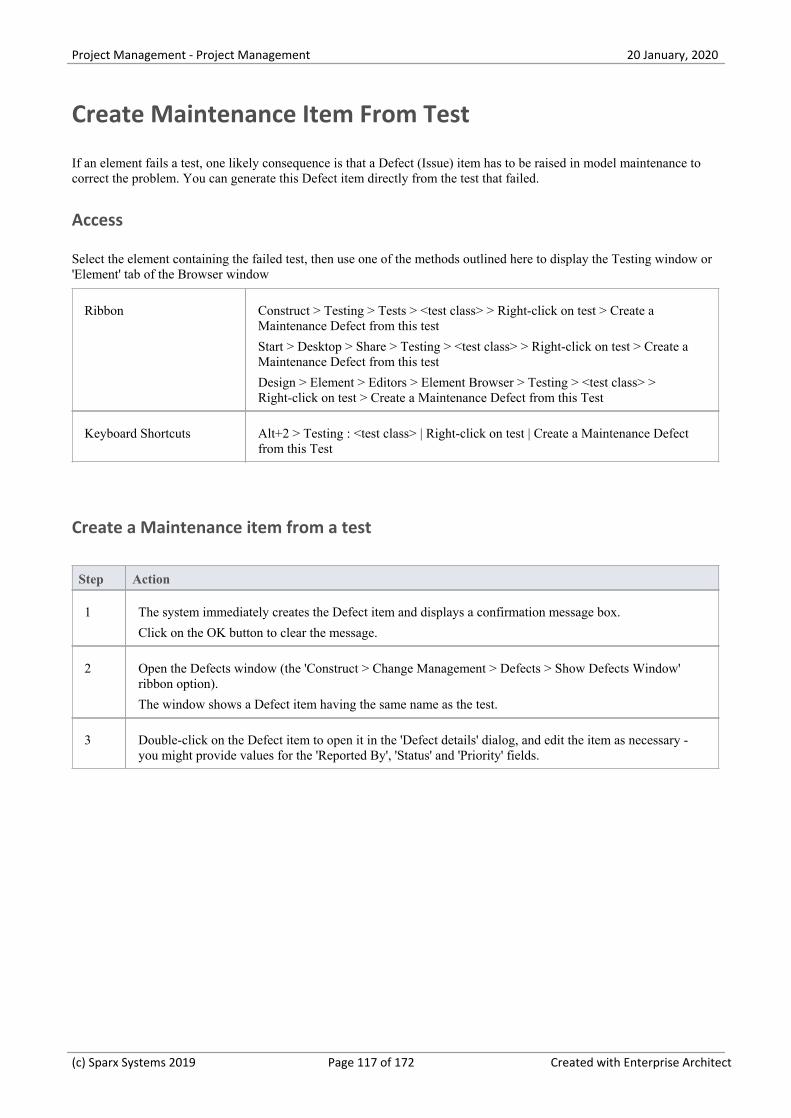
Project Management - Project Management 20 January, 2020
Create Maintenance Item From Test
If an element fails a test, one likely consequence is that a Defect (Issue) item has to be raised in model maintenance tocorrect the problem. You can generate this Defect item directly from the test that failed.
Access
Select the element containing the failed test, then use one of the methods outlined here to display the Testing window or'Element' tab of the Browser window
Ribbon Construct > Testing > Tests > <test class> > Right-click on test > Create aMaintenance Defect from this test
Start > Desktop > Share > Testing > <test class> > Right-click on test > Create aMaintenance Defect from this test
Design > Element > Editors > Element Browser > Testing > <test class> >Right-click on test > Create a Maintenance Defect from this Test
Keyboard Shortcuts Alt+2 > Testing : <test class> | Right-click on test | Create a Maintenance Defectfrom this Test
Create a Maintenance item from a test
Step Action
1 The system immediately creates the Defect item and displays a confirmation message box.
Click on the OK button to clear the message.
2 Open the Defects window (the 'Construct > Change Management > Defects > Show Defects Window'ribbon option).
The window shows a Defect item having the same name as the test.
3 Double-click on the Defect item to open it in the 'Defect details' dialog, and edit the item as necessary -you might provide values for the 'Reported By', 'Status' and 'Priority' fields.
(c) Sparx Systems 2019 Page 117 of 172 Created with Enterprise Architect

Project Management - Project Management 20 January, 2020
Import Scenario as Test
If you are creating a test for a scenario from either a single element or many elements in a Package, you do not have tomanually re-type the scenario details into the test record. You can generate the test into the 'Scenario Tests' class of oneelement from one or more scenarios in any element in the model.
Within the Scenario Test record, the scenario description is copied to the 'Description' tab. If a scenario contains aspecification, its Action steps are also copied to the 'Description' tab under the heading 'Structured Specification'.
Access
Click on the element containing the test records, and use one of the methods identified here to display the 'ImportScenario' dialog.
Ribbon Construct > Testing > Tests > <test class> > right-click on test list > ImportElement Scenario(s) or
Construct > Testing > Tests > <test class> > right-click on test list > ImportPackage Scenario(s) or
Start > Desktop > Share > Testing > <test class> > right-click on test list > ImportElement Scenario(s)
Start > Desktop > Share > Testing > <test class> > right-click on test list > ImportPackage Scenario(s)
Keyboard Shortcuts Alt+2 > Testing : right-click on test list | Import Element Scenario(s) or
Alt+2 > Testing : right-click on test list | Import Package Scenario(s)
Import a scenario from a single element
Field/Button Action
Select element If you are copying scenarios from a different element to the target element, click onthe drop-down arrow and select the source element. The list identifies elements thathave scenarios that can be imported.
Otherwise, leave this field blank.
Show related elements only Select this checkbox to restrict the list of selectable elements to those that arerelated to the target element.
Limit selection to theseObject Types only
If you want to restrict the list of selectable elements to only those of specific types,type in those element types in a comma-separated list.
Refresh Click on this button after changing any of the field values, to refresh the list ofavailable elements in the 'Select element' field drop-down.
Select items to import Lists the scenarios defined in the source element. Select the scenario(s) to import.
If you do not use the 'Select element' field, any scenarios listed are from the currentelement to which this test record belongs.
If you have selected a different element, the scenarios come from that element.
(c) Sparx Systems 2019 Page 118 of 172 Created with Enterprise Architect
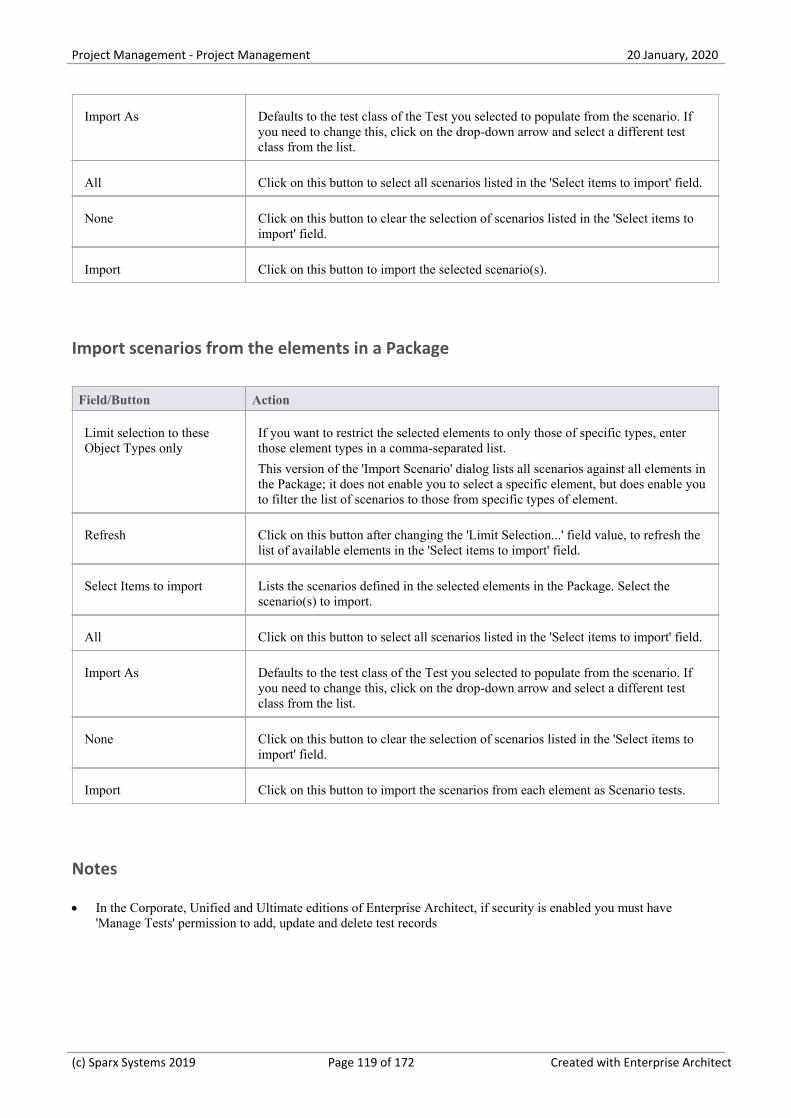
Project Management - Project Management 20 January, 2020
Import As Defaults to the test class of the Test you selected to populate from the scenario. Ifyou need to change this, click on the drop-down arrow and select a different testclass from the list.
All Click on this button to select all scenarios listed in the 'Select items to import' field.
None Click on this button to clear the selection of scenarios listed in the 'Select items toimport' field.
Import Click on this button to import the selected scenario(s).
Import scenarios from the elements in a Package
Field/Button Action
Limit selection to theseObject Types only
If you want to restrict the selected elements to only those of specific types, enterthose element types in a comma-separated list.
This version of the 'Import Scenario' dialog lists all scenarios against all elements inthe Package; it does not enable you to select a specific element, but does enable youto filter the list of scenarios to those from specific types of element.
Refresh Click on this button after changing the 'Limit Selection...' field value, to refresh thelist of available elements in the 'Select items to import' field.
Select Items to import Lists the scenarios defined in the selected elements in the Package. Select thescenario(s) to import.
All Click on this button to select all scenarios listed in the 'Select items to import' field.
Import As Defaults to the test class of the Test you selected to populate from the scenario. Ifyou need to change this, click on the drop-down arrow and select a different testclass from the list.
None Click on this button to clear the selection of scenarios listed in the 'Select items toimport' field.
Import Click on this button to import the scenarios from each element as Scenario tests.
Notes
In the Corporate, Unified and Ultimate editions of Enterprise Architect, if security is enabled you must have·'Manage Tests' permission to add, update and delete test records
(c) Sparx Systems 2019 Page 119 of 172 Created with Enterprise Architect
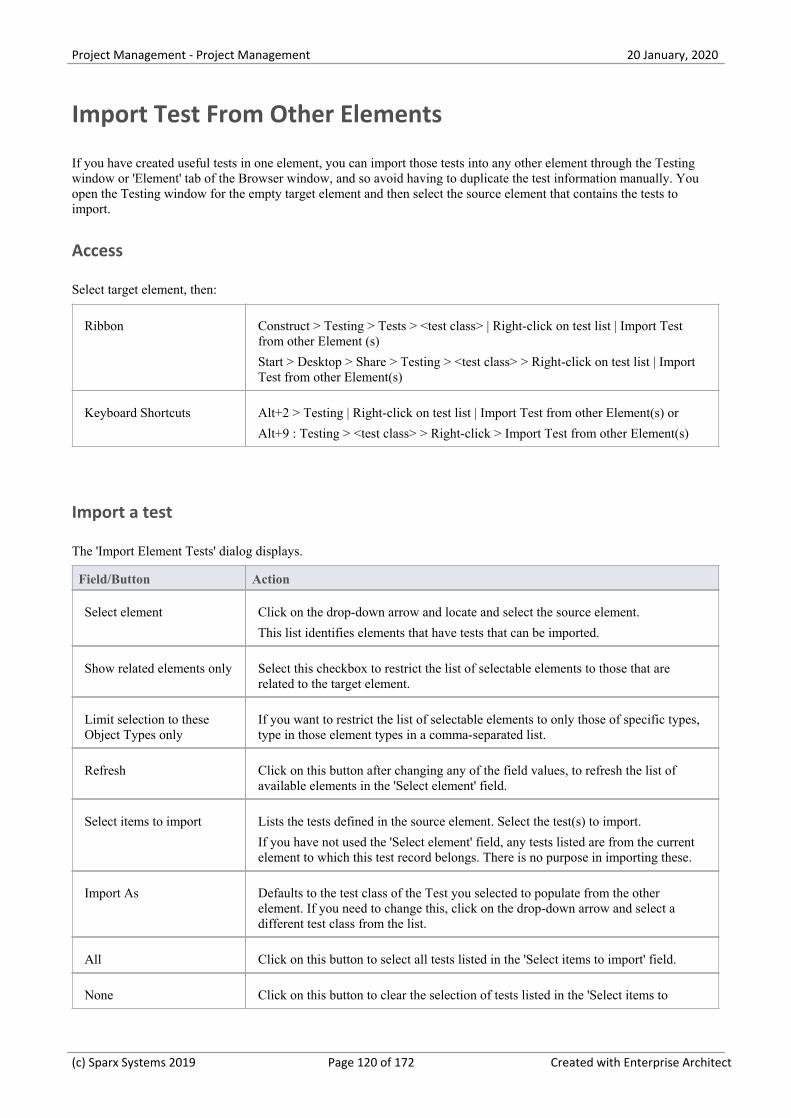
Project Management - Project Management 20 January, 2020
Import Test From Other Elements
If you have created useful tests in one element, you can import those tests into any other element through the Testingwindow or 'Element' tab of the Browser window, and so avoid having to duplicate the test information manually. Youopen the Testing window for the empty target element and then select the source element that contains the tests toimport.
Access
Select target element, then:
Ribbon Construct > Testing > Tests > <test class> | Right-click on test list | Import Testfrom other Element (s)
Start > Desktop > Share > Testing > <test class> > Right-click on test list | ImportTest from other Element(s)
Keyboard Shortcuts Alt+2 > Testing | Right-click on test list | Import Test from other Element(s) or
Alt+9 : Testing > <test class> > Right-click > Import Test from other Element(s)
Import a test
The 'Import Element Tests' dialog displays.
Field/Button Action
Select element Click on the drop-down arrow and locate and select the source element.
This list identifies elements that have tests that can be imported.
Show related elements only Select this checkbox to restrict the list of selectable elements to those that arerelated to the target element.
Limit selection to theseObject Types only
If you want to restrict the list of selectable elements to only those of specific types,type in those element types in a comma-separated list.
Refresh Click on this button after changing any of the field values, to refresh the list ofavailable elements in the 'Select element' field.
Select items to import Lists the tests defined in the source element. Select the test(s) to import.
If you have not used the 'Select element' field, any tests listed are from the currentelement to which this test record belongs. There is no purpose in importing these.
Import As Defaults to the test class of the Test you selected to populate from the otherelement. If you need to change this, click on the drop-down arrow and select adifferent test class from the list.
All Click on this button to select all tests listed in the 'Select items to import' field.
None Click on this button to clear the selection of tests listed in the 'Select items to
(c) Sparx Systems 2019 Page 120 of 172 Created with Enterprise Architect
Project Management - Project Management 20 January, 2020
import' field.
Import Click on this button to import the selected test(s).
Notes
In the Corporate, Unified and Ultimate editions of Enterprise Architect, if security is enabled you must have·'Manage Tests' permission to add, update and delete test records
(c) Sparx Systems 2019 Page 121 of 172 Created with Enterprise Architect
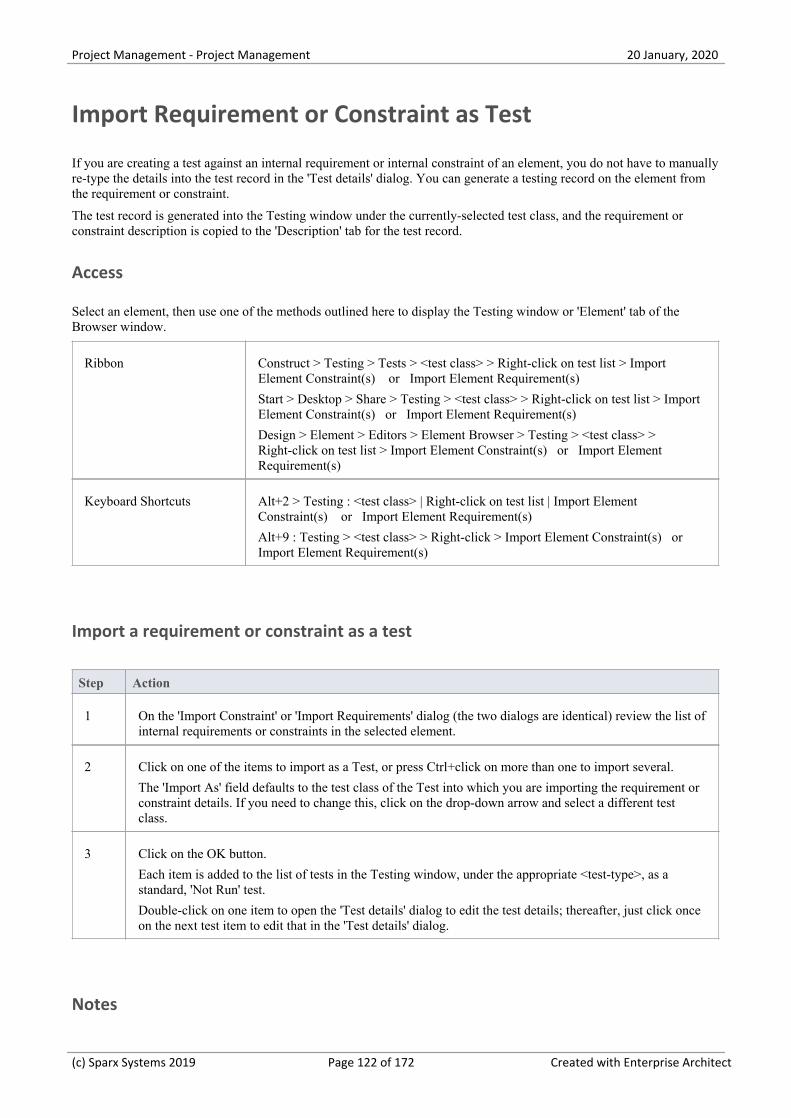
Project Management - Project Management 20 January, 2020
Import Requirement or Constraint as Test
If you are creating a test against an internal requirement or internal constraint of an element, you do not have to manuallyre-type the details into the test record in the 'Test details' dialog. You can generate a testing record on the element fromthe requirement or constraint.
The test record is generated into the Testing window under the currently-selected test class, and the requirement orconstraint description is copied to the 'Description' tab for the test record.
Access
Select an element, then use one of the methods outlined here to display the Testing window or 'Element' tab of theBrowser window.
Ribbon Construct > Testing > Tests > <test class> > Right-click on test list > ImportElement Constraint(s) or Import Element Requirement(s)
Start > Desktop > Share > Testing > <test class> > Right-click on test list > ImportElement Constraint(s) or Import Element Requirement(s)
Design > Element > Editors > Element Browser > Testing > <test class> >Right-click on test list > Import Element Constraint(s) or Import ElementRequirement(s)
Keyboard Shortcuts Alt+2 > Testing : <test class> | Right-click on test list | Import ElementConstraint(s) or Import Element Requirement(s)
Alt+9 : Testing > <test class> > Right-click > Import Element Constraint(s) orImport Element Requirement(s)
Import a requirement or constraint as a test
Step Action
1 On the 'Import Constraint' or 'Import Requirements' dialog (the two dialogs are identical) review the list ofinternal requirements or constraints in the selected element.
2 Click on one of the items to import as a Test, or press Ctrl+click on more than one to import several.
The 'Import As' field defaults to the test class of the Test into which you are importing the requirement orconstraint details. If you need to change this, click on the drop-down arrow and select a different testclass.
3 Click on the OK button.
Each item is added to the list of tests in the Testing window, under the appropriate <test-type>, as astandard, 'Not Run' test.
Double-click on one item to open the 'Test details' dialog to edit the test details; thereafter, just click onceon the next test item to edit that in the 'Test details' dialog.
Notes
(c) Sparx Systems 2019 Page 122 of 172 Created with Enterprise Architect
Project Management - Project Management 20 January, 2020
In the Corporate, Unified and Ultimate editions of Enterprise Architect, if security is enabled you must have·'Manage Tests' permission to add, update and delete test records
(c) Sparx Systems 2019 Page 123 of 172 Created with Enterprise Architect
Project Management - Project Management 20 January, 2020
Test Documentation
After you have recorded a number of test scripts and results against elements in the model, you can output theinformation as a report in Rich Text Format, using the 'Generate Test Documentation' dialog. You can select the types oftest to include or exclude in the report and whether to include child Packages, and enter the file location to which togenerate the report.
Click on the Generate button to produce the report.
You can also run a number of searches to show the results - where generated - of tests:
Not Run·
Not Checked·
Recently run·
Recently Passed·
Recently Failed·
Recently Deferred·
Run on recently modified elements·
Run in the last week·
Run in the last 30 days·
Access
Select a Package, then use the ribbon options:
Ribbon Construct > Testing > Outcomes > Report (to display the 'Generate TestDocumentation' dialog)
Construct > Testing > Not Run
Construct > Testing > Not Checked
Construct > Testing > Outcomes > <report type>
(c) Sparx Systems 2019 Page 124 of 172 Created with Enterprise Architect
Project Management - Project Management 20 January, 2020
Maintenance
In the course of your team's work on a model, changes and issues can arise at a number of levels, for problems that applysystem-wide through areas of the model and down to within a specific element. A Change, very broadly, defines anaddition or alteration to a requirement, whilst an Issue identifies either a failure to meet a requirement, or a risk inmeeting the requirement.
There are two mechanisms that can be used to identify a change or issue, and the work required to resolve it:
Change and Issue (or Defect) elements - structured comments that identify a problem at system-level, although they·can also be attached to a specific element from which a problem arises; both types of element can be linked byrelationships such as Association, Dependency and Realize to one or more other elements that have to be reviewed,and for complex problems can form hierarchies or groups
Maintenance items - properties raised against a specific element and recorded for that element in the Maintenance·window; these provide a distinction between Defects (a failure to meet a requirement) and Issues (a risk factor thatmight affect satisfying the requirement) and also include Tasks, which record work items associated with theelementMaintenance items are very specific, but if an item begins to have a wider impact on other elements or the system ingeneral, you can translate that item into a Change, Issue, or any other type of element that best identifies the problemand its solution
Maintenance items are defects, changes, issues, tasks, features and documents that apply at the model element level.They are properties of individual model elements that can be used to record and capture problems, changes, issues andtasks as they arise, and document the solution and associated details.
Maintenance Tasks
Task Area Detail
Maintenance Items -Element-level
You create maintenance items in the Maintenance window. Typically you create:
A defect to record a failure to meet a requirement for the current model·element
A change to record a change in requirement for the current model element·
An issue to record a risk factor that might affect the project being recorded for·the current model element
A task to record work in progress and work outstanding for the current model·element
A feature to record a feature in requirement for the current model element·
A document to record supporting documentation such as Help, release notes·and user comments
Creating and EditingMaintenance Items
Tasks that you might perform when working with maintenance items include:
Moving or copying maintenance items between maintenance types·
Generating new items of one type from an item of a different type·
Creating elements from maintenance items·
Showing maintenance items on elements in a diagram·
(c) Sparx Systems 2019 Page 125 of 172 Created with Enterprise Architect
Project Management - Project Management 20 January, 2020
Adding a maintenance item directly to an element via in-place editing·
Generating a report on the status of maintenance items of specific types or all·types
Maintenance -System-level
To represent changes, defects and issues that apply to the model you can createChange and Issue elements with - if necessary - subordinate structures.
To represent issues and tasks that apply to the progress of the project as a wholeand that are not related to model structures, you create Project Issue and ProjectTask records in Project Management.
(c) Sparx Systems 2019 Page 126 of 172 Created with Enterprise Architect
Project Management - Project Management 20 January, 2020
Working on Maintenance Items
Creating, viewing and modifying the Maintenance items - changes, issues, defects, tasks, feature and documents -associated with a particular model element is quick and convenient, using the Maintenance window. If the Maintenancewindow is open, when you select an element in a diagram or in the Browser window, the appropriate maintenance itemsfor that element are immediately listed in the window, and you can select them there to modify. The Maintenancewindow provides several facilities for managing the maintenance items.
You can include the maintenance items in the document and web reports generated on your model. The 'Document Setup'dialog has checkboxes to show or hide element maintenance items.
Access
Click on an element in the Browser window or diagram and select the appropriate ribbon option.
Ribbon Construct > Change Management > Features > Show Features Window
Construct > Change Management > Changes > Show Changes Window
Construct > Change Management > Documents > Show Documents Window
Construct > Change Management > Issues > Show Issues Window
Construct > Change Management > Tasks > Show Tasks Window
Construct > Change Management > Defects > Show Defects Window
Keyboard Ctrl+8 | <Required tab>
Select any of the above items on a diagram or Element tab of the browser then useShift+Enter
Facilities
Facility Detail
Maintenance Item Types The six types of Maintenance Item you can create records for are each listed on aseparate tab of the Maintenance window:
Defects - each recording a failure to meet a requirement for the current model·element
Changes - each recording a change in requirement for the current model·element
Issues - each recording a risk factor that might affect the project, associated·with the current model element
Tasks - each recording work in progress and work outstanding for the current·model element
Features - each recording a feature in requirement for the current model·element
Documents - each recording the supporting documentation such as Help,·release notes and user comments
There is also an 'Overview' tab that displays a read-only list of all the Maintenanceitems on the element, grouped by type. If you double-click on an item in this list,the appropriate tab displays with the item highlighted.
(c) Sparx Systems 2019 Page 127 of 172 Created with Enterprise Architect
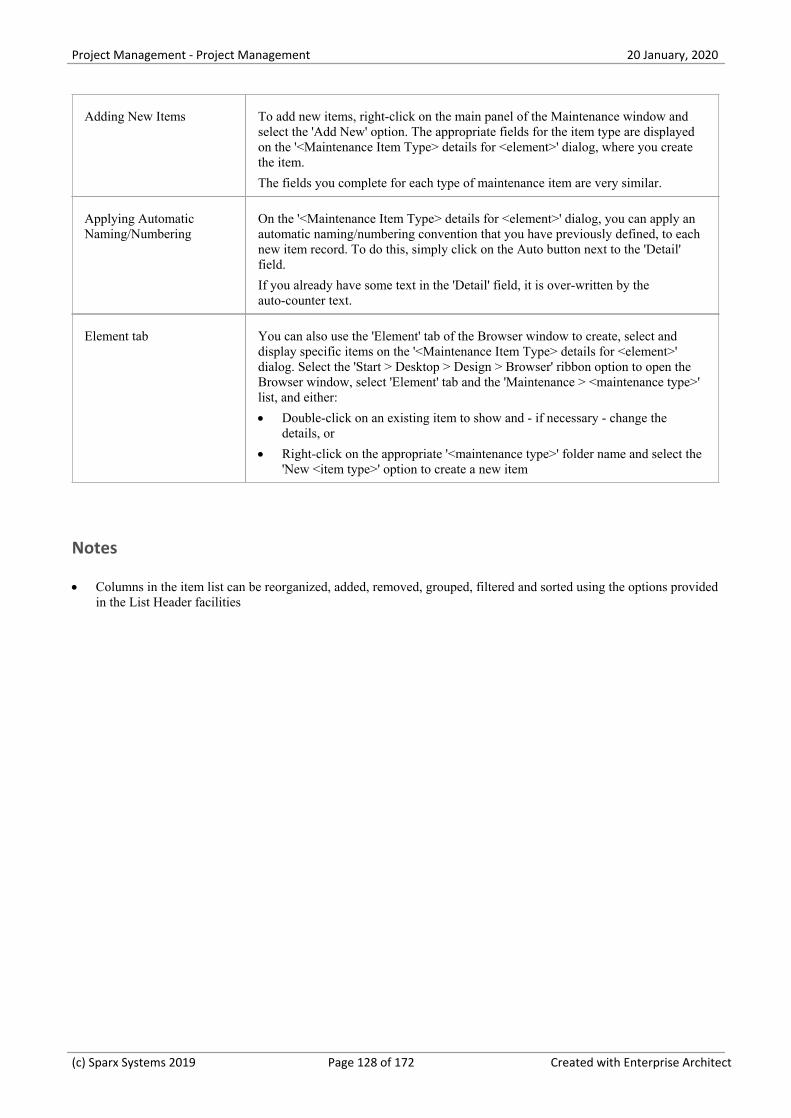
Project Management - Project Management 20 January, 2020
Adding New Items To add new items, right-click on the main panel of the Maintenance window andselect the 'Add New' option. The appropriate fields for the item type are displayedon the '<Maintenance Item Type> details for <element>' dialog, where you createthe item.
The fields you complete for each type of maintenance item are very similar.
Applying AutomaticNaming/Numbering
On the '<Maintenance Item Type> details for <element>' dialog, you can apply anautomatic naming/numbering convention that you have previously defined, to eachnew item record. To do this, simply click on the Auto button next to the 'Detail'field.
If you already have some text in the 'Detail' field, it is over-written by theauto-counter text.
Element tab You can also use the 'Element' tab of the Browser window to create, select anddisplay specific items on the '<Maintenance Item Type> details for <element>'dialog. Select the 'Start > Desktop > Design > Browser' ribbon option to open theBrowser window, select 'Element' tab and the 'Maintenance > <maintenance type>'list, and either:
Double-click on an existing item to show and - if necessary - change the·details, or
Right-click on the appropriate '<maintenance type>' folder name and select the·'New <item type>' option to create a new item
Notes
Columns in the item list can be reorganized, added, removed, grouped, filtered and sorted using the options provided·in the List Header facilities
(c) Sparx Systems 2019 Page 128 of 172 Created with Enterprise Architect
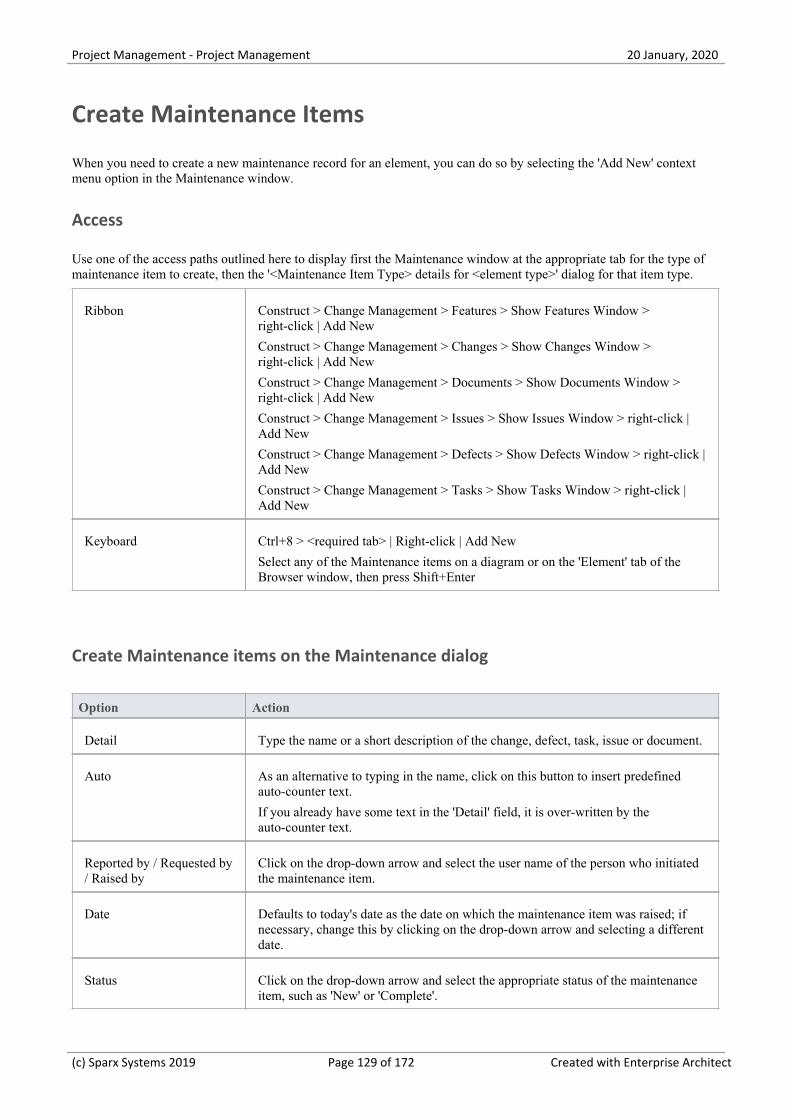
Project Management - Project Management 20 January, 2020
Create Maintenance Items
When you need to create a new maintenance record for an element, you can do so by selecting the 'Add New' contextmenu option in the Maintenance window.
Access
Use one of the access paths outlined here to display first the Maintenance window at the appropriate tab for the type ofmaintenance item to create, then the '<Maintenance Item Type> details for <element type>' dialog for that item type.
Ribbon Construct > Change Management > Features > Show Features Window >right-click | Add New
Construct > Change Management > Changes > Show Changes Window >right-click | Add New
Construct > Change Management > Documents > Show Documents Window >right-click | Add New
Construct > Change Management > Issues > Show Issues Window > right-click |Add New
Construct > Change Management > Defects > Show Defects Window > right-click |Add New
Construct > Change Management > Tasks > Show Tasks Window > right-click |Add New
Keyboard Ctrl+8 > <required tab> | Right-click | Add New
Select any of the Maintenance items on a diagram or on the 'Element' tab of theBrowser window, then press Shift+Enter
Create Maintenance items on the Maintenance dialog
Option Action
Detail Type the name or a short description of the change, defect, task, issue or document.
Auto As an alternative to typing in the name, click on this button to insert predefinedauto-counter text.
If you already have some text in the 'Detail' field, it is over-written by theauto-counter text.
Reported by / Requested by/ Raised by
Click on the drop-down arrow and select the user name of the person who initiatedthe maintenance item.
Date Defaults to today's date as the date on which the maintenance item was raised; ifnecessary, change this by clicking on the drop-down arrow and selecting a differentdate.
Status Click on the drop-down arrow and select the appropriate status of the maintenanceitem, such as 'New' or 'Complete'.
(c) Sparx Systems 2019 Page 129 of 172 Created with Enterprise Architect
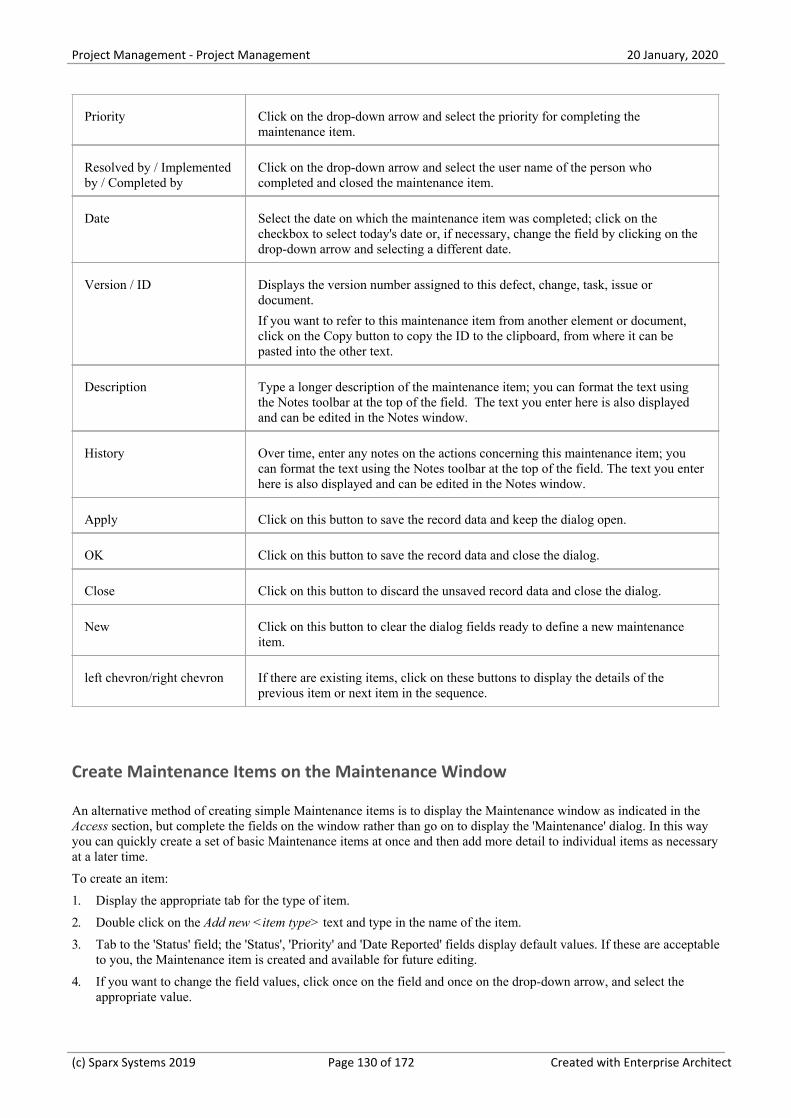
Project Management - Project Management 20 January, 2020
Priority Click on the drop-down arrow and select the priority for completing themaintenance item.
Resolved by / Implementedby / Completed by
Click on the drop-down arrow and select the user name of the person whocompleted and closed the maintenance item.
Date Select the date on which the maintenance item was completed; click on thecheckbox to select today's date or, if necessary, change the field by clicking on thedrop-down arrow and selecting a different date.
Version / ID Displays the version number assigned to this defect, change, task, issue ordocument.
If you want to refer to this maintenance item from another element or document,click on the Copy button to copy the ID to the clipboard, from where it can bepasted into the other text.
Description Type a longer description of the maintenance item; you can format the text usingthe Notes toolbar at the top of the field. The text you enter here is also displayedand can be edited in the Notes window.
History Over time, enter any notes on the actions concerning this maintenance item; youcan format the text using the Notes toolbar at the top of the field. The text you enterhere is also displayed and can be edited in the Notes window.
Apply Click on this button to save the record data and keep the dialog open.
OK Click on this button to save the record data and close the dialog.
Close Click on this button to discard the unsaved record data and close the dialog.
New Click on this button to clear the dialog fields ready to define a new maintenanceitem.
left chevron/right chevron If there are existing items, click on these buttons to display the details of theprevious item or next item in the sequence.
Create Maintenance Items on the Maintenance Window
An alternative method of creating simple Maintenance items is to display the Maintenance window as indicated in theAccess section, but complete the fields on the window rather than go on to display the 'Maintenance' dialog. In this wayyou can quickly create a set of basic Maintenance items at once and then add more detail to individual items as necessaryat a later time.
To create an item:
Display the appropriate tab for the type of item.1.
Double click on the Add new <item type> text and type in the name of the item.2.
Tab to the 'Status' field; the 'Status', 'Priority' and 'Date Reported' fields display default values. If these are acceptable3.to you, the Maintenance item is created and available for future editing.
If you want to change the field values, click once on the field and once on the drop-down arrow, and select the4.appropriate value.
(c) Sparx Systems 2019 Page 130 of 172 Created with Enterprise Architect
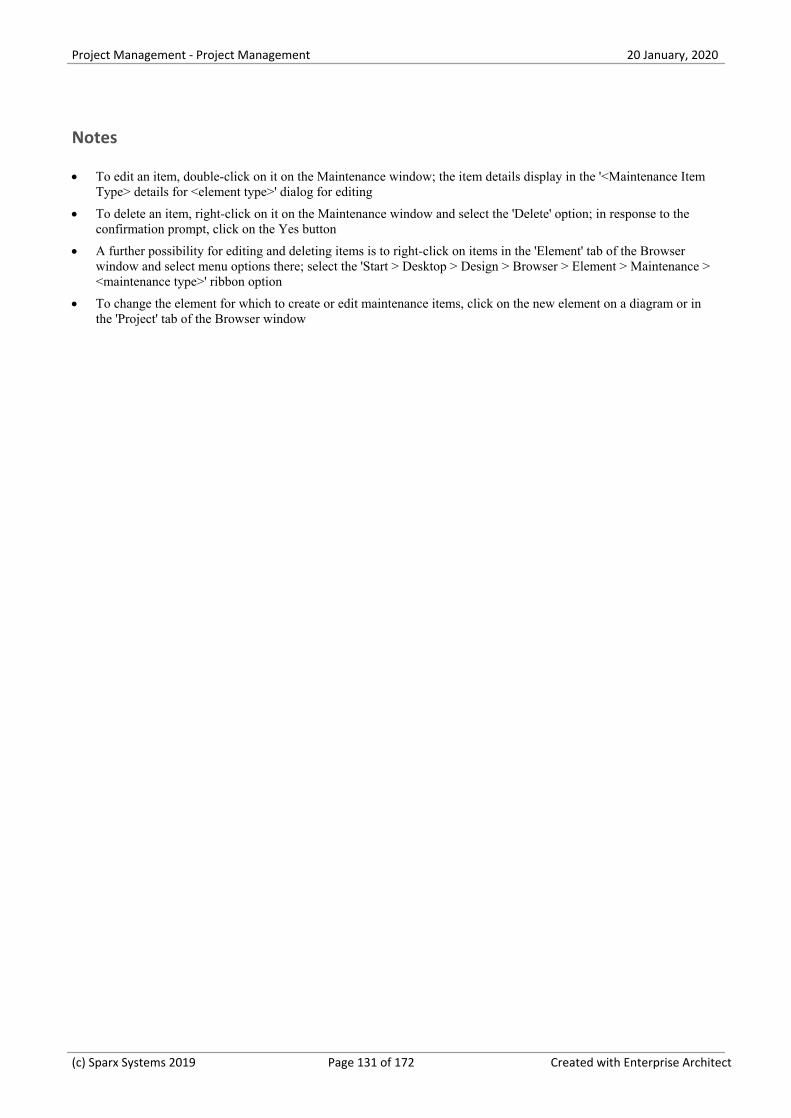
Project Management - Project Management 20 January, 2020
Notes
To edit an item, double-click on it on the Maintenance window; the item details display in the '<Maintenance Item·Type> details for <element type>' dialog for editing
To delete an item, right-click on it on the Maintenance window and select the 'Delete' option; in response to the·confirmation prompt, click on the Yes button
A further possibility for editing and deleting items is to right-click on items in the 'Element' tab of the Browser·window and select menu options there; select the 'Start > Desktop > Design > Browser > Element > Maintenance ><maintenance type>' ribbon option
To change the element for which to create or edit maintenance items, click on the new element on a diagram or in·the 'Project' tab of the Browser window
(c) Sparx Systems 2019 Page 131 of 172 Created with Enterprise Architect
Project Management - Project Management 20 January, 2020
Properties Window for Maintenance Items
When the Properties window is open, it displays the properties of the selected object or assigned item, including aMaintenance record for an element. These items include Changes, Issues, Defects, Tasks, Features and Documents.
You might select the item in the appropriate tab of the Maintenance window, the maintenance compartment of anelement on a diagram, or the 'Element' tab of the Browser window.
The Properties window identifies the type of item just under the toolbar, and shows the current values for the:
Item name·
User who raised the item·
Date the item was raised·
Status·
User who implemented or resolved the item·
Date that action was completed·
Priority of the item·
Version of the item·
You can change the value for each of these fields (except for the 'Name' and 'Version' fields), clicking on the drop-downarrow and selecting a new value.
For the 'Name' field, you can either overtype the item name or click on the icon and apply any autonamingconvention you have configured for maintenance items. If you click on the icon for the 'Version/ID' field, that value iscopied to the clipboard to be pasted into a discussion or document.
The toolbar options operate on the parent element for the maintenance item. Any changes you make are automaticallysaved and displayed elsewhere when you click off the field.
(c) Sparx Systems 2019 Page 132 of 172 Created with Enterprise Architect
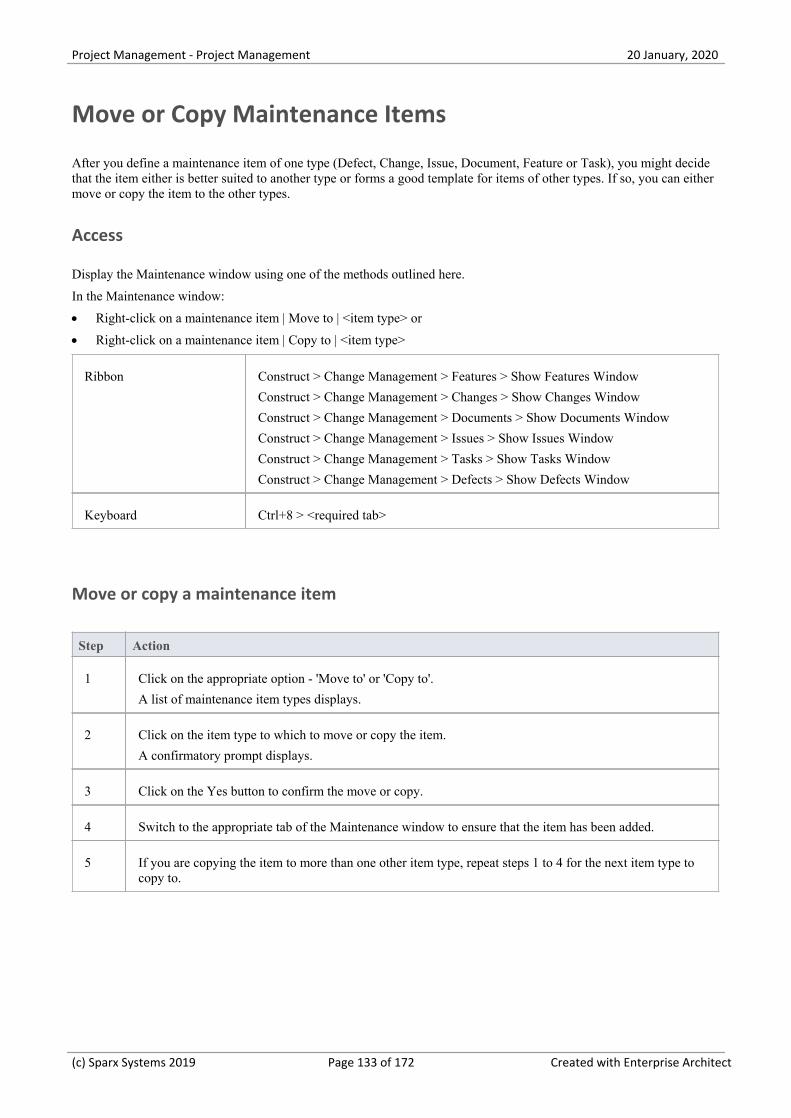
Project Management - Project Management 20 January, 2020
Move or Copy Maintenance Items
After you define a maintenance item of one type (Defect, Change, Issue, Document, Feature or Task), you might decidethat the item either is better suited to another type or forms a good template for items of other types. If so, you can eithermove or copy the item to the other types.
Access
Display the Maintenance window using one of the methods outlined here.
In the Maintenance window:
Right-click on a maintenance item | Move to | <item type> or·
Right-click on a maintenance item | Copy to | <item type>·
Ribbon Construct > Change Management > Features > Show Features Window
Construct > Change Management > Changes > Show Changes Window
Construct > Change Management > Documents > Show Documents Window
Construct > Change Management > Issues > Show Issues Window
Construct > Change Management > Tasks > Show Tasks Window
Construct > Change Management > Defects > Show Defects Window
Keyboard Ctrl+8 > <required tab>
Move or copy a maintenance item
Step Action
1 Click on the appropriate option - 'Move to' or 'Copy to'.
A list of maintenance item types displays.
2 Click on the item type to which to move or copy the item.
A confirmatory prompt displays.
3 Click on the Yes button to confirm the move or copy.
4 Switch to the appropriate tab of the Maintenance window to ensure that the item has been added.
5 If you are copying the item to more than one other item type, repeat steps 1 to 4 for the next item type tocopy to.
(c) Sparx Systems 2019 Page 133 of 172 Created with Enterprise Architect
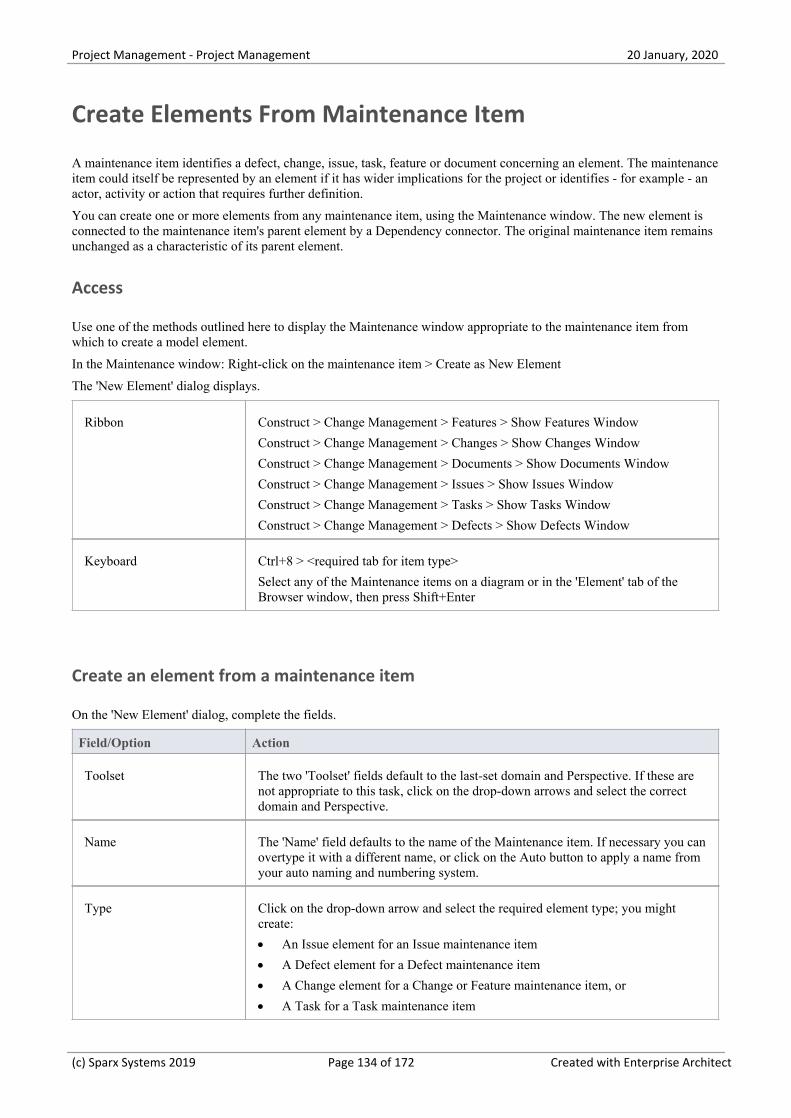
Project Management - Project Management 20 January, 2020
Create Elements From Maintenance Item
A maintenance item identifies a defect, change, issue, task, feature or document concerning an element. The maintenanceitem could itself be represented by an element if it has wider implications for the project or identifies - for example - anactor, activity or action that requires further definition.
You can create one or more elements from any maintenance item, using the Maintenance window. The new element isconnected to the maintenance item's parent element by a Dependency connector. The original maintenance item remainsunchanged as a characteristic of its parent element.
Access
Use one of the methods outlined here to display the Maintenance window appropriate to the maintenance item fromwhich to create a model element.
In the Maintenance window: Right-click on the maintenance item > Create as New Element
The 'New Element' dialog displays.
Ribbon Construct > Change Management > Features > Show Features Window
Construct > Change Management > Changes > Show Changes Window
Construct > Change Management > Documents > Show Documents Window
Construct > Change Management > Issues > Show Issues Window
Construct > Change Management > Tasks > Show Tasks Window
Construct > Change Management > Defects > Show Defects Window
Keyboard Ctrl+8 > <required tab for item type>
Select any of the Maintenance items on a diagram or in the 'Element' tab of theBrowser window, then press Shift+Enter
Create an element from a maintenance item
On the 'New Element' dialog, complete the fields.
Field/Option Action
Toolset The two 'Toolset' fields default to the last-set domain and Perspective. If these arenot appropriate to this task, click on the drop-down arrows and select the correctdomain and Perspective.
Name The 'Name' field defaults to the name of the Maintenance item. If necessary you canovertype it with a different name, or click on the Auto button to apply a name fromyour auto naming and numbering system.
Type Click on the drop-down arrow and select the required element type; you mightcreate:
An Issue element for an Issue maintenance item·
A Defect element for a Defect maintenance item·
A Change element for a Change or Feature maintenance item, or·
A Task for a Task maintenance item·
(c) Sparx Systems 2019 Page 134 of 172 Created with Enterprise Architect
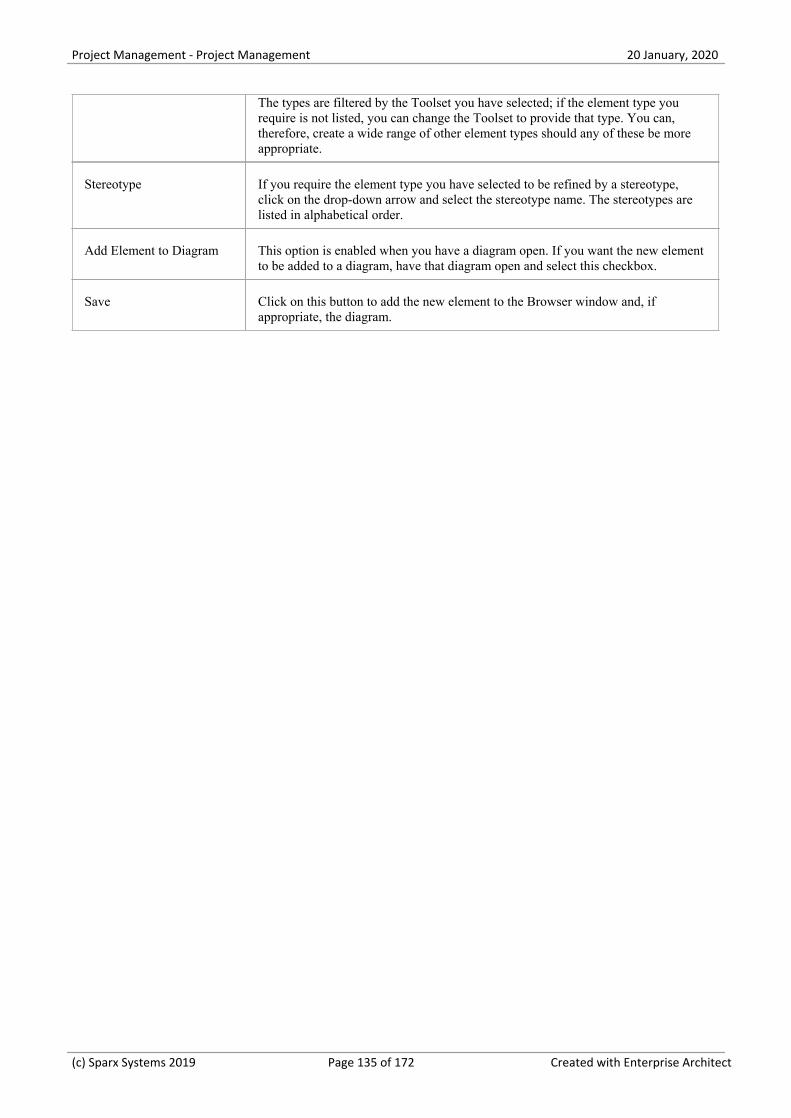
Project Management - Project Management 20 January, 2020
The types are filtered by the Toolset you have selected; if the element type yourequire is not listed, you can change the Toolset to provide that type. You can,therefore, create a wide range of other element types should any of these be moreappropriate.
Stereotype If you require the element type you have selected to be refined by a stereotype,click on the drop-down arrow and select the stereotype name. The stereotypes arelisted in alphabetical order.
Add Element to Diagram This option is enabled when you have a diagram open. If you want the new elementto be added to a diagram, have that diagram open and select this checkbox.
Save Click on this button to add the new element to the Browser window and, ifappropriate, the diagram.
(c) Sparx Systems 2019 Page 135 of 172 Created with Enterprise Architect
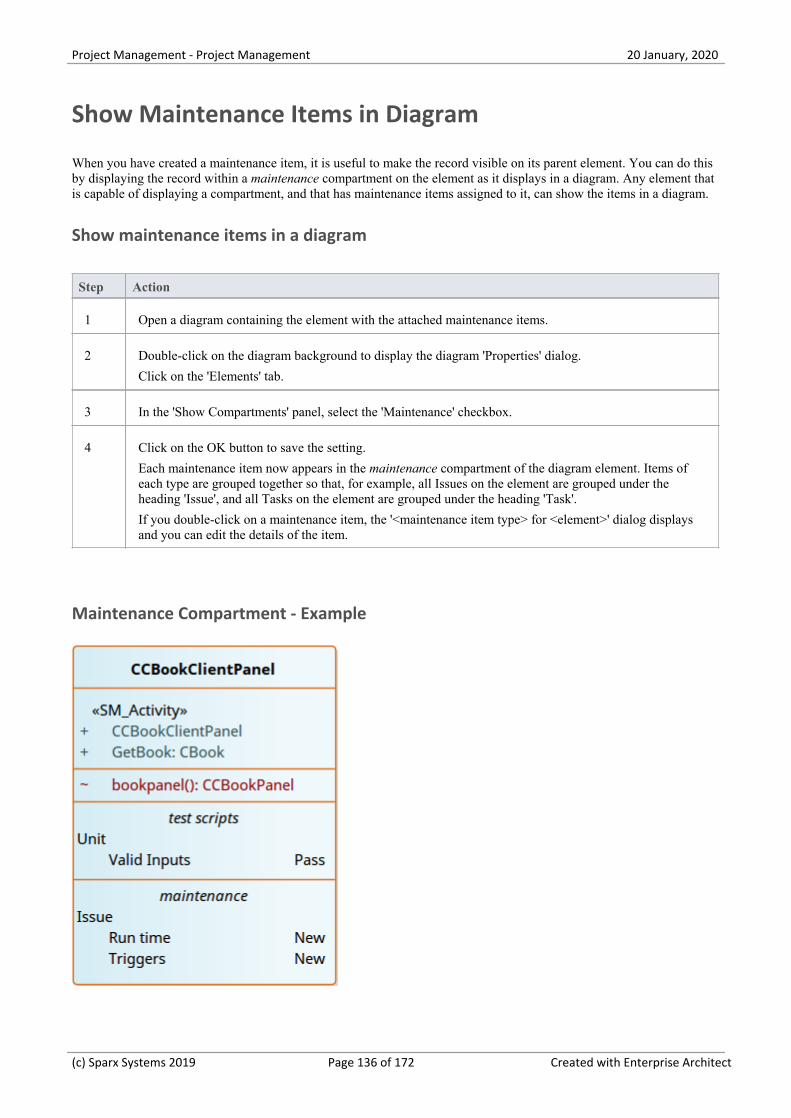
Project Management - Project Management 20 January, 2020
Show Maintenance Items in Diagram
When you have created a maintenance item, it is useful to make the record visible on its parent element. You can do thisby displaying the record within a maintenance compartment on the element as it displays in a diagram. Any element thatis capable of displaying a compartment, and that has maintenance items assigned to it, can show the items in a diagram.
Show maintenance items in a diagram
Step Action
1 Open a diagram containing the element with the attached maintenance items.
2 Double-click on the diagram background to display the diagram 'Properties' dialog.
Click on the 'Elements' tab.
3 In the 'Show Compartments' panel, select the 'Maintenance' checkbox.
4 Click on the OK button to save the setting.
Each maintenance item now appears in the maintenance compartment of the diagram element. Items ofeach type are grouped together so that, for example, all Issues on the element are grouped under theheading 'Issue', and all Tasks on the element are grouped under the heading 'Task'.
If you double-click on a maintenance item, the '<maintenance item type> for <element>' dialog displaysand you can edit the details of the item.
Maintenance Compartment - Example
(c) Sparx Systems 2019 Page 136 of 172 Created with Enterprise Architect
Project Management - Project Management 20 January, 2020
(c) Sparx Systems 2019 Page 137 of 172 Created with Enterprise Architect
Project Management - Project Management 20 January, 2020
Changes, Defects and Issues
If your work in managing a project identifies issues, defects or required changes in the model rather than internal to asingle element, you can represent these using Change, Issue or Defect elements as structured comments with which youcan track and manage the problems.
A Change element corresponds to a change in requirements for the current system·
An Issue element corresponds to a failure to match the requirements for the current system due to newly arisen·organizational or legal factors such as staffing problems, changes in laws or guidelines, or business unit restructuring
A Defect element corresponds to a failure to match the requirements for the current system due to a flaw in the·model, system or process, such as a missing element or module, or no inclusion of a necessary actor
You can also define any specific work to be done in researching or resolving the problem using Task elements, andassign resources to these or directly to the Change, Issue or Defect elements internally, in Resource Allocation, orexternally as Actors.
The use of maintenance elements provides a broad scope for managing changes, defects and issues, providing the facilityto fully define the problem and its resolution with Linked Documents, both internal and external Notes, and CompositeStructure diagrams including Interaction and Activity diagrams.
You can create Change, Defect and Issue elements in various UML diagrams (especially Maintenance diagrams) andconnect them using Realization, Dependency, Aggregation and other relationships to show what model elements eachproblem affects and how each is resolved. Within the element 'Properties' dialog for Changes, Defects and Issues you canidentify the problem as the element name and record relevant management details, such as owner and dates.
A useful tool in managing problems and changes is the Relationship Matrix, in which you might - for example - link staff(Actors) through Realization connectors to Issues. Each highlighted square in the Matrix indicates the responsibility of astaff member to work on or correct a named Issue.
(c) Sparx Systems 2019 Page 138 of 172 Created with Enterprise Architect
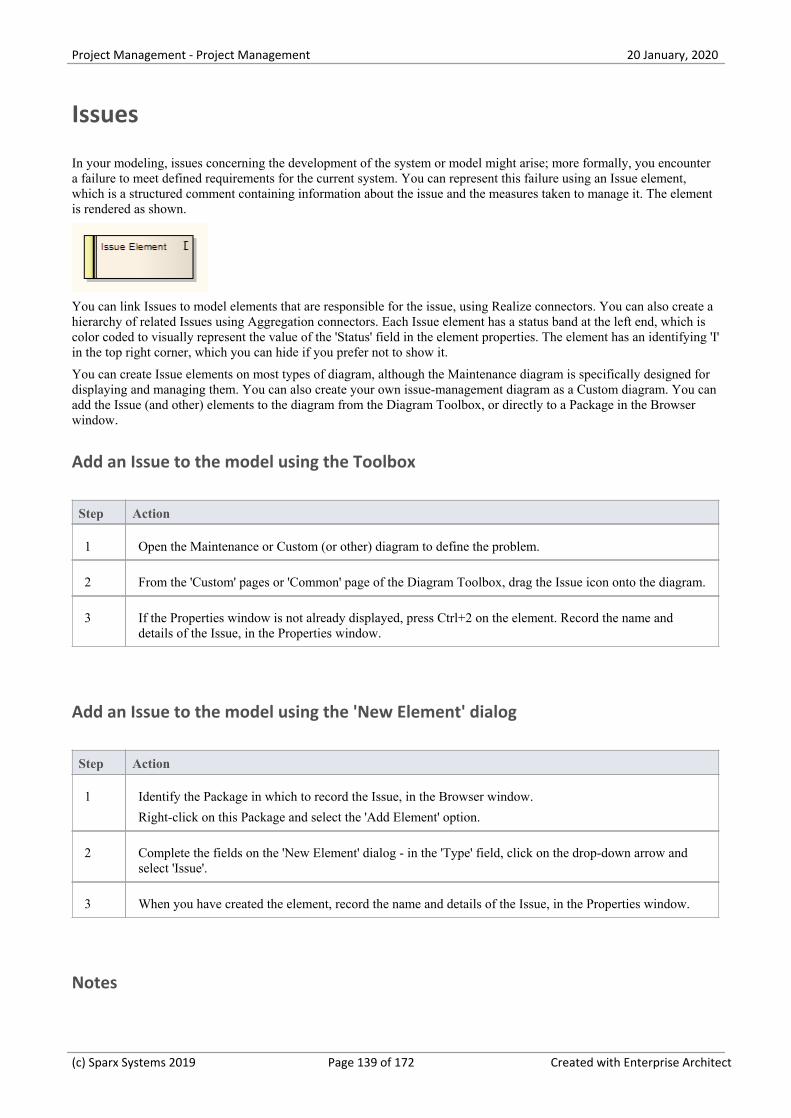
Project Management - Project Management 20 January, 2020
Issues
In your modeling, issues concerning the development of the system or model might arise; more formally, you encountera failure to meet defined requirements for the current system. You can represent this failure using an Issue element,which is a structured comment containing information about the issue and the measures taken to manage it. The elementis rendered as shown.
You can link Issues to model elements that are responsible for the issue, using Realize connectors. You can also create ahierarchy of related Issues using Aggregation connectors. Each Issue element has a status band at the left end, which iscolor coded to visually represent the value of the 'Status' field in the element properties. The element has an identifying 'I'in the top right corner, which you can hide if you prefer not to show it.
You can create Issue elements on most types of diagram, although the Maintenance diagram is specifically designed fordisplaying and managing them. You can also create your own issue-management diagram as a Custom diagram. You canadd the Issue (and other) elements to the diagram from the Diagram Toolbox, or directly to a Package in the Browserwindow.
Add an Issue to the model using the Toolbox
Step Action
1 Open the Maintenance or Custom (or other) diagram to define the problem.
2 From the 'Custom' pages or 'Common' page of the Diagram Toolbox, drag the Issue icon onto the diagram.
3 If the Properties window is not already displayed, press Ctrl+2 on the element. Record the name anddetails of the Issue, in the Properties window.
Add an Issue to the model using the 'New Element' dialog
Step Action
1 Identify the Package in which to record the Issue, in the Browser window.
Right-click on this Package and select the 'Add Element' option.
2 Complete the fields on the 'New Element' dialog - in the 'Type' field, click on the drop-down arrow andselect 'Issue'.
3 When you have created the element, record the name and details of the Issue, in the Properties window.
Notes
(c) Sparx Systems 2019 Page 139 of 172 Created with Enterprise Architect
Project Management - Project Management 20 January, 2020
To toggle display of the letter 'I' in the top right corner of the element, select or deselect the 'Show stereotype icon·for requirements' checkbox on the 'Preferences' dialog, 'Objects' page
(c) Sparx Systems 2019 Page 140 of 172 Created with Enterprise Architect
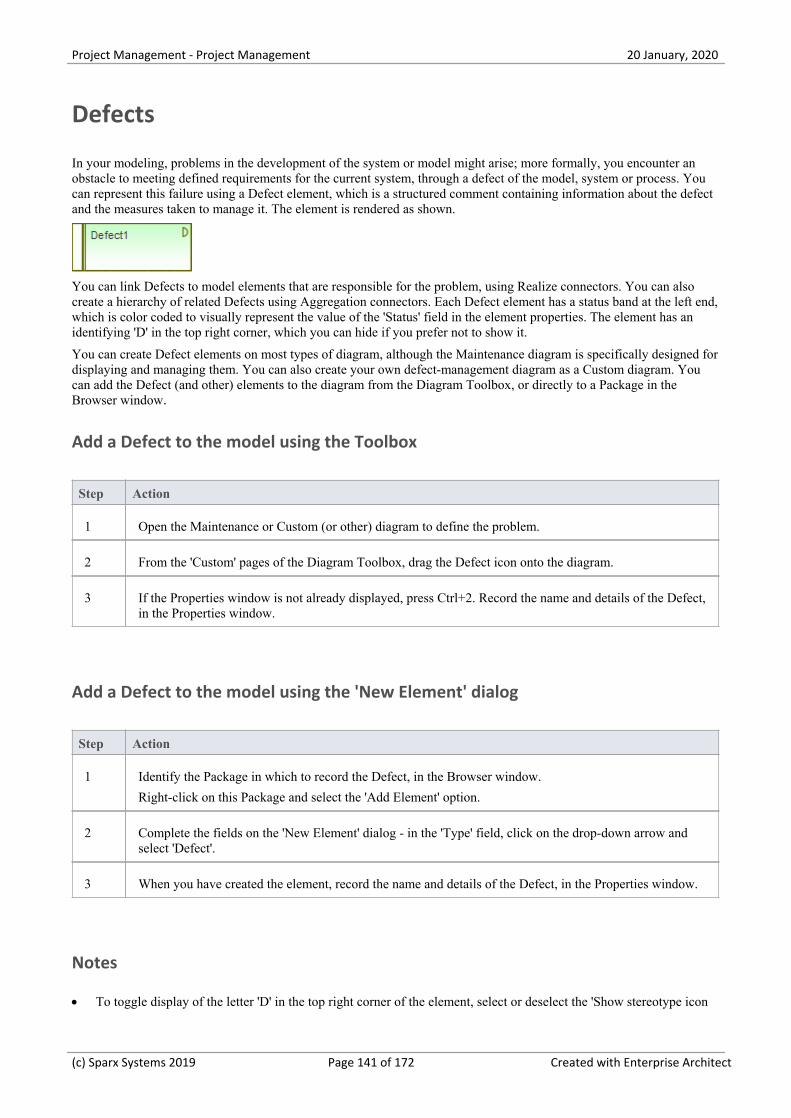
Project Management - Project Management 20 January, 2020
Defects
In your modeling, problems in the development of the system or model might arise; more formally, you encounter anobstacle to meeting defined requirements for the current system, through a defect of the model, system or process. Youcan represent this failure using a Defect element, which is a structured comment containing information about the defectand the measures taken to manage it. The element is rendered as shown.
You can link Defects to model elements that are responsible for the problem, using Realize connectors. You can alsocreate a hierarchy of related Defects using Aggregation connectors. Each Defect element has a status band at the left end,which is color coded to visually represent the value of the 'Status' field in the element properties. The element has anidentifying 'D' in the top right corner, which you can hide if you prefer not to show it.
You can create Defect elements on most types of diagram, although the Maintenance diagram is specifically designed fordisplaying and managing them. You can also create your own defect-management diagram as a Custom diagram. Youcan add the Defect (and other) elements to the diagram from the Diagram Toolbox, or directly to a Package in theBrowser window.
Add a Defect to the model using the Toolbox
Step Action
1 Open the Maintenance or Custom (or other) diagram to define the problem.
2 From the 'Custom' pages of the Diagram Toolbox, drag the Defect icon onto the diagram.
3 If the Properties window is not already displayed, press Ctrl+2. Record the name and details of the Defect,in the Properties window.
Add a Defect to the model using the 'New Element' dialog
Step Action
1 Identify the Package in which to record the Defect, in the Browser window.
Right-click on this Package and select the 'Add Element' option.
2 Complete the fields on the 'New Element' dialog - in the 'Type' field, click on the drop-down arrow andselect 'Defect'.
3 When you have created the element, record the name and details of the Defect, in the Properties window.
Notes
To toggle display of the letter 'D' in the top right corner of the element, select or deselect the 'Show stereotype icon·
(c) Sparx Systems 2019 Page 141 of 172 Created with Enterprise Architect
Project Management - Project Management 20 January, 2020
for requirements' checkbox on the 'Preferences' dialog, 'Objects' page
(c) Sparx Systems 2019 Page 142 of 172 Created with Enterprise Architect
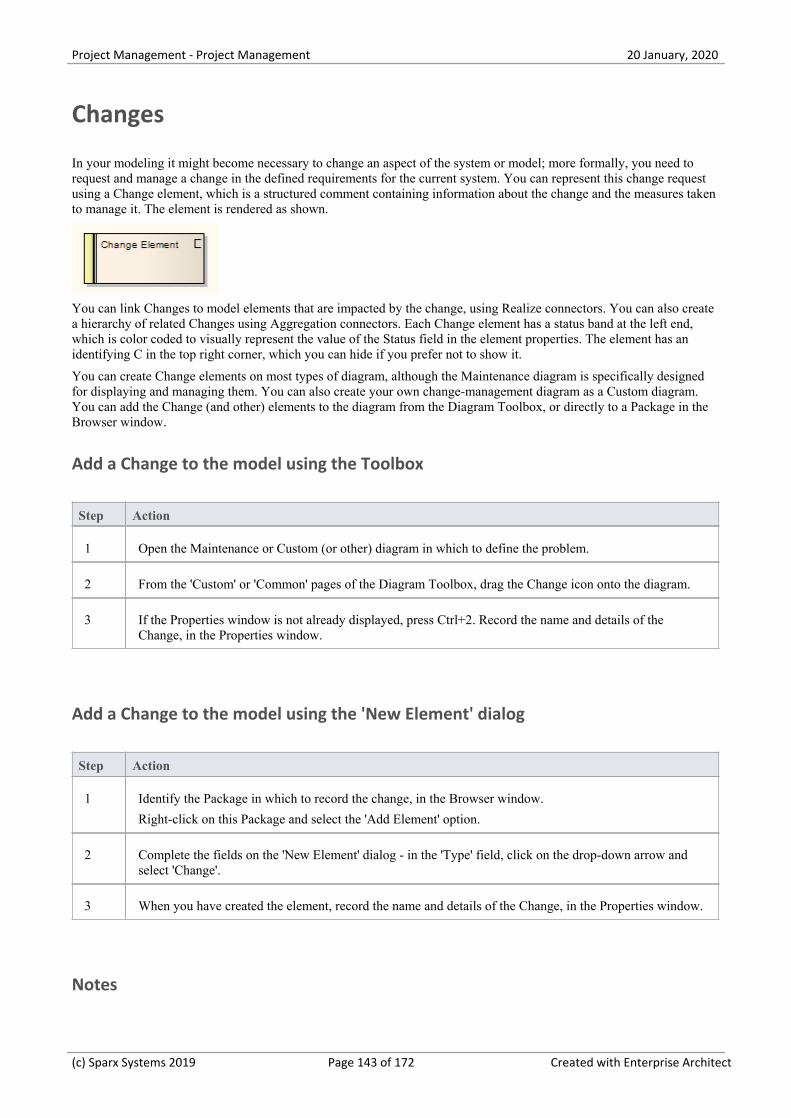
Project Management - Project Management 20 January, 2020
Changes
In your modeling it might become necessary to change an aspect of the system or model; more formally, you need torequest and manage a change in the defined requirements for the current system. You can represent this change requestusing a Change element, which is a structured comment containing information about the change and the measures takento manage it. The element is rendered as shown.
You can link Changes to model elements that are impacted by the change, using Realize connectors. You can also createa hierarchy of related Changes using Aggregation connectors. Each Change element has a status band at the left end,which is color coded to visually represent the value of the Status field in the element properties. The element has anidentifying C in the top right corner, which you can hide if you prefer not to show it.
You can create Change elements on most types of diagram, although the Maintenance diagram is specifically designedfor displaying and managing them. You can also create your own change-management diagram as a Custom diagram.You can add the Change (and other) elements to the diagram from the Diagram Toolbox, or directly to a Package in theBrowser window.
Add a Change to the model using the Toolbox
Step Action
1 Open the Maintenance or Custom (or other) diagram in which to define the problem.
2 From the 'Custom' or 'Common' pages of the Diagram Toolbox, drag the Change icon onto the diagram.
3 If the Properties window is not already displayed, press Ctrl+2. Record the name and details of theChange, in the Properties window.
Add a Change to the model using the 'New Element' dialog
Step Action
1 Identify the Package in which to record the change, in the Browser window.
Right-click on this Package and select the 'Add Element' option.
2 Complete the fields on the 'New Element' dialog - in the 'Type' field, click on the drop-down arrow andselect 'Change'.
3 When you have created the element, record the name and details of the Change, in the Properties window.
Notes
(c) Sparx Systems 2019 Page 143 of 172 Created with Enterprise Architect

Project Management - Project Management 20 January, 2020
To toggle display of the letter 'C' in the top right corner of the element, select or deselect the 'Show stereotype icon·for requirements' checkbox on the 'Preferences' dialog, 'Objects' page
(c) Sparx Systems 2019 Page 144 of 172 Created with Enterprise Architect
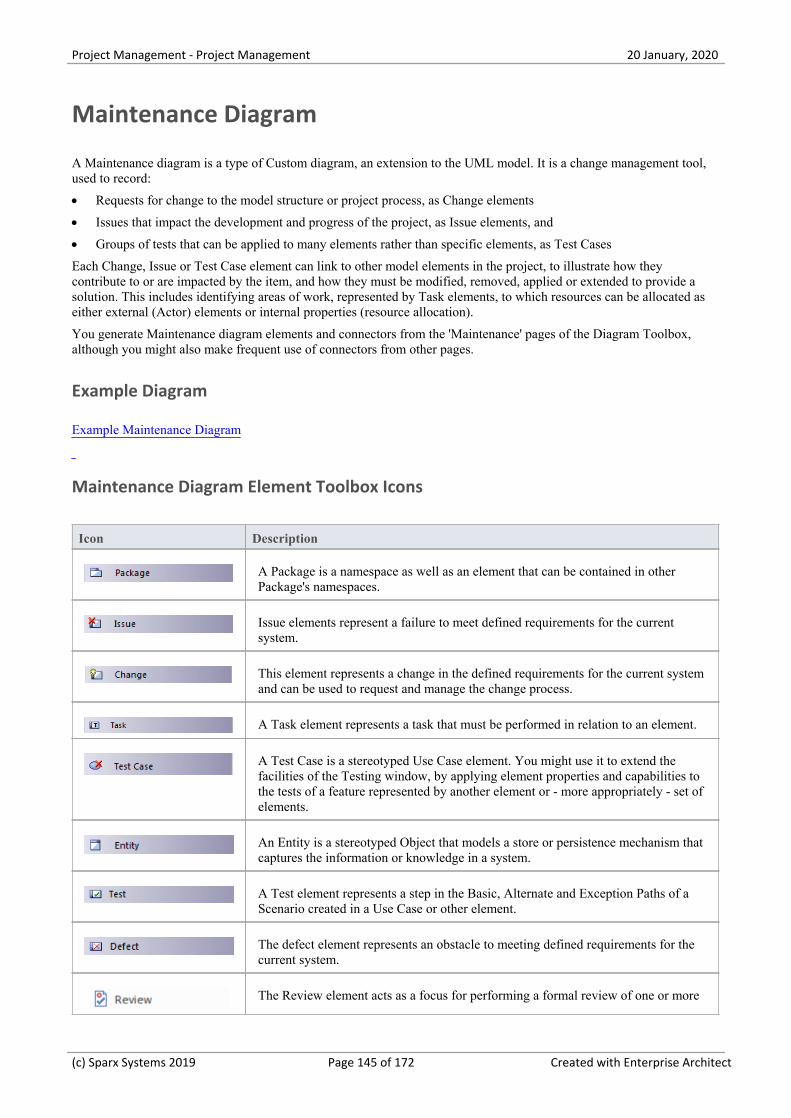
Project Management - Project Management 20 January, 2020
Maintenance Diagram
A Maintenance diagram is a type of Custom diagram, an extension to the UML model. It is a change management tool,used to record:
Requests for change to the model structure or project process, as Change elements·
Issues that impact the development and progress of the project, as Issue elements, and·
Groups of tests that can be applied to many elements rather than specific elements, as Test Cases·
Each Change, Issue or Test Case element can link to other model elements in the project, to illustrate how theycontribute to or are impacted by the item, and how they must be modified, removed, applied or extended to provide asolution. This includes identifying areas of work, represented by Task elements, to which resources can be allocated aseither external (Actor) elements or internal properties (resource allocation).
You generate Maintenance diagram elements and connectors from the 'Maintenance' pages of the Diagram Toolbox,although you might also make frequent use of connectors from other pages.
Example Diagram
Example Maintenance Diagram
Maintenance Diagram Element Toolbox Icons
Icon Description
A Package is a namespace as well as an element that can be contained in otherPackage's namespaces.
Issue elements represent a failure to meet defined requirements for the currentsystem.
This element represents a change in the defined requirements for the current systemand can be used to request and manage the change process.
A Task element represents a task that must be performed in relation to an element.
A Test Case is a stereotyped Use Case element. You might use it to extend thefacilities of the Testing window, by applying element properties and capabilities tothe tests of a feature represented by another element or - more appropriately - set ofelements.
An Entity is a stereotyped Object that models a store or persistence mechanism thatcaptures the information or knowledge in a system.
A Test element represents a step in the Basic, Alternate and Exception Paths of aScenario created in a Use Case or other element.
The defect element represents an obstacle to meeting defined requirements for thecurrent system.
The Review element acts as a focus for performing a formal review of one or more
(c) Sparx Systems 2019 Page 145 of 172 Created with Enterprise Architect
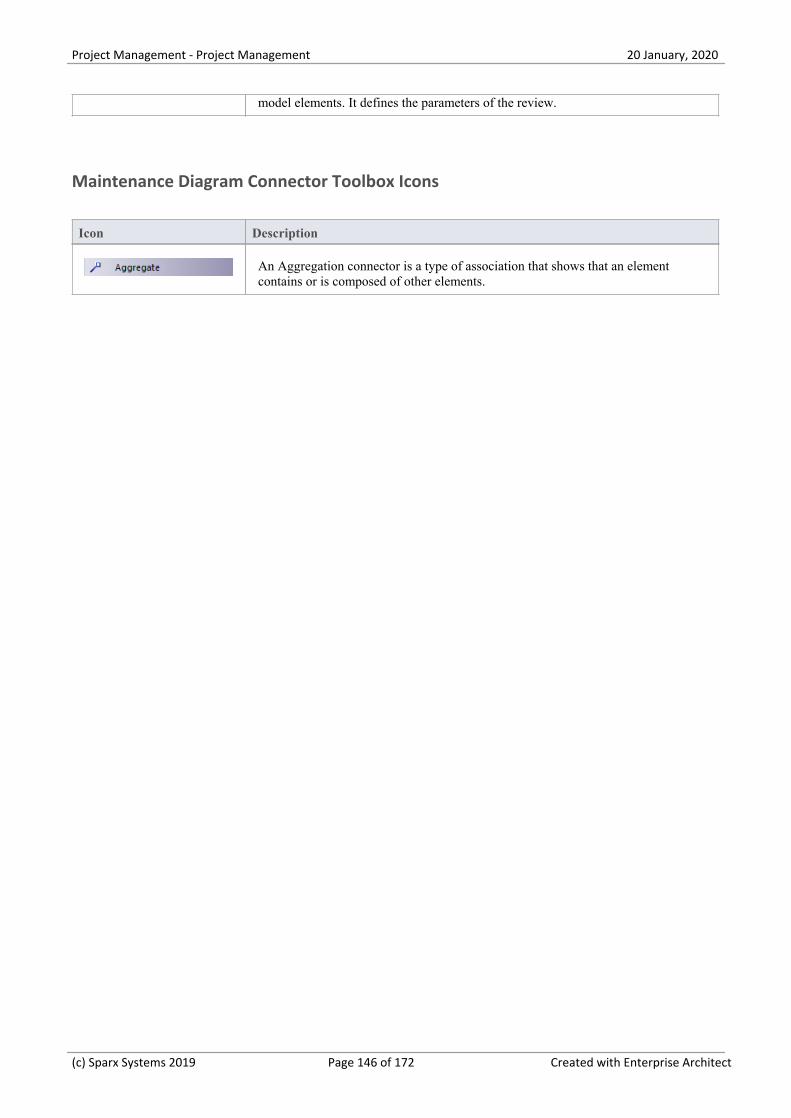
Project Management - Project Management 20 January, 2020
model elements. It defines the parameters of the review.
Maintenance Diagram Connector Toolbox Icons
Icon Description
An Aggregation connector is a type of association that shows that an elementcontains or is composed of other elements.
(c) Sparx Systems 2019 Page 146 of 172 Created with Enterprise Architect
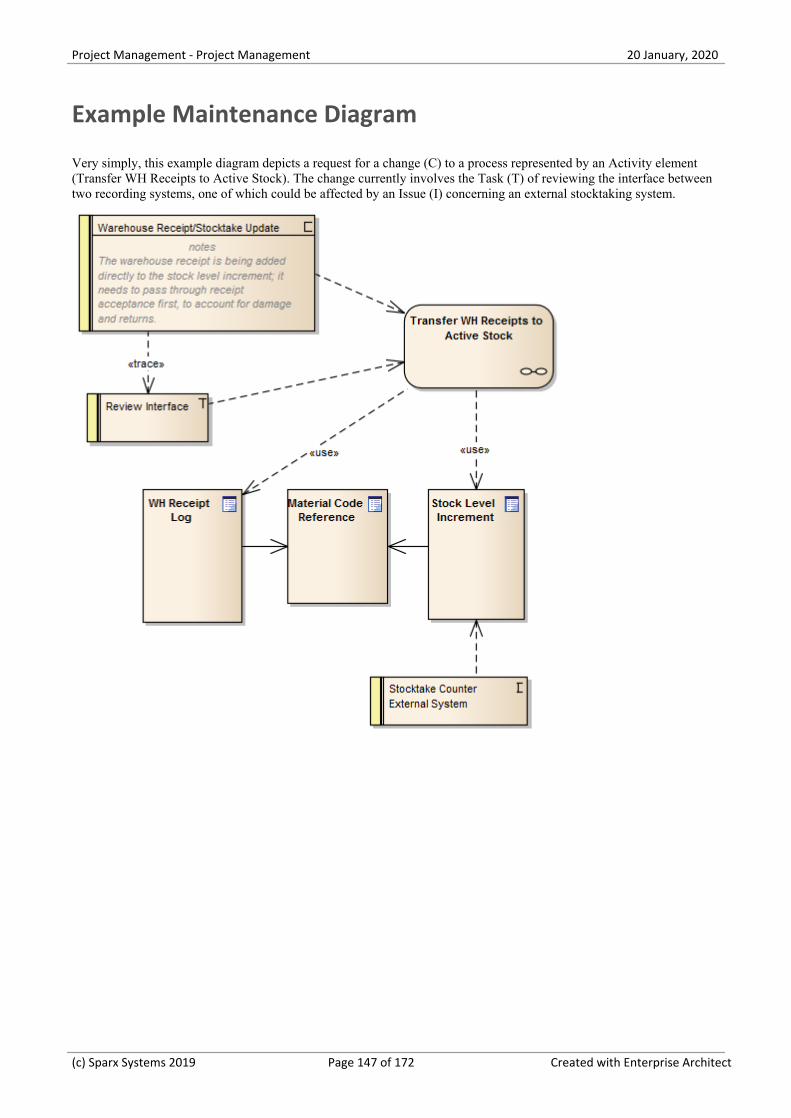
Project Management - Project Management 20 January, 2020
Example Maintenance Diagram
Very simply, this example diagram depicts a request for a change (C) to a process represented by an Activity element(Transfer WH Receipts to Active Stock). The change currently involves the Task (T) of reviewing the interface betweentwo recording systems, one of which could be affected by an Issue (I) concerning an external stocktaking system.
(c) Sparx Systems 2019 Page 147 of 172 Created with Enterprise Architect
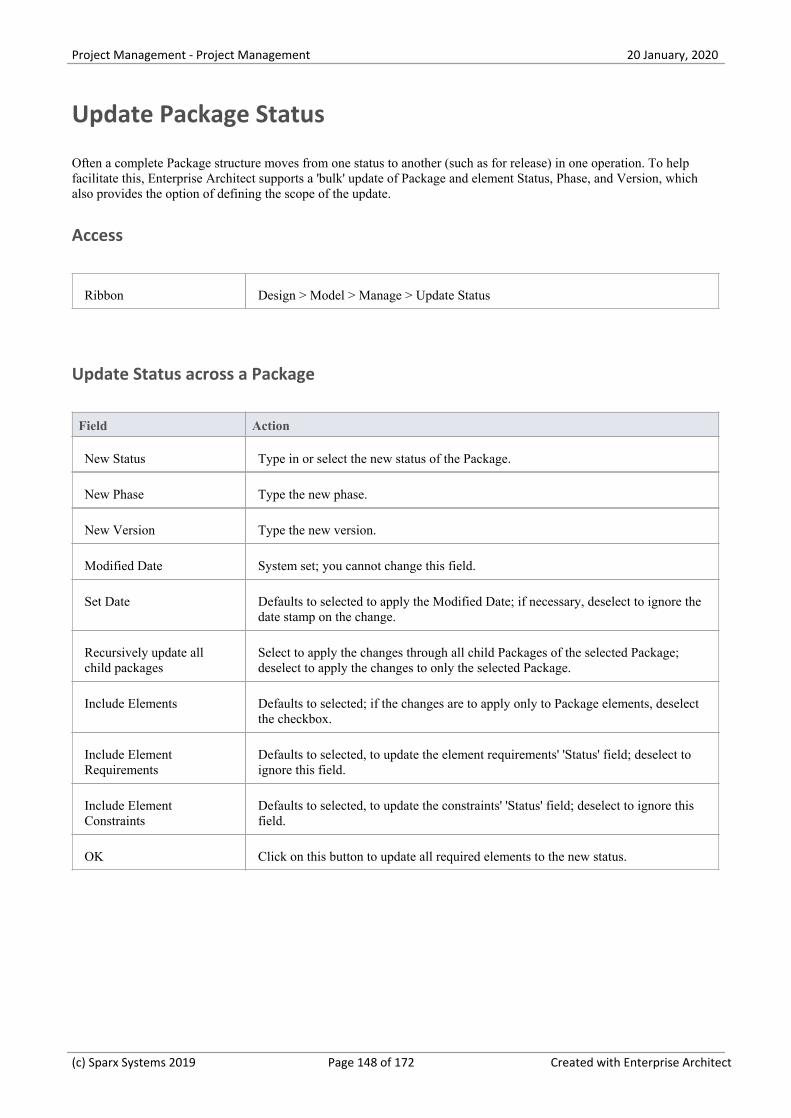
Project Management - Project Management 20 January, 2020
Update Package Status
Often a complete Package structure moves from one status to another (such as for release) in one operation. To helpfacilitate this, Enterprise Architect supports a 'bulk' update of Package and element Status, Phase, and Version, whichalso provides the option of defining the scope of the update.
Access
Ribbon Design > Model > Manage > Update Status
Update Status across a Package
Field Action
New Status Type in or select the new status of the Package.
New Phase Type the new phase.
New Version Type the new version.
Modified Date System set; you cannot change this field.
Set Date Defaults to selected to apply the Modified Date; if necessary, deselect to ignore thedate stamp on the change.
Recursively update allchild packages
Select to apply the changes through all child Packages of the selected Package;deselect to apply the changes to only the selected Package.
Include Elements Defaults to selected; if the changes are to apply only to Package elements, deselectthe checkbox.
Include ElementRequirements
Defaults to selected, to update the element requirements' 'Status' field; deselect toignore this field.
Include ElementConstraints
Defaults to selected, to update the constraints' 'Status' field; deselect to ignore thisfield.
OK Click on this button to update all required elements to the new status.
(c) Sparx Systems 2019 Page 148 of 172 Created with Enterprise Architect
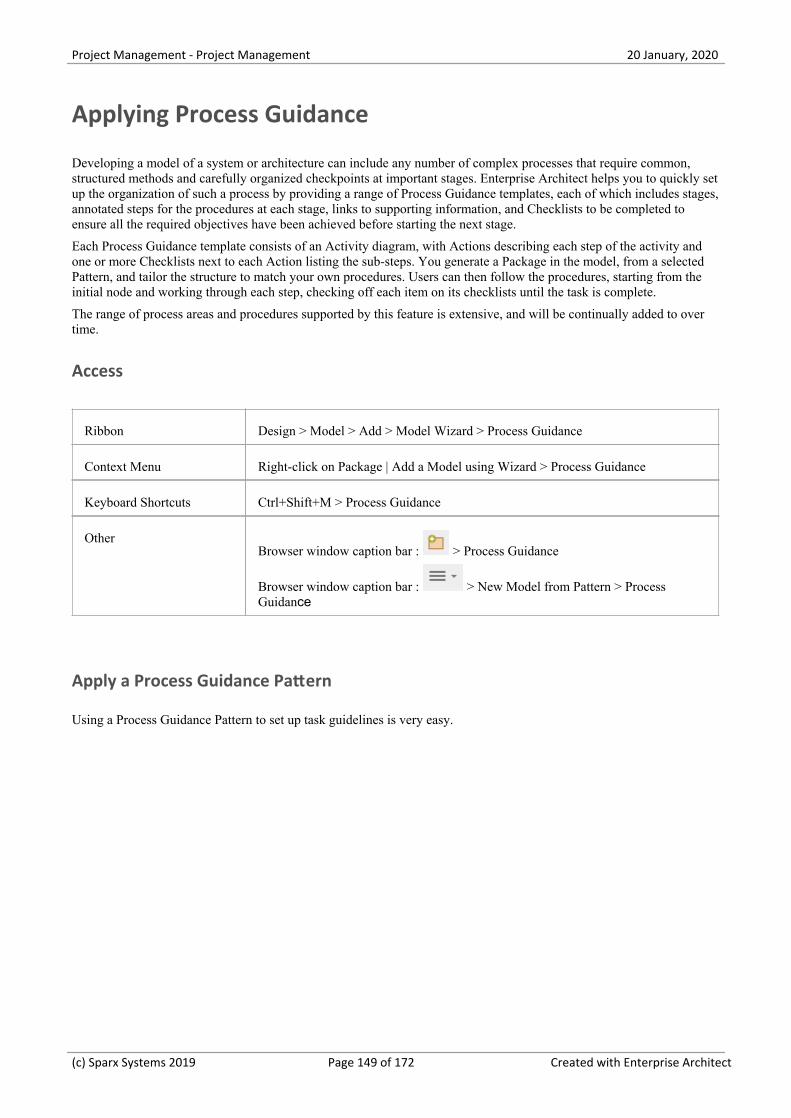
Project Management - Project Management 20 January, 2020
Applying Process Guidance
Developing a model of a system or architecture can include any number of complex processes that require common,structured methods and carefully organized checkpoints at important stages. Enterprise Architect helps you to quickly setup the organization of such a process by providing a range of Process Guidance templates, each of which includes stages,annotated steps for the procedures at each stage, links to supporting information, and Checklists to be completed toensure all the required objectives have been achieved before starting the next stage.
Each Process Guidance template consists of an Activity diagram, with Actions describing each step of the activity andone or more Checklists next to each Action listing the sub-steps. You generate a Package in the model, from a selectedPattern, and tailor the structure to match your own procedures. Users can then follow the procedures, starting from theinitial node and working through each step, checking off each item on its checklists until the task is complete.
The range of process areas and procedures supported by this feature is extensive, and will be continually added to overtime.
Access
Ribbon Design > Model > Add > Model Wizard > Process Guidance
Context Menu Right-click on Package | Add a Model using Wizard > Process Guidance
Keyboard Shortcuts Ctrl+Shift+M > Process Guidance
OtherBrowser window caption bar : > Process Guidance
Browser window caption bar : > New Model from Pattern > ProcessGuidance
Apply a Process Guidance Pattern
Using a Process Guidance Pattern to set up task guidelines is very easy.
(c) Sparx Systems 2019 Page 149 of 172 Created with Enterprise Architect
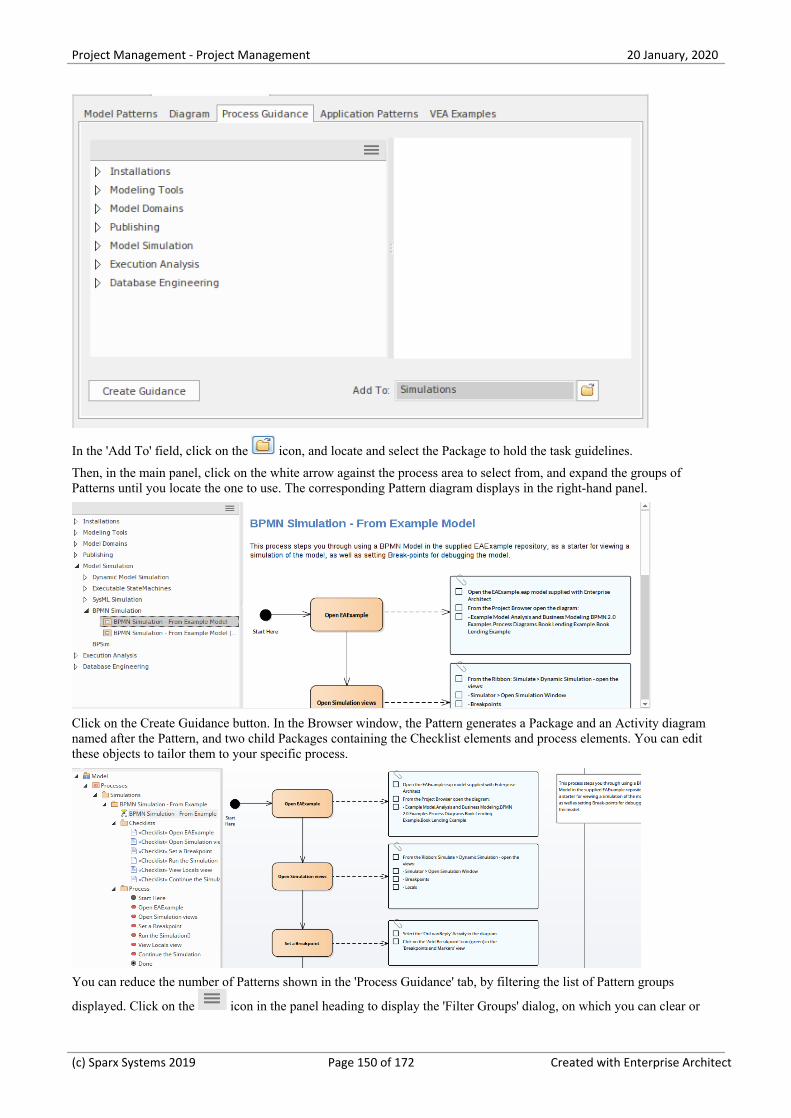
Project Management - Project Management 20 January, 2020
In the 'Add To' field, click on the icon, and locate and select the Package to hold the task guidelines.
Then, in the main panel, click on the white arrow against the process area to select from, and expand the groups ofPatterns until you locate the one to use. The corresponding Pattern diagram displays in the right-hand panel.
Click on the Create Guidance button. In the Browser window, the Pattern generates a Package and an Activity diagramnamed after the Pattern, and two child Packages containing the Checklist elements and process elements. You can editthese objects to tailor them to your specific process.
You can reduce the number of Patterns shown in the 'Process Guidance' tab, by filtering the list of Pattern groups
displayed. Click on the icon in the panel heading to display the 'Filter Groups' dialog, on which you can clear or
(c) Sparx Systems 2019 Page 150 of 172 Created with Enterprise Architect
Project Management - Project Management 20 January, 2020
select checkboxes against each of the seven Pattern groups to show or hide them on the tab.
(c) Sparx Systems 2019 Page 151 of 172 Created with Enterprise Architect
Project Management - Project Management 20 January, 2020
Project Issues
You can record and review issues - events, occurrences and situations that impact on project development and delivery -against the current project using the Project Issues view and its 'Issue Detail' dialog . For each Issue, you record thedescription, date, owner and status. You can also generate a document report on the issue items.
Access
Ribbon Construct > Project Management > Issues-Tasks > Project Issues
Operations
Operation
Add, delete and modify Issues using the 'Issue Details' dialog.
Generate and view a rich text format report of your issue list
Notes
You can transport these issue definitions between models, using the 'Configure > Model > Transfer > Export·Reference Data' and 'Import Reference Data' ribbon options
To print out the currently displayed items, select the 'Print List' context menu option·
You can re-organize the display of the listed tasks using the List Header facilities for reported information·
In the Corporate, Unified and Ultimate editions of Enterprise Architect, if security is enabled you must have·'Manage Issues' permission to update and delete Issues records
(c) Sparx Systems 2019 Page 152 of 172 Created with Enterprise Architect
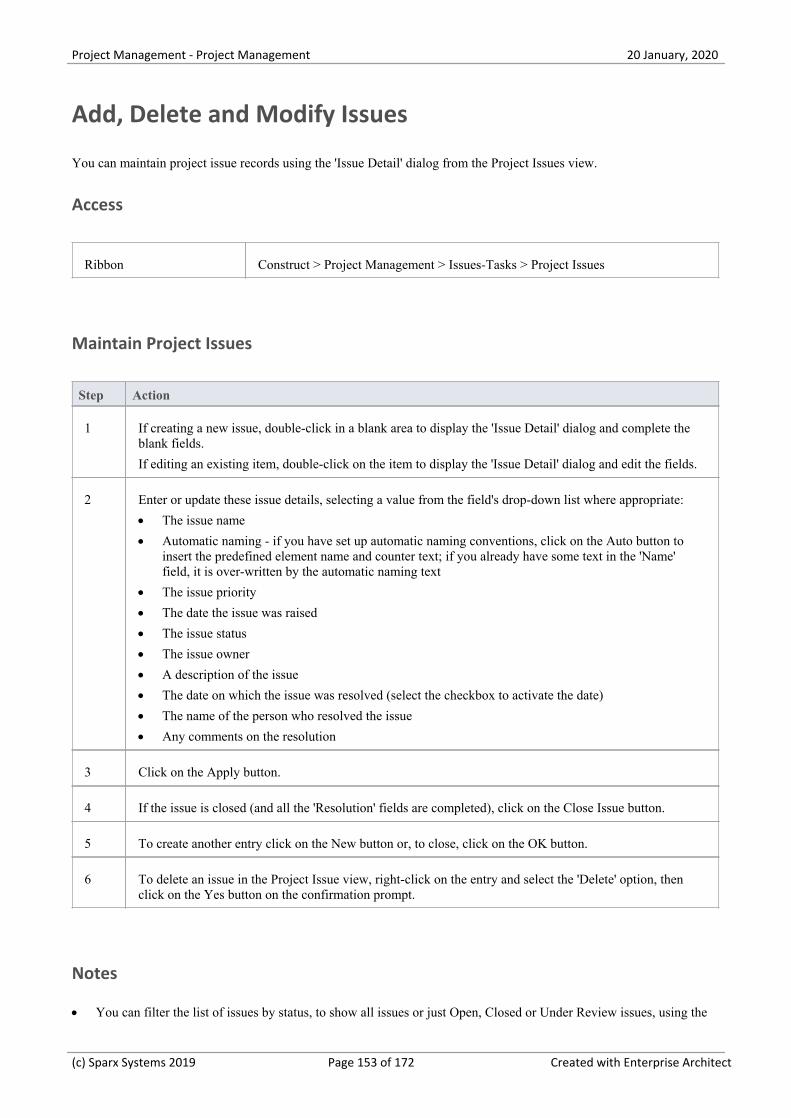
Project Management - Project Management 20 January, 2020
Add, Delete and Modify Issues
You can maintain project issue records using the 'Issue Detail' dialog from the Project Issues view.
Access
Ribbon Construct > Project Management > Issues-Tasks > Project Issues
Maintain Project Issues
Step Action
1 If creating a new issue, double-click in a blank area to display the 'Issue Detail' dialog and complete theblank fields.
If editing an existing item, double-click on the item to display the 'Issue Detail' dialog and edit the fields.
2 Enter or update these issue details, selecting a value from the field's drop-down list where appropriate:
The issue name·
Automatic naming - if you have set up automatic naming conventions, click on the Auto button to·insert the predefined element name and counter text; if you already have some text in the 'Name'field, it is over-written by the automatic naming text
The issue priority·
The date the issue was raised·
The issue status·
The issue owner·
A description of the issue·
The date on which the issue was resolved (select the checkbox to activate the date)·
The name of the person who resolved the issue·
Any comments on the resolution·
3 Click on the Apply button.
4 If the issue is closed (and all the 'Resolution' fields are completed), click on the Close Issue button.
5 To create another entry click on the New button or, to close, click on the OK button.
6 To delete an issue in the Project Issue view, right-click on the entry and select the 'Delete' option, thenclick on the Yes button on the confirmation prompt.
Notes
You can filter the list of issues by status, to show all issues or just Open, Closed or Under Review issues, using the·
(c) Sparx Systems 2019 Page 153 of 172 Created with Enterprise Architect
Project Management - Project Management 20 January, 2020
'Set term filter' context menu option
(c) Sparx Systems 2019 Page 154 of 172 Created with Enterprise Architect
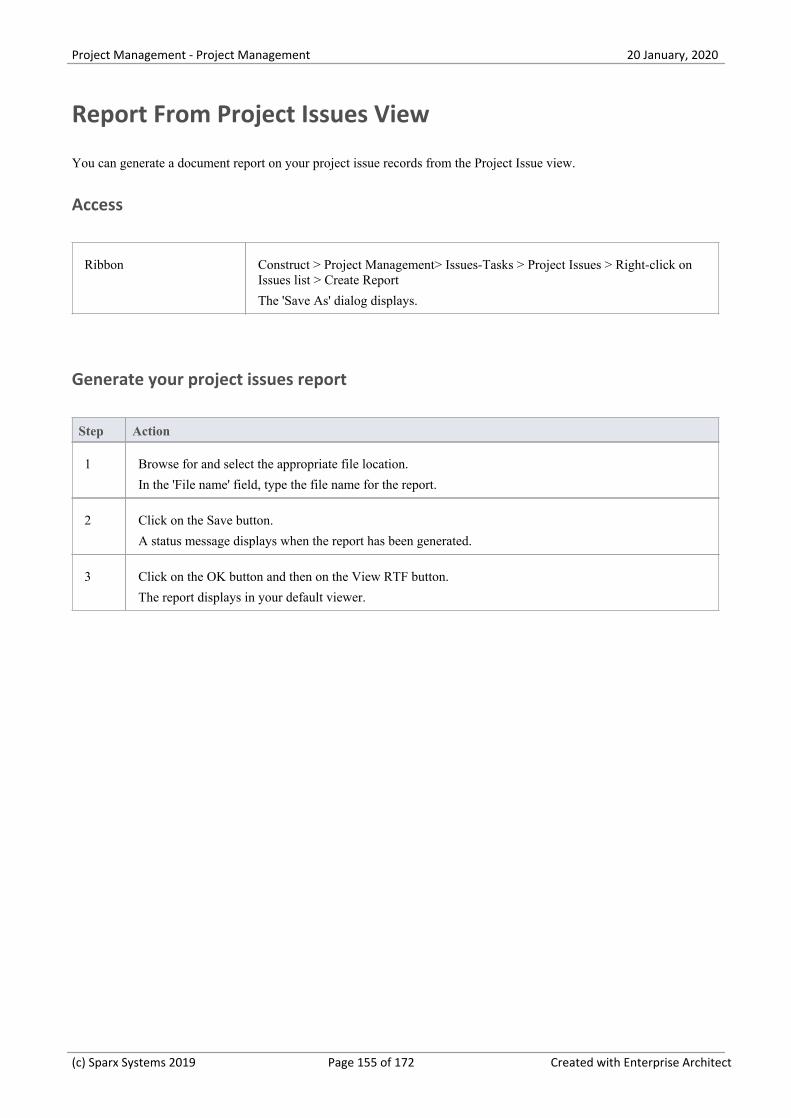
Project Management - Project Management 20 January, 2020
Report From Project Issues View
You can generate a document report on your project issue records from the Project Issue view.
Access
Ribbon Construct > Project Management> Issues-Tasks > Project Issues > Right-click onIssues list > Create Report
The 'Save As' dialog displays.
Generate your project issues report
Step Action
1 Browse for and select the appropriate file location.
In the 'File name' field, type the file name for the report.
2 Click on the Save button.
A status message displays when the report has been generated.
3 Click on the OK button and then on the View RTF button.
The report displays in your default viewer.
(c) Sparx Systems 2019 Page 155 of 172 Created with Enterprise Architect
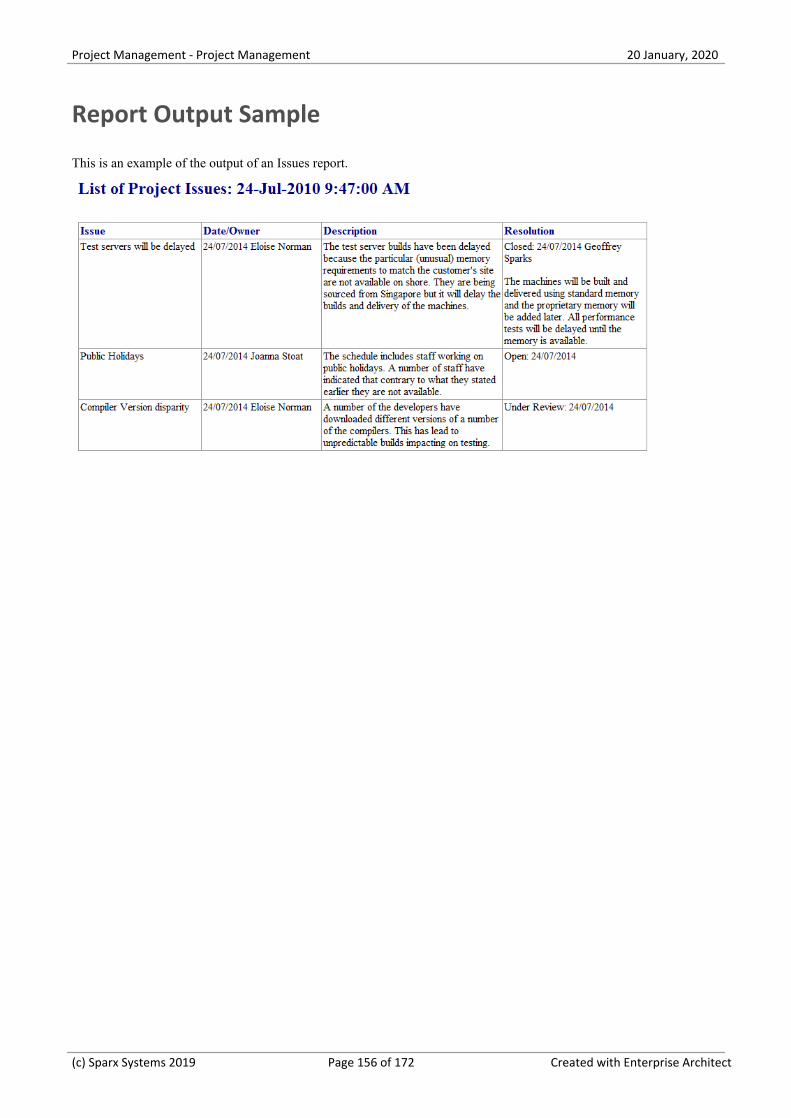
Project Management - Project Management 20 January, 2020
Report Output Sample
This is an example of the output of an Issues report.
(c) Sparx Systems 2019 Page 156 of 172 Created with Enterprise Architect
Project Management - Project Management 20 January, 2020
Project Tasks
The Project Tasks view provides a convenient 'To Do' list of major project work items that are not recorded elsewhere. Itcan be used to track events such as requests or corrections.
Access
Ribbon Construct > Project Management > Issues-Tasks > Project Tasks
Notes
Right-click on the list to view the context menu, and select to add, modify or delete tasks, or to set a status filter·
You can re-organize the display of the listed tasks using the List Header facilities for reported information·
To print out the currently displayed items, select the 'Print List' context menu option·
You can transport task definitions between models using the 'Configure > Model > Transfer > Export Reference·Data' and 'Import Reference Data' options
You can add or work on an item in the Project Tasks view by right-clicking (context menu) or double-clicking on·the blank or completed item line
The Project Tasks view context menu has options for filtering tasks and issues by status; you can also rearrange the·sort-order by clicking in the title bar of the column that the items are to be indexed on
(c) Sparx Systems 2019 Page 157 of 172 Created with Enterprise Architect
Project Management - Project Management 20 January, 2020
Add, Modify and Delete Tasks
To add, edit and delete project tasks you can work in either the Project Tasks view, or the Project Calendar.
Access
Ribbon Construct > Project Management > Issues & Tasks > Project Tasks
Start > Collaborate > Calendar > Project Tasks mode
Maintain Tasks
Step Action
1 If creating a new task:
Double-click in a blank area of the Project Tasks view, or on a cell of the Calendar·
If editing an existing item:
Double-click on the item on the Project Tasks view or Calendar·
The 'Task Detail' dialog displays.
2 Enter or update these details of the task, selecting a value from the field's drop-down list whereappropriate:
The task name·
Automatic naming - if you have set up automatic naming conventions, click on the Auto button to·insert the predefined element name and counter text; if you already have some text in the 'Name'field, it is over-written by the automatic naming text
The task type·
The task owner·
The expected start and end date for the task (select the checkboxes to activate the dates)·
The current status of the task·
The person this task has been assigned to·
The task priority, such as high, medium, low or undetermined·
The expected total time for the task and the actual time expended (in complete units; the type of unit·must be agreed across the project)
The percentage completion·
The phase associated with this task·
A description of the task·
Any progress history appropriate to the task·
3 Click on the Apply button.
4 To create another entry click on the New button or, to close, click on the OK button.
5 To delete a task, in the Project Tasks view:
(c) Sparx Systems 2019 Page 158 of 172 Created with Enterprise Architect
Project Management - Project Management 20 January, 2020
Right-click on the task and select the 'Delete' option1.
Click on the Yes button on the confirmation prompt2.
Notes
'Owner' and 'Assigned' fields are filled from the Project Authors, Resources and Project Clients·
(c) Sparx Systems 2019 Page 159 of 172 Created with Enterprise Architect

Project Management - Project Management 20 January, 2020
Use Case Estimation
Project estimation is the task of working out how much time and effort is required to build and deploy a solution.
The Use Case metrics facility in Enterprise Architect provides a starting point for estimating project effort; using thisfacility you can get a rough measure of the complexity of a system and some indication of the effort required toimplement the model. Like all estimation techniques, Use Case metrics requires some experience with previous projectsto 'calibrate' the process.
There is additional information available on Use Case metrics on the Sparx Systems website.
Access
Ribbon Configure > Reference Data > Model Types > Estimation Factors
Processes
Process Description
Calibrating These values must be carefully calibrated in order to gain the best possibleestimates:
Technical Complexity Factors, which are values that attempt to quantify the·difficulty and complexity of the work in hand
Environment Complexity Factors, which are values that attempt to quantify·non-technical complexities such as team experience and knowledge
Default Hour Rate, which sets the number of hours per Use Case point·
Estimating Once you have entered all the calibration values, you can estimate the projecttimescale through the 'Use Case Metrics' tab of the QA Reports View.
The estimation process also draws on information on Use Cases recorded on the'Resource Allocation' tab.
(c) Sparx Systems 2019 Page 160 of 172 Created with Enterprise Architect
Project Management - Project Management 20 January, 2020
Technical Complexity Factors
Technical Complexity Factors (TCFs) are used in the Use Case Metrics estimation technique.
The EABase.eap model contains a default set of TCFs, which you can add to or modify using the 'Estimation Factors'dialog. This set of factors should include all factors that could affect the technical complexity of the project environment.
Access
Ribbon Configure > Reference Data > Model Types > Estimation Factors > TechnicalComplexity Factors
Maintain Technical Complexity Factors
Step Action
1 On the 'Technical Complexity Factors' tab, either:
Click on the New button to add another TCF, or·
Click on the required factor in the 'Defined Technical Types' list to edit it (go to step 3)·
2 In the 'Factor Number' field, type the appropriate TCF number.
3 In the 'Description' field, type or edit the TCF description.
4 In the 'Weight' field, type or edit the technical complexity weighting.
This indicates how much technical complexity you assign to a factor; for example, 'the system is to bedeveloped in ADA' might warrant a higher weight than 'the system is to be a shell script'.
5 In the 'Value' field, type or edit a value representing the degree of influence the factor has on the project.
As a suggested gauge:
0 indicates no influence·
3 indicates average influence·
5 indicates strong influence·
6 Click on the Save button.
7 Examine the 'Defined Technical Types' list, and scroll across it to show the 'Ex Value' column (Weight xValue).
The summed Ex Values yield the 'Unadjusted TCF value' (at the bottom of the dialog).
The 'Unadjusted TCF value' is combined with the Environment Complexity Factors to skew the overallcomplexity up or down, depending on the level of technical complexity and the corresponding level ofenvironmental support.
(c) Sparx Systems 2019 Page 161 of 172 Created with Enterprise Architect
Project Management - Project Management 20 January, 2020
Notes
The TCF Weight evaluates its respective factor, but is irrelevant to a project; the 'Value' field assesses each factor's·role within a project and, for most purposes, is the only field requiring adjustment
The supplied factors and their associated weights are defined by the Use Case Points Method, although they can be·adjusted to suit a project's specific requirements
You can transport the Technical Complexity Factors between models, using the 'Configure > Model > Transfer >·Export Reference Data' and 'Import Reference Data' ribbon options
(c) Sparx Systems 2019 Page 162 of 172 Created with Enterprise Architect
Project Management - Project Management 20 January, 2020
Environment Complexity Factors
Environment Complexity Factors (ECFs) are used in the Use Case Metrics estimation technique.
The EABase.eap model contains a default set of ECFs, which you can add to or modify using the 'Estimation Factors'dialog. This set of factors should include all factors that could affect the general design and development environment,including team experience and knowledge, team size, expertise and other non-functional environmental factors.
Access
Ribbon Configure > Reference Data > Model Types > Estimation Factors > EnvironmentComplexity Factors
Maintain Environment Complexity Factors
Step Action
1 On the 'Environment Complexity Factors' tab, either:
Click on the New button to add another ECF, or·
Click on the required factor in the 'Defined Environment Types' list to edit it (go to step 3)·
2 In the 'Factor Number' field, type the appropriate ECF number.
3 In the 'Description' field, type or edit the ECF description.
4 In the 'Weight' field, type or edit the environment complexity weighting.
This indicates how much complexity you assign to a factor.
5 In the 'Value' field, type or edit a value representing the degree of influence the factor has on the project.
As a suggested gauge:
0 indicates no influence·
3 indicates average influence·
5 indicates strong influence·
6 Click on the Save button.
7 Examine the 'Defined Environment Types' list, and scroll across it to show the 'Ex Value' column (Weightx Value).
The summed Ex Values yield the 'Unadjusted ECF' value (at the bottom of the dialog).
The Unadjusted ECF value is combined with the Technical Complexity Factors to skew the overallcomplexity up or down, depending on the level of technical complexity and the corresponding level ofenvironmental support.
(c) Sparx Systems 2019 Page 163 of 172 Created with Enterprise Architect

Project Management - Project Management 20 January, 2020
Notes
The ECF Weight evaluates its respective factor, but is irrelevant to a project; the 'Value' field assesses each factor's·role within a project and, for most purposes, is the only field requiring adjustment
The supplied factors and their associated weights are defined by the Use Case Points Method, although they can be·adjusted to suit a project's specific requirements
You can transport the Environment Complexity Factors between models, using the 'Configure > Model > Transfer >·Export Reference Data' and 'Import Reference Data' ribbon options
(c) Sparx Systems 2019 Page 164 of 172 Created with Enterprise Architect
Project Management - Project Management 20 January, 2020
Default Hours
Setting an hourly rate is the most difficult factor in an accurate estimation. Typical ranges can vary from 10 to 30 hoursper Use Case point.
Studying the Use Case Points Method, from which this variable is defined, can help you to understand its role in theestimation and facilitate selection of a suitable initial value.
The best way to estimate this value is through analysis of previous completed projects. By calculating the projectestimation on a completed project for which the Use Cases and environment are configured within Enterprise Architect,you can adjust the hour rate to render an appropriate value for your unique work environment.
Access
Ribbon Configure > Reference Data > Model Types > Estimation Factors > Default HourRate
Set the default hour rate per adjusted Use Case point
Step Action
1 In the 'Duration' field, type the number of hours per Use Case Point.
2 In the 'Hourly Rate' field, type the cost per hour.
3 Click on the Close button.
Notes
The values you enter are stored as local settings on your computer only·
This option is also active in the 'Lite', read-only version of Enterprise Architect·
(c) Sparx Systems 2019 Page 165 of 172 Created with Enterprise Architect
Project Management - Project Management 20 January, 2020
Estimating Project Size
Enterprise Architect uses a simple estimation technique based on the established:
Number of Use Cases to be built·
Difficulty level of those Use Cases·
Project environment factors and·
Build parameters·
This technique is of value only once you have developed a couple of known projects to use as a baseline. Please DONOT use the provided 'guesstimates' as a real world measure until you have some real world base lines to measureagainst.
Access
Ribbon Click on the required Package in the Browser window, then:
Construct > Project Management > QA > QA Reports > Use Case Metrics
Complete a Use Case Metrics Estimation
Field Action
Root Package Confirm the root Package in the hierarchy.
All Use Cases under this Package could potentially be included in the report.
Reload Re-run the load from the selected Package, usually after you change the filtercriteria.
Phase like Include Use Cases with a phase that matches the wildcard value in the field.
Use * to match any characters; for example, 1.* for 1.1 and 1.2.
Keyword like Include Use Cases with a keyword that matches the wildcard value in the field.
Use * to match any characters.
Bookmarked Include all Use Cases, or only those that are tagged, or those that are not tagged.
Use Cases Check the total count of Use Cases in the estimate.
The Use Cases and their parameters are listed in the panel underneath this field.
Include Actors Select to include Actors in the estimate.
Technical ComplexityFactor
Review the parameters that describe the degree of technical complexity of theproject.
While the 'Unadjusted TCF Value' comes from the 'Technical Complexity Factors'tab of the 'Estimation Factors' dialog, the other values compose the Use Case PointsMethod formula.
(c) Sparx Systems 2019 Page 166 of 172 Created with Enterprise Architect
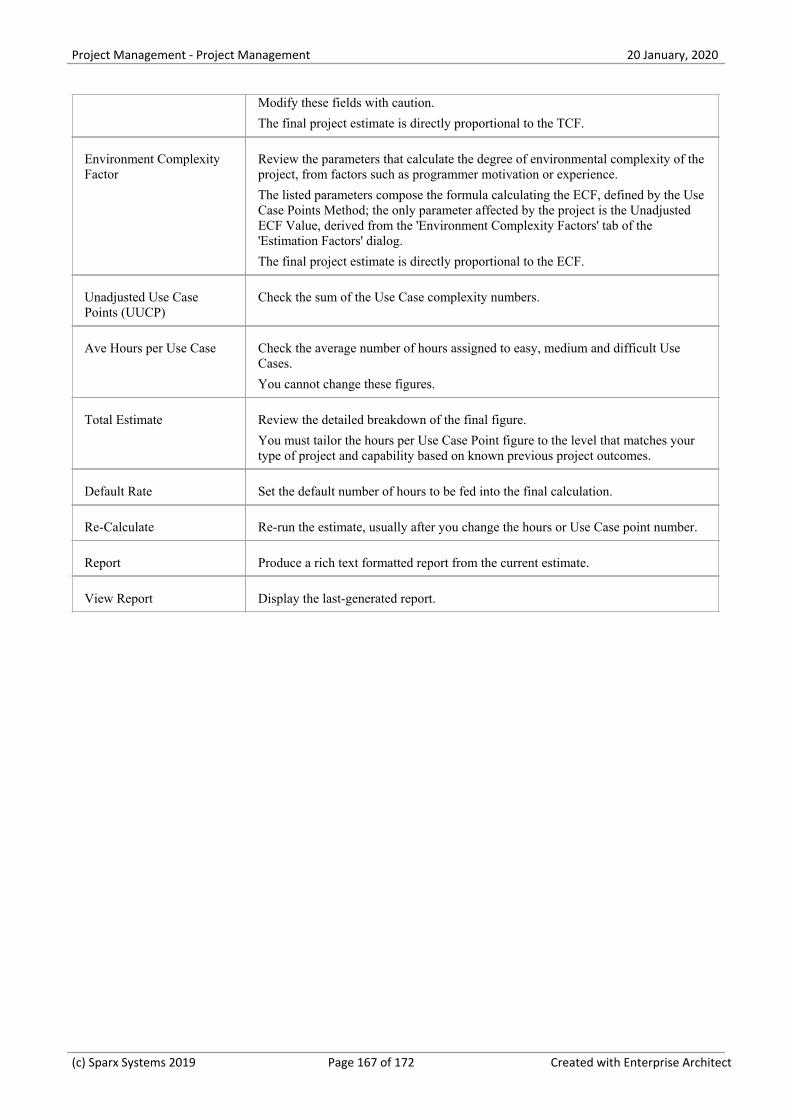
Project Management - Project Management 20 January, 2020
Modify these fields with caution.
The final project estimate is directly proportional to the TCF.
Environment ComplexityFactor
Review the parameters that calculate the degree of environmental complexity of theproject, from factors such as programmer motivation or experience.
The listed parameters compose the formula calculating the ECF, defined by the UseCase Points Method; the only parameter affected by the project is the UnadjustedECF Value, derived from the 'Environment Complexity Factors' tab of the'Estimation Factors' dialog.
The final project estimate is directly proportional to the ECF.
Unadjusted Use CasePoints (UUCP)
Check the sum of the Use Case complexity numbers.
Ave Hours per Use Case Check the average number of hours assigned to easy, medium and difficult UseCases.
You cannot change these figures.
Total Estimate Review the detailed breakdown of the final figure.
You must tailor the hours per Use Case Point figure to the level that matches yourtype of project and capability based on known previous project outcomes.
Default Rate Set the default number of hours to be fed into the final calculation.
Re-Calculate Re-run the estimate, usually after you change the hours or Use Case point number.
Report Produce a rich text formatted report from the current estimate.
View Report Display the last-generated report.
(c) Sparx Systems 2019 Page 167 of 172 Created with Enterprise Architect
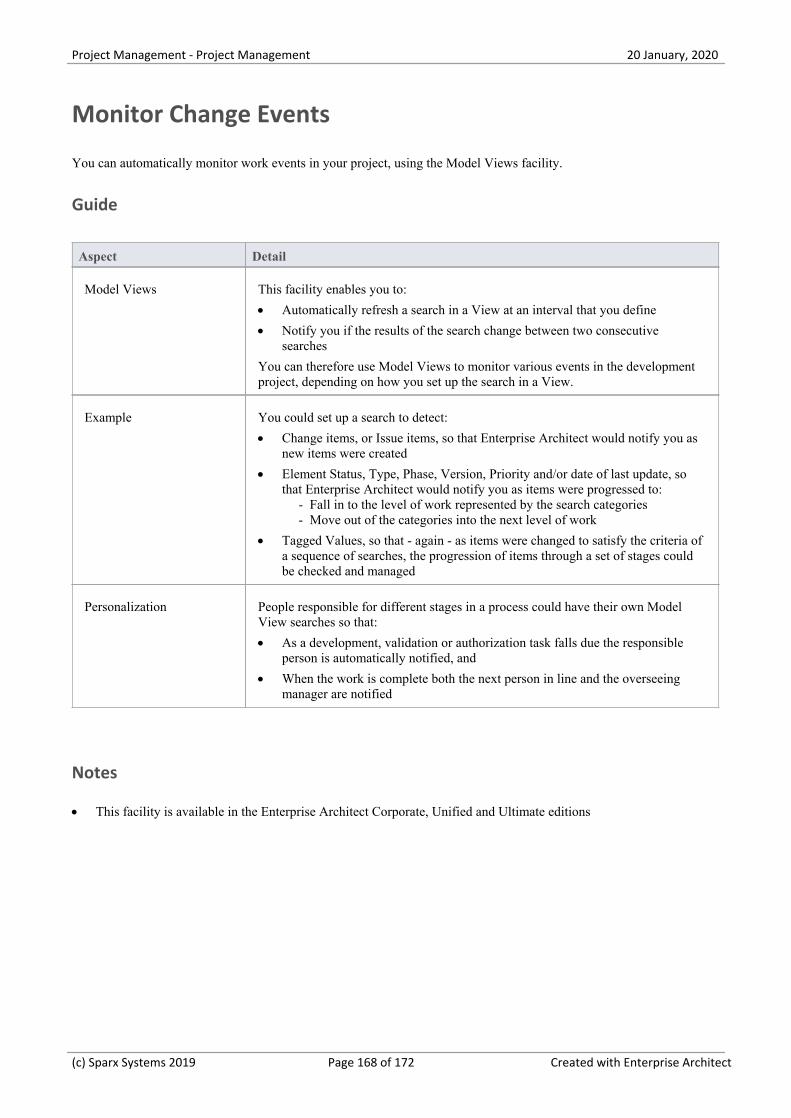
Project Management - Project Management 20 January, 2020
Monitor Change Events
You can automatically monitor work events in your project, using the Model Views facility.
Guide
Aspect Detail
Model Views This facility enables you to:
Automatically refresh a search in a View at an interval that you define·
Notify you if the results of the search change between two consecutive·searches
You can therefore use Model Views to monitor various events in the developmentproject, depending on how you set up the search in a View.
Example You could set up a search to detect:
Change items, or Issue items, so that Enterprise Architect would notify you as·new items were created
Element Status, Type, Phase, Version, Priority and/or date of last update, so·that Enterprise Architect would notify you as items were progressed to: - Fall in to the level of work represented by the search categories - Move out of the categories into the next level of work
Tagged Values, so that - again - as items were changed to satisfy the criteria of·a sequence of searches, the progression of items through a set of stages couldbe checked and managed
Personalization People responsible for different stages in a process could have their own ModelView searches so that:
As a development, validation or authorization task falls due the responsible·person is automatically notified, and
When the work is complete both the next person in line and the overseeing·manager are notified
Notes
This facility is available in the Enterprise Architect Corporate, Unified and Ultimate editions·
(c) Sparx Systems 2019 Page 168 of 172 Created with Enterprise Architect
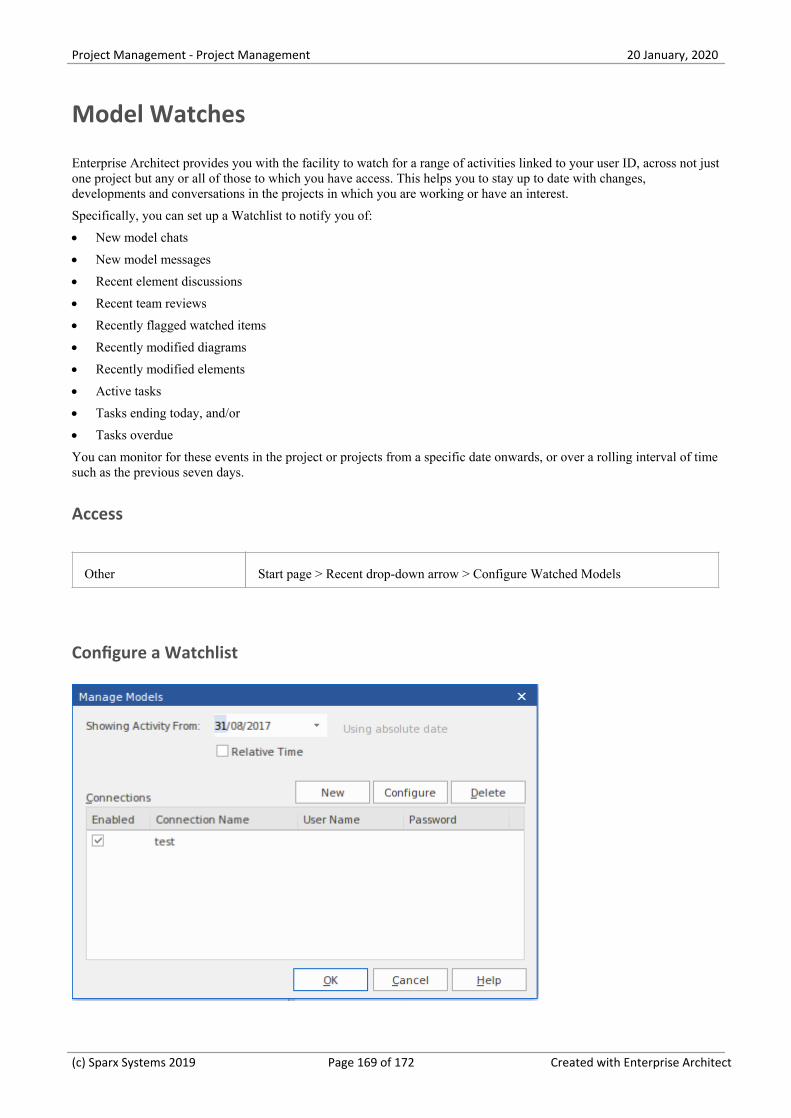
Project Management - Project Management 20 January, 2020
Model Watches
Enterprise Architect provides you with the facility to watch for a range of activities linked to your user ID, across not justone project but any or all of those to which you have access. This helps you to stay up to date with changes,developments and conversations in the projects in which you are working or have an interest.
Specifically, you can set up a Watchlist to notify you of:
New model chats·
New model messages·
Recent element discussions·
Recent team reviews·
Recently flagged watched items·
Recently modified diagrams·
Recently modified elements·
Active tasks·
Tasks ending today, and/or·
Tasks overdue·
You can monitor for these events in the project or projects from a specific date onwards, or over a rolling interval of timesuch as the previous seven days.
Access
Other Start page > Recent drop-down arrow > Configure Watched Models
Configure a Watchlist
(c) Sparx Systems 2019 Page 169 of 172 Created with Enterprise Architect
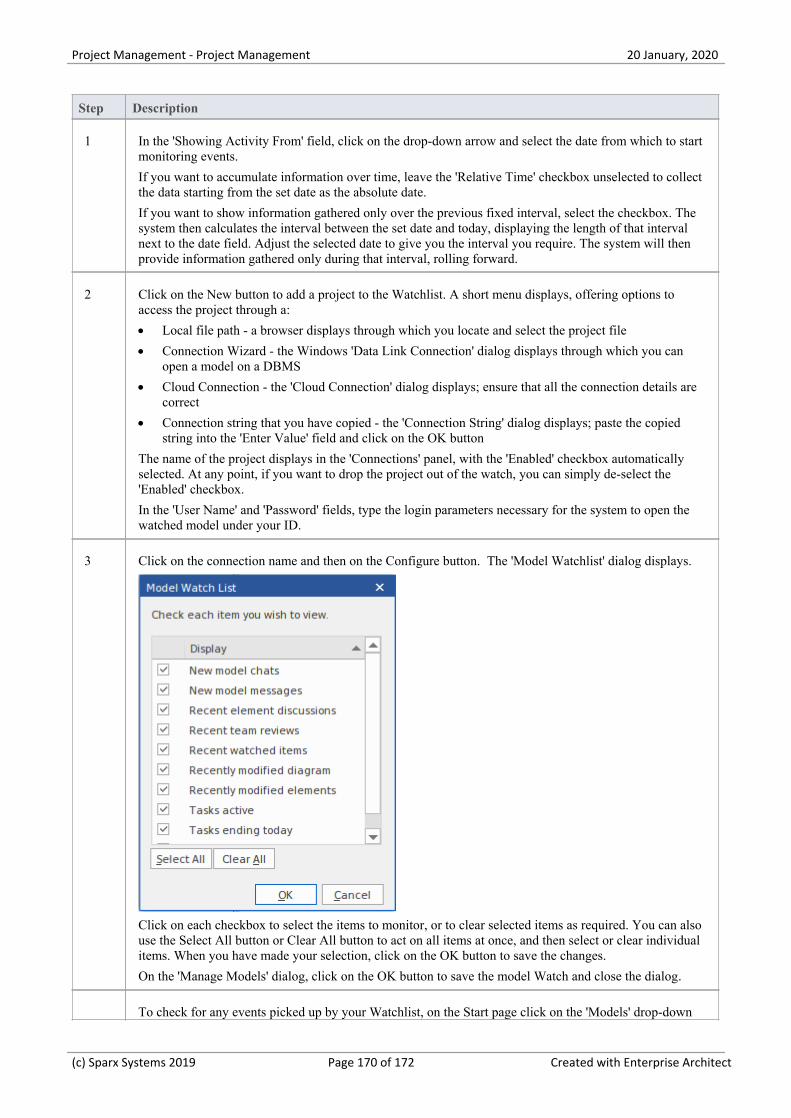
Project Management - Project Management 20 January, 2020
Step Description
1 In the 'Showing Activity From' field, click on the drop-down arrow and select the date from which to startmonitoring events.
If you want to accumulate information over time, leave the 'Relative Time' checkbox unselected to collectthe data starting from the set date as the absolute date.
If you want to show information gathered only over the previous fixed interval, select the checkbox. Thesystem then calculates the interval between the set date and today, displaying the length of that intervalnext to the date field. Adjust the selected date to give you the interval you require. The system will thenprovide information gathered only during that interval, rolling forward.
2 Click on the New button to add a project to the Watchlist. A short menu displays, offering options toaccess the project through a:
Local file path - a browser displays through which you locate and select the project file·
Connection Wizard - the Windows 'Data Link Connection' dialog displays through which you can·open a model on a DBMS
Cloud Connection - the 'Cloud Connection' dialog displays; ensure that all the connection details are·correct
Connection string that you have copied - the 'Connection String' dialog displays; paste the copied·string into the 'Enter Value' field and click on the OK button
The name of the project displays in the 'Connections' panel, with the 'Enabled' checkbox automaticallyselected. At any point, if you want to drop the project out of the watch, you can simply de-select the'Enabled' checkbox.
In the 'User Name' and 'Password' fields, type the login parameters necessary for the system to open thewatched model under your ID.
3 Click on the connection name and then on the Configure button. The 'Model Watchlist' dialog displays.
Click on each checkbox to select the items to monitor, or to clear selected items as required. You can alsouse the Select All button or Clear All button to act on all items at once, and then select or clear individualitems. When you have made your selection, click on the OK button to save the changes.
On the 'Manage Models' dialog, click on the OK button to save the model Watch and close the dialog.
To check for any events picked up by your Watchlist, on the Start page click on the 'Models' drop-down
(c) Sparx Systems 2019 Page 170 of 172 Created with Enterprise Architect
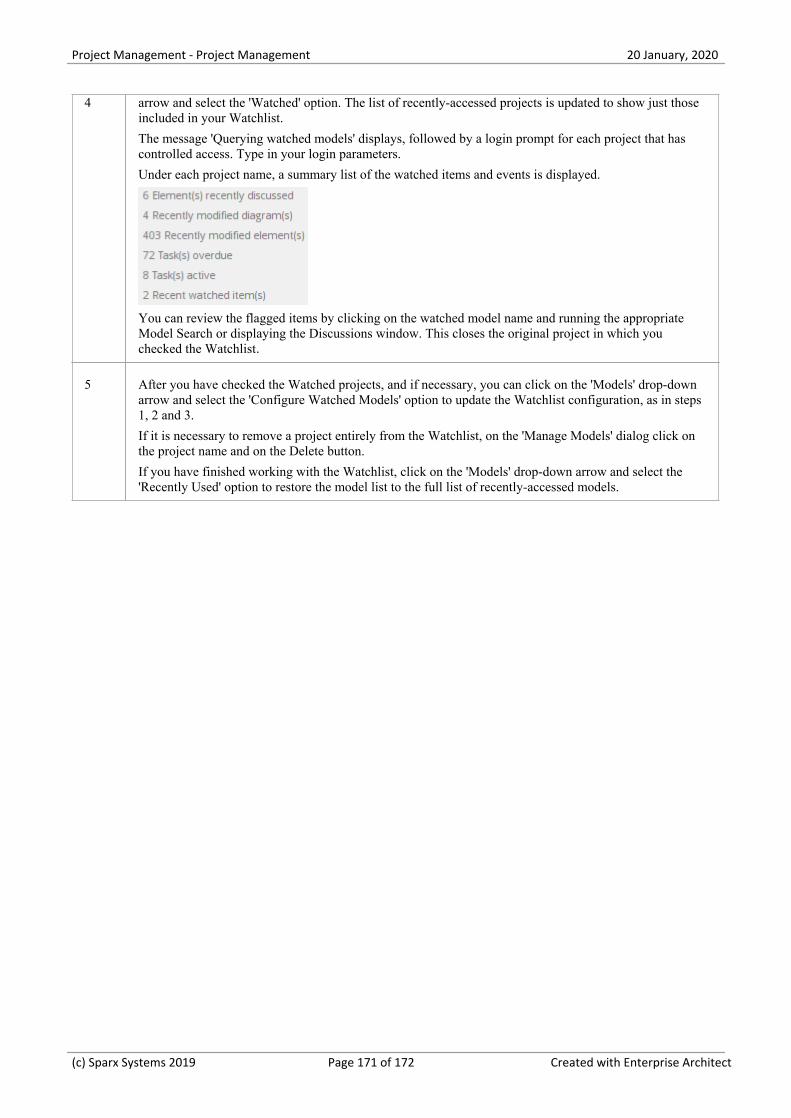
Project Management - Project Management 20 January, 2020
4 arrow and select the 'Watched' option. The list of recently-accessed projects is updated to show just thoseincluded in your Watchlist.
The message 'Querying watched models' displays, followed by a login prompt for each project that hascontrolled access. Type in your login parameters.
Under each project name, a summary list of the watched items and events is displayed.
You can review the flagged items by clicking on the watched model name and running the appropriateModel Search or displaying the Discussions window. This closes the original project in which youchecked the Watchlist.
5 After you have checked the Watched projects, and if necessary, you can click on the 'Models' drop-downarrow and select the 'Configure Watched Models' option to update the Watchlist configuration, as in steps1, 2 and 3.
If it is necessary to remove a project entirely from the Watchlist, on the 'Manage Models' dialog click onthe project name and on the Delete button.
If you have finished working with the Watchlist, click on the 'Models' drop-down arrow and select the'Recently Used' option to restore the model list to the full list of recently-accessed models.
(c) Sparx Systems 2019 Page 171 of 172 Created with Enterprise Architect
Project Management - Project Management 20 January, 2020
(c) Sparx Systems 2019 Page 172 of 172 Created with Enterprise Architect