Project Management for Complex Transportation Projects
170
Graduate eses and Dissertations Iowa State University Capstones, eses and Dissertations 2010 Project Management for Complex Transportation Projects John Owens Iowa State University Follow this and additional works at: hps://lib.dr.iastate.edu/etd Part of the Civil and Environmental Engineering Commons is esis is brought to you for free and open access by the Iowa State University Capstones, eses and Dissertations at Iowa State University Digital Repository. It has been accepted for inclusion in Graduate eses and Dissertations by an authorized administrator of Iowa State University Digital Repository. For more information, please contact [email protected]. Recommended Citation Owens, John, "Project Management for Complex Transportation Projects" (2010). Graduate eses and Dissertations. 11627. hps://lib.dr.iastate.edu/etd/11627
Transcript of Project Management for Complex Transportation Projects

Graduate Theses and Dissertations Iowa State University Capstones, Theses andDissertations
2010
Project Management for Complex TransportationProjectsJohn OwensIowa State University
Follow this and additional works at: https://lib.dr.iastate.edu/etd
Part of the Civil and Environmental Engineering Commons
This Thesis is brought to you for free and open access by the Iowa State University Capstones, Theses and Dissertations at Iowa State University DigitalRepository. It has been accepted for inclusion in Graduate Theses and Dissertations by an authorized administrator of Iowa State University DigitalRepository. For more information, please contact [email protected].
Recommended CitationOwens, John, "Project Management for Complex Transportation Projects" (2010). Graduate Theses and Dissertations. 11627.https://lib.dr.iastate.edu/etd/11627
i
Project management for complex transportation projects
by
John Allen Owens
A thesis submitted to the graduate faculty
in partial fulfillment of the requirements for the degree of
MASTER OF SCIENCE
Major: Civil Engineering (Construction Engineering & Management)
Program of Study Committee: Kelly Strong, Major Professor
Jennifer Shane Terry Wipf
Iowa State University
Ames, Iowa
2010
Copyright © John Allen Owens, 2010. All rights reserved.

ii
Table of Contents Chapter 1 – Introduction ...................................................................................................... 1
1.1 Research Objectives ...................................................................................................... 4
Chapter 2 – Literature Review Model Conceptualization ........................................ 7
2.1 Cost Dimension .............................................................................................................. 8
2.2 Schedule Dimension .................................................................................................... 10
2.3 Technical Dimension ................................................................................................... 11
2.4 Context Dimension .......................................................................................................14
2.5 Financing Dimension ................................................................................................... 18
Chapter 3 – Literature Review Operational Model .................................................. 21
3.1 Cost Dimension ............................................................................................................ 21
3.2 Schedule Dimension .................................................................................................... 26
3.3 Technical Dimension ................................................................................................... 29
3.4 Context Dimension ...................................................................................................... 34
3.5 Financing Dimension ................................................................................................... 41
Chapter 4 – Research Methodology ................................................................................ 50
Chapter 5 – Case Studies & Questionnaires ................................................................ 55
5.1 E-470 Segment 4 .......................................................................................................... 55
5.2 Trunk Highway (TH) 212 Design-Build .................................................................... 61
5.3 Reconstruction of I-15 in Utah ................................................................................... 66
5.4 Warwick Intermodal ................................................................................................... 74
5.5 Reconstruction of I-64 in Missouri ............................................................................ 81
Chapter 6 – Analysis & Findings ..................................................................................... 89

iii
6.1 Case Study Sources of Complexity Comparisons ..................................................... 89
6.2 Case Study Validation ................................................................................................. 98
6.3 Dimension Score Comparisons & Resource Allocation ........................................... 98
Chapter 7 – Research Limitations ................................................................................. 102
Chapter 8 – Future Research Ideas ............................................................................... 105
Chapter 9 – Conclusions .................................................................................................... 107
References ............................................................................................................................... 109
Appendix A............................................................................................................................. 122
Literature Tables ............................................................................................................. 123
Appendix B ............................................................................................................................. 145
Appendix C............................................................................................................................. 164
iv
Abstract
The management of complex transportation projects requires a fundamental change in how
they are approached. The traditional methodology for managing transportation projects is
not adequate for complex projects. The project begins by discussing the transition of project
management towards a five-dimensional model that incorporates context and financing
dimensions that have previously been regarded merely as risks. The five dimensional model
and an extensive literature search pertaining to the management of complex transportation
projects assist in mapping the complexity of real-world projects. The main purpose of this
research is to present results found on real-world projects that illustrate a new type of
management approach for project managers.
A total of five case studies are selected for this project that have definitive sources of
complexity found that create management challenges. The literature review serves as a
starting point in developing a questionnaire that focuses on complexity issues found in the
studied transportation projects. Participants familiar with each project are interviewed to
gather both qualitative and quantitative data. This information can be used in several ways.
First, examining a number of complex projects allows similarities to arise between them
relating to common sources of complexity. Second, the mapping of each project allows the
user to compare both the studied projects and upcoming agency projects in order to make
resource allocation decisions based on commonalities. Lastly, the resource allocation
recommendations also discuss potential skill sets that would be the most adept at effectively
managing specific portions of a project.
1
Chapter 1 – Introduction
Project management is a term that is used across many industries and has many different
meanings. Project management in transporation construction takes on a form in which each
project has a defined beginning and ending. Presently, the definition of project management
varies depending on the source. Current project management definitions include:
• “the application of knowledge, skills, tools, and techniques to project activities to meet the project requirements” (Gray and Larson, 2008)
• “…the planning, organizing, directing, and controlling of company resources for the relatively short-term objective that has been established to complete specific goals and objectives. Furthermore, project management utilizes the systems approach to management by having functional personnel assigned to a specific project” (Kerzner, 2006)
• Identification and management of risk (Touran, 2006)
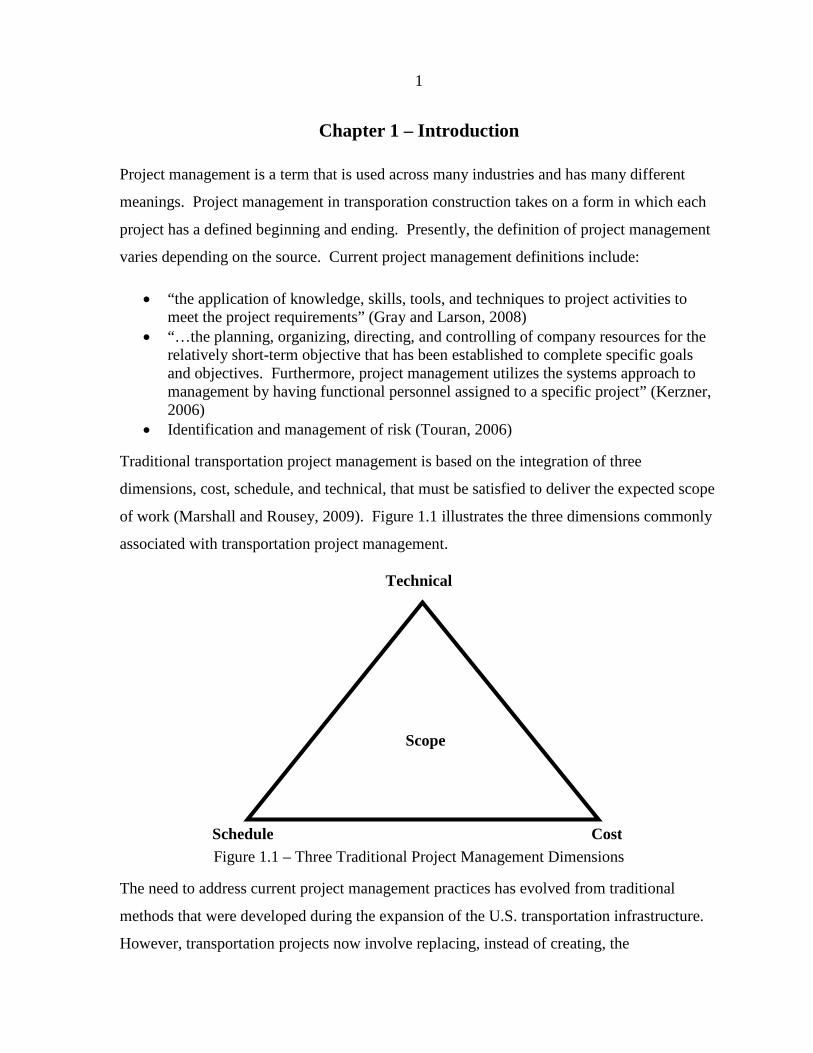
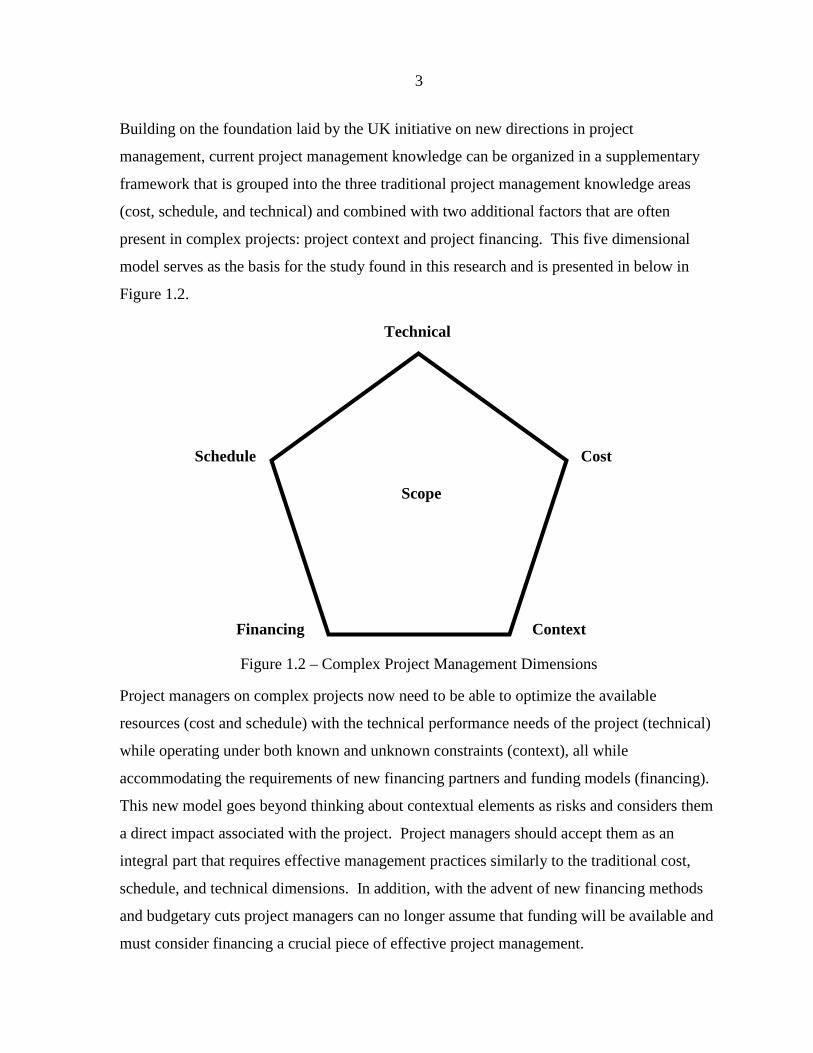
Traditional transportation project management is based on the integration of three
dimensions, cost, schedule, and technical, that must be satisfied to deliver the expected scope
of work (Marshall and Rousey, 2009). Figure 1.1 illustrates the three dimensions commonly
associated with transportation project management.
Figure 1.1 – Three Traditional Project Management Dimensions
The need to address current project management practices has evolved from traditional
methods that were developed during the expansion of the U.S. transportation infrastructure.
However, transportation projects now involve replacing, instead of creating, the
Scope
Schedule
Technica
Cost
Technical

2
transportation existing infrastructure. The 1990’s brought the demand from public owners to
deliver public infrastructure projects faster and with more control over time and cost
(Gransberg et al., 2006; Lopez del Puerto et al., 2008; Sillars, 2009) further directing the
need for the new thoughts on project management. The problem with traditional project
management in complex projects is summarized in the final report of the National
Cooperative Highway Research Program (NCHRP) Project 20-69: Guidance for
Transportation Project Management (2009). The study found that projects over $5 million
in construction costs were under budget 20 percent of the time and delivered on time 35
percent of the time. The study finds that the majority of the issues relating to cost and
schedule issues can be solved using effective management protocols and procedures. The
intent of the study is to demonstrate that project managers need to be trained to think of a
project as an integrated system.
Project management has begun to evolve into a different form where the roles and
responsibilities of project managers are expanding beyond the traditional cost-schedule-
technical triangle (Atkinson, 1999) to include management of relational, cultural, and
stakeholder issues (Cleland and Ireland, 2002). Although the premise of project management
appears to be changing there is debate over how it is changing. A study performed by the
University of Manchester developed a conceptual framework that serves as the basis for the
following research entitled “Five New Directions of Thought” in order to analyze the shift
from traditional to complex project management (Winter and Smith, 2006). The directions
are summarized in the list below:
• The consideration of multiple external influences as paramount to the project instead of traditionally thinking of them as risks.
• A change from thinking about projects as static, linear, discrete events toward recognition of the interactive, interpersonal, and dynamic nature of modern projects.
• Focus on projects as creating value and an end product that serves a purpose instead of merely creating a project based on a system of predetermined parts.
• A trend toward integrated, multidisciplinary structure with hybrid forms of governance.
• Shift of project management practice and education from using analytic tools to complete the project towards project managers inspiring thoughtful, resourceful, and pragmatic applications of management practices in complex projects.
3
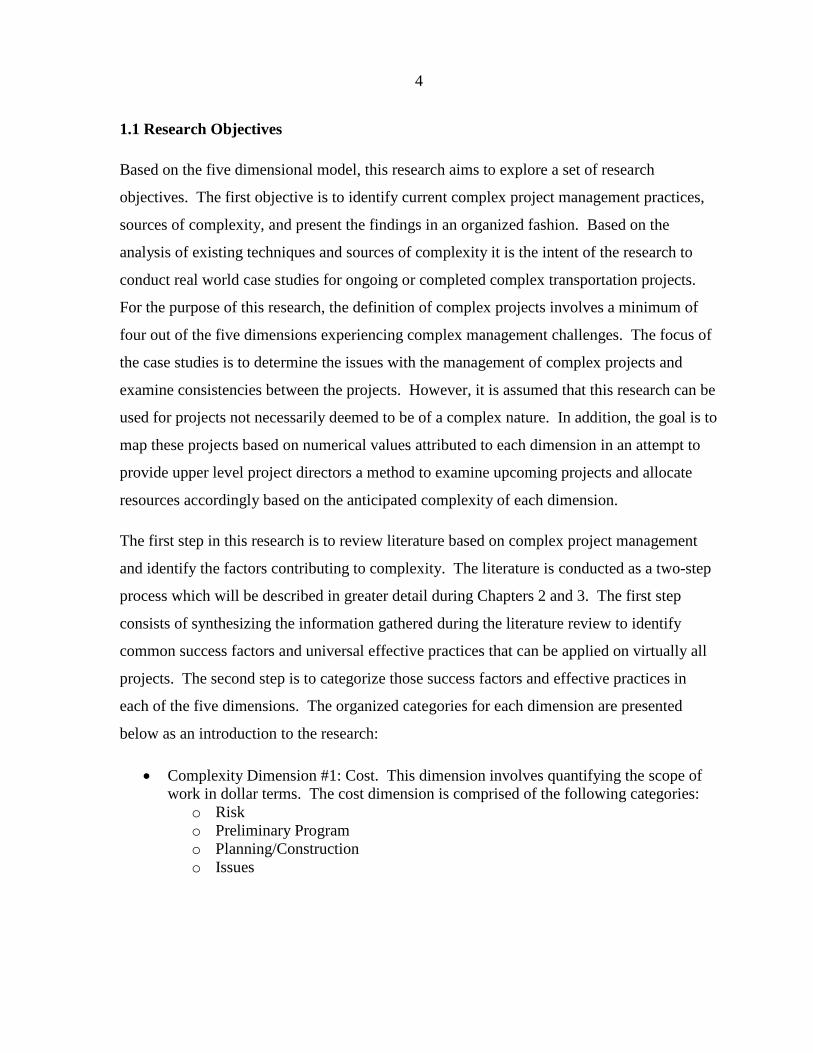
Building on the foundation laid by the UK initiative on new directions in project
management, current project management knowledge can be organized in a supplementary
framework that is grouped into the three traditional project management knowledge areas
(cost, schedule, and technical) and combined with two additional factors that are often
present in complex projects: project context and project financing. This five dimensional
model serves as the basis for the study found in this research and is presented in below in
Figure 1.2.
Figure 1.2 – Complex Project Management Dimensions
Project managers on complex projects now need to be able to optimize the available
resources (cost and schedule) with the technical performance needs of the project (technical)
while operating under both known and unknown constraints (context), all while
accommodating the requirements of new financing partners and funding models (financing).
This new model goes beyond thinking about contextual elements as risks and considers them
a direct impact associated with the project. Project managers should accept them as an
integral part that requires effective management practices similarly to the traditional cost,
schedule, and technical dimensions. In addition, with the advent of new financing methods
and budgetary cuts project managers can no longer assume that funding will be available and
must consider financing a crucial piece of effective project management.
Financing Context
Technical
Cost Schedule
Scope
4
1.1 Research Objectives
Based on the five dimensional model, this research aims to explore a set of research
objectives. The first objective is to identify current complex project management practices,
sources of complexity, and present the findings in an organized fashion. Based on the
analysis of existing techniques and sources of complexity it is the intent of the research to
conduct real world case studies for ongoing or completed complex transportation projects.
For the purpose of this research, the definition of complex projects involves a minimum of
four out of the five dimensions experiencing complex management challenges. The focus of
the case studies is to determine the issues with the management of complex projects and
examine consistencies between the projects. However, it is assumed that this research can be
used for projects not necessarily deemed to be of a complex nature. In addition, the goal is to
map these projects based on numerical values attributed to each dimension in an attempt to
provide upper level project directors a method to examine upcoming projects and allocate
resources accordingly based on the anticipated complexity of each dimension.
The first step in this research is to review literature based on complex project management
and identify the factors contributing to complexity. The literature is conducted as a two-step
process which will be described in greater detail during Chapters 2 and 3. The first step
consists of synthesizing the information gathered during the literature review to identify
common success factors and universal effective practices that can be applied on virtually all
projects. The second step is to categorize those success factors and effective practices in
each of the five dimensions. The organized categories for each dimension are presented
below as an introduction to the research:
• Complexity Dimension #1: Cost. This dimension involves quantifying the scope of work in dollar terms. The cost dimension is comprised of the following categories:
o Risk o Preliminary Program o Planning/Construction o Issues

5
• Complexity Dimension #2: Schedule. This dimension relates to the calendar-driven aspects of the project. The schedule dimension is comprised of the following categories:
o Time o Risk o Planning/Construction o Technology
• Complexity Dimension #3: Technical. This dimension includes all of the typical engineering requirements. The technical dimension is comprised of the following categories:
o Scope o Internal Structure o Contract o Design o Construction o Technology
• Complexity Dimension #4: Context. This dimension encompasses the external influences impacting project development and progress. The context dimension is comprised of the following categories:
o Stakeholders o Project Specific o Local Issues o Resource Availability o Environmental o Legal/Legislative o Global/National o Unusual Conditions
• Complexity Dimension #5: Financing. This dimension relates to the need for understanding how the project is being paid for. The financing dimension is comprised of the following categories:
o Process o Public o Revenue Stream o Asset Value o Finance-Driven Project Delivery Methods o Risk
The above results are the first step in conducting the remaining research and introduce the
preliminary findings associated with this project. The focus of the remaining research is to
take the existing project management practices and base the case study questionnaires on the
defined sources of complexity. The remaining research found in the following report finds

6
that it is possible to analyze real projects and map the complexity of each dimension. The
studied projects show that there are similar sources of complexity found between each case.
In addition, it is possible for owners to use the results to make resource allocation decisions
and redefine how their organization views complex transportation projects. Complex project
management is evolving and the following chapters attempt to convey a methodology for
considering all elements related to complex project management in a manner that can be
readily repeated and used throughout the project management community.
7
Chapter 2 – Literature Review Model Conceptualization
The purpose of the literature review is to analyze the current literature pertaining to complex
management of transportation projects and determine what factors contribute to complexity
within each of the five dimensions. This research uses a two-step model building process in
completing the literature review. The first step (Chapter 2) is to conceptualize the model.
During this step the factors contributing to complexity within each dimension are determined
and defined for the use in this research. The factors are then organized under categories
based on similarities or their presence during particular stages of the project process. The
second step (Chapter 3) is to operationalize the model based on the identified factors. The
focus of this step is to present and discuss the management complexity issues associated with
each factor. The objective of Chapter 3 is to analyze the literature examining the sources of
complexity associated with the dimensions and to identify potential gaps where no work has
been performed regarding the particular factor(s). Each factor independently can create
complexity and, for purposes of organized discourse, each factor will be discussed as a
discrete event. However, it is important to note that the dynamic interaction between these
factors is the true source of complexity. The operationalized model and the corresponding
literature identifying issues with management of the factors are presented in tables found in
Appendix A.
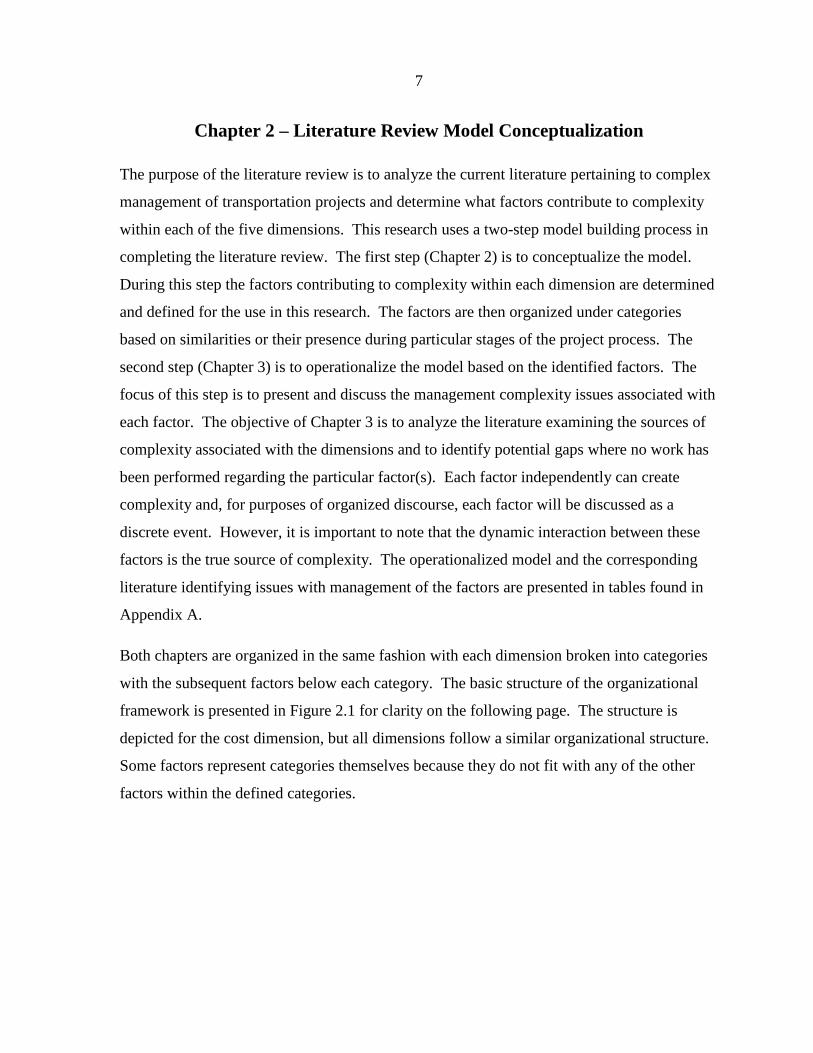
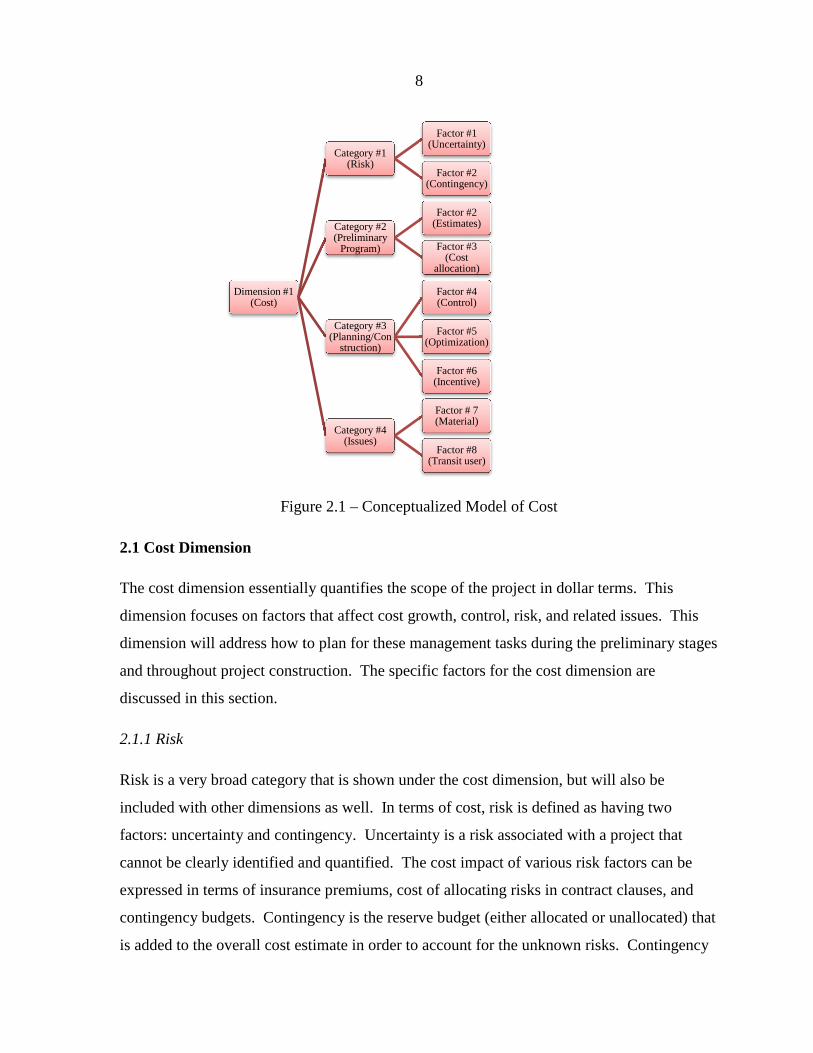
Both chapters are organized in the same fashion with each dimension broken into categories
with the subsequent factors below each category. The basic structure of the organizational
framework is presented in Figure 2.1 for clarity on the following page. The structure is
depicted for the cost dimension, but all dimensions follow a similar organizational structure.
Some factors represent categories themselves because they do not fit with any of the other
factors within the defined categories.
Figure
2.1 Cost Dimension
The cost dimension essentially quantifies the scope of the project in dollar terms
dimension focuses on factors that affect
dimension will address how to plan for these management tasks during the preli
and throughout project construction
discussed in this section.
2.1.1 Risk
Risk is a very broad category that is shown under the cost dimension
included with other dimensions
factors: uncertainty and contingency
cannot be clearly identified and quantified
expressed in terms of insurance premiums, cost of allocating risks in contract clauses, and
contingency budgets. Contingency is the reserve budget (either allocated or unallocated) that
is added to the overall cost estimate in order to account for the unknown risks
Dimension #1 (Cost)
8
Figure 2.1 – Conceptualized Model of Cost
ntially quantifies the scope of the project in dollar terms
on factors that affect cost growth, control, risk, and related
will address how to plan for these management tasks during the preli
project construction. The specific factors for the cost dimensi
Risk is a very broad category that is shown under the cost dimension, but will also be
included with other dimensions as well. In terms of cost, risk is defined as having two
factors: uncertainty and contingency. Uncertainty is a risk associated with a project that
cannot be clearly identified and quantified. The cost impact of various risk factors can be
ance premiums, cost of allocating risks in contract clauses, and
Contingency is the reserve budget (either allocated or unallocated) that
is added to the overall cost estimate in order to account for the unknown risks
Category #1 (Risk)
Factor #1 (Uncertainty)
Factor #2 (Contingency)
Category #2 (Preliminary
Program)
Factor #2 (Estimates)
Factor #3 (Cost
allocation)
Category #3 (Planning/Con
struction)
Factor #4 (Control)
Factor #5 (Optimization)
Factor #6 (Incentive)
Category #4 (Issues)
Factor # 7 (Material)
Factor #8 (Transit user)
ntially quantifies the scope of the project in dollar terms. This
related issues. This
will address how to plan for these management tasks during the preliminary stages
The specific factors for the cost dimension are
but will also be
erms of cost, risk is defined as having two
Uncertainty is a risk associated with a project that
The cost impact of various risk factors can be
ance premiums, cost of allocating risks in contract clauses, and
Contingency is the reserve budget (either allocated or unallocated) that
is added to the overall cost estimate in order to account for the unknown risks. Contingency

9
can be added for all types of uncertainty, as will be evident during the analysis of the
literature.
2.1.2 Preliminary Program
The preliminary program category contains two cost factors: estimates and cost allocation.
Estimates include conceptual, preliminary, design, and final estimates. Many different
elements have estimates, including right-of-way (ROW), construction and design costs, and
land-acquisition costs, to name a few. This factor encompasses all of the different kinds of
estimates that are required to be performed and the susceptibility of those costs varying from
initial to final estimates. Cost allocation refers to the internal distribution of costs by the
owner in order to make sure each area of project management has adequate finances to
perform its operations.
2.1.3 Planning/Construction
Planning and construction includes all of the cost factors that occur during these two stages.
Although some planning occurs during the preliminary stage, these factors are more related
to planning, or looking ahead, during the construction of the project. Control, optimization,
and incentive are the factors linked with this category. Control includes all of the tools and
methods used to control and manage costs throughout the project. Optimization is also
included under the technical and schedule dimensions, but in a cost sense it refers to the
tradeoff between cost, schedule, and quality. Reducing the duration of the project typically
comes with a higher price tag, for example. The incentive factor relates to the owner’s use of
incentives for early completion of the project and must be accounted for when looking at the
overall cost of the project.
2.1.4 Issues
Many issues are related to the cost dimension, but most have been discussed in the previous
categories. The issues category specifically relates to those that need to be planned for up
front and include material and transit user costs. Material costs are an item that is estimated,
but this factor focuses on the probability of the material costs changing due to market

10
volatility. Because this factor has an external element, this factor is closely related to
resource availability in the context dimension, but because the material price volatility
directly affects the cost of the project, it overlaps into the cost dimension. Transit user costs
are another factor that goes hand in hand with determining the completion deadline of the
project in the schedule dimension, but the owner must balance the cost tradeoff between
transit user costs and the anticipated completion date, explaining its presence in the cost
dimension as well.
2.2 Schedule Dimension
The project schedule is the timeframe for which the project must be completed. This
dimension encompasses issues related to controlling the schedule and maintaining set
completion dates. The schedule dimension will look at variables such as the overall
time/deadline, risk, milestones, control, and problems associated with managing and planning
for issues that arise before and during construction. The advent of new technology will also
be discussed as it pertains to affecting the management of the project schedule.
2.2.1 Time
The first category is time which is a factor itself. Time refers to the entire timeline of the
project that must be met from initial kick-off dates through substantial completion and
closeout. Depending on the project, timeline requirements may be very stringent or they
could be looser depending on the need for the project. This category involves all of the
issues creating management barriers for completing the project within the specified time
requirements.
2.2.2 Risk
Risk is a major driver of project delays. A risk factor is any factor that has the potential to
adversely affect the project. In other words, risk is the potential for loss due to uncertain
events. Risk spans over many dimensions, but in this definition it refers specifically to the
uncertainties that have a direct impact on the schedule of a transportation project.

11
2.2.3 Planning/Construction
The planning/construction category contains four factors: milestones, control, optimization,
and resource availability. As discussed above, the overall timeline of the project has the
potential to affect the management strategies for a project. Milestones break down the
overall time requirements into incremental deadlines throughout the various phases of the
project and refers to any issues relating to meeting these dates. As with cost, control is also
an issue with the schedule. Schedule control refers to any method or strategy used to control
the schedule including frequency of schedule updating, forecasting, and progress meetings,
among others. Optimization is found in the cost, schedule, and technical dimensions. For
the schedule dimension, optimization refers to the impact of changing the cost or technical
requirements and how the changes affect the schedule. The last factor in this category is
resource availability. This factor does not consider the cost of the resources or external
factors that contribute to obtaining the necessary resources. Schedule resource availability is
defined as issues with leveling the resources or limitations with scheduling multiple
resources at the same time.
2.2.4 Technology
The effect of information technology and the advancements in software design has created
new opportunities for controlling project schedule. The technology category includes two
factors for consideration: visualization and system/software. The visualization factor is
basically the ability to see the project and make decisions about the schedule based on new
information that has not been available in the past. Along with visualization is the capability
of the system/software. With the technology boom there are many different types of
systems/software, all with different capabilities. The main focus of these two factors is to
discuss the issues associated with implementing new technology and despite its
advancements, the limitations of the systems/software.
2.3 Technical Dimension
The other common project management area typically identified as crucial to project success
is the technical dimension. The technical aspects of the project include all of the typical

12
engineering requirements. Issues identified for this dimension include design requirements,
scope of the project, quality of construction, and the organizational structure of the owner
undertaking the project. This area also includes items such as contract language and
structure, and the implementation of new technology for effective management of the project.
2.3.1 Scope
Scope is a very broad term under the technical dimension that includes all of the project
requirements. Scope is essentially the purpose of the project and, generally, what is going to
be built to satisfy that purpose.
2.3.2 Internal Structure
The internal structure of the agency/owner is also its own factor and category because it is
the general organization of the entity and is not necessarily project-specific, although it can
be depending on the requirements of the project. This factor examines how the owner is set
up in order to effectively manage the project, i.e., traditional hierarchy, matrix with project
teams, etc.
2.3.3 Contract
Underneath the contract category are four factors including prequalification, warranties,
disputes, and delivery method, that need to be analyzed for problems contributing to
complexity. Prequalification is the act of identifying qualified contractors and designers who
are most capable of performing the requirements necessary for the project. These approved
parties can then be selected based on the selected delivery method used for the project.
Warranties are a factor provided by contractors that ensure the quality and guarantee pieces
of the project will remain adequate for a specified period of time. Disputes have been
included in the contract category because there is typically a chain of command for filing and
resolving disputes that arise during the project, which is spelled out contractually. The last
factor within the contract category is the delivery method. The delivery method is the type of
contracting approach used and may be limited by legislative requirements. Regardless of the

13
delivery method used for the project, this factor also includes how the particular method is
set up throughout the course of the project.
2.3.4 Design
The design of a project is pretty self-explanatory, but there are different aspects of design that
are presented as factors and include methods, reviews and analysis, and existing conditions.
The method refers to the process and expectations stipulated for the project by the owner and
the accuracy and quality required incrementally throughout the design phase. The method
also refers to considering the entire life of the project and the anticipated maintenance
requirements over its life span. Reviews and analysis are a method for maintaining accuracy
and quality of the design and include tools such as value engineering/analysis and
constructability reviews. Existing conditions refers to any structural limitations already in
place that need to be accounted for in order for the design to satisfy the solution required by
the owner.
2.3.5 Construction
Quality, safety/health, optimization, and climate are all factors that are included under the
construction category. Quality is literally the value of the work that is being put in place by
the contractors. Safety/health is concerned with maintaining a workplace where workers feel
comfortable around all parties. Optimization is discussed in the cost and schedule
dimensions as the trade-off between cost, schedule, and quality. Increasing or decreasing one
of these items has an effect on the others, and the overall expectations need to be taken into
account when balancing the three. The last factor is climate. Generally, all parties need to be
concerned with the typical climate where the project is and the construction limitations
presented by the area’s typical climatic conditions.
2.3.6 Technology
The influx of technology has led to factors that need to be considered for project
management and include usage, intelligent transportation systems (ITS), and automation.
The usage is what is specified to be used for project communications, such as specific project

14
management software, building information modeling, and others. ITS are another factor
that may be necessary for transportation projects and the use needs to be analyzed as to their
implementation into the project. Automation is the use of automated or robotic equipment
for construction and, if desired for the project, needs to be specified and understood by all
parties.
2.4 Context Dimension
The context dimension refers to all of the external factors that have an impact on the project
and can be some of the most difficult to predict and plan for before and during construction.
Context issues include stakeholders, environmental issues, legal and legislative requirements,
local effects, project-specific factors, resource availability, global/national impacts, and
unusual conditions.
2.4.1 Stakeholders
Stakeholders are those parties directly affecting and affected by the project. The factors
underneath stakeholders include the public, politicians, owner, and jurisdictions. The public
is directly affected by and has the potential to affect the project from initial conception all the
way through completion and well after turnover. The transportation project is for the public
and their interests. Politicians may be involved during the financing and need stages and are
likely to be involved if the project is not perceived well by the public. The owner is the most
obvious stakeholder and implements the project based on a need. They are the one running
and managing the project and has the most to lose or gain based on the project’s success.
The jurisdictional stakeholders are an all-encompassing group that includes local, State, or
Federal organizations, such as the State Historic Preservation Office (SHPO), the
Metropolitan Planning Organization (MPO), and the Federal Highway Administration
(FHWA). These entities may become involved based on regulations and limitations
encountered by the project.

15
2.4.2 Project Specific
The project-specific category includes factors that directly relate to the project, including
maintaining capacity, work zone visualization, and intermodal facilities. Maintaining
capacity is a planning decision made by the owner, such as lane closures, detours, and time
of construction activities (e.g., nighttime, weekends, etc.). Work zone visualization is based
on maintaining capacity decisions and involves using the appropriate means to alert the
public of alterations to normal traffic routes and the presence of construction activity. The
definition of intermodal is more than one mode of transportation and is a factor that must be
realized when planning projects that involve or affect other modes of transportation.
2.4.3 Local Issues
Local issues constitute the broadest category presented in this literature review. This
category contains many factors for identification when undertaking a transportation project.
These factors are social equity, demographics, public services, land use, growth inducement,
land acquisition, economics, marketing, cultural, workforce, and utilities. Many of these
factors have elements that overlap other factors in the same category. Social equity is a
matter of maintaining equality between all social classes that use and are affected by the
project. For example, a new transportation project may be aligned to run through a lower-
class neighborhood, possible unfairly displacing residents who don’t have the means to move
locations. The location of the project also has an effect on growth inducement, land use, and
the economy of the area. A potential project may spur growth and alter potential land use or
change the zoning plan of the area. Both of these factors then have a direct impact on the
economy of the region. For example, the economy can be affected based on complete
shutdown during construction or detours that bypass businesses that rely on that mode of
transportation. In addition, the economy can be altered based on the use of local labor, or the
workforce. The implementation of a project creates jobs directly and indirectly from the
ripple-down effect. The local workforce is concerned with the skill and ability of the
workers and the number of qualified entities that can fulfill the project requirements. As
mentioned above, many of these factors overlap and affect each other. The cultural and
demographic factors are both concerned with how the project may be perceived by the public

16
as a whole. The cultural factor specifically relates to the culture(s) of the area and
demographics outline the distribution of the population within an area. Demographics refer
to the distribution of population that may be impacted depending on the design decisions.
Utilities are a public service, but are separated due to a direct impact on the project. Utilities
include all of the services necessary that may need to be moved and coordinated, such as
electricity, gas, etc. Public services in this report include services that may have to be altered
such as emergency routes taken by fire and medical personnel due to construction activities.
Land acquisition has costs associated with the process, but the external forces are the reason
it is included under the context dimension. Acquisitions may be hindered by the ability and
process to acquire the portion(s) of land necessary for the project. The last factor concerned
with local issues is marketing. Marketing involves notifying the public of the project and its
progress, particularly those matters directly impacting the public.
2.4.4 Resource Availability
Resource availability is considered in this review to be its own category and factor. It is a
broad category that includes all types of resources that may be needed for a project. Some of
the resources identified may include material, equipment, and labor. Material is mentioned
in the cost dimension but, in this situation it refers more to the ability to procure material
based on demand, not cost. Equipment and labor also conform to this idea that it is not about
the cost, but the ability of the parties to obtain the necessary resources. Labor, or workforce,
is also mentioned under the local issues but, in that context, it is meant as the capability of
the workforce, not the availability of the resource.
2.4.5 Environmental
The environmental category crosses over into other dimensions, categories, and factors. In
order to confine the discussion, the environmental category has been placed within the
context dimension. The impact of the environment as a whole is an external source of
complexity, explaining its place in the context dimension. The environmental category
contains two factors: sustainability and limitations. The sustainability factor includes any
materials or requirements to use environmentally friendly construction materials or desires
17
by the owner to use alternative materials or methods. The limitations factor is essentially
what type of environmental study is necessary or any site-specific factors affecting the design
and construction of the project.
2.4.6 Legal/Legislative
Legal and legislative requirements are another category for the context dimension. Both
procedural law and local acceptance are the factors acknowledged for this category.
Procedural law refers to the legal channels and limitations, such as permitting, zoning, and
land acquisition that should be followed for implementing a transportation project.
Procedural law is also the ability of an owner to use alternative delivery methods designated
by law, such as design-build (DB) or construction manager at risk (CM@R). Local
acceptance is the ability, experience, or willingness to use different delivery options or legal
channels if procedural law does not restrict the method by the local parties that are likely to
be involved with the project. It is worth noting that the financing legislation will be
discussed within the financing dimension since it is constantly changing and is specifically
applicable to that dimension.
2.4.7 Global/National
Global and national events may also increase the complexity of managing a project.
Economics and incidents are the factors identified for this category. Economics is already
discussed on the local level, but national and global economics may externally affect the
project as well. Incidents refer to any recent events that have occurred nationally or globally
that may have a positive or negative impact on the project.
2.4.8 Unusual Conditions
The last category underneath the context dimension is unusual conditions. Weather and force
majeure are the two factors associated with unusual conditions. Climate is discussed in the
technical dimension section under the premise that the typical climate is a factor that needs to
be evaluated for construction purposes. Weather, on the other hand, represents unforeseen
conditions that are abnormal to typical conditions, therefore causing issues that are difficult
18
to proactively plan around. Force majeure is related to weather, such as catastrophic events,
but can also include effects such as terrorism.
2.5 Financing Dimension
The last dimension evaluated for this research is the financing of a transportation project. It
is no longer sufficient to merely know a project’s cost. The owner must know how it will be
paid for and integrate that knowledge into the project’s scope of work. The type of financing
and the ability to procure financing plays a major role in many facets of the project. This
section will define the factors pertaining to the financing process and the various types of
financing used for complex transportation projects.
2.5.1 Process
The process category contains four main factors: legislative, uniformity, transition, and
project management training. Legislative refers to the legal limitations placed on financing
methods. Uniformity deals with the consistency seen between States and local jurisdictions
regarding legislation and financing techniques. The financing transition deals with the
financing complex projects compared to traditional project financing and the shift in financial
planning. Finally, project management training is defined as the education project managers
need to understand financial methods used for complex transportation projects.
2.5.2 Public
Public financing for complex transportation projects is generally obtained from two sources,
which are presented as two of the factors within the public category: Federal and State
funding. Federal funding is provided by the national government, is standard across the
nation, and is derived from the annual transportation bill. State funding is independently
financed through the particular State where the project is taking place. The public category
also includes three other factors: bonds, borrowing against future funding, and advanced
construction. Bonds are floated by local sponsors and can be purchased by investors looking
to earn a return on their investment leading to portions of the project initially being financed
by the investors. Borrowing against future funding is the ability of the states to use, or
19
borrow against, future federal funding in order to pay debt service and other bond-related
expenses. Advanced construction is also a method of Federal funding where States can
essentially borrow against future funding in order to finance needed projects. The method
allows States to independently raise the initial capital for a federally approved project and
preserve their eligibility for future Federal-aid reimbursement.
2.5.3 Revenue Stream
The revenue stream category has three factors that are types of financing: revenue generation,
vehicle miles traveled (VMT) fees, and cordon/congestion pricing. Revenue generation is
the ability of the infrastructure to generate funds that are used to finance the project over a
period of time, or concession period. Similar to revenue generation is VMT fees, the
difference being that VMT fees specifically refers to charging the user directly for each mile
traveled replacing a traditional motor fuel tax. Congestion pricing is used to reorient traffic
demand from congested areas or certain time periods by charging fees to use highways
during times of peak demand. Cordon pricing charges users to access a congested area, such
as a city center, during specified hours.
2.5.4 Asset Value
This category of financing goes beyond deriving revenue to pay for a capital project. It treats
transportation infrastructure as assets which have the ability to create a revenue stream that
can be used as a benefit for the agency. The exploiting asset value category contains three
factors: monetization of existing transportation assets, franchising, and carbon credit sales.
Monetization of existing transportation assets is a method where an existing road or bridge
will be brought up to some standard of quality and then private entities are invited to take it
over for a concession period, derive revenue from it, and return it to the original standard
before turning it over to the agency or another concessionaire. Franchising occurs when
private companies are offered the opportunity to build and operate income producing
facilities, such as rest areas or fuel stations on the public ROW, in return for a portion of the
profits. Typically, these revenues are used to finance routine projects on the route with
which they are affiliated. The sale of carbon credit sales is the last factor for this category.

20
The carbon stored by trees and plants has a market value, and credits can be sold in order to
help finance the project.
2.5.5 Finance-Driven Project Delivery Methods
The finance-driven project delivery methods category represents its own factor. These types
are driven by financial considerations and include methods such as public-private
partnerships (P3s) that include comprehensive development agreements (CDA) and
concessions. Finance-driven project delivery methods are different from all of the previous
methods because they require the contribution of both public and private funding. At this
point it becomes difficult to differentiate between methods as they become so project-specific
that any attempt at developing a precise generic definition is probably impossible. The
overall purpose for this category is to gain public access to private capital and create a
situation where the developers’ capital is able to bridge the funding gap for a much needed
piece of infrastructure and thus accelerate the delivery of its service to the traveling public.
2.5.6 Risk
Within the risk category, two techniques to mitigate the risk of cost overruns are presented as
factors: commodity-based hedging and global participation. Commodity-based hedging is
essentially the ability to lock in the material price at the earliest point when the required
quantity is known or the use of alternative materials based on lower market prices. Global
participation in the project is the second factor and is defined as the ability to take advantage
of different procurement and capital project delivery cultures around the world. Each nation
has its own set of business practices that create competition for financing transportation
projects and these methods can impact the financing used for transportation projects.
21
Chapter 3 – Literature Review Operational Model
A detailed list of the literature reviewed is provided in Tables A-1 through A-5 in Appendix
A. The literature focuses primarily on research studies that examine factors of complexity in
project management. An analysis of this literature is provided in the following sections,
identifying several project factors within each of the five dimensions of project management.
These factors have been established as major contributors to complexity on transportation
projects and must therefore be appropriately controlled by the project manager in order to
maximize the potential for project success. Based on the findings in this section, the
subsequent research will conduct interviews based on case studies using the outlined factors
to identify the complexity of each dimension. Based on the results of the study, the areas of
the project that contributes to the management complexity for the project will be mapped and
analyzed.
3.1 Cost Dimension
3.1.1 Risk
Within the cost dimension, the risk category has been identified as a crucial element that
must be planned for in transportation projects. The risk category includes both contingency
and uncertainty factors. As shown in the cost dimension table in Table A.1 in Appendix A,
nearly one-third of all literature articles found refer to contingency risk and approximately
one-half refer to uncertainty risk. The cost dimension factor issues tend to cross over and
relate to other cost factors, such as material costs affecting contingencies, which ultimately
affect estimates. The definitions of the factors outlined in Section 2.1 will be adhered to for
simplicity in identifying problems associated within the cost dimension.
Traditional contingency estimation lacks consistency and uniformity (Kasi, 2007). A major
issue with contingencies is that they are based on an overall percentage of the overall project
costs and don’t reflect the actual risks involved with the project (Allen, 2004). Another issue
is ensuring that contingency funds are used appropriately and that there are still adequate
contingency funds available to keep the project within budget throughout the various stages
of the project (Sinnette, 2004). One type of contingency identified relates to material prices

22
and the susceptibility of those prices to change throughout the course of a project (Gransberg
and Kelly, 2008). Bid quantity inflation as a means of providing contingency is another
method used that does not accurately reflect the requirements of the project (Gransberg and
Riemer, 2009). New technology and contingency risks are becoming more prevalent and are
making it more difficult to quantify insurance requirements due to lack of historical data
(Porro and Schaad, 2002). There are many different types of contingencies and a few are
mentioned here. In summary, methods are being used that don’t necessarily reflect the actual
project risks and requirements, consequently devaluing the contingency assignation for the
project.
Quantifying contingencies is a direct result of the uncertainties of a transportation project.
High amounts of uncertainty in the budget and schedule of a project are the primary causes of
cost escalation in major projects (Schneck et al., 2009). Identifying, evaluating, and
quantifying the risks and uncertainties associated with the cost of a project are essential for
effectively predicting and managing project costs (Lockhart et al., 2008). Risk management
systems are typically used for identifying uncertainties but lack structure and consistency. A
consistent method should be able to quantify the cost of the risk and the probability of the
risk occurring (Allen, 2004). Identifying uncertainties using project workshops is acceptable,
but risk analysis should be ongoing and not be based solely on preliminary checklists and
risk registers (Edwards et al., 2009).
3.1.2 Preliminary Program
The estimates factor shows up in over half of the referenced literature in the cost dimension
table. In a survey conducted by the Federal Transit Administration (FTA), almost 90 percent
of large construction projects had budget overruns ranging from 13 to 106 percent.
Optimistic scenarios yielding low estimates and high benefits as well as estimating errors
were identified as reasons for the budget discrepancies. Accurate estimates for all required
cost items are crucial for effective cost management (FTA, 2003). Estimates also present a
major issue in Europe. Quotes or cost ranges are typically provided in response to public
demand that reflect unrealistic scenarios and bias during very early stages of project
development (Hertogh et al., 2008). In a report by the U.S. Government Accountability
23
Office (GAO) concerning the management of large-dollar highway projects, many estimation
issues were identified. The GAO states that initial estimates are merely preliminary and
don’t reflect the actual costs of the project. The costs are often modified throughout the
project, are affected by inflation and scope changes, and the price is never actually set until
the project is bid out (GAO, 1997). Future estimates need to be based on probabilities of
expectancies in order to provide a range of costs with associated confidence levels.
Traditional estimates provide one cost and do not always base it on the probability of
unexpected situations affecting the initial estimate (Lockhart et al., 2008). All of these issues
identify why estimates are a major source of cost control in transportation projects. Keeping
estimates current and up to date and identifying reasons for deviations is not always
performed (Sinnette, 2004; GAO, 1997). Noting disparities for future use only compounds
mistakes for future projects. The construction process has many different levels of cost
estimates besides conceptual and preliminary. ROW estimates for acquiring land are one
type that affects the overall cost of the project. “Systematic and structured processes for
ROW estimating and cost management are lacking in many State highway agencies. The
lack of defined processes impacts the agency’s ability to consistently produce accurate ROW
cost estimates” (Anderson et al., 2009). This article goes on to state that ROW estimates do
not typically involve ROW personnel and that there is little connection between ROW
estimates and subsequent estimates. Some agencies incorporate estimation tools and
procedures, but even when the methods have been identified for use the techniques need to
be monitored over time to ensure validity over a wide range of projects (Kyte et al., 2004).
Cost allocation within the owner’s organization is the last factor under the preliminary
program cost category. Referencing the definition, cost allocation means the distribution of
resources to the divisions needed to complete the project. The Tennessee Department of
Transportation (TDOT) has recognized that managing and tracking funding and resources
and streamlining the allocations of the funding to the appropriate areas are a need for the
future (Brown and Marston, 1999). Dividing the costs into groups for which intent and
purpose is clearly evident and providing a logical structure for the function of cost
distribution is an issue that needs to be transparent and efficient for effective project
management (Kasi, 2007).

24
3.1.3 Planning/Construction
Throughout the course of a construction project, many events can take place to alter the cost.
Cost control is a factor that includes all methods used to manage the cost of a project.
Project managers need to use cost control methods to identify and mitigate issues before they
arise. A good control system is only as effective as the accuracy of the information input into
the system (Gray and Larson, 2008). Cost validation at defined milestones should be
performed for effective cost control management (FHWA, 2009a). One method of cost
control is design-to-budget. Owners need to be careful about adopting this method; initial
estimates must be realistic to allow for a budget that fits the required project scope (Casavant
et al., 2007). Specifically, ROW cost control is used sparingly during the early acquisition
stages (Anderson et al., 2009). Relating to the last section, estimates must be realistic in
order for cost control measures to be effective. Control also relates to what type of
constructability reviews, value engineering, and value analysis is performed during the
project (FTA, 2003). Determining when to hold constructability reviews, value engineering,
and value analysis sessions is essential for ensuring these cost control methods occur
efficiently (FHWA, 2009a). In addition, time during these sessions is not always spent on
the items that have the highest potential to affect the overall project costs (Sangrey et al.,
2003). Evaluating the design for cost savings and potential issues helps in alleviating
potential cost factors that will need to be controlled. Although the FHWA does recommend
the use of review and value sessions, they have been slow to focus particularly on cost
control as a crucial management tool after initial planning stages according to a 1997 GAO
report. Along with the FHWA, individual States utilize different philosophies on cost control
measures, and these agencies typically do not track the overall cost of the project because
each segment of the project is financed separately and treated as independent projects. Data
and reasons for cost overruns are not readily available. Agencies record the costs and
typically not the reasons for discrepancies between estimates and actual costs (GAO, 1997).
Optimization is one factor that appears under the cost, schedule, and technical dimensions.
For the cost dimension, only cost trade-off issues are identified. Minimizing costs may be
the focus, which would then directly affect the construction schedule and quality of the work
25
performed (Cristobal, 2009). Reducing the construction schedule typically increases the cost,
and project managers need to be aware of the project status and budget before making
decisions regarding optimizing one dimension or another (Sorel, 2004b).
One method for controlling costs is to create incentives for the parties to have a stake in
controlling cost; however, the methodology is not clearly defined. The established method
for setting up shared-risk contingency accounts needs to be clearly outlined (Allen, 2004).
The FTA also provides in their project management guidelines that establishing who is
responsible for cost overruns can create an incentive for those that bear overrun
responsibilities (FTA, 2003). Incentives need to be used carefully so that the entire project is
the focus of the parties bearing the shared risks (Hertogh et al., 2008).
3.1.4 Issues
Material costs are a factor that can arise under the issues category. Referencing the cost table
in Appendix A, two articles shown identify material cost as an issue for complex projects.
Construction material price volatility has increased more over the past three years than it has
in the last two decades, subsequently requiring cost engineers to need better tools to enhance
the accuracy of the estimates (Gransberg and Kelly, 2008). The FHWA’s cost-estimating
guidance also states the material price volatility can cause issues with controlling costs.
Without the acquisition of firm bid prices, speculation and bid inflation may occur resulting
in over- or under-budget projects (FHWA, 2007b).
The last factor within the cost dimension is the issue of transit user costs. User costs need to
be compared with the desire to finish the transportation project earlier, consequently
increasing the actual construction costs of the project (Sorel, 2004b). Project managers need
to identify the trade-off between construction costs, transit user costs, and the construction
schedule to balance the impact on the public and to make an appropriate decision. A project
in Canada decided to accelerate the demolition schedule, resulting in increased costs but less
impact on the transit users. The benefits compared to the increased costs need to be
considered before any such management decisions are made (Martin and Does, 2005). As

26
shown in Appendix A, the referenced articles are the only research pertaining to transit user
costs, so there appears to be a gap in the research for this factor.
3.2 Schedule Dimension
3.2.1 Time
Transportation project delays are common in the United States and abroad (Gamez and
Touran, 2009; Crossett and Hines, 2007; Booz Allen Hamilton, Inc., 2005; Thomas et al.,
1985). Loss of momentum during project life cycle causes even more delays and makes
effective management of project delays one of the most pressing issues. Scheduling the
project and project delay are the main challenges presented in the literature referring to the
time of a project. A well-scheduled project eliminates many of the problems encountered
during the design process and becomes a valuable tool for project managers during the
construction phase (Dolson, 1999). However, poorly scheduled projects may result from the
desire of some project champions who are eager to have their project approved for funding
and who come up with optimistic schedule estimates that are not realistic (Flyvbjerg et al.,
2004; Butts and Linton, 2009). The issue of managing the project schedule is often discussed
along with project delays in technical literature due to the impact that delays will have on the
project success. Many of the references use schedule performance as an indicator of project
success and as a project manager’s performance (Ashley et al., 1987; Sanvido et al., 1992).
A recently completed NCHRP project (Crossett and Hines, 2007) reviewed the performance
of more than 26,500 state departments of transportation projects in 20 States during the
period 2001 to 2005 and found that only 35 percent of these projects were delivered on time.
In an earlier study, Thomas et al. (1985) found that about one-third of public highway
projects suffered from delays and that the average delay for highway projects was 44 percent
of the original contract time. The situation is not better internationally. A recent study of 65
highway projects in five continents sponsored by the World Bank during the period of 1991
to 2007 found that schedule performance in these projects was poor, with 57 projects (88%)
showing an average delay of 35 percent of the original duration (Gamez and Touran, 2009).
Based on the results of these surveys, it is apparent that the timeline of a transportation
project is an area that needs to be examined and managed appropriately.
27
3.2.2 Risk
One of the major problems associated with schedule risk is the ability of the analysts and
managers to estimate the impact of each risk item identified on the duration of the project
(Golder Associates Inc., 2009; Touran, 2006; Molenaar, 2005). As mentioned within the cost
dimension, contingency is a method for accounting for unforeseen circumstances. The same
issues arise within schedule risk in that it is difficult to quantify how much contingency is
appropriate for the project. Establishing realistic contingencies is a major issue when
examining schedule risk (Hertogh et al. 2008). Risks that are not managed properly lead to
project delays found at both the planning/design and the construction phases. The delays
during the planning/design phase will affect the construction phase (Flyvbjerg et al., 2004).
The direct schedule risk is not the only portion that is an issue; indirect risks are also tied to
the project duration. Project delays result in low morale, rework, and wasted efforts in many
instances, all of which should be considered when analyzing the potential risks and outcomes
of the schedule duration.
3.2.3 Planning/Construction
Planning the design effort and the construction phase is a prerequisite for a successful project
(Lam et al., 2008; Ashley et al., 1987). Kerzner (2006) contends that the most important
difference between a good and a poor project manager is described in one word: planning.
Lack of careful planning effort will result in poorly prepared schedules that do not plan for
sufficient floats along major schedule paths, do not follow proper scheduling guidelines for
preparing the network, and eventually will create optimistic and untenable milestones.
Projects that require multiple contractors depend on all parties meeting of certain milestones.
Small delays can cascade into major schedule slippage that can greatly impact the overall
duration of the project (Touran et al., 1994).
Effective project controls are another factor under this category. Design and construction
phases need to be vigorously evaluated and controlled on a continuous basis. The
implementation phase is one area that needs to be controlled. Project delays occurring during
this phase due to decision makers have the greatest ability to impact the overall duration of

28
the project (Flyvbjerg et al. 2004). Some of the measures that have an impact on the control
of schedule include the frequency of personnel meetings, the experience of the project
manager, and the time devoted to the project by the project manager (Kog et al., 1999).
Independent validation of cost and schedule at various phases of the project has to be
conducted in order to obtain a realistic status of project schedule performance and to plan for
potential issues (FHWA, 2009a).
Cost optimization issues were discussed in Section 3.1.3 and the issues overlap between
dimensions. Optimization routines will allow flexibility in project scheduling and expediting
the schedule. Cristobal (2009) notes three desirable objectives for effective project
management: “to minimize time meeting quality and costs objectives,” “to minimize costs
subject to quality and time objectives,” and “to maximize quality subject to time and cost
objectives.” Optimizing one dimension creates issues for other dimensions. For example,
reducing the cash flow limits the ability to expedite the project. When optimizing, the
project manager needs to be aware of the impact on other dimensions created by optimizing
one dimension over another (Sorel 2004b).
The last factor reviewed under the planning/construction category is resource allocation.
Resource availability applies to labor, equipment, and material. Labor shortages during the
course of a project have a significant impact on the delays of a transportation project
(Merrow et al., 1988). During construction, one driver of schedule delay is poor planning for
long-lead items. These resources may have limited availability and may ultimately affect the
subsequent construction activities. Resource availability has the potential to alter the flow of
work and generally limit the options of the management team (McKim et al., 2000).
3.2.4 Technology
The advent of visualization technology using four dimensional (4D) modeling (Fischer,
2000) and Building Information Modeling (BIM) have created an integrated environment for
project planning, design, and control. The 4D modeling has established the importance of
“time” along the other three dimensions that represent quantities and volume of work. This
linkage of schedule activities to work components is done in a visual manner that facilitates

29
the process of planning for upcoming events and resolving potential conflicts. The main
issues with the use of visualization techniques are the high development costs (GSA, 2009)
and the intimate interaction required among project team members that may not be possible
under traditional project delivery methods. In general, delays tend to occur when new
technology is being used on a project for the first time (Merrow et al., 1988).
Many of the modern management approaches in planning and control of projects including
earned value analysis, resource allocation, optimization of schedule, and probabilistic
scheduling, would not be feasible without the benefit of the current software systems
(McKim et al., 2000). As mentioned during the discussion of the visualization factor, the use
of innovative systems and software may be hindered by the capacity of the organization, high
costs of use, and the first time use of new software (GSA 2009; Merrow et al. 1988). An
overall conclusion from the literature search on software systems is that the mainstream
software capabilities do not appear to be a major issue in achieving project management
goals. While many researchers and practitioners have commented on the effective use of
software systems, they do not seem to think that problems of the project manager in complex
projects can be solved with more powerful software.
3.3 Technical Dimension
3.3.1 Scope
There are quite few articles that discuss the scope as one of the major issues associated with
the technical factors. The FHWA provides a framework for preparing a project management
plan that would serve the agency carrying out the project. The first thing the FHWA
mentions for the project management plan framework is that the “scope should be clearly
defined” (FHWA, 2009a). The FHWA also stated that each project should have a scope
management plan. Miller and Lantz (2008) revealed through a literature review and
interviews with transportation agencies that scope should be defined during the planning
process based on purpose and need of the project.

30
3.3.2 Internal Structure
One issue concerned with project success is how the internal structure within the owner is set
up in order to effectively manage the project. This organizational setup has been one of the
major subjects for improved project performance. Tatum (1984) reported that more
systematic organizational design indicates an opportunity for improved performance. In the
same year, Levitt (1984) suggested that defining new organizational forms and molding
managers into new organizational structures can reduce the pain of managing complex
projects. Another issue relates to the established lines of communication that have been
mandated not only internally, but also with contractors and designers. Research shows that
definitive lines of communication are a major issue in completing the project on time, within
budget, and without litigation (Pate, 2000).
3.3.3 Contract
The subject of identifying qualified contractors and designers who are most capable of
performing the requirements necessary for the project has been identified as a major issue by
many researchers. The FTA highly recommends prequalification of bidders to verify that
proposers are capable of performing the work (FTA, 2003). Pate (2000) and Beard et al.
(2001) also identify the use of prequalification to help meet the objectives of the project.
However, there are few articles that discuss how prequalification should be carried out.
Specific guidance is one area necessary for each project regarding the agency's quality
management approach in the policy documents to ensure that quality is properly emphasized
throughout the project's life cycle (Gransberg and Windel, 2008; Gransberg et al., 2008).
Only one article among the research found relating to the technical dimension discusses
warranties. McClure et al. (2008) concluded through the case study of a highway project that
used P3s as a delivery method that performance warranties have an effect on the success of a
project. The research also suggested that independent verification of the warranties is a
factor for project success. As shown in Table A.3 in Appendix A, this article is the only
research presented that identifies warranties as a problem for complex factors; research in
this area appears to be limited.
31
Disputes and litigation are a major factor that has the potential to affect the cost and schedule
of a project before, during, and after a project. Contractually lacking a definitive chain of
command for dispute resolution and implementing resolution plans has the ability to
adversely affect the outcome of complex projects (Schexnayder and Mayo, 2003). Disputes
should be dealt with before they develop into claims and the administrative process should be
outlined (Abdul-Malak and El-Saadi, 2000). The contract language is one aspect that should
be examined and chosen to demonstrate the dispute resolution process outlined by the owner.
According to the literature review, there are many articles that discuss the delivery method as
one of the major issues associated with the contract category. One-third of the articles found
relating to the technical dimension identified the delivery method as a major factor for
project success. Many articles compared project performance between delivery methods.
Thus, understanding advantages and disadvantages of each project delivery method is
essential for better performance. Yakowenko (2004) stated that “No single project delivery
strategy is appropriate for all major projects, and contracting agencies should consider the
merits of each method in relation to their project needs." Konchar and Sanvido (1998)
compared delivery systems, such as DB, design-bid-build (DBB), and construction
management in terms of quality, cost, and schedule. Regardless of which delivery method is
selected, the process and structure are two issues that affect the success of a project. In
particular, Molenaar et al. (2000a) pointed out that the use of DB needs to be clear and
transparent so that all parties understand the process. Partnering on a project can also be an
effective method if all participants are fully engaged in the process, understand the partnering
process, and are willing to work in positive relationships with all participants
(Schaufelberger, 2000). With the use of alternative delivery methods becoming more
prevalent, owners need to be clear with the selection process and state the project
requirements despite the delivery method that is chosen.
3.3.4 Design
The design method refers to the process and expectations stipulated by the project and the
accuracy and quality required incrementally throughout the design phase. Sometimes the
design method is outlined to alleviate specific problems such as environmental concerns
32
(Trapani and Beal, 1983). The design method was selected as one of the critical success
factors by Sanvido et al. (1992) and Ashley et al. (1987). Identifying the requirements of the
design method is a subject that should be outlined in order for the project to proceed initially
from the design phase and maintain consistency throughout the project.
Review/analysis methods are used to maintain accuracy and quality of the design and include
tools such as value engineering/analysis (VE/VA), constructability reviews (CR), and
environmental reviews done by the involved parties and/or a consultant(s). The owner needs
to how to incorporate reviews/analysis methods throughout the course of the project.
Examining ways to accelerate transportation projects in order to reduce the average amount
of time required for design, review, approval, and construction was mentioned as a barrier
against which reviews/analysis may be a tool for achieving desirable outcomes (Bernstein,
1983). As a strategy, value engineering techniques are used to enhance overall project
performance. Value engineering and constructability reviews are beneficial to the project
performance, but the timing for the value engineering and constructability reviews is
important and should be defined in the plan (FHWA, 2009a). Determining when to hold
constructability reviews is crucial for project success (Pate, 2000).
Existing conditions refers to any structural limitations already in place that need to be
accounted for in order for the design to satisfy the solution required by the owner. Several
case studies were found concerning existing conditions. Martin & Does (2005) described the
process of a bridge demolition project and its affect on the public. This case study identified
issues that need to be considered for the success of the project such as considering various
alignments to avoid removing the existing structure, accelerated removal time to minimize
the impact to the public and avoid costly and lengthy detours, and a detailed demolition plan
for the safety of workers and surrounding structures. Depending on the existing conditions
for a project, many issues may arise that will need to be dealt with in order to achieve
successful project completion.

33
3.3.5 Construction
Within the construction category, quite a few articles identify quality issues as a factor for the
management of complex projects. In an attempt to provide comprehensive guidelines for the
project and construction management of FTA projects, a couple of issues concerning quality
are apparent. First, updating comprehensive project management plans has the potential to
affect project success at every stage of the project. FTA also states that the structure of
quality assurance and quality control programs should be outlined to ensure proper
implementation and to identify possible cost-saving methods/alternatives (FTA, 2003).
Research reports mention quality of construction as an issue for specific delivery types.
Gransberg and Molenaar (2004) analyzed a total of 78 DB projects and discussed the
required use of quality management programs for maintaining minimum quality levels during
design and construction. Mandating that quality management programs are proposed and
implemented throughout the course of the project has a large impact on the success of the
design and construction quality.
There is little research pertaining to projects that had problems solely with safety/health
issues. However, these issues can have serious impacts on projects. According to
Gambatese’s (2000) research concerning the owner’s involvement for safety, unsafe
practices not only affect peoples' lives, but also create cost overrun and schedule delays.
Safety records may be used for contractor performance-based prequalification practices and
may limit the number of bidders that meet acceptable standards. On the design side,
highways cannot be reconstructed as originally designed due to increased emphasis on safety
standards, and this causes increased costs of highway projects (Dallaire, 1977).
Optimization is discussed once among technical factors as a trade-off between cost, schedule,
and quality (Cristobal, 2009). The article presents a model that could optimize cost and
schedule while maintaining a minimum degree of quality. The issue related to cost and
schedule is that quality should always be considered when deciding to accelerate the project
schedule or reduce costs. This article is the only one that identifies optimization as a
potential issue, and research appears to be limited for this factor.
34
The last factor in the construction category is climate. As defined in Section 2.3.5, this factor
pertains to the typical climate of a region that may present management challenges that need
to be planned around. As shown in the technical table in Table A.3 in Appendix A, no
research has been found that classifies climate as an issue for the management of complex
transportation projects.
3.3.6 Technology
New technologies have a higher risk profile and need to be managed according to the specific
needs of the project or of an innovation (Hertogh et al., 2008). The only articles found under
the technology category pertain to project communications, such as the use of specific project
management software, building information modeling, and others. Articles discussing ITS or
automation were not found through the literature review. The subjects discussed concerning
the usage include 4D modeling (Fischer, 2000), paving quality control system (Cho et al.,
2009), high-resolution automated cameras (Bohn and Teizer, 2009), context sensitive
solutions (Olszak et al., 2007), and when and how to specify usage of these technologies and
others that may arise in the future.
3.4 Context Dimension
3.4.1 Stakeholders
“Stakeholder management in a project is critical. It is important to categorise stakeholders
according to their impact on the project…” (Hertogh et al., 2008).
According to the literature review, quite a few articles discuss the public as one of the major
issues associated with the stakeholders. Over half of the articles found relating to the context
dimension identified the public as a major factor for project success. The FTA produces a set
of comprehensive management guidelines and states that “Involvement by the local
community… is essential at every stage of the project development, from planning through
construction” (FTA, 2003). This large government agency has identified that public
involvement must not be taken lightly and should be incorporated throughout all stages of the
project life cycle. Another issue concerned with public satisfaction is the need for projects to

35
be transparent in reporting and decision making and not hide negative components of the
project. Maintaining public support and exemplifying that the public’s resources are being
used on a worthwhile project are major components of project success (Capka, 2004).
Many different types of stakeholders are involved with construction projects. One of the
most important parties is the politicians and the subsequent legislative process. Politicians
define the process that must be adhered to when planning construction projects. The political
process and obtaining approvals of the stakeholders is one of the major causes of delay and
overruns (Booz Allen Hamilton, Inc, 2005). Referring to the Transportation Association of
Canada Briefing (TAC, 2009), political interest arises when the stakeholders are unsatisfied
with repeated congestion, a lack of environmental consideration, and shortfalls in
transportation financing. Controlling the political process and satisfying politicians have the
potential to affect project success. Heavy pressure can come from politicians to minimize
traffic disruption and accelerate the project (Crichton and Llewellyn-Thomas, 2003).
The owner is the stakeholder responsible for making decisions that affect the entire process
and flow of communication. The owner is also accountable for determining which projects
to undertake and for defining the need of a particular project. The culture of the organization
can affect the ability of project managers to effectively complete the project (Gray and
Larson, 2008). Decisions made by the owner impact the other stakeholders, and the process
can be an issue, depending on the level of definition. All projects have the potential for
concerns, depending on the procedure for outlining responsibilities and lines of
communication (Gray and Larson, 2008). The organizational structure is a major barrier and
affects the project throughout the life cycle.
Depending on the type of project, jurisdictions may become involved. As defined in Section
2.4.1, jurisdictions are any external organizations that are affected or have the probability of
affecting the project. Dating back to the 1960s, average project time has grown and
jurisdictional review time is a factor that affects the length of the project (Bernstein, 1983).
Jurisdictional reviews are not a new problem; they have been around for a while. In light of
new environmental regulations, one of the major problems facing project managers is the
limited resources within the jurisdiction and the lack of knowledge demonstrated about each

36
other’s roles and processes (GAO, 2008). Involvement of external agencies can be difficult
to obtain. Either there is a lack of staff or the agencies are unable to provide meaningful
input (Miller and Lantz, 2008). When constructing large infrastructure projects across
multiple borders, priorities and commitments may vary, causing a loss in project value until
the entire project is completed (Hertogh et al., 2008). The incorporation of jurisdictions into
the construction process is a definite issue that affects the project management.
3.4.2 Project-Specific
According to a few different case studies, maintaining capacity of the existing transportation
was an issue while demolishing and constructing new facilities. Determining the process for
minimizing the impact to the public and avoiding costly and lengthy detours was a focus on a
bridge demolition project in Canada (Martin and Does, 2005). Depending on the type of
project, capacity may need to be maintained around the clock. A border crossing station
between the U.S. and Canada had to select the alternative that allowed the traffic to flow 24
hours a day, 7 days a week (Chiu and Teft, 2006). Establishing what can be done in order to
allow capacity to be maintained is a crucial component and has many ramifications.
Identifying the probability of success for a traffic management plan and the type of lane
closures affect the productivity of the work and completion of the project (Lee et al., 2000).
Along with maintaining capacity, ensuring that work zones are properly distinguished is
important for the safety of workers and the public. Alerting the public to altered routes and
clearly labeling work zones are vital issues for taking advantage of opportunities and meeting
expectations (Sorel, 2004a). The public needs to be informed of the project, and methods for
communication need to be defined. Ensuring that contractors are aware of the need to carry
out work zone visualization practices has been noted in Canada. Visualization is a tool that
could be identified and used in planning (Martin and Does, 2005).
The other project-specific issue is whether multiple modes of transportation affect the
planning and constructing of the project. One major problem with intermodal transportation
projects is that there are multiple groups and budgets that need to be accounted for during the
project (Broadhurst, 2004). Considering the alignment used for the project, relocating

37
existing modes of transportation, such as rail lines, may be necessary (Crichton and
Llewellyn-Thomas, 2003). Coordinating relocations must happen between multiple parties
and can affect various modes of transportation.
3.4.3 Local Issues
When implementing a transportation project, the public is one of the stakeholders affected, as
described earlier. The project has the potential to affect the public in different ways,
depending on the decisions made. One common perception of transportation projects is that
outsiders will benefit more from the project than those directly affected, as defined by the
term social equity (Barnes and Langworthy, 2004). Social equity is also an issue in the
United Kingdom, where projects can disadvantage certain groups and, depending on the
location of the project, noise and air pollution can affect groups differently (Davis and
Binsted, 2007). When considering toll infrastructure, pay systems have been noted as
possibly affecting social equity in Canada (TAC 2009). Social equity is a broad issue, and
there are many issues stemming from project decisions that can affect various parties
differently throughout the world. It is important for the owner to identify the social problems
that will be created and solved by the infrastructure project (Hertogh et al., 2008).
Issues related to social equity are demographics, public services, land use, and growth
inducement. These issues are similar to social equity, and all can be affected by the project
decisions made. Demographics refer to the distribution of population in an area where a
project is planned. Public services deal with the project affecting emergency routes. The
location of the project may also end up affecting land use and zoning plans and possibly spur
growth inducement as well. Thus far, no research has been identified concerning these four
issues.
The land acquisition factor pertains to any land that must be procured for the project
including ROW purchases. While reengineering its project development process, TDOT
identified acquisition of ROW as an area that needed to be improved and found that current
legislation can create a barrier for acquisition (Brown and Marston, 1999). The method for
acquiring ROW was also identified as a barrier to project success on a complex project in
38
Colorado (Broadhurst, 2004). In Canada, land acquisition has also been pinpointed as a
process that needs improvement, but agreements for procuring publically owned land held by
historic and tribal agencies has added to the complexity of acquiring land for a specific
project (Chiu and Teft, 2006).
The impact of a construction project has the potential to greatly affect the local economy. In
a study that identified five areas that are crucial for measuring project success, economic
issues were found to be one area of importance (Ashley et al., 1987). In Europe, the project
as a whole must be conceived based on the economic benefits of the project and not just the
completion of the project itself (Hertogh et al., 2008). As discussed in social equity, tolls
also play an important role in the economy of the region as noted in Canada (TAC, 2009).
As indicated in the context table in Appendix A, past research on the effect of a
transportation project on the local economy is limited at this point.
One major factor that relates to notifying the public of the project is marketing. The FHWA
has identified that the process of notifying of the public and media are part of its project
management framework distributed to its project managers (FHWA, 2009a). Marketing
should be a focus during the preplanning of a project, and a variety of methods should be
analyzed and used for effective communication of the project status to its stakeholders (Sorel,
2004a).
Depending on the location, another problem identified is that of cultural differences in the
local area. Communicating and managing in diverse cultures requires the project manager to
be adept in handling multiethnic and multicultural teams (Miller et al., 2000). Project
managers should always be mindful and perform rigorous research pertaining to cultural
differences when working on projects abroad (Gray and Larson, 2008). When working
across borders and in different cultures in Europe, acceptance of the cultural variations and
understanding the differences requires alternative planning techniques (Hertogh et al., 2008).
Another local issue that has the possibility of affecting a project is the ability of the local
workforce to perform required construction activities. Reiterating the local workforce
definition from Chapter 2, this factor refers to the ability of the workforce, not the
39
availability. As shown in the context dimension table in Table A.4 in Appendix A, no
literature has been found that identifies the local workforce as an issue.
Utility relocations and adjustments for projects are common and can impact delays associated
with the project. Very complex utility adjustments can cause major project delays and
project managers need to identify preferable strategies for utility coordination (Chou et al.,
2009). Project managers need to analyze specific utility conflict data and information
between utility accommodation stakeholders and identify the needs for managing utility
conflicts that occur during the course of the project (Kraus et al., 2008).
3.4.4 Resource Availability
As mentioned in Section 3.4.1, one area that lacks the proper resources is the environmental
review agencies (GAO, 2008). This is one type of resource—the workforce— that affects
the coordination of planning transportation projects. On a broader scale, research in Europe
has found that even though focus is given to developing project team management skills, the
training is not sufficient for project team members (Hertogh et al., 2008). Another type of
resource is construction laborers and unions. According to an expressway demolition project
in Canada, one issue that delayed the project was concrete strikes (Crichton and Llewellyn-
Thomas, 2003). Material delivery and equipment are also resources that must be controlled
and have the potential to delay projects (Lee et al., 2002).
3.4.5 Environmental
With the increased focus on sustainable materials, project managers now have to decide the
best course of action for using products not historically used for transportation construction.
There are a multitude of different renewable options that take advantage of recycled
materials, and the need for these materials should be specified (El-Assaly and Ellis, 2000).
Environmental degradation has become an issue, and evaluating sustainable options helps
limit the impact on the environment (TAC, 2009).
The environment provides numerous limitations that must be coordinated and planned
around. Each project contains different external environmental factors that can control

40
decisions made throughout the project. Environmental limitations need to be compared with
other factors, such as cost, safety, and technical decisions, to determine the best solution and
the ideal tradeoff scenario (Trapani and Beal, 1983). Methods for integrating transportation
planning with environmental limitations need to be assessed, and studies should determine
the feasibility between the two aspects (McLeod, 1996). Environmental impacts of the
project should be identified and mitigated accordingly (FTA, 2003).
3.4.6 Legal/Legislative
European research has identified that changes in legislation and obtaining the proper legal
consents have the ability to influence the progression of a project and need to be adequately
planned around. Legislative procedures and project consents were found to be key causes of
major scope increases (Hertogh et al., 2008). The FTA guidelines for project management
state that all legal procedures and laws need to be understood so that the planning team
understands what decisions they are allowed to make (FTA, 2003). As mentioned within the
Local Issues category in this section, TDOT has pinpointed that land acquisition legislation
can create barriers procuring the required land (Brown and Marston, 1999). With the influx
of alternative delivery methods for transportation projects, procedural law may affect the
owner’s ability to use non-traditional contract structures. It would appear that the procedural
law literature pertaining to alternative delivery methods and how it affects the complexities
of projects is relatively scarce. When discussing legal obstacles for alternative delivery
methods, one could assume that either the local governing body allows alternative delivery
methods or they do not.
Along with the legal options available for alternative delivery methods is the willingness and
ability of local firms that can participate in alternative delivery transportation projects. In
particular, DB has a perception that the roles of the public engineering workforce will
change, and this view is a significant barrier to implementing DB in States without previous
DB experience (Gransberg and Molenaar, 2008). As shown in the context dimension table in
Table A.4 in Appendix A, this article is the only research pertaining to local acceptance of
alternative delivery methods.
41
3.4.7 Global/National
Another area that needs to be considered for transportation projects is the effect global and
national issues may play in the management process. The global economy should be
considered when project managers are planning construction projects (Gray and Larson,
2008). A Florida Department of Transportation (FDOT) workshop found that the global
increase in fuel and steel costs adversely affected their bidding market (Casavant et al.,
2007). The increase would probably be due to availability or incidents driving up the costs,
however, the research did not specify what was responsible for the increases. The increase in
costs would contribute to the resource availability category already discussed, but because it
occurred on a global scale it is mentioned within this category. As shown in the context
dimension table in Appendix A, the literature referring to global and national factors is
limited with the exception of the referenced research.
3.4.8 Unusual Conditions
The last category underneath the context dimension is titled unusual conditions. Unusual
conditions have the possibility of affecting transportation projects but are difficult to plan for
proactively. Referring to Section 2.4.8, weather is described as conditions unusual to the
area where the project is taking place. A bridge demolition project in Canada states that
unexpected weather in the form of an unusually wet season affected the plan and the course
of construction had to be retroactively altered (Martin and Does, 2005). A FDOT study also
found that a force majeure event (hurricane) disrupted petroleum supplies and affected the
number of bidders (Casavant et al., 2007). Besides the mentioned articles, research appears
to be scarce in regards to unusual conditions, such as abnormal weather and force majeure
events affecting complex transportation projects.
3.5 Financing Dimension
The important factor to remember in complex project management is that each of these
financing methods comes with its own set of rules and constraints, which could markedly
impact project performance (Dooley, 2009).

42
3.5.1 Process
The legislative process is discussed within the context dimension pertaining to the typical
legal channels that need to be followed for permitting and land acquisition, but this factor is
repeated for the financing dimension. The financing process issues that surround complex
transportation projects are primarily legislative and are examined separately from the
legislative requirements of the other portions of the project. Public agencies must gain
permission from their government to implement new financing methods for the cost of a
capital improvement which has the potential to create management challenges. This then
makes the process susceptible to political pressure from interest groups that have a stake in
maintaining the status quo (Gilbert and Krieger, 2009). The controversy and distrust that was
manifested with the implementation of DB contracting in transportation 20 years ago is a
great example of the primary issue that must be solved before innovative financing can truly
become innovative (Little, 2006; Price, 2002). Any new or innovative type of financing must
adhere to legislative requirements which can create issues for complex projects using non-
traditional financing methods.
Since the legislative regulations vary between jurisdictions, the use of alternative financing
methods may vary. This creates an issue in regard to uniformity of authority from State to
State (Gilbert and Krieger, 2009). One can point to the diversity of alternative project
delivery legislation across the country (FHWA, 2006a) to realize the difficulty in
implementing uniform financing legislation nationwide. Depending on the location of the
project, the lack of uniformity for financing legislative requirements may present barriers
requiring project managers to adapt to the legal obligations required by the state or local
jurisdiction.
Complex projects tend to work in reverse of the principle that financing can be obtained from
public sources once the project has been defined. The financing process is transitioning
towards the financing being arranged in conjunction with the design process (Persad et al.,
2008). Therefore, the focus shifts from how much money is needed to deliver the desired
capacity to how much capacity can be delivered with the available financing. Traditional
projects establish the scope of work, request the funding, and then adjust the scope to fit the
43
funds. Complex projects often must set the budget at a very early stage and then literally
develop the detailed scope of work within the constraints set by available financing
(Heiligenstein, 2009). Thus, the transition of the financing process requires project managers
to be aware of the budget and that the financing “drives” the project’s scope in complex
transportation projects.
With the legislative, uniformity, and transition of the financing process changing for complex
transportation projects, the training of project managers becomes the fourth factor within the
process category that may cause issues. Project managers may need to develop the skills
necessary for effectively managing the financing of a project. They will have to be able to
understand the causal relationships that are associated with each new finance method (Persad
et al., 2008). This may create issues since most project managers have engineering
backgrounds and the current engineering education system furnishes little, if any, instruction
on financial analysis or the business side of engineering (Russell et al., 2000). Therefore,
training and education for the financing of complex projects will need to be a focus for
current and future project managers.
3.5.2 Public
Public financing is composed of two major parts. The first part is a requirement of a negative
cash flow required for planning, designing, and constructing in complex projects. This must
be followed by a positive cash flow from some source such as tax revenue, user fees, or tolls,
to replenish funds expended by the public agency (Persad et al., 2008). Traditional project
management looks at this process in reverse with the positive cash flow occurring first.
Financially complex projects often must generate their own funding to service the debt
incurred by the capital improvement (Heiligenstein, 2009).
As defined in Section 2.5.2, there are five different types of public funding outlined for this
research. The major issues with the first factor, Federal funding, is ensuring that sufficient
funding is available at the State level to qualify for the Federal-aid match. The FHWA also
requires an annual project financial plan to qualify for Federal-aid which can add to the
complexity of funding transportation projects (FHWA, 2007a).
44
The other source of funding comes directly from the States themselves. Taxes are collected
along with fees from motor vehicle users which are then used to support transportation
projects. States usually retain more flexibility in the varieties of their tax revenues and in
their ability to legally expend those tax revenues (Heiligenstein, 2009). However, the major
issue is that taxes imposed by States and localities are collected and administered by various
agencies, departments, and offices and, depending on how a particular tax or fee is structured
or designated in State and local law, a constraint on its use is created. Thus, managers of
complex project will need to have more than just a budget for the project. They will need to
have a financial plan that clearly articulates the allowable usage for every source of funding.
This may alter the way the project is designed to ensure that construction packages line up
with the sources of their funding. The major State transportation taxes are motor fuels taxes
and fees, motor vehicle registration fees, and motor vehicle sales taxes. The issue here is the
political sensitivity to these very visible taxes and fees (Chouinard and Perloff, 2007). These
taxes can be raised, lowered, or eliminated in a State legislature without regard to the fact
that many infrastructure projects’ financial plans rely on revenue forecasts from this source.
An example was an attempt in the Oklahoma legislature to increase the fuel tax to fund
desperately needed infrastructure projects that not only was defeated, but the final resolution
froze the current rate (FHWA, 2002). Currently, State funding furnishes roughly 43 percent
of total surface transportation funding in the country with the federal share equaling nearly
21 percent of the local share that runs around 36 percent (Heiligenstein, 2009). This makes
managing this issue critical for a project’s chances of being built.
Bond financing is another traditional funding mechanism. The issues with this source of
funding are nicely summarized by a report that came from Texas:
Bonds must obtain a certain rating in order to be considered viable. Weaker ratings increase
the lending rate and tax-exempt bonds attract lower rates. In order to alleviate concerns
against low revenue in the early years, bond companies often require a reserve fund of 20 to
25 percent of the bond amount which can limit the amount that can be borrowed. Borrowing
is initially more expensive to the public sector than traditional financing because of
administrative and legal costs coupled with debt issue costs and interest payments, as well as

45
the profit margin required by investors. In addition, if the contractors are aware of the
revenue estimates for the project, they may bid up to that level. The public sector must have
a competitive bidding process and must establish a set of tools for evaluating bids (Persad et
al., 2008).
Another type of public funding is the ability to borrow against future funding. The
Intermodal Surface Transportation Efficiency Act of 1991 (ISTEA), the National Highway
System Designation Act of 1995, and the Transportation Equity Act for the 21st Century
(TEA-21) of 1995 (FHWA, 2002) were enacted to create financial mechanisms to deliver
much needed infrastructure projects when the State does not have the required funding to
qualify for a federal match. If the project can be paid for using currently available Federal
funds, then the long-term result is a benefit to the government to limit increased market costs
due to projects with limited state funding. The bills permit the State to borrow their share in
anticipation of future Federal grants (FHWA, 2002). The major issue is that the State is
essentially mortgaging its access to future Federal aid when it uses these innovative financing
alternatives.
The last factor within the public category is called “advanced construction.” This method
allows a State to begin a project even if the State does not currently have sufficient Federal-
aid obligation authority to cover the Federal share of project costs. The Connecticut State
Department of Transportation advanced a major bridge project with a total construction cost
of $55.4 million through partial conversion of a $35.7 million component. Connecticut
spread its Federal-aid obligations for the I-95 bridge project over two years, enabling it to
redirect some funds to other smaller bridge projects (FHWA, 2002). The project
management issues here involve packaging the project’s major work features in a manner
that allows them to be separately identified and funded. This method also involves the
potential reduction of future State funding for other projects by expending those funds today
(Resource, 2007).

46
3.5.3 Revenue Stream
All of the methods of financing in this category assume that the transportation asset can
furnish an end result that the public is willing pay for over a period of time. Many of these
projects are funded by bonds issued against the future revenue’s ability to adequately service
the debt. Therefore, the cost estimate used to determine the size of the bond issue is
generated at a very early stage in project development making the development of
appropriate contingencies for cost escalation difficult (Touran, 2006). It also creates a fixed
schedule for the project delivery process because the debt instruments will require service
starting on the date specified in the bond. Project managers must design to a fixed budget
within a timeframe set by the parameters of the financing method, not the technical demands.
The issues with revenue generation deal with ensuring that the post-construction revenues are
sufficient to not only cover the debt but also to cover the operation and maintenance costs of
the facility (Harder, 2009). This also drives design decisions for those features of work, such
as pavements that could jeopardize the financial plan if they fail prematurely or require more
maintenance or rehabilitation to service the traffic demand placed on the road. Also, the
amount of revenue is directly related to the amount of traffic that uses the facility. Estimates
of traffic growth must be realized to generate sufficient revenue to retire the debt as planned
(Persad et al., 2008). As noted above, the financing drives the decisions made during
planning and design of a project instead of the technical requirements.
The primary issue with VMT fees is the ability of the State to measure the number of miles
traveled so that it can assess the appropriate fee for each traveler (Whitty 2007). The other
issue is one of privacy. The advent of global positioning systems allows the tracking of
vehicles, and many civil liberty groups are vehemently opposed to any form of government
intrusion (Whitty, 2007).
Cordon/Congestion pricing has the added benefit of redistributing traffic patterns away from
congested areas by making it costlier to use them than other facilities. The major issue is
dealing with the political backlash from disgruntled users and the business community whose
traffic will drop. This issue will be particularly keen for cordon pricing, where the cost of

47
deliveries, taxis, worker commuting costs, etc. will skyrocket as a result of the daily
requirement to enter the cordon zone (Kirby, 2007).
3.5.4 Asset Value
While the idea of monetizing existing transportation assets seems promising, the issue of
identifying the standard to which a public highway must be maintained can halt a project
(Harder 2009). Additionally, the perception that leasing out tax-funded capital
improvements constitutes a violation of the public trust must also be overcome. This goes
against the traditional usage of public facilities and the idea that the government is not a
profit-making entity. The FHWA defines the remaining issues as follows (FHWA, 2009c):
• Potential undervaluation of an asset to be leased • Loss of public control over toll rates • Loss of public sector revenue streams • Potentially burdensome toll increases • Inequitable return on private sector equity • Channeling toll proceeds away from transportation purposes
All of these issues need to be considered by project managers when this type of financing is
being explored for the funding of complex transportation projects.
The issues described above for monetization all apply to franchising, albeit at a lower
monetary level. Franchising is being used to finance transportation improvements like ITS or
public wireless communication systems in transportation corridors. It is usually used on a
smaller scale and therefore will not generate the same level of potential political opposition.
However, the state must still assess the risk of the franchisee leaving the concession
prematurely. Additionally, the contract with the franchisee will be a new type of instrument
where unfamiliarity may arise with the public contracting officials (Verhoef, 2007). “Most
franchise agreements stipulate a return on investment that is often based on an assumed rate
of growth. Therefore, the final issue is developing remedies for the agreement if growth
rates are not realized” (Orski, 1999).
The most exotic form of this kind of financing is the sale of carbon credit sales (MACED,
2008) associated with a given project to finance its construction. “The carbon stored by trees

48
has a market value because corporations seeking to offset their carbon output can purchase
carbon off set credits on an international market” (MACED, 2008). No instances of the use
of this method were found in the department of transportation arena; however, local
transportation authorities have been using it for years. This form of financing would seem to
be easy to implement if the political context issues could be overcome. The public
perception issues discussed above will also apply with this type of financing. Additionally,
the pledge to not develop those assets that are designated for carbon credit sales could reduce
an agency’s ability to meet expanding design requirements with added capacity on existing
ROW. The final issue is that the theory of carbon credit sales is controversial in and of itself
(Fulton and Vercammen, 2009).
3.5.5 Finance-Driven Project Delivery Methods
P3s are the most well-known finance-driven project delivery method and often consist of
tolling facilities. Concessions and CDAs are specific forms of P3s (Heiligenstein, 2009). In
these projects, the government often acts as a type of guarantor for the developer when it
approaches the bond market to secure the necessary funds. An issue with P3s is that there are
often many entities with specific purposes for the execution of a P3 and if one entity has too
much responsibility it may create a conflict of interest (Vining and Boardman 2008). Other
issues involve ensuring that the procurement process is “reasonably competitive”. The size
of most P3 projects is so great that it may be impossible to obtain a truly competitive pricing
structure. The private sector concessionaire must also be prevented from selling the contract
too early. A P3 becomes an asset with value and, if profitable, could be sold at a profit if the
agreement does not address this issue.
3.5.6 Risk
The final category is not really a financing method, but rather a set of tools that can be used
to mitigate the risk of cost overruns and failure to achieve the necessary fiscal requirements
that define a successful project. The first tool is commodity-based hedging against
construction material price escalation (Courteau et al., 2007). A project that includes a large
amount of one material that could be technically substituted for another material could

49
compare the price volatility of those two materials and make the design decision to use the
less volatile material if the cost was within reason. Selecting the less volatile commodity
reduces the escalation risk that must be accounted for by contingencies. The agency has two
other options if substituted material options are not available. The agency could plan to
incorporate an escalation clause in the solicitation documents to share the risk with its
contractors, but that leaves the agency with a future need to find additional funds if the
commodity prices rise. The second option is to “purchase enough forward contracts or
futures with the proper duration… so that [the agency] can cash in the contracts at expiration
and use the profits made to cover the losses on the contract and transaction fees” (Courteau et
al., 2007). However, this is not without cost. Transaction fees usually run around 1 percent.
The issue here is the level of risk taken in the financial marketplace by a public entity. Many
taxpayers may abhor the idea that a public agency is putting tax monies at risk in the fickle
commodities market. Thus, the process should be transparent and well-publicized.
The second tool is the use of global participation. Allowing companies from other countries
to compete for and win infrastructure projects brings new blood to the project and may allow
the agency to accrue a benefit from a different set of business model standards. For example,
a company from a region of the world where hyperinflation is endemic to the construction
industry and where the government is struggling to meet its obligations might find a U.S.
project, where inflation is three to nine percent, a pretty tame market. Especially considering
the U.S. government can be trusted to pay its bills. On top of that, the U.S. dollar is much
less volatile than many of the currencies in the world which would further reduce the risk to
an international venture (Brown et al., 2009). The major issue is allowing foreign contractors
to compete for U.S. projects. Defining the national impact of a foreign entity controlling an
asset that is vital to the U.S. economy is crucial. Additionally, the benchmark used by
international firms will be different than that used by U.S. contractors because of differential
inflation and currency exchange rates. Finally, the issue of local participation must also be
addressed when diversifying a project’s financing via global participation (Mather and van
Aalst, 2009).
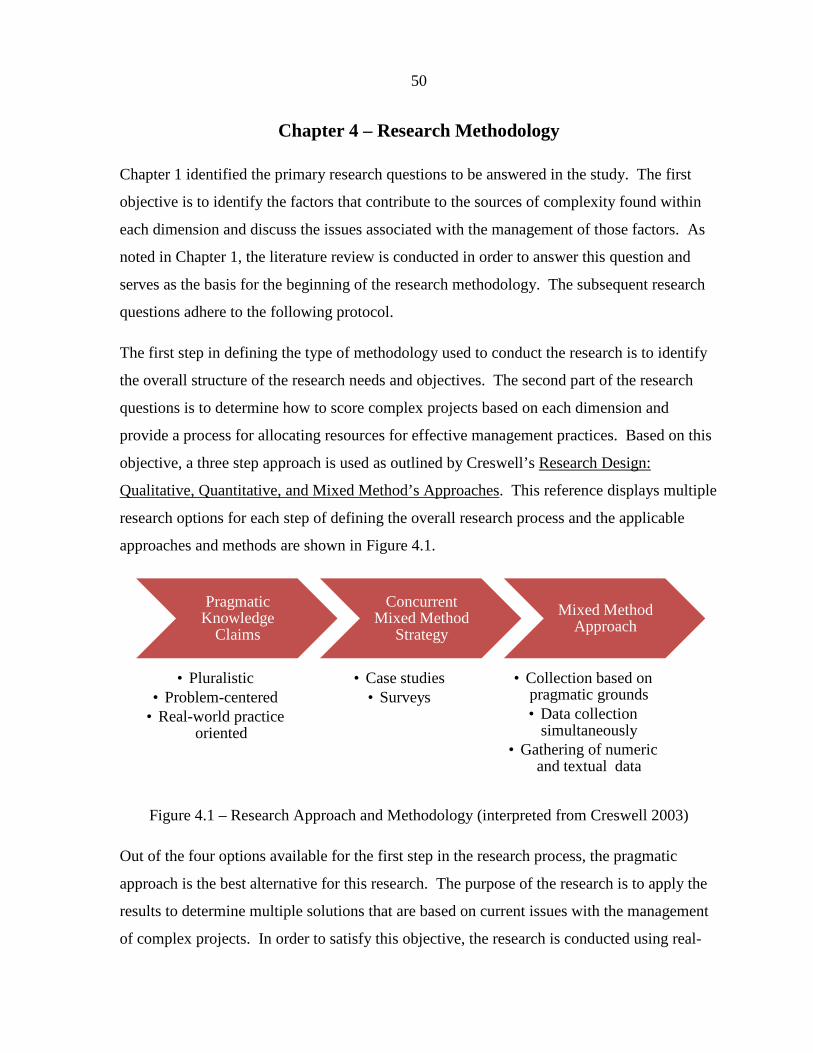
50
Chapter 4 – Research Methodology
Chapter 1 identified the primary research questions to be answered in the study. The first
objective is to identify the factors that contribute to the sources of complexity found within
each dimension and discuss the issues associated with the management of those factors. As
noted in Chapter 1, the literature review is conducted in order to answer this question and
serves as the basis for the beginning of the research methodology. The subsequent research
questions adhere to the following protocol.
The first step in defining the type of methodology used to conduct the research is to identify
the overall structure of the research needs and objectives. The second part of the research
questions is to determine how to score complex projects based on each dimension and
provide a process for allocating resources for effective management practices. Based on this
objective, a three step approach is used as outlined by Creswell’s Research Design:
Qualitative, Quantitative, and Mixed Method’s Approaches. This reference displays multiple
research options for each step of defining the overall research process and the applicable
approaches and methods are shown in Figure 4.1.
Figure 4.1 – Research Approach and Methodology (interpreted from Creswell 2003)
Out of the four options available for the first step in the research process, the pragmatic
approach is the best alternative for this research. The purpose of the research is to apply the
results to determine multiple solutions that are based on current issues with the management
of complex projects. In order to satisfy this objective, the research is conducted using real-
Pragmatic Knowledge
Claims
• Pluralistic• Problem-centered
• Real-world practice oriented
Concurrent Mixed Method
Strategy
• Case studies• Surveys
Mixed Method Approach
• Collection based on pragmatic grounds• Data collection
simultaneously• Gathering of numeric
and textual data
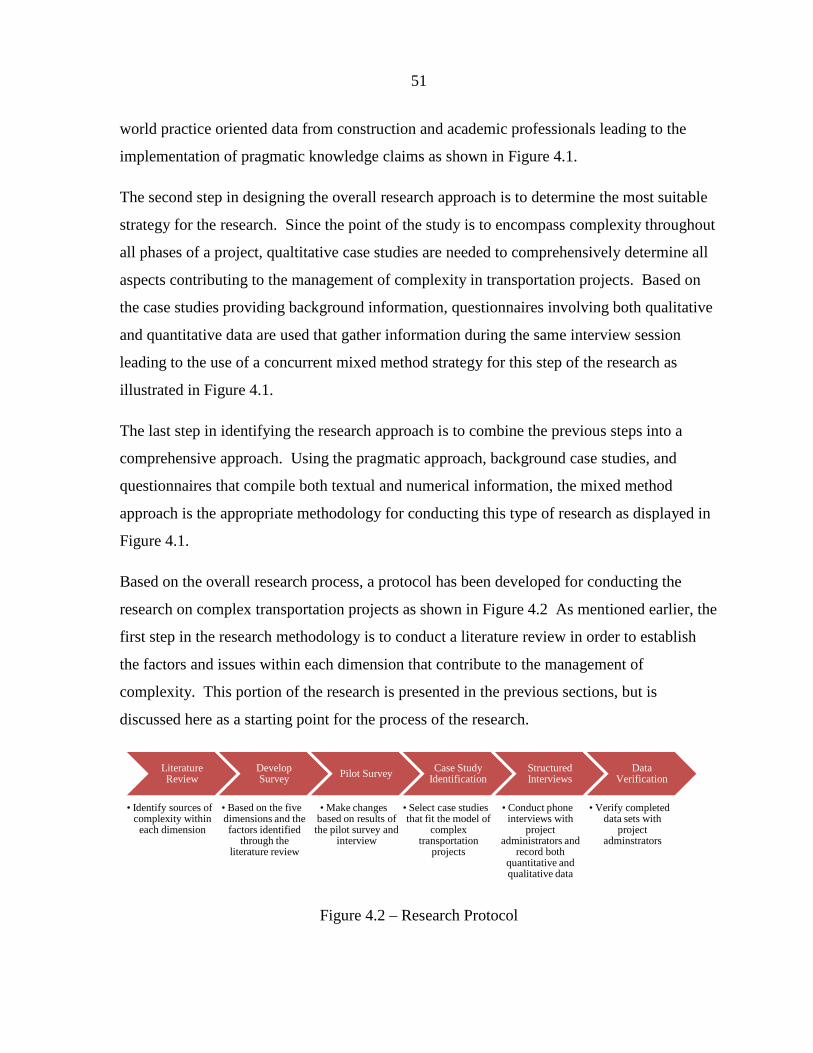
51
world practice oriented data from construction and academic professionals leading to the
implementation of pragmatic knowledge claims as shown in Figure 4.1.
The second step in designing the overall research approach is to determine the most suitable
strategy for the research. Since the point of the study is to encompass complexity throughout
all phases of a project, qualtitative case studies are needed to comprehensively determine all
aspects contributing to the management of complexity in transportation projects. Based on
the case studies providing background information, questionnaires involving both qualitative
and quantitative data are used that gather information during the same interview session
leading to the use of a concurrent mixed method strategy for this step of the research as
illustrated in Figure 4.1.
The last step in identifying the research approach is to combine the previous steps into a
comprehensive approach. Using the pragmatic approach, background case studies, and
questionnaires that compile both textual and numerical information, the mixed method
approach is the appropriate methodology for conducting this type of research as displayed in
Figure 4.1.
Based on the overall research process, a protocol has been developed for conducting the
research on complex transportation projects as shown in Figure 4.2 As mentioned earlier, the
first step in the research methodology is to conduct a literature review in order to establish
the factors and issues within each dimension that contribute to the management of
complexity. This portion of the research is presented in the previous sections, but is
discussed here as a starting point for the process of the research.
Figure 4.2 – Research Protocol
Literature Review
• Identify sources of complexity within each dimension
Develop Survey
• Based on the five dimensions and the factors identified
through the literature review
Pilot Survey
• Make changes based on results of the pilot survey and
interview
Case Study Identification
• Select case studies that fit the model of
complex transportation
projects
Structured Interviews
• Conduct phone interviews with
project administrators and
record both quantitative and qualitative data
Data Verification
• Verify completed data sets with
project adminstrators
52
From the results of the literature review, a questionnaire is developed that poses both
qualitative and quantitative questions. A copy of the questionnaire can be found in Appendix
B. The first page of the questionnaire explains the purpose of the questionnaire so that the
interviewee understands the rationale behind the information that is being gathered (Gilham
2008). Although most of the information desired from the questionnaire is qualitative in
nature, it represents more of a mixed method approach because of the scoring found at the
end of each dimension. In order to compare and evaluate the dimensions against each other,
numerical scoring is deemed the most appropriate strategy. The general flow of the
questionnaire is to discuss the factors that contribute to complexity within each dimension
and compare the complexity of the particular category against other projects that have been
worked on by the participant. Each dimension is represented by its own section and different
questions are visually distinct from each other so that the interviewee is clear when the
process is changing to a different section (Gilham 2008).
The discussions between the interviewer and interviewee serve as a basis so the interviewee
has an understanding of the complexity for the dimension and can ultimately assign a
numerical score for the specific dimension. The numerical scoring found at the end of each
dimension uses a numerical scale with seven number options with equal incrementation
based on the premise of no more than seven number choices, plus or minus two, for capacity
of processing information (Miller 1955). The scale is set on a line so that the participant is
allowed to select a number that is in between the defined scale. The scale does differ from
traditional scales in that zero is not an option due to the assumption that no project would
have zero complexity for any of the five dimensions. Since scoring occurs at the end of each
dimension, the process is set up with a summary section at the end of the questionnaire.
Therefore the interviewee can think about the project as a whole and compare dimensions in
order to verify that the numbers chosen for each dimension accurately reflect the intent of the
participant. In addition to the summary section, the last page of the questionnaire
incorporates a request for a follow-up verification and a consent box is presented to verify
that the interviewee is willing to provide additional information and verification (Gilham
2008).

53
Once the questionnaire is developed, the piloting stage becomes the next step in the chain as
shown in Figure 4.2. According to Gilham’s Small-Scale Social Survey Methods the piloting
stage is an integral part that should be completed to define the following (Gilham 2008):
• “whether the content of the interview or questionnaire needs any changes;” • “whether, as a whole, it works as intended;” • “whether the stage of analysis throws up any difficulties.”
This research piloted the questionnaire on one project in order to fulfill the requirements
presented above. Time was spent reviewing the findings of the pilot and a blank version of
the questionnaire was used so that necessary changes could be marked as the pilot was
conducted (Gilham 2008).
Before the questionnaires can be undertaken case studies need to be identified as shown in
Figure 4.2. The case study information represents the other part of the mixed-method
strategy as displayed in the overall research progression shown in Figure 4.1. For this
research, case studies are selected that represent the definition of complex transportation
projects outlined in the introduction section. Projects meeting the complex requirements are
discovered through Transportation Research Board (TRB) meetings, FHWA websites, and
referral sources. A total of five cases are selected that are geographically dispersed across
the United States so that dimensional complexity can be compared depending on the region.
A map of the geographic distribution of the projects is found in Appendix C. The cases were
selected carefully with logic and replication serving as premises (Yin 2003). In order to
perform the questionnaires successfully through interviews, background research is
conducted using archival research and documentation. The case studies research also relies
on information provided through the interview process discussed next. These three sources
of evidence satisfy the first principle necessary for effective case study research in that
multiple sources of evidence are used (Yin 2003). The other two principles are satisfied
through the study of multiple case studies (creating a case study database) and documenting
all information found through the research process (maintaining a chain of evidence) (Yin
2003).
54
Once the case studies are selected and background research has been found, the interview
process becomes the next step as shown in Figure 4.2. The interview process is conducted
using either face-to-face or over the phone with representatives from the project that are
familiar with all aspects of the project and have adequate prior construction experience.
Before the scheduled interview, the questionnaire is sent out so that the participant can
review and familiarize themselves with the study (Gilham 2008). The bulk of the
information is gathered during this stage, making it crucial that the interview is structured
and comprehensive. A copy of the interview structure can be found in Appendix B. Since
the interview process is critical, the interviewer is responsible for keeping a blank copy of the
questionnaire and recording all of the results as the interview progresses (Gilham 2008).
Telephone interviews are used for this research because of the geographic distances from the
participants. They are also used in lieu of merely sending the questionnaire to the
interviewee and asking for the participant to fill in the applicable information. The
questionnaire is long and comprehensive and without the direction of the researcher it is less
likely to be completed accurately, or at all (Gilham 2008).
The last step in the research protocol is data verification. All of the information gathered
needs to be accurate. As mentioned during the creation of the questionnaire, this is
conducted using two different methods. The first is the use of the summary section. This
section allows the researcher to transfer the scores from each dimension and assists the
interviewee in examining all of the dimensions together. It also assists in verifying that the
provided scoring accurately reflects the intent of the participant. The second method is the
use of the follow up verification. During the interview, the interviewer records all of the
qualitative information and summarizes the data on a completed questionnaire. The
completed questionnaire is then sent to the participant so that all of the information can be
confirmed or corrected if necessary.

55
Chapter 5 – Case Studies & Questionnaires
The main objective of this research is to analyze complex transportation projects and map the
complexity of each dimension. The following sections discuss the case studies that have
been chosen for the project. Each case study begins with a background of the project from
archival research and then transitions into the questionnaire results. The discussion of the
results presents the portions of the project that made the project complex and why those
factors required more, or different, management techniques. Each discussion is arranged by
dimension for clarity. During the discussion of the questionnaire, a radar diagram is
presented for each project that maps the numerical data for each dimension as it is scored by
the project participant. The next chapter will analyze the aggregate findings of all case
studies, looking for similarities and differences between the projects, as well as how the
overall findings of the research may be used by industry professionals.
5.1 E-470 Segment 4
5.1.1 Background
The E-470 project is located in Colorado and is a new asphalt four lane (six in some places)
highway construction project owned and operated by the E-470 Public Highway Authority
(E-470 PHA) (Salek, 2009). E-470 as a whole has four segments, the fourth of which is used
for this study. The total project length is approximately 47 miles and stretches from I-25 on
the North side of Denver, Colorado around the eastern edge and meets back up with I-25 on
the South side of the city (E-470 PHA, 2010). Segment four is from 120th Avenue northwest
to I-25 on the North side of the city and is about 12.5 miles long (Salek, 2009). The project
was constructed using the DB procurement method. The total cost of Segment 4 is $250
million which was the amount of the DB contract. This figure does not include ROW
acquisition and initial planning costs performed by the owner (Interview Participant #1,
2010). The road was built as a tollway, which is one of the methods used to finance the
project. Bonds, vehicle registration fees, investment income, highway expansion fees, and
new development fees were also used to fund all segments of the project bringing the total
cost to $1.2 billion. In addition to these financing methods, a form of P3s were used for the

56
construction of the interchanges quickly where major landowners donated the property
required for the interchange construction (GACC, 2005). The contract for Segment 4 started
in January of 2000 and construction commenced in September of the same year. The first
four mile portion of Segment 4 opened in 2002 and the rest opened in 2003. One of the
major components of this project was the implementation of ITS. Fiber optics run the entire
length of the project which are used for toll collection and camera enforcement. Currently,
there is no option for paying tolls using cash. Cameras take pictures of the vehicle if they do
not have a tag and mail the payment to the vehicle owner. This is the first tollway to use this
type of high-speed electronic toll collection (Salek, 2009). Some of the main issues
pertaining to complexity on Segment 4 of the E-470 project are environmental impacts which
created potential lawsuits, growth inducement from the residential and commercial sectors,
political and public concerns, expansive soils, and private land ownership (Salek, 2009;
GACC, 2005). Projects along E-470 continue to this day, but for the sake of this research
only Segment 4 has been studied and analyzed as far as the sources contributing to the
complexity of the project.
5.1.2 Interview and Questionnaire
A phone interview was conducted with the Chief Engineer for Segment 4 of the E-470
project. The participant has worked in construction related fields for approximately 40 years
and has been a part of 16 major projects, both in the railroad and highway sectors. The
sources of complexity found on the project are discussed for each dimension below
(Interview Participant #1, 2010).
5.1.3 Cost Dimension
A majority of the cost categories were found to be slightly more complex compared to other
projects that the participant has worked on in their career. The participant leaned towards a
little more complex for the risk, preliminary program, and planning/construction categories.
Some of the issues leading to cost complexity are that there was a lot of risk in the initial
stages concerning the feasibility of the toll revenues and of the project as a whole. Once the
project contract was signed, a lot of the risk was transferred and therefore alleviated in the
57
later stages of the project. The cost estimation phase was a difficult process because the
estimates were being performed with little design work completed. The other factor that
increased the complexity of the cost dimension was that there were more incentive and
disincentive clauses used because of the DB contracting method. The design-builder could
share in the revenues, but the contract was also heavy in liquidated damages. According to
the participant, the issues category was less complex for this project. There were not a lot of
material or transit user cost issues.
5.1.4 Schedule Dimension
One of the big issues with the E-470 project was the project timeline. The bonds were
floated with the expectation that the revenue projections would start at a certain time leading
to the time category being more complex. There was also a lot of schedule risk due to
uncertainties with the ROW acquisition process, the crossing of irrigation districts, and
obtaining environmental clearances. The DB contract was actually executed without all of
the environmental clearances finalized. Based on the participant’s experience, the schedule
risk category was more complex compared to other projects. The last two schedule
categories, planning/construction and technology, were rated similar and less complex,
respectively. Milestones were an issue due to the factors discussed within the risk category,
but the rest of the factors were not major barriers. The technology used for scheduling
purposed was less complex and did not provide significant management challenges.
5.1.5 Technical Dimension
The technical dimension as a whole had a wide range of complexity for its categories.
Generally, most of the technical components were found to be similar or less complex since
this was the last segment of the project and the scope, standards, and design were already
well defined. Also, the owner was already familiar with the DB process through the earlier
segments so the internal structure was not a major issue. One category that was found to be
more complex was the contract. The DB method caused some issues with the delivery of the
project because it was not as common and accepted as it is today. There were also two major
disputes that had to incorporate the use of a disputes review board process. During the
58
construction phase, quality caused an issue concerning a pavement dispute. The participant
noted that it was difficult to analyze and quantify the size of the defect and determine the
appropriate fix. One major technical application as discussed during the background of the
project was the use of ITS and the tolling system. Fiber optics and cameras were installed
during the construction of this segment of the project. However, based on the discussions
during the interview a lot of the advanced technological systems that are currently being used
on the tollway were installed after the completion of Segment 4. Therefore, the technology
category was found to be of a similar complexity level.
5.1.6 Context Dimension
The stakeholders category was ranked a little more complex. The public affected the
alignment and the entire process was very political. Since the project spanned through
multiple jurisdictions, there was a lot of interest by the local agencies, but they were
generally supportive. There was some concern from the outlying areas that the road would
eventually reach their districts and it was seen as a potential threat. Segment 4 was a new
transportation project so there was not a lot of concern with maintaining capacity or
workzone visualization. The medians were designed and constructed to accommodate future
intermodal services (light rail), but overall the project specific factors were less complex.
The remaining context categories were all found to be similar or less complex. There were
some social and demographic issues and new emergency routes had to be created. Some
areas saw some growth inducement and portions of land underwent condemnations to abide
by the alignment. The marketing for the tollway continues to this day and the marketing plan
has changed and evolved throughout the course of the project. One of the major local issues
was the coordination of the drainage ditch crossings because the irrigation districts hold a lot
of power in Colorado. As mentioned during the cost dimension, obtaining the adequate
environmental clearances caused some management issues. In addition, approximately 60
acres of wetlands had to be replaced and there was some hazardous material remediation and
disposal. There were no legislative or local acceptance issues because E-470 as a whole was
authorized to use DB. Pertaining to the DB contract, the state of the global/national economy
actually contributed to sufficient competition for the contract. Lastly, there was a bad winter

59
that was unusual for the area that had to be planned around, but it did not alter the cost, only
the schedule.
5.1.7 Financing Dimension
Based on the interview with the project participant the financing dimension was clearly the
most complex. This project used multiple types of financing as discussed in the background
which added to the management complexity of this dimension. The participant stated that
the overall financing process category was more complex due to the transition to the use of
debt financing. The first type of financing used, public, was more complex. The public
license fees per vehicle created controversy, however, it was voted in by the public. The
bond issues were complex and the participant stated that the process of borrowing against
future funding is always a complex endeavor. The other type of financing used, revenue
stream, was also deemed more complex. Generally, people do not like paying tolls which is
where revenue is generated for this type of facility. In order to conduct the bankable traffic
and revenue study, only three firms within the U.S. are licensed to perform the work. This
limited the options of the project team. Specific to this type of financing, the bank holder is
at risk if the anticipated tolls do not meet the realized revenue generated by the tolls which
added to the financing complexity. A plan of finance also was required to project the tolls
and toll increases. A sensitivity analysis was performed to define the coverage ratio to assure
the bonds are paid. All of these factors along with the public financing issues led to the
financing dimension being more complex than other projects. The project team also
entertained proposals for private financing and long term maintenance which required
resources that could have been used elsewhere.
5.1.8 Analysis & Discussion
The sections above presented and discussed the factors and the issues contributing to the
complexity of those challenges. At the end of each dimension, the participant was asked to
numerically score the dimension as to the complexity of the overall dimension on a scale of
10 to 100, with 55 being an average project. The results for the E-470 Segment 4 project are
presented in Figure 5.1. As shown in the radar diagram, the project appears to be complex

60
throughout all dimensions, with the greatest complexity occurring for the financing
dimension at a score of 80. The financing issues were very complex through the use of
multiple funding methods. Alternately, the technical dimension received a 50 which is the
lowest score for all dimensions. This is consistent with the discussion of the technical
dimension issues. The scope, design, and standards were already well defined by the time
Segment 4 was initiated concluding that the management of this dimension was not very
complex. The other three dimensions appear to be similar to one another and fall in between
the highest and lowest dimensions, although still relatively high on the complexity scale.
According to the radar diagram, the project team would want to ensure that managers or
professionals with strong financial backgrounds are allocated to this type of project.
Figure 5.1 – Radar Complexity Diagram (E-470 Segment 4)
0
20
40
60
80
100Cost
Schedule
TechnicalContext
Financing
Radar Complexity Diagram (E-470 Segment 4)
E-470 Segment 4

61
5.2 Trunk Highway (TH) 212 Design-Build
5.2.1 Background
The TH 212 Design-Build (TH 212 DB) project is a 11.8 mile, 4 lane project on new
alignment that runs southwest through the suburbs of Minneapolis, Minnesota. The purpose
of the project was to improve traffic safety, capacity, and decrease congestion. The new
alignment connects at the existing 312 and 212 Highways. Along with the new mainline, 28
bridges, 7 interchanges, and 6 overpasses were built into the design of the project. The cost
of the project was $238 million, which did not include preliminary design and ROW
acquisition costs. Initial project discussions date back as far as 1950’s when the alignment
was set, but the project was delayed due to multiple Environmental Impact Statements (EIS),
funding issues, and public input. Once the project was slated for implementation by the
Minnesota Department of Transportation (MnDOT) it was divided into two parts, Phase 1
and Phase 2. Phase 2’s title eventually changed to TH 212 DB. The second phase, or TH
212 DB is the part of the project that has been used for this study. As indicated by the
project name, the procurement method was a type of DB through the use of a joint venture.
The DB contract for this portion of the project was awarded in 2005 with construction
starting in August of the same year. Parts of the project were completed and opened
incrementally, with a final overall completion date of September 2008. Some of the major
sources of complexity related to the need for a depressed roadway leading to the design and
installation of berm and noise walls as well as many utility relocations and the construction
of new utilities (MnDOT, 2005). The financing for the project was approximately 80 percent
federal and 20 percent state monies. The majority of the state money was from state bonds.
In addition to these sources, there was a cooperative agreement with the cities where local
funding was to be used for any enhancements in their particular area (Interview Participant
#2, 2010).
5.2.2 Interview and Questionnaire
A phone interview was conducted with the Design Review Engineer/Project Manager for the
TH 212 DB project. The participant has worked in construction related fields for
62
approximately 21 years and has been a part of 20 major projects. The sources of complexity
found on the project are discussed for each dimension below (Interview Participant #2,
2010).
5.2.3 Cost Dimension
Only one cost category was deemed more complex for this project. The
planning/construction category encountered issues when it came to the payment restrictions
imposed on MnDOT. The project had intermediate completion dates and the contractor was
working ahead, but MnDOT was restricted by payment caps that were specified after the
award of the contract. They had issues being able to pay the contractor for the actual work
performed ahead of schedule. It was difficult to accelerate work based on the budget
constraints. The issues category was the other that was slightly more complex than average.
Fuel costs were an issue and there was a fuel clause in the contract. The contractor ending up
getting paid regardless of how high the fuel costs rose. One of the interchanges was also
accelerated so that construction could finish one year earlier for transit user benefits. The
interchange was accelerated to reduce congestion on the existing, surrounding routes. The
other two cost categories were found to be of a similar complexity level. One risk that was
encountered was a potential cost impact due to the construction of the route over a sanitary
sewer line. The major issue with the estimates was the difficulty with the sheer size of the
project and that the initial alignment was set in the 1950’s so the original estimates were
outdated.
5.2.4 Schedule Dimension
The schedule dimension found that two categories were more complex, time and technology.
The timeframe of the project was an issue because using the DB method accelerated the
phases of the project. Concerning the technology used for scheduling purposes, the
contractor was required to use specific software and provide cost and resource loaded
schedules upon award which were reviewed monthly by MnDOT. There were three different
types of software programs used by all of the entities on the project and they did not always
work well together. Systems had to be used that could modify the schedule due to the
63
payment cap issues in the cost dimension without the advent of claims. Both the risk and
planning/construction category were similar to other projects. The same sanitary sewer issue
discussed in the cost risk had the potential to contribute to schedule risk depending on the
solution that was implemented. The issues with the planning/construction phase were also
the same as the cost dimension. The ability to optimize the schedule was hindered by
MnDOT’s ability to pay for the accelerated work. Another source of complexity that did not
fit with any of the defined factors was the juggling of multiple schedules which also added to
the management complexity.
5.2.5 Technical Dimension
All of the categories within the technical dimension were either similar or more complex
compared to an average project. The scope was well defined, but the size of the project made
it complex. There were more elements associated with this project, nearly 12 miles, 28
bridges, and berms/sound walls. The internal structure was one category that was similar.
MnDOT has performed a couple of DB projects before and lessons learned were
incorporated into the TH 212 DB project. Along with the internal structure, the contract
category was also similar due to the familiarity with DB delivery and the dispute process
already being defined. The design was one category that was found to be more complex.
The design had to alleviate the impact on the wetlands and the sanitary sewer line mentioned
earlier. The constructability review process was more complex because of the size of the
project and accelerated schedule. More reviews were held more often because of the
expedited timeline. A very formal process was used to reduce scope creep while MnDOT
kept an eye on quality and the contractor assured the contract requirements were coinciding.
One method used by MnDOT was to require potential bidders to be familiar with MnDOT
standards during the request for qualifications stage. Another design issue was solved
through the value engineering process to realign an existing roadway because of concerns
about highly erosive banks. The other category that was slightly more complex occurred
during the construction phase. The main issues related to quality which would not be
sacrificed for reduced costs or accelerated schedule. The contractor also wanted to let all of
the rainwater runoff into the median which sparked many discussions and concerns about the

64
quality of the end product. This project was undertaken in Minnesota winters, so typical
shutdowns were encountered, but nothing out of the ordinary. Pertaining to safety, there was
one death on the project, but it came late in the project so it only affected morale. The last
category in the technical dimension was the technology used. Global positioning systems
were used on the scrapers, but that was the extent of the technology so this category was
rated similar.
5.2.6 Context Dimension
The context dimension found two categories that were of a more complex nature. The
stakeholders were the first one that had management issues. There were a lot of public issues
relating to the sentiment “not in my backyard”. During municipal consent meetings some of
the public was very opposed to the project, particularly those closest to the alignment.
Another issue with the municipal consent process was that the project needed individuals that
were good at it because the project timeline was quicker due to the use of DB. The
municipal consent process had to be clearly defined from the outset of the project. The last
issue with the stakeholders was noise complaints brought on post-construction. MnDOT had
to prove to the public that they followed Environmental Protection Agency (EPA) standards
with the use of the berms and sound walls. The other category that was more complex was
environmental. Some of the issues have already been mentioned under different dimensions,
but more were found under context that contributed to the complexity. Besides the design
changes to alleviate some of the concerns, 30 acres of wetlands were replaced at a ratio of
two to one. Because of the alignment, an extensive environmental study was also needed. In
addition, one year was spent working on agreements for joint permits for all environmental
issues prior to the issuing of the request for proposals.
The other category that was slightly more complex was the legal/legislative process. The DB
statutes were already in place, but the permitting timelines were accelerated because of its
use. Permits had to be procured based on the overall project concept and individual site
plans were submitted as the project progressed. The rest of the context categories were found
to be similar or slightly less complex than average projects. Some of the other factors that
added to the management issues were: the rerouting of some traffic ultimately lengthening

65
routes, rain on frozen ground that affected erosion control and caused a fine for the project,
lots of growth inducement and land use alteration, acquisition of some land, closing of one
road affecting emergency routes, a marketing plan required by the request for proposals, and
lots of utility relocations.
5.2.7 Financing Dimension
During the course of the interview all of the financing dimensions were found to be of similar
complexity. One of the issues already discussed associated with the financing process was
the payment cap issue and the ability for MnDOT to pay work that was performed in advance
of the schedule. Besides this issue, no abnormal management issues were found concerning
the financing dimension. A form of commodity based hedging was used since all of the
material prices were essentially locked in at an early stage once the DB contract was
executed with the exception of the fuel clause.
5.2.8 Analysis & Discussion
The above sections presented and discussed the factors and the issues contributing to the
complexity of those challenges. At the end of each dimension, the participant was asked to
numerically score the dimension as to the complexity of the overall dimension on a scale of
10 to 100, with 55 being an average project. The results for the TH 212 project are presented
in Figure 5.2. As shown in the radar diagram, the project appears to be complex throughout
all dimensions, with the greatest complexity occurring for the scheduling dimension at a
score of 80. The accelerated timeline due to the use of DB made this dimension the most
critical for the management team. Coming close to the schedule dimension was the technical
dimension with a score of 75. The design alterations and the depressed roadway alignment
led to many technical challenges. Alternately, the context dimension received a 60 which is
the lowest score for all dimensions. This is consistent with the discussion of the context
dimension issues. The project had been in the works since the 1950’s and most of the
external factors had been identified well before the project was initiated. The other two
dimensions appear to be pretty similar to one another and fall between the highest and lowest
dimensions, both being less complex with scores closer to the lowest scoring dimension.
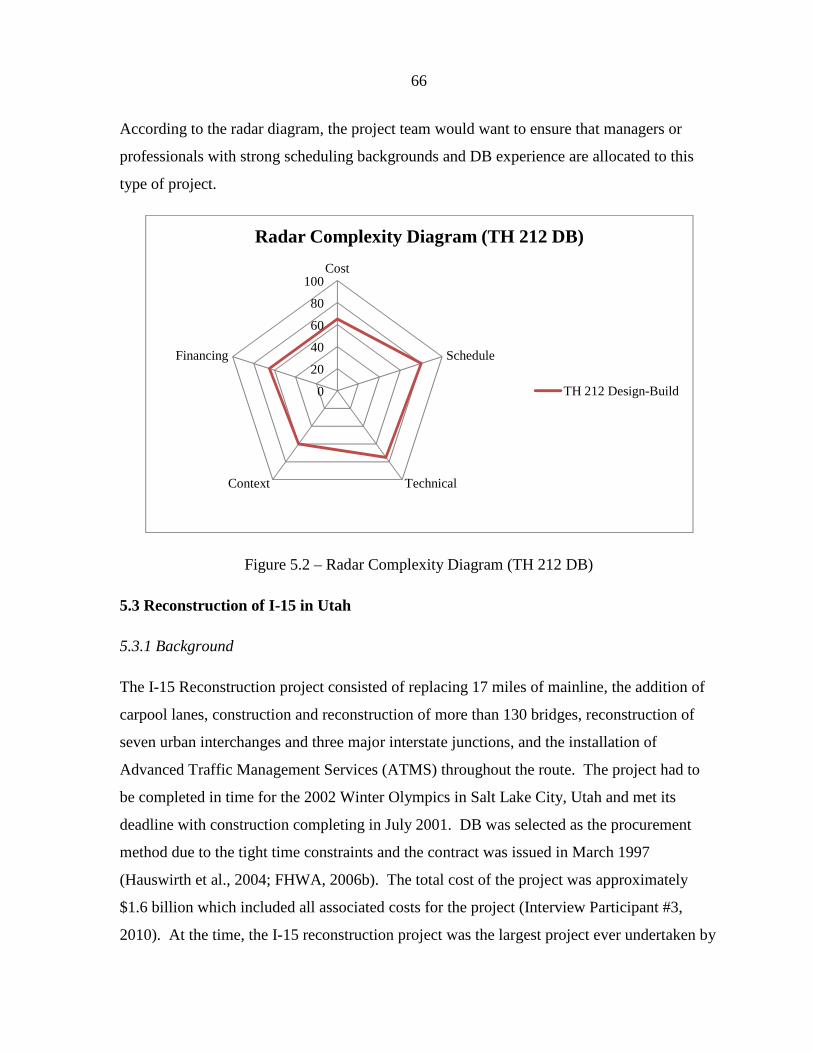
66
According to the radar diagram, the project team would want to ensure that managers or
professionals with strong scheduling backgrounds and DB experience are allocated to this
type of project.
Figure 5.2 – Radar Complexity Diagram (TH 212 DB)
5.3 Reconstruction of I-15 in Utah
5.3.1 Background
The I-15 Reconstruction project consisted of replacing 17 miles of mainline, the addition of
carpool lanes, construction and reconstruction of more than 130 bridges, reconstruction of
seven urban interchanges and three major interstate junctions, and the installation of
Advanced Traffic Management Services (ATMS) throughout the route. The project had to
be completed in time for the 2002 Winter Olympics in Salt Lake City, Utah and met its
deadline with construction completing in July 2001. DB was selected as the procurement
method due to the tight time constraints and the contract was issued in March 1997
(Hauswirth et al., 2004; FHWA, 2006b). The total cost of the project was approximately
$1.6 billion which included all associated costs for the project (Interview Participant #3,
2010). At the time, the I-15 reconstruction project was the largest project ever undertaken by
0
20
40
60
80
100Cost
Schedule
TechnicalContext
Financing
Radar Complexity Diagram (TH 212 DB)
TH 212 Design-Build

67
Utah Department of Transportation (UDOT) and it was the largest DB highway contract ever
performed in the United States (Hauswirth et al., 2004). Public funding was used for all
portions of the project and consisted of a mixture of state and federal funds. The state funds
came from the state gas tax, general fund, bonding, while some funding was borrowed
against future monies at the federal level (Interview Participant #3, 2010). Considering that
this project was of extreme size, many factors contributed to the complexity of the project.
There were many different stakeholders all with different priorities and procedures. One of
the major issues was the amount of resources available and the ability of the project teams to
have the work performed by local contractors. In addition, traffic in all directions had to be
maintained since this was a reconstruction project (Hauswirth et al., 2004). There were also
some environmental issues associated with embankments and unconsolidated soils that the
design had to alleviate (Nelson, 1997).
5.3.2 Interview and Questionnaire
A phone interview was conducted with the Regional Director for the I-15 Reconstruction
project. The participant has worked in construction related fields for approximately 34 years
and has had a hand in anywhere from 100 to 1,000 projects. The sources of complexity
found on the project are discussed for each dimension below (Interview Participant #3,
2010).
5.3.3. Cost Dimension
According to the participant every cost category was more complex than the average project.
Issues associated with the cost risk were that in the past, models were used for DBB to
identify unit prices. Since this project was conducted using DB, these models were not well
developed and led to increased cost risks. The major issue with the cost estimates was that
the initial ones were for a ten year timeframe and they became unusable when the timeline
was shortened to four years. In addition, the estimates had to include the time value of
money and costs to accelerate construction which made the estimates category more
complex. The planning/construction stage encountered a lot of complexity issues. An
entirely separate group had to be established for all project controls, including cost. A

68
steering group was established that met once a week and made the budget one of the highest
priorities for control and verification purposes. A lot of time and money was spent on
controlling cost and UDOT had to independently verify that the DB contract costs were
accurate throughout the project. The DB contract incorporated cost incentives for increased
performance which was groundbreaking at the time considering the public entity’s
involvement in the use of incentive techniques. The last cost category saw two main factors
contributing to complexity issues. There were problems with the sheer amount of material
needed for the project. There were not enough material producers to supply the amount of
material needed causing material issues. In addition, the project had to be open in time for
the Olympics without delay, so the transit user benefits were a major driver in the planning
and execution of the project.
5.3.4 Schedule Dimension
The timeline of the project was the driving force for this project as mentioned in the cost
dimension. The reconstruction project had a fixed finish date that had to be met due to the
2002 Winter Olympic Games. According to the participant, the biggest barrier was believing
that “we can do this before the Olympics”. There were a few issues with the schedule risk
category. In the past areas were identified that could affect the schedule acceleration such as
utilities and weather delays, but because of the size of this project those problems were
magnified. Risks that were the responsibility of the owner had to be defined and outlined in
the contract so that the parties knew what risks were owner controlled. There were also
issues with remediation and how long it would take to limit environmental concerns and the
potential for lawsuits. The planning/construction category also saw similar issues discussed
during this category in the cost dimension. The separate project controls team and steering
group also focused heavily on schedule control. Milestones were constantly reviewed and
schedule issues were prioritized. The size of the project essentially drove the resource
market and the ability to schedule the necessary labor and resources. Some prefabrication
had to be performed in order to meet the resource demands. Resource and cost loaded
critical path method schedules were used on the technology end of things. Experts were
hired to verify the design-builder’s schedules and the schedule was updated more frequently

69
than seen on other projects. One issue that did not fall within any of the defined factors was
that the owner was willing to burn contingency to meet the tight schedule deadlines which
added another element of complexity. As with the cost dimension, every schedule category
was found to be more complex than average transportation projects.
5.3.5 Technical Dimension
As seen in the previous two dimensions the participant stated that every technical category
had more management complexity issues. The project did not have a lot of scope creep, but
because of the unfamiliarity with the DB process the steering committee had to meet weekly
to ensure that the scope of the project was kept in check. The use of DB also led to a new
internal structure of the owner and different roles of the resident engineers working on the
project. Project teams were used and the lower levels of the organization had to make a lot
of decisions which was an unfamiliar task. The project teams did have some turnover caused
by burnout issues. The steering committee and project controls group also had to monitor the
roles and structure of the organization throughout the project. Contractually, the process had
to be reinvented because it was the first DB contract performed by UDOT and it was the
largest DB transportation project ever attempted at the time. Discussions were held
clarifying the risks held by each party and a contract administrator who was part of the
controls group verified that all parts of the contract were being met. UDOT had to work with
contractors so they felt comfortable bidding with the associated risks. For example, initially
a ten year maintenance period was mandated, but it was dropped from the requirements at the
very end of the project. The bonding capability of the contractors also had to be changed in
order to alleviate concerns.
Also lending to complexity was that an entirely new dispute resolution process had to be
developed for this project. The design phase also experienced a lot of issues, but the design-
builder was primarily responsible for the design decisions. However, UDOT had to verify
that all of the design elements were meeting the appropriate standards. A way had to be
invented to do reviews and monitor the quality of the design. Over the shoulder and
acceptance reviews were used to ensure design quality. The design-builder did decide to
design around utilities, ROW, environmental concerns, and the railroad instead of moving,
70
acquiring, or receiving permission to construct in these areas. Since this project was a
reconstruction there were multiple structural limitations presenting challenges to the
alignment. The construction phase also saw a lot of management challenges. Quality was a
major point that could have been affected by embankment and settlement issues. All of the
quality issues were ultimately the responsibility of the contractor so UDOT had to use
performance specifications outlined in the contract. The owner also used an owner
controlled insurance program which helped incentivize the safety and health on the job.
Once the schedule was set the team had to determine how to do things differently and
mitigate environmental effects based on the typical climate of the area. Construction could
not be suspended because of the size of the project and the tight timeline so the weather delay
management issues were magnified. The technology used on the project also contributed to
the last technical dimension category. The background information discussed the use of
ATMS components which added to the complexity of this category. In addition, this project
was the first time that public involvement efforts were incorporated through the use of transit
technology. The project incorporated variable message boards, weather stations, and fiber
optics throughout the alignment.
5.3.6 Context Dimension
The context dimension breaks the trend of all the previous categories being more complex
than average projects. However, the majority of the categories were found to still be very
complex. There were a variety of stakeholders along the alignment of the project. Multiple
cities were affected with multiple sets of standards that had to be controlled. The politicians
also had expectations and concerns over schedule and budget that caused management
complexity. There were some political issues regarding the use of local trucking firms due to
the lack of resources. A lot of out of state trucking firms were taking jobs away from local
companies. The project generated a lot of media attention due to the accelerated timeline
caused by the upcoming Olympics. The Olympic organizers also contributed to the pressure
put on the project. Since this was the first time UDOT used DB, special clearance had to be
obtained from the FHWA to conduct the project using an experimental delivery method.
71
This clearance actually helped the project organizers because it served as a “trump card” for
a lot of decisions.
According to the participant, a lot of time was spent managing expectations and after
completion of the project the public was extremely happy. The proposed alignment also ran
into a few historical issues that had to be resolved. The project specific category was also
found to be more complex. Regional traffic models were used to figure the traffic volumes
and adjust the signaling accordingly in order to maintain capacity. The DB contract required
two lanes to be open in each direction during peak travel times so the traffic management
plan was very comprehensive. Drivers were encouraged to use alternate routes which
ultimately affected the timing of the signals even further. Construction progressed through
the night hours and on the weekends; full shutdowns were required occasionally. Variable
message boards were used to alert the public of construction activity and light rail was being
built simultaneously so the intermodal factor contributed to the complexity. The local issues
also saw increased complexity and a lot of the concerns were similar to those identified
during the stakeholders category. Social equity was a main issue with the local areas and the
sentiment, “they got that, we want this”, was apparent. Some cities wanted more once they
saw what other areas received. The demographic concerns were also prevalent. The
downtown area of Salt Lake had different concerns than the suburbs. Along with the
resource availability discussion there was a lot of discussions about keeping Utah jobs in
Utah. Not all of the local workforce was qualified to perform the work and eventually logic
prevailed because there just was not enough labor available locally. The trucking firm
discussion also affected the local economy since jobs were being sent out of state. This
category has an immense amount of complexity issues and some of the others are
summarized below:
• Discussions with counties/cities to alter emergency routes • Use of condemnation and eminent domain to acquire some land • The public was nervous about the “if you build it they will come” philosophy, urban
sprawl was not ultimately realized • The changing of land values due to the alteration of access, specified standards had to
be met for the interchanges • Outreach program to outline the impacts on local businesses

72
• Media management plan, fed specific information for release • Use of a marketing consultant • Project scale, issues, complexity, and data gathering had to be proactive • Programmatic agreements for utility relocations, approximately 1,500 crossings • Lawsuit over the ability to see existing overhead signs and billboards covered by the
reconstruction
As discussed in the other dimensions, the external resource availability was limited. The
volumes of resources were not sufficient to meet the required demand causing significant
resource availability issues. The last category that was deemed more complex was
legal/legislative. UDOT had to receive legislative authority to use DB and the environmental
laws were constantly in flux. As mentioned earlier the bonding capacity of the contractors
had to be changed from 100 to 50 percent to alleviate concerns. Local acceptance was also a
barrier. The project processes had to be explained to the local transportation commissions.
The environmental category was found to be slightly more complex than usual. The
embankment issues were already mentioned and recycled materials were used to reduce the
concerns. Wetlands were another issue, but it was pretty similar to other projects. There was
some hazardous material that had to be mitigated and remediated such as old city dumps and
plumes that were discovered. The owner took responsibility for the environmental risks and
any lawsuits associated with them. The last two context categories, global/national and
unusual conditions, were similar and did not contribute significantly to the management
complexity.
5.3.7 Financing Dimension
The financing dimension was found to be complex as well. Both the financing process and
the issues with the public funding contributed to the management complexity. A finance
plan was required because of the project size and the parameters of the plan had to be
followed. The financing was also subject to federal reauthorization which set limitations on
how the gas tax could be spent. In addition, the project managers had to be trained on how to
spend the money within the framework of the DB process. Along with how to spend the
money, there were issues associated with how quickly the funding could be spent. A
financial controller was involved in the steering group which was out of the norm for UDOT.
The mixture of public funding is what made the financing dimension complex. Utah has
73
good fiscal control and there is a lot of control and scrutiny built into the process. Therefore,
the funding had to be transparent and very open which assisted in managing the public
financing. The risk category was found to be of a similar complexity level. Since DB was
used, the material prices were essentially locked in once the contract was executed which can
be considered a form of commodity-based hedging.
5.3.8 Analysis & Discussion
The above sections presented and discussed the factors and the issues contributing to the
complexity of those challenges. At the end of each dimension, the participant was asked to
numerically score the dimension as to the complexity of the overall dimension on a scale of
10 to 100, with 55 being an average project. The results for the I-15 Reconstruction project
are presented in Figure 5.3. As shown in the radar diagram, the project appears to be
complex throughout all dimensions, with the greatest complexity occurring for the
scheduling dimension at a score of 98. The accelerated timeline due to the upcoming
Olympic Games and the use of DB made this dimension the most critical. Coming close to
the schedule dimension was the cost, technical, and context dimensions with scores ranging
between 90 and 92. These scores are consistent with the sheer size and scale of the project
and massive amount of control, design, and external factors facing the management team.
Considering that this project was the largest transportation DB project ever undertaken at the
time and the first DB project performed by UDOT the scores appear to reflect the
management complexity seen for this project. Alternately, the financing dimension received
a 70 which is the lowest score for all dimensions. Besides the issues addressed this
dimension was significantly less complex than the other four, but still above average.
According to the radar diagram, the project team would need to have managers and
professionals in place for nearly every facet for this type of project. A lot of planning and
control would be required and the organization’s top resources would need to be delegated to
a project with this amount of management complexity.

74
Figure 5.3 – Radar Complexity Diagram (I-15 Reconstruction)
5.4 Warwick Intermodal
5.4.1 Background
The Warwick Intermodal project is the only project that does not incorporate the construction
of any road related items, however it is still heavily transportation related. The Warwick
Intermodal Station is a multi-use facility located at the T.F. Green State Airport in Warwick,
Rhode Island that includes a train station, consolidated rental car facility, bus hub, a parking
garage with approximately 2,200 spaces, and a 1,250 foot elevated, enclosed skywalk
connecting the station to the airport (RIDOT, 2010; Interview Participant #4, 2010). The
project was bid out to a construction manager using the guaranteed maximum price (GMP)
methodology. Demolition and environmental cleanup began in July 2006 and the GMP was
executed in August 2008 (NRI, 2010; Interview Participant #4, 2010). The project is still
under construction at the time of this report with commencement of service scheduled for
September 2010. The purpose of the project is to provide alternate methods of transportation
to airport users and establish a connection to and from Boston, Massachusetts (RIDOT, 2010;
0
20
40
60
80
100Cost
Schedule
TechnicalContext
Financing
Radar Complexity Diagram (I-15 Reconstruction)
I-15 Reconstruction

75
Interview Participant #4, 2010). The total projected completion cost of the project will be
approximately$267 million which includes the GMP and consultant, design, administration,
environmental documentation, and planning costs (Interview Participant #4, 2010; GA,
2010). There are many different types of financing used including FHWA grants, a
Transportation Infrastructure Financing and Innovation Act (TIFIA) loan, Special Facility
Revenue Bonds, Customer Facility Charges, and state grants which contributed to a mix of
public and private sector funds (RIAC, 2008). One of the major challenges with the site
location is that the facility is situated on a brownfield site which had to be remediated. Other
sources of complexity include the massive amount of economic development expected from
the construction of the facility and the limitations of working with different modes of
transportation in order to coordinate the implementation of the project (Interview Participant
#4, 2009; RIAC, 2008).
5.4.2 Interview and Questionnaire
A phone interview was conducted with the manager in charge of oversight for the FHWA on
the Warwick Intermodal project. The participant has worked in construction related fields
for approximately 9 years and has worked on approximately 50 projects. The sources of
complexity found on the project are discussed for each dimension below (Interview
Participant #4, 2010).
5.4.3 Cost Dimension
Out of the four cost categories, three were more complex and the fourth was slightly more
complex than average. There was a lot of cost risk because the scope was changing and it
was difficult to determine what was in and what was out. Since personnel were already on-
site the scope kept increasing. It was also difficult to determine the cost impact working with
the rail and airport facilities would have on the intermodal project. The contracting method
also led to increased cost risks because the bids came in very early and the costs had to be
held for a longer period of time. If the bids could not have been held the cost risks would
have increased significantly. The estimates were also affected by the changing scope. The
initial estimates were low after the addition of scope through change orders. The estimates
76
were also performed with preliminary plans; a lot of the work was not finalized during the
estimate stage. The Amtrak rail costs were especially difficult to quantify because Amtrak
creates their own estimates and they were not available from the outset. The
planning/construction category was also deemed more complex. A lot of cost control was
used and a project manager was delegated specifically for project controls. In terms of
optimization, a precasting plant was used for the parking garage which helped the schedule
and quality, but was more expensive to use. The last cost category saw little in the way of
management complexity. There were no material cost issues, but cost escalation clauses
were placed into the contract for liquid asphalt and diesel.
5.4.4 Schedule Dimension
The schedule dimension was very similar to the cost dimension with three out of the four
categories being more complex and the fourth similar to other projects. The Warwick
Intermodal project had to be seen as a fast moving project so time was a critical issue.
According to the participant, someone had to take the first step to start and cascade the other
items along the corridor. The work was politically driven so the schedule was compressed to
open the facility earlier. The guaranteed maximum price (GMP) contract required the
construction manager to set the completion date so the contractor was ultimately responsible
for meeting the deadline. The schedule risk category posed a few major barriers. However,
once the design was completed there was little schedule risk left. This project had to
coordinate with air, rail, and highway components and the conditions were not always clear.
The schedule elements for dealing with these agencies had to be estimated. As mentioned in
the cost dimension the subcontractor bids were earlier on in the project and the owner was
uncertain how long the bids would have to be held contributing to overall schedule risk if
they could not be maintained. Also noted in the cost dimension, a project manager was used
for all project controls including the schedule. The precasting plant also helped accelerate
the schedule to meet the completion date. The schedule technology category varied from the
other three and was deemed to be of similar complexity. Resource and cost leaded schedules
were required, but this was the extent of the schedule technology complexity.
77
5.4.5 Technical Dimension
A lot of the issues causing complexity for this project are related to dealing with the air,
highway, and rail agencies. The technical dimension is no different. As discussed already
this project encountered a lot of scope creep. Each agency had their own approach for each
segment of the project making the scope category more complex. A final agreement was
needed between the major stakeholders on the major portion of the scope in order to proceed
which added to the management concerns. Along with the scope, the internal structure of the
owner caused more issues. A high level of turnover was experienced and there was
inconsistency with how the job was viewed from the Federal and State agencies. All of the
stakeholders had to be organized early in order for the project to be a success. According to
the participant this was the first time that Rhode Island Department of Transportation
(RIDOT) had used the CM@R delivery method and only the second time for the airport
commission. The type of contracting method was unique and different making the contract
category more complex. The contract required the bids to come in early which affected cost
and schedule as noted already. In addition, the team held three meetings a week for disputes
and the contract incorporated price escalation clauses as well.
Adding to the complexity of the technical dimension was the design category. Since the
plans were not finalized before bidding there was a set amount of risk that needed to be
controlled. The design method was typical, but the contracting method for procuring the
design was unique and therefore had to be handled differently. During the design phase a lot
of value engineering and constructability review sessions were used. The existing conditions
were difficult because the design had to incorporate airport and rail conditions which relates
back to the multiple stakeholders causing significant complexity issues. The construction
category broke from the more complexity trend and was found to be only slightly more
complex. There were a couple of minor quality issues, but they were handled immediately
by the construction manager. The construction manager also required their own operational
safety improvement program (OSIP) which required all of the subcontractors to pass the
training programs mandated by the construction manager. This helped in the safety and
health on the project. The winter weather provisions were standard for the area and some
78
special concrete provisions were used. The precasting plant also helped improve the quality
seen on the project. The last technical category, technology, was rated as similar by the
participant. No technology out of the ordinary was used for this project.
5.4.6 Context Dimension
The first category that was more complex was the stakeholders. Throughout the discussion
of complexity for this project the stakeholders have been identified as a major issue that
contributed to the project management. All of the stakeholders had to get together and be
organized from the beginning. Multiple owners caused coordination issues since each
agency has their own processes, “languages”, approaches, and desires. This project had
heavy political involvement. The top levels of government had been pushing for the project
since 2000 and the governor has always been in support of the endeavor. In addition, the
public had to support portions of the financing and buyoff on the overall concept of the
project. The major project specific factors existed because of the intermodal nature and
made this category a little more complex. Construction of the new facility could not affect
the airport or rail operations. The surrounding highway was not as big of a management
challenge, but some temporary lane closures were necessary when flying steel overhead. The
rest of the context categories were similar or less complex according to the questionnaire
participant. Some land acquisition was required, but the process was not significantly
hindered because the chosen site was previously a brownfield. The project spurned rezoning
and growth of the surrounding land, although a concept for a redevelopment district was
already in the works.
Along with the change in land use, the facility is expected to increase the local economy of
the area and change the overall culture from a rundown area to a downtown district. With the
construction of the new facility the airport is planning to extend the runways and is expected
to double their operations once the facility is opened. Marketing for the project was
performed by RIDOT and the governor’s office and required frequent newspaper and website
updates. The other project specific factor was the utility issues. The as-builts did not match
the conditions on the site and no field verification was performed so the utility process
created coordination problems. Being that the site was previously a brownfield, the location
79
had to be remediated. Sustainable materials were also used for the skywalk bridge and the
owner did receive proposals from environmental groups on how to increase the “green”
aspect of the project. These proposals were not solicited, but they required management’s
time in reviewing and responding to them. The remaining categories were all considered less
complex and did not have significant issues that required attention: resource availability,
legal/legislative, global/national, and unusual conditions. Worth noting is that the airport had
performed a prior project using CM@R so the legislation was already in place and there was
little pushback for not using DBB because the contractor awarded the project was locally
based.
5.4.7 Financing Dimension
Relating to the background information the Warwick Intermodal project was financed
through many different methods making this dimension more complex overall. According to
the participant the financing process category created challenges. First, the project had to be
federally eligible in terms of legislation. Getting all of the financing pieces together and
knowing how much was coming and from where contributed to the complexity. A chief
financial officer was assigned to the project and was responsible for the financial oversight.
The financing process had to be tested by running a scenario with trial payments to verify the
process would work. Indemnity was also used and another layer of insurance was required
by Amtrak contributing to the complexity of the process category. The first type of
financing, public, was deemed to be more complex. In order to receive the FHWA grants the
project had to be accepted. In addition, the TIFIA application process is not always standard
and required additional effort. The other portion of the public funding came from state
bonds. The participant stated that it was not a difficult process, but they were used to close
the gap created by the federal money that took financing away from other projects.
Revenue stream financing was another method used on this project. The main concern
pertaining to this category was the impact 9/11 would have on air traffic, possibly reducing
the amount of revenue generated through tickets, car rentals, etc. One type of financing that
has not been seen on the other projects thus far is asset value. The Warwick project did use
some franchising which made this category more complex. The rental car facilities had high

80
visibility in their previous location, but they were consolidated and moved to a new structure.
Each organization was given money from the TIFIA loan to customize their location to meet
their needs with the expectation that the money is to be repaid over a period of time. Along
with franchising these loans could also be considered a form of private financing which led
to the project delivery method category receiving a more complex rating as well. The
procuring of long lead items resulted in the financing risk category being slightly more
complex than average. Catenary systems, precast garage pieces, escalators, lighting systems,
and others were procured early to limit the risk and could be considered a form of
commodity-based hedging. One issue briefly mentioned above was the extra layer of
insurance required by Amtrak and the airport that did not fit specifically into the defined
factors. Obtaining the insurance was a big consideration that contributed to complexity
according to the interview.
5.4.8 Analysis & Discussion
The above sections presented and discussed the factors and the issues contributing to the
complexity of those challenges. At the end of each dimension, the participant was asked to
numerically score the dimension as to the complexity of the overall dimension on a scale of
10 to 100, with 55 being an average project. The results for the Warwick Intermodal project
are presented in Figure 5.4. As shown in the radar diagram, the project appears to be
complex throughout all dimensions, with the dimensions ranging from 70 to 85. The
financing dimension was the highest at a score of 85 which is consistent with the discussions
surrounding the many different types of financing for the project. However, both cost and
context are not far behind with scores of 80, followed closely by technical at 75, and
schedule receiving a 70. Each dimension appears to have significant complexity issues that
required effective management practices and resulted in scores that are very close to each
other. The discussion surrounding the coordination of the multiple owners seems to be the
driving complexity issue that affected all five of the dimensions. According to the radar
diagram, the project team would need to have managers and professionals in place that are
pretty well rounded in their experience. Professionals could be used for highly skilled
activities within the dimensions, but the project would generally benefit from managers with

81
broad project experience across all dimensions. A high focus would want to be placed on
individuals with good people skills and those that may have worked with the different
agencies in the past for this type of project.
Figure 5.4 – Radar Complexity Diagram (Warwick Intermodal)
5.5 Reconstruction of I-64 in Missouri
5.5.1 Background
The I-64 Reconstruction project is located in the heart of downtown St. Louis, Missouri. The
project was the first transportation project performed using the DB procurement method by
the Missouri Department of Transportation (MoDOT). The ten mile construction project
began in March of 2007 and was reopened in December of 2009. The parties involved
decided that it would be to their advantage to shut down half of the existing route at a time
for reconstruction purposes. The first half was shut down in January of 2008 and reopened in
December of 2008, while the second half was shut down in December of 2008 and reopened
in December of 2009 (MoDOT, 2010). The entire project had a set budget of $535 million
and was funded by an 80/20 federal/state split. Grant Anticipated Revenue Vehicle
0
20
40
60
80
100Cost
Schedule
TechnicalContext
Financing
Radar Complexity Diagram (Warwick Intermodal)
Warwick Intermodal
82
(GARVEE) bonds were sold to come up with the state’s share of the financing (Interview
Participant #5, 2010). The construction contract awarded was $420 million out of the
allocated budget which was a lump sum type of contract (Interview Participant #5, 2010;
MoDOT, 2007). The main scope over the length of the project included more than 30
bridges, 12 interchanges, and an interstate-to-intestate connection between I-64 and I-170.
The original portions of the segment were built between the 1930’s and 1960’s. Many of the
bridges were no longer satisfactory and the project team decided it was best to replace all of
them at once to alleviate the long schedule impact on the public (MoDOT, 2010; Interview
Participant #5, 2010). One of the main goals of the project was to show how DB can be used
to accelerate the schedule and maintain costs while providing a quality product (Interview
Participant #5, 2010). Sources of complexity impacting the project include: a complex
regional mobility plan that included retiming the signals and restriping the lanes on
surrounding routes, a two-section closure of an interstate in the middle of downtown, land
acquisition, and tight budget constraints that limited the scope of the project (MoDOT, 2010;
Interview Participant #5, 2010).
5.5.2 Interview and Questionnaire
A phone interview was conducted with the Deputy Project Director for the I-64
Reconstruction project. The participant has worked in construction related fields for
approximately 24 years and has worked on hundreds of projects. The sources of complexity
found on the project are discussed for each dimension below (Interview Participant #5,
2010).
5.5.3 Cost Dimension
According to the participant all four cost categories were found to be more complex. The
risk category encountered a lot of cost risk due to the budget being very stringent causing
MoDOT to be unsure how much of the initial scope could be completed. Ultimately, the
scope had to be reduced based on the provided costs by the proposing contractors. Typically,
MoDOT performs projects consisting of smaller packages. Since this project was performed
as an all encompassing, lump sum project, a lot of risk was encountered with obtaining all of
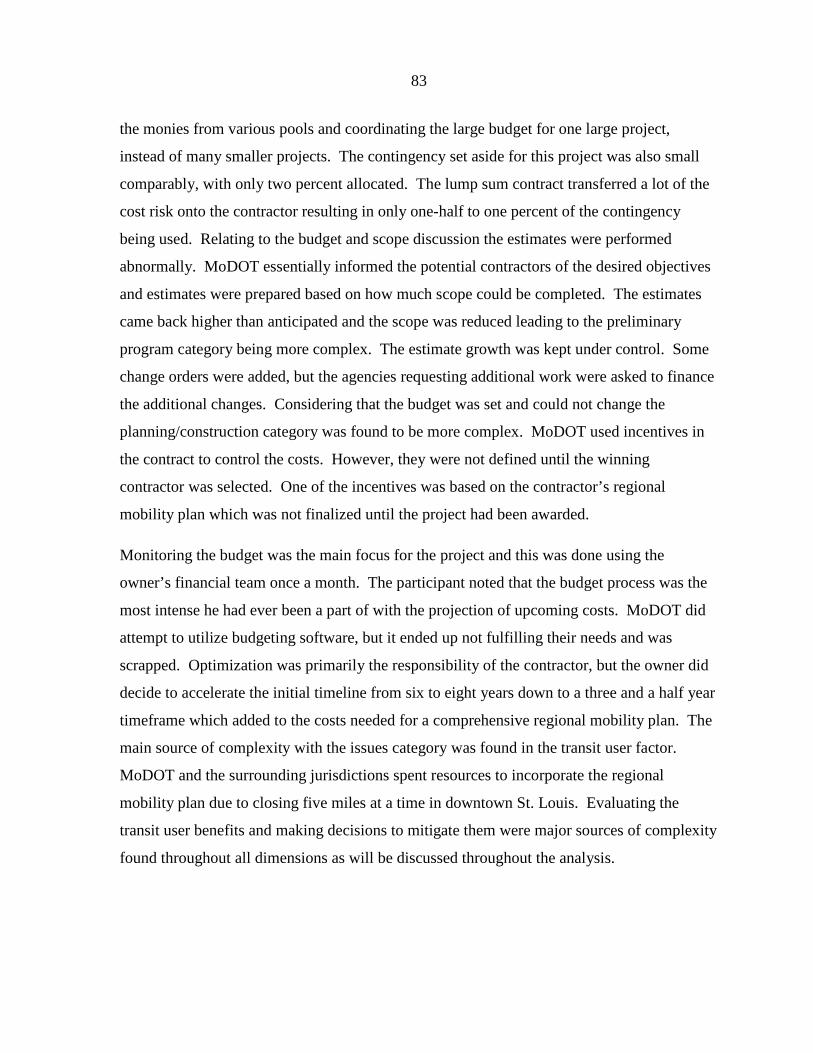
83
the monies from various pools and coordinating the large budget for one large project,
instead of many smaller projects. The contingency set aside for this project was also small
comparably, with only two percent allocated. The lump sum contract transferred a lot of the
cost risk onto the contractor resulting in only one-half to one percent of the contingency
being used. Relating to the budget and scope discussion the estimates were performed
abnormally. MoDOT essentially informed the potential contractors of the desired objectives
and estimates were prepared based on how much scope could be completed. The estimates
came back higher than anticipated and the scope was reduced leading to the preliminary
program category being more complex. The estimate growth was kept under control. Some
change orders were added, but the agencies requesting additional work were asked to finance
the additional changes. Considering that the budget was set and could not change the
planning/construction category was found to be more complex. MoDOT used incentives in
the contract to control the costs. However, they were not defined until the winning
contractor was selected. One of the incentives was based on the contractor’s regional
mobility plan which was not finalized until the project had been awarded.
Monitoring the budget was the main focus for the project and this was done using the
owner’s financial team once a month. The participant noted that the budget process was the
most intense he had ever been a part of with the projection of upcoming costs. MoDOT did
attempt to utilize budgeting software, but it ended up not fulfilling their needs and was
scrapped. Optimization was primarily the responsibility of the contractor, but the owner did
decide to accelerate the initial timeline from six to eight years down to a three and a half year
timeframe which added to the costs needed for a comprehensive regional mobility plan. The
main source of complexity with the issues category was found in the transit user factor.
MoDOT and the surrounding jurisdictions spent resources to incorporate the regional
mobility plan due to closing five miles at a time in downtown St. Louis. Evaluating the
transit user benefits and making decisions to mitigate them were major sources of complexity
found throughout all dimensions as will be discussed throughout the analysis.

84
5.5.4 Schedule Dimension
Three out of the four schedule categories were deemed to be of a complex nature and the
third was found to be slightly more complex. The main source of complexity with the
timeframe of the project was the acceleration mandated by MoDOT’s director. It was
decided that this course of action would have the least amount of impact on the public, but
added to the overall complexity for the project. The planning/construction category was also
more complex due to the accelerated schedule. The contractor was required to stipulate
milestones based on the owner set completion date and received incentives if they were met,
but had to pay liquidated damages if they were not. No delays whatsoever could be seen on
the project and it was ultimately the responsibility of the contractor to meet the dates. The
owner did verify the schedule for payments which added to the complexity and used a
scheduling expert that is not typical on MoDOT projects. The owner also had a project team
that was responsible for internal resource allocation. In order to maintain the schedule,
resource and cost loaded P3 (Primavera) software was used for the project. The software
allowed the payments to be made on a percent completion basis, but also contributed to the
management complexity of the schedule dimension. The schedule risk category broke the
more complex trend and was found to be only slightly more complex. The main issue
affecting the risk was the coordination of the utilities between the contractor and the utility
agencies. Since the project was expedited the agreements had to be performed in a faster
manner.
5.5.5 Technical Dimension
All of the categories within the technical dimension were also found to be more complex. As
discussed during the cost dimension the scope had to be reduced from 11.5 miles to 10 miles
due to the budgetary constraints. In addition, there was little scope creep since MoDOT
required any agencies or business requesting additions to fund them. However, coordination
with the contractor to ensure that the additional work would not affect the primary project’s
schedule did add to the complexity of the scope category. Since this project was the first DB
project undertaken by MoDOT the internal structure category was more complex. A
completely different setup had to be used. A project team was established solely for this
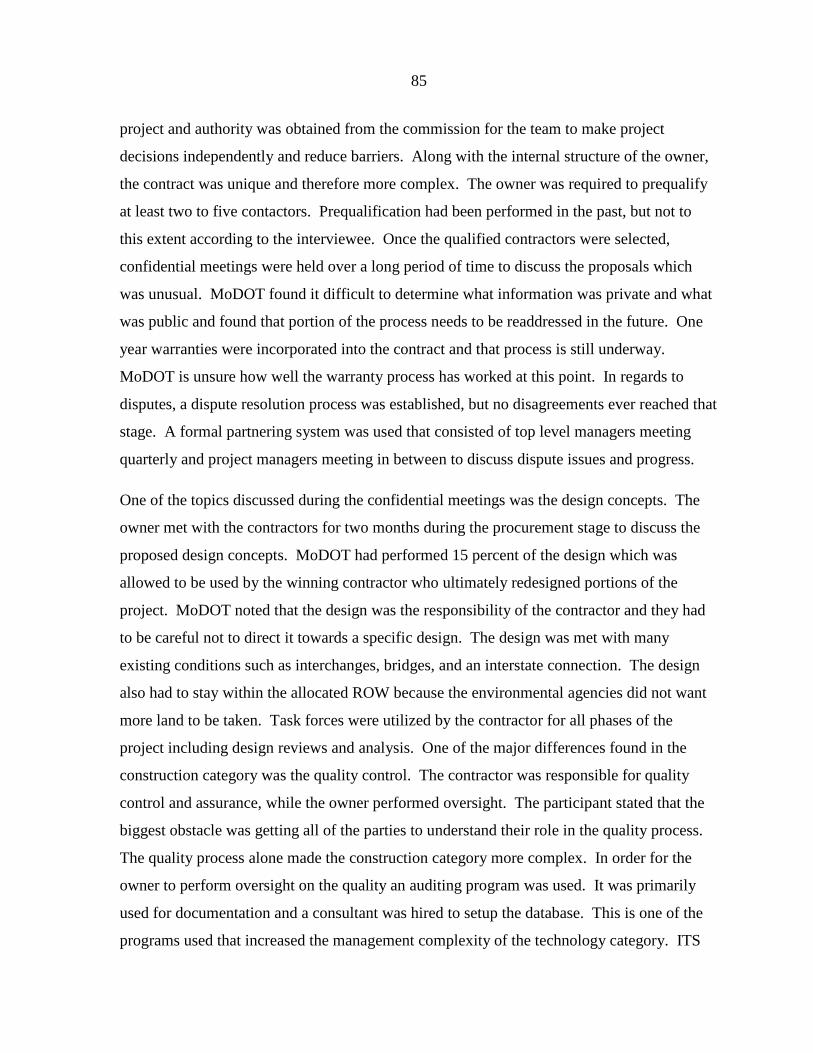
85
project and authority was obtained from the commission for the team to make project
decisions independently and reduce barriers. Along with the internal structure of the owner,
the contract was unique and therefore more complex. The owner was required to prequalify
at least two to five contactors. Prequalification had been performed in the past, but not to
this extent according to the interviewee. Once the qualified contractors were selected,
confidential meetings were held over a long period of time to discuss the proposals which
was unusual. MoDOT found it difficult to determine what information was private and what
was public and found that portion of the process needs to be readdressed in the future. One
year warranties were incorporated into the contract and that process is still underway.
MoDOT is unsure how well the warranty process has worked at this point. In regards to
disputes, a dispute resolution process was established, but no disagreements ever reached that
stage. A formal partnering system was used that consisted of top level managers meeting
quarterly and project managers meeting in between to discuss dispute issues and progress.
One of the topics discussed during the confidential meetings was the design concepts. The
owner met with the contractors for two months during the procurement stage to discuss the
proposed design concepts. MoDOT had performed 15 percent of the design which was
allowed to be used by the winning contractor who ultimately redesigned portions of the
project. MoDOT noted that the design was the responsibility of the contractor and they had
to be careful not to direct it towards a specific design. The design was met with many
existing conditions such as interchanges, bridges, and an interstate connection. The design
also had to stay within the allocated ROW because the environmental agencies did not want
more land to be taken. Task forces were utilized by the contractor for all phases of the
project including design reviews and analysis. One of the major differences found in the
construction category was the quality control. The contractor was responsible for quality
control and assurance, while the owner performed oversight. The participant stated that the
biggest obstacle was getting all of the parties to understand their role in the quality process.
The quality process alone made the construction category more complex. In order for the
owner to perform oversight on the quality an auditing program was used. It was primarily
used for documentation and a consultant was hired to setup the database. This is one of the
programs used that increased the management complexity of the technology category. ITS

86
were also incorporated throughout the project and on surrounding roads. The regional
mobility plan discussed above also had a major impact on the technology category. An
incident command center was established with all parties that could potentially be affected.
Signal timing and alternate striping issues were major factors associated with the plan and the
owner wanted to know what incidents were possible before they became prevalent.
5.5.6 Context Dimension
The context dimension found that some of the categories were more complex while some of
them were similar. The stakeholders category was one that was more complex and the owner
had to be very active with all of the stakeholders throughout the project. There was a lot of
mass panic between the public, jurisdictions, and local agencies about the complete shutdown
of half of the interstate, even after the first half reopened. The communication practices had
to be extensive with all parties. In addition, politicians at the Missouri state capital attempted
a bill to stop the project which was unsuccessful, but still required resources to manage.
Along with the stakeholders, the project specific and local issues categories were deemed
more complex. As discussed already maintaining capacity through an extensive regional
mobility plan was an essential part of this project. All of the existing signals had to be
recalibrated and new signals were installed. The incident control center discussed above was
also implemented to predict issues and resolve them. The decision to close half of the
highway required extensive rerouting and resources. Since half of the highway was closed it
had a major impact on public service emergency routes as well.
According to the participant, there are 10 major hospitals within miles of the project and the
emergency service providers were also in a mass panic about how the logistics would work.
Once again, communication was a key factor in the success of the plan for the management
of traffic and emergency routes. Some of the other local issues that had to be managed were:
increased growth around the corridor, land acquisition using some condemnation, utility
coordination as discussed earlier, a business access grant program to advertise altered routes
to affected businesses, and a goal program for the incorporation of underprivileged
workforce into the project. The underprivileged incentive was not realized, but there was an
improvement in the amount of disadvantaged workers used by the constructors. MoDOT did

87
not use a marketing consultant for this project, but their public information supervisor was
assigned full-time to this project and the contractor had an experienced media relations
employee delegated as well. The other two context categories found to be more complex
were environmental and legal/legislative. A full EIS was conducted for this project. In
addition, the existing alignment runs through Forest Park and additional land was taken from
the park for the reconstruction. The impact on the park was averted through MoDOT giving
back different land for park use. In order to use DB, MoDOT had received authorization
from the legislature in the early 2000’s to conduct three DB projects. Even with the
authorization there was a lot of apprehension towards DB which eventually subsided after the
success of the I-64 Reconstruction project was realized. The last factor contributing to
management complexity was that the project experienced two of the wettest years on record
in the St. Louis area. This unusual condition had to be worked around as the schedule could
not be delayed.
5.5.7 Financing Dimension
Only public funding was used for this project so the financing dimensions only had two
categories that were slightly more complex. During the cost dimension, it was noted that a
large project is not typically done all at once. Therefore, receiving and knowing where all of
the funding was coming from contributed to the process category complexity. The use of
GARVEE bonds and the associated approval process was different which added to the
complexity of the public funding category. The only other category that applied to the
financing dimension was the financial risk. With the use of DB, a type of commodity-based
hedging was encountered by MoDOT since all of the material prices were basically locked in
once the DB contract was signed.
5.5.8 Analysis & Discussion
The above sections presented and discussed the factors and the issues contributing to the
complexity of those challenges. At the end of each dimension, the participant was asked to
numerically score the dimension as to the complexity of the overall dimension on a scale of
10 to 100, with 55 being an average project. The results for the I-64 Reconstruction project

88
are presented in Figure 5.5. As shown in the radar diagram, the project appears to be
complex throughout all dimensions, with the dimensions ranging from 70 to 90. The
technical dimension was the highest at a score of 90. This is consistent with the discussions
surrounding the use of DB contracting for the first time and the design process being
conducted outside of MoDOT with the structural limitations imposed by the different
existing conditions. However, both cost and schedule are not far behind with scores of 85,
followed closely by context at 80, and financing receiving a 70. Each dimension appears to
have significant complexity issues that required effective management practices and resulted
in scores that are very close to each other. Throughout the discussion, cost and schedule
were important factors since the budget limiting the scope and the completion date due to
accelerated construction were the major drivers of the project and caused sources of
complexity among all of the dimensions. According to the radar diagram, the project team
would need to have managers and professionals in place that have experience in all
dimensions. Professionals could be used for specific management activities, but the project
would generally benefit from managers with broad project experience across all dimensions.
One of the main focuses of the project was the inclusion of all parties in the process so
managers with good people skills would be ideal for communication purposes.
Figure 5.5 – Radar Complexity Diagram (I-64 Reconstruction)
0
20
40
60
80
100Cost
Schedule
TechnicalContext
Financing
Radar Complexity Diagram (I-64 Reconstruction)
I-64 Reconstruction
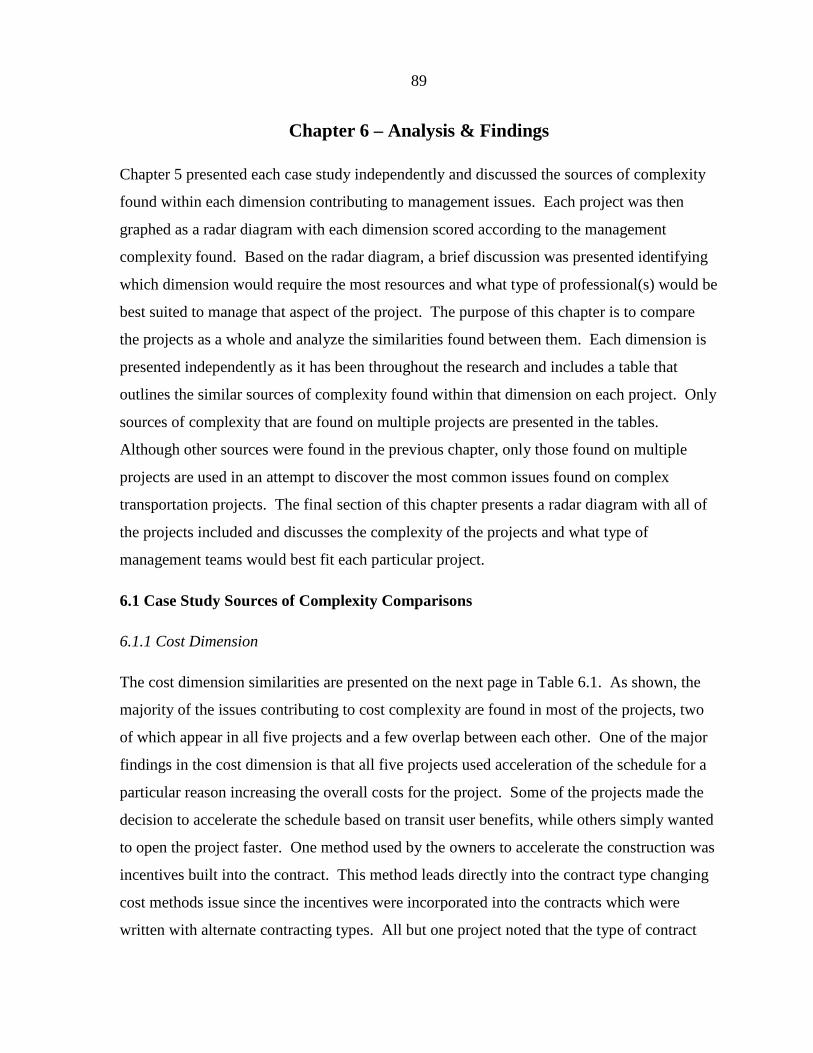
89
Chapter 6 – Analysis & Findings
Chapter 5 presented each case study independently and discussed the sources of complexity
found within each dimension contributing to management issues. Each project was then
graphed as a radar diagram with each dimension scored according to the management
complexity found. Based on the radar diagram, a brief discussion was presented identifying
which dimension would require the most resources and what type of professional(s) would be
best suited to manage that aspect of the project. The purpose of this chapter is to compare
the projects as a whole and analyze the similarities found between them. Each dimension is
presented independently as it has been throughout the research and includes a table that
outlines the similar sources of complexity found within that dimension on each project. Only
sources of complexity that are found on multiple projects are presented in the tables.
Although other sources were found in the previous chapter, only those found on multiple
projects are used in an attempt to discover the most common issues found on complex
transportation projects. The final section of this chapter presents a radar diagram with all of
the projects included and discusses the complexity of the projects and what type of
management teams would best fit each particular project.
6.1 Case Study Sources of Complexity Comparisons
6.1.1 Cost Dimension
The cost dimension similarities are presented on the next page in Table 6.1. As shown, the
majority of the issues contributing to cost complexity are found in most of the projects, two
of which appear in all five projects and a few overlap between each other. One of the major
findings in the cost dimension is that all five projects used acceleration of the schedule for a
particular reason increasing the overall costs for the project. Some of the projects made the
decision to accelerate the schedule based on transit user benefits, while others simply wanted
to open the project faster. One method used by the owners to accelerate the construction was
incentives built into the contract. This method leads directly into the contract type changing
cost methods issue since the incentives were incorporated into the contracts which were
written with alternate contracting types. All but one project noted that the type of contract

90
affected the way the costs were managed for their projects. Considering that none of the
projects were performed under the traditional DBB methodology and that many of these
owner’s had never attempted a project using a different procurement method, this finding
seems plausible. The other source of complexity found on all of the projects was the issue of
estimates. However, each project did not have the same estimate issues. The problems
found with the estimates were: conducted with little design completed, outdated, originally
performed for a longer time period, scope change leading to estimate growth, and high
estimates limiting the scope. The other four sources were only found on a few of the
projects. One issue related to estimates is the risk associated with changing scope seen on
two projects. Both of these projects added scope that had to be coordinated and funded in
some manner. Material issues were not a major source of complexity with the exception of
the I-15 project that physically could not obtain enough materials, but clauses were built into
the contracts for specific material escalation for the other two of the projects warranting their
discussion. Direct external agency cost risk was prevalent on two of the projects. The I-15
project encountered significant utility challenges and the Warwick project dealt with air, rail,
and highway agencies. Both of these agencies were mentioned under the cost dimension due
to the potential impact negotiations had, or could have had on the cost of the projects. The
last challenge seen on multiple projects was the high focus on cost control. With the large
and sometimes very restrictive budgets, three projects used resources that were specifically
assigned to cost controls.
Table 6.1 – Project Similarities Contributing to Cost Complexity
Project Contract type changed cost
methods
Incentives, optimization, acceleration, transit user
benefits
Material issues
External agency
risk
Estimate issues
High focus on control
Risk due to changing
scope
E-470 X X X TH 212 X X X X
I-15 X X X X X Warwick X X X X X X X
I-64 X X X X X
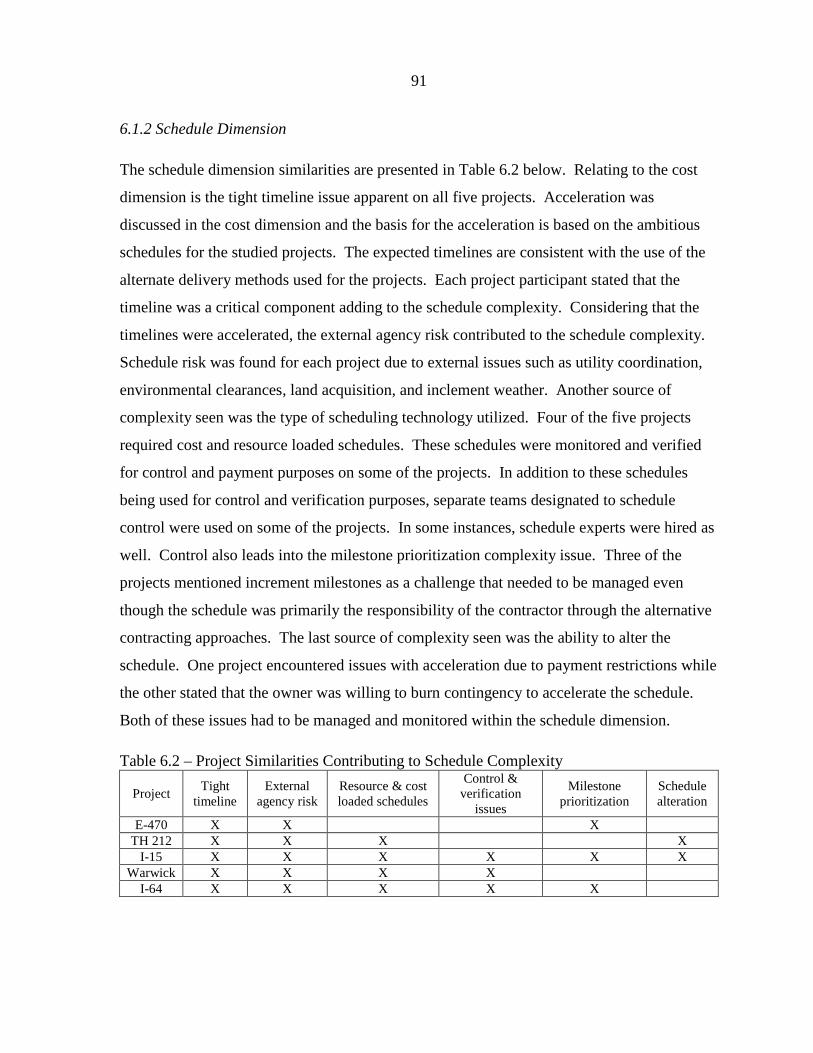
91
6.1.2 Schedule Dimension
The schedule dimension similarities are presented in Table 6.2 below. Relating to the cost
dimension is the tight timeline issue apparent on all five projects. Acceleration was
discussed in the cost dimension and the basis for the acceleration is based on the ambitious
schedules for the studied projects. The expected timelines are consistent with the use of the
alternate delivery methods used for the projects. Each project participant stated that the
timeline was a critical component adding to the schedule complexity. Considering that the
timelines were accelerated, the external agency risk contributed to the schedule complexity.
Schedule risk was found for each project due to external issues such as utility coordination,
environmental clearances, land acquisition, and inclement weather. Another source of
complexity seen was the type of scheduling technology utilized. Four of the five projects
required cost and resource loaded schedules. These schedules were monitored and verified
for control and payment purposes on some of the projects. In addition to these schedules
being used for control and verification purposes, separate teams designated to schedule
control were used on some of the projects. In some instances, schedule experts were hired as
well. Control also leads into the milestone prioritization complexity issue. Three of the
projects mentioned increment milestones as a challenge that needed to be managed even
though the schedule was primarily the responsibility of the contractor through the alternative
contracting approaches. The last source of complexity seen was the ability to alter the
schedule. One project encountered issues with acceleration due to payment restrictions while
the other stated that the owner was willing to burn contingency to accelerate the schedule.
Both of these issues had to be managed and monitored within the schedule dimension.
Table 6.2 – Project Similarities Contributing to Schedule Complexity
Project Tight
timeline External
agency risk Resource & cost loaded schedules
Control & verification
issues
Milestone prioritization
Schedule alteration
E-470 X X X TH 212 X X X X
I-15 X X X X X X Warwick X X X X
I-64 X X X X X

92
6.1.3 Technical Dimension
Table 6.3 presents the sources of complexity for the technical dimension that are similar for
the studied projects. As shown in the table no issue was found in all five of the projects. The
delivery method of the projects has been mentioned already, but it is more apparent in this
dimension. Four of the projects were conducted using DB while the fifth was performed
using CM@R. One source of complexity found on four of the projects was that the delivery
method impacted how the contract was formed. Since this was the first time some of these
owner’s had used alternate delivery methods this source seems apparent. Especially
considering that MnDOT has used alternate delivery methods in the past, it is consistent with
the TH 212 not being impacted by the contact formation of a different delivery method.
Some of the common issues with the contract formation were determining how the contract
was viewed by all of the parties, who was responsible for what portion of the project, and the
disparity between confidential and public information. The delivery method and the size of
the project contributed to the majority of the sources of complexity shown in Table 6.3. The
dispute resolution process was another issue arising in four of the projects. Once again,
MnDOT’s familiarity with DB may have reduced the complexity with the dispute resolution
process. All four participants stated that the dispute process was more complex with new
methods being implemented, dispute review boards being created, and dispute meetings
occurring more frequently depending on the project. Two other sources that were directly
affected by the contract language were quality control issues and the design process. Since
the contractor was ultimately responsible for the quality and design the owner’s had to invent
ways to monitor these processes. The major focus of the quality control efforts were figuring
out ways to analyze quality problems, ensuring quality was not sacrificed because of the
accelerated schedules, and using oversight programs to verify the projects were being
constructed adequately. The design process also limited the direct impact the owner’s had on
the physical design of the project. Many of the project’s designs encountered extensive
limitations through existing conditions making the designs complex. Owners also had to
create ways to monitor the design quality and determine how to conduct value engineering
and constructability review sessions to verify the design adhered to the standards set forth.
Internally, the selected delivery method also affected the structure of the owner’s
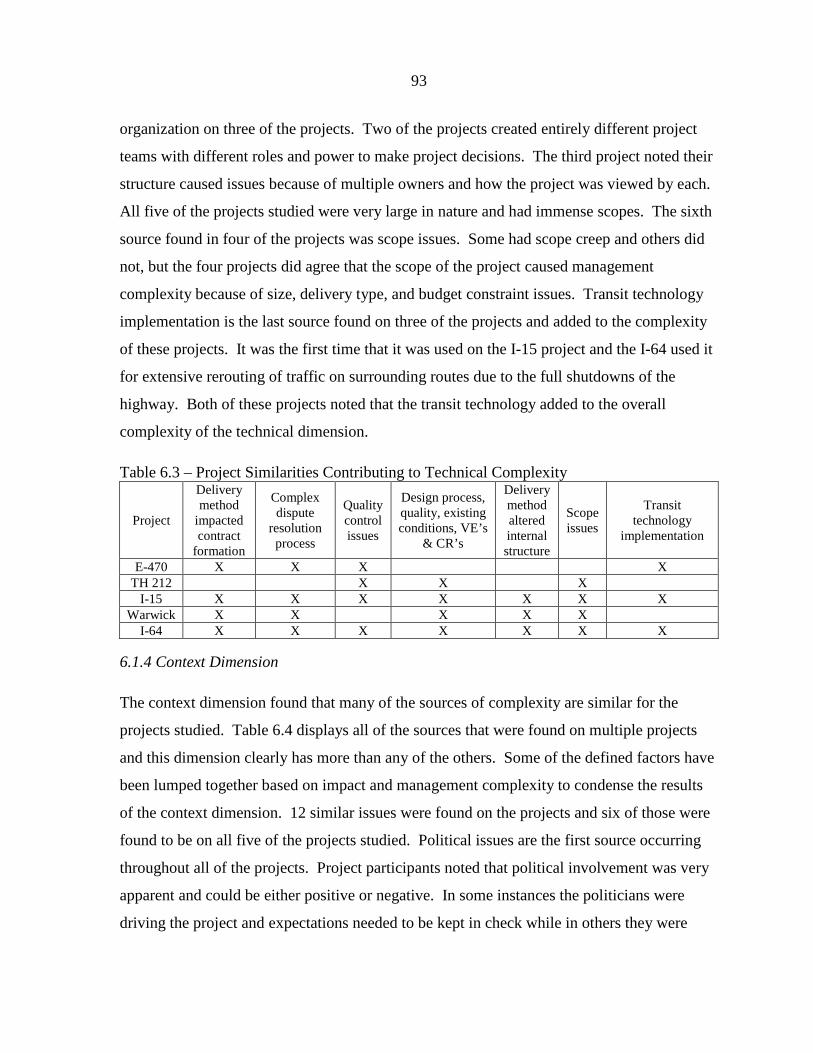
93
organization on three of the projects. Two of the projects created entirely different project
teams with different roles and power to make project decisions. The third project noted their
structure caused issues because of multiple owners and how the project was viewed by each.
All five of the projects studied were very large in nature and had immense scopes. The sixth
source found in four of the projects was scope issues. Some had scope creep and others did
not, but the four projects did agree that the scope of the project caused management
complexity because of size, delivery type, and budget constraint issues. Transit technology
implementation is the last source found on three of the projects and added to the complexity
of these projects. It was the first time that it was used on the I-15 project and the I-64 used it
for extensive rerouting of traffic on surrounding routes due to the full shutdowns of the
highway. Both of these projects noted that the transit technology added to the overall
complexity of the technical dimension.
Table 6.3 – Project Similarities Contributing to Technical Complexity
Project
Delivery method
impacted contract
formation
Complex dispute
resolution process
Quality control issues
Design process, quality, existing conditions, VE’s
& CR’s
Delivery method altered internal structure
Scope issues
Transit technology
implementation
E-470 X X X X TH 212 X X X
I-15 X X X X X X X Warwick X X X X X
I-64 X X X X X X X
6.1.4 Context Dimension
The context dimension found that many of the sources of complexity are similar for the
projects studied. Table 6.4 displays all of the sources that were found on multiple projects
and this dimension clearly has more than any of the others. Some of the defined factors have
been lumped together based on impact and management complexity to condense the results
of the context dimension. 12 similar issues were found on the projects and six of those were
found to be on all five of the projects studied. Political issues are the first source occurring
throughout all of the projects. Project participants noted that political involvement was very
apparent and could be either positive or negative. In some instances the politicians were
driving the project and expectations needed to be kept in check while in others they were
94
trying to halt construction. The second source appearing in all five projects is titled local
group’s impact which is comprised of the public, jurisdictions, and local agency challenges.
The public was one factor that needed to be managed due to project expectations, approval,
design decisions, and overall apprehension. Multiple jurisdictions and local agencies were
also seen on some of the projects that required management resources. Also included in the
local group’s impact source are social, demographic, and project acceptance factors. These
were not seen on all of the projects, but are included in this source because they provided
similar management challenges since they are highly correlated with the public aspect.
Media and marketing control is another source that was found on all five projects.
Considering the size and cost of the projects studied the marketing plans had to be
comprehensive. All five of the projects used some form of a marketing plan and controlled
the information flow to the media in some fashion. Some projects utilized marketing
consultants while others did not. Utilities have arisen in the previous dimension concerning
their potential impact on the cost, schedule, and design of the projects. Since they were
defined as an external factor in the literature review they appear in the context dimension as
well for a more thorough discussion. The scope of all five projects encountered many utility
relocation and coordination challenges. Some of the projects noted that the condensed
timeframe increased the amount of resources needed to deal with utility challenges. Another
source of complexity found on all of the projects was environmental issues. This source
includes a lot of issues found through the case studies including hazardous remediation,
wetlands replacement, environmental clearances, extensive EIS’s, joint permits, use of
sustainable/recycled materials, and general environmental impact concerns. Not all of the
listed environmental issues appeared on every project, but it is safe to conclude that every
project met environmental issues that required management resources. The last source found
on all of the projects studied is the impact the project had on land changes. This source
includes elements such as land acquisition through condemnation and eminent domain,
growth inducement, rezoning, and changing land values. Once again it is important to note
that not all of these issues were prevalent on all of the projects, but the research draws a link
between complex transportation projects and significant local land impacts. The remaining

95
six sources of complexity were not seen on all of the studied projects, but provided
management complexity. A summary of the common issues found is presented below:
• Creation of new and alteration of existing emergency routes • Extensive traffic control plans that include techniques such as retiming of signals,
visualization techniques, and overall rerouting of traffic • Legislative approval for alternate delivery method use and legal limitations that
were altered in order for the selected delivery method to be successful • Inclement weather causing delays • Intermodal incorporation • Business access programs
The above context dimension has drawn a lot of commonalities between the projects which is
expected with the immense amount of external factors facing the management teams for the
studied projects. Future complex projects should take note of the similarities found within
this dimension and be mindful of the project specific sources of complexity discussed in
Chapter 5 as well.
Table 6.4 – Project Similarities Contributing to Context Complexity
Project Political issues
Local groups impact
Media and marketing
control
Utility coordination
Environmental issues
Land changes &
impacts E-470 X X X X X X
TH 212 X X X X X X I-15 X X X X X X
Warwick X X X X X X I-64 X X X X X X
Table 6.4 cont. – Project Similarities Contributing to Context Complexity
Project Emergency
route impacts Traffic
management
Legal & legislative barriers
Inclement weather
Intermodal challenges
Program impacts
E-470 X X X TH 212 X X X
I-15 X X X X X Warwick X
I-64 X X X X X
6.1.5 Financing Dimension
The similar sources of complexity for the financing dimension are presented in Table 6.5.
Out of the five studied projects there was not one financial issue that was found on all of the
projects. One source that showed up in four of the projects was the issue of multiple types of
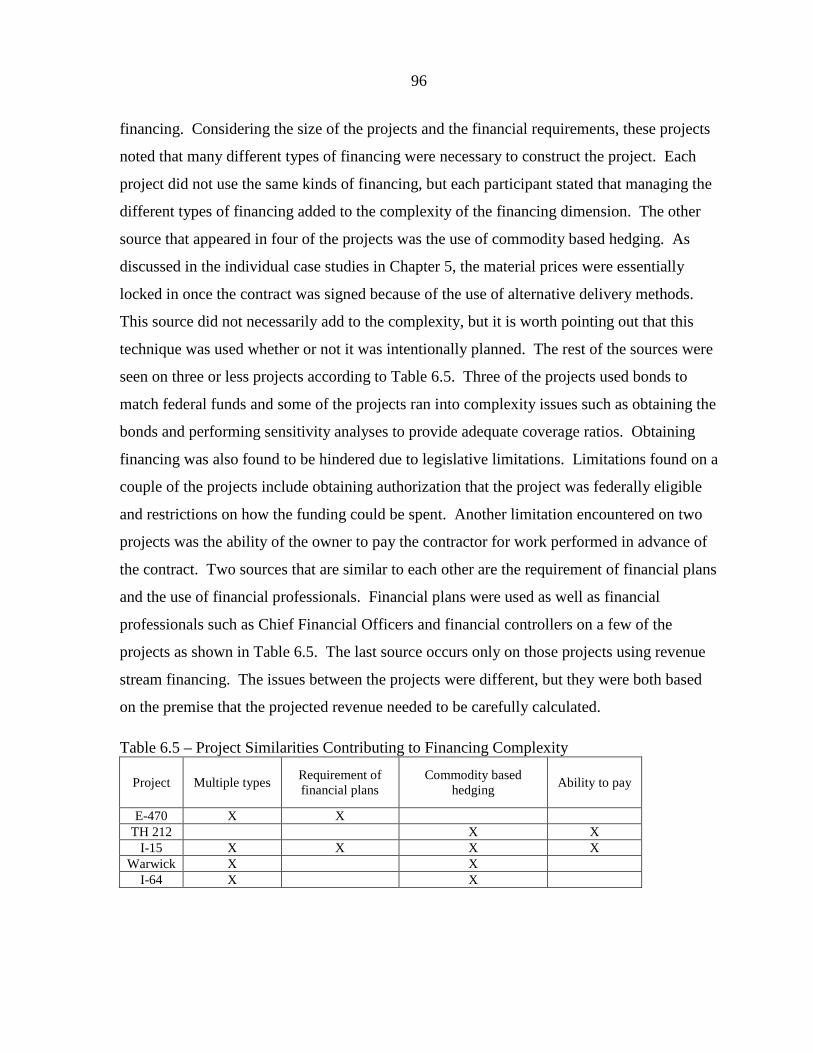
96
financing. Considering the size of the projects and the financial requirements, these projects
noted that many different types of financing were necessary to construct the project. Each
project did not use the same kinds of financing, but each participant stated that managing the
different types of financing added to the complexity of the financing dimension. The other
source that appeared in four of the projects was the use of commodity based hedging. As
discussed in the individual case studies in Chapter 5, the material prices were essentially
locked in once the contract was signed because of the use of alternative delivery methods.
This source did not necessarily add to the complexity, but it is worth pointing out that this
technique was used whether or not it was intentionally planned. The rest of the sources were
seen on three or less projects according to Table 6.5. Three of the projects used bonds to
match federal funds and some of the projects ran into complexity issues such as obtaining the
bonds and performing sensitivity analyses to provide adequate coverage ratios. Obtaining
financing was also found to be hindered due to legislative limitations. Limitations found on a
couple of the projects include obtaining authorization that the project was federally eligible
and restrictions on how the funding could be spent. Another limitation encountered on two
projects was the ability of the owner to pay the contractor for work performed in advance of
the contract. Two sources that are similar to each other are the requirement of financial plans
and the use of financial professionals. Financial plans were used as well as financial
professionals such as Chief Financial Officers and financial controllers on a few of the
projects as shown in Table 6.5. The last source occurs only on those projects using revenue
stream financing. The issues between the projects were different, but they were both based
on the premise that the projected revenue needed to be carefully calculated.
Table 6.5 – Project Similarities Contributing to Financing Complexity
Project Multiple types Requirement of financial plans
Commodity based hedging
Ability to pay
E-470 X X TH 212 X X
I-15 X X X X Warwick X X
I-64 X X

97
Table 6.5 cont. – Project Similarities Contributing to Financing Complexity
Project Financial professionals Bond issues Legislative limitations Revenue stream
concerns
E-470 X X TH 212
I-15 X X Warwick X X X X
I-64 X 6.1.6 Case Study Comparison Summary
One of the goals of the research is to analyze to the projects and find sources of complexity
that are similar between the projects. The above sections looked at each dimension
individually and found the similarities between the studied projects. The following list
summarizes the sources of complexity that were found in at least four out of the five projects.
The intent is to serve as a comprehensive list of the most probable complexity sources for
project managers planning future transportation projects anticipated to be of a complex
nature:
• Contract type changing cost methods • Balance between incentives, optimization, acceleration, and transit user benefits • Estimate issues • Tight timeline • External agency risk • Resource & cost loaded schedules • Delivery method impacting contract formation • Complex dispute resolution process • Quality control issues • Design process, design quality, existing conditions, VE’s & CR’s • Scope issues • Political issues • Local groups impact • Media and marketing control • Utility coordination • Environmental issues • Land changes & impacts • Multiple types of financing • Use of commodity based hedging

98
The above list is by no means all encompassing as many other sources of complexity were
found during this chapter and the individual project summaries in Chapter 5. It merely serves
as a starting point and displays the most prominent sources found through this research for
project management professionals to begin brainstorming and analyzing potential complex
issues that may arise on a given project. The following section combines all of the radar
diagrams into one and discusses possible resource needs based on project characteristics.
6.2 Case Study Validation
The results up to this point in Chapters 5 and 6 were presented to a Strategic Highway
Research Program (SHRP) 2 Renewal Technical Coordination Committee (TCC) that was
responsible for the award of the project. The five case studies were presented as a pilot
portion of the larger research project. The TCC consisted of professionals from both
academia and industry and it was found that the results submitted in this research are
consistent with the expectations of the committee. The committee agreed that the five
projects studied are complex projects and that the findings are reasonable based on the
experience of the evaluators. This presentation provides further validation of the results
found in this research both by practicing professionals and the academic community.
6.3 Dimension Score Comparisons & Resource Allocation
6.3.1 Project Scores Comparison
The radar diagram presented in Figure 6.2 displays all of the dimensional scores for the
projects studied. The main use for this diagram would be for an upper level director to
predict the scores of the dimensions for a set of upcoming projects and allocate resources
based on the expected complexities for the dimensions. Potentially, the director could create
a similar diagram for upcoming projects to view all of the resource needs and allocate
accordingly. Upper level directors could use the methodology presented in the figure for all
upcoming projects, not just ones expected to be complex. According to the diagram all of the
projects studied were deemed to be complex for all of the dimensions based on an average
project receiving a score of 55 with the exception of the technical dimension for the E-470
project Each project has dimensions where the complexity is greater than other areas and the
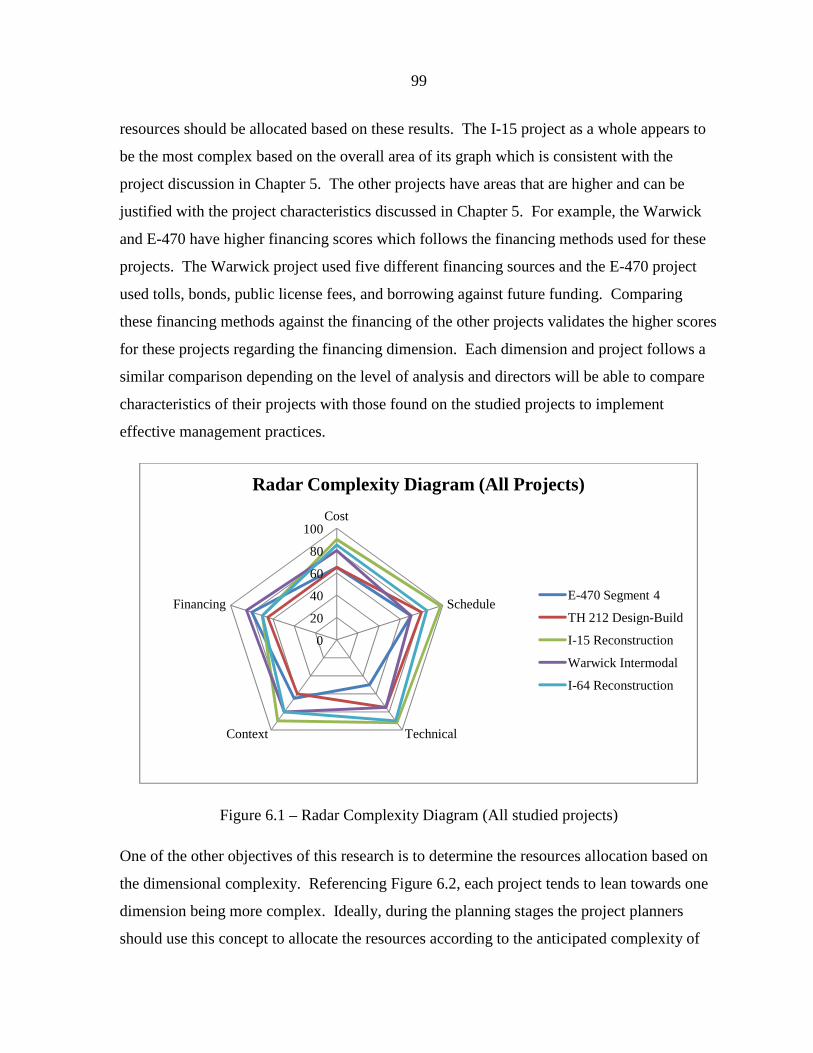
99
resources should be allocated based on these results. The I-15 project as a whole appears to
be the most complex based on the overall area of its graph which is consistent with the
project discussion in Chapter 5. The other projects have areas that are higher and can be
justified with the project characteristics discussed in Chapter 5. For example, the Warwick
and E-470 have higher financing scores which follows the financing methods used for these
projects. The Warwick project used five different financing sources and the E-470 project
used tolls, bonds, public license fees, and borrowing against future funding. Comparing
these financing methods against the financing of the other projects validates the higher scores
for these projects regarding the financing dimension. Each dimension and project follows a
similar comparison depending on the level of analysis and directors will be able to compare
characteristics of their projects with those found on the studied projects to implement
effective management practices.
Figure 6.1 – Radar Complexity Diagram (All studied projects)
One of the other objectives of this research is to determine the resources allocation based on
the dimensional complexity. Referencing Figure 6.2, each project tends to lean towards one
dimension being more complex. Ideally, during the planning stages the project planners
should use this concept to allocate the resources according to the anticipated complexity of
0
20
40
60
80
100Cost
Schedule
TechnicalContext
Financing
Radar Complexity Diagram (All Projects)
E-470 Segment 4
TH 212 Design-Build
I-15 Reconstruction
Warwick Intermodal
I-64 Reconstruction
100
each dimension. The following sections outline each dimension and recommends ideas for
resource allocation based on the results of the study.
6.3.2 Cost Dimension
Projects anticipated to have high scores concerning cost complexity should allocate
professionals that are efficient at controlling and estimating costs. Employees with extensive
estimate and cost control experience would be ideal for projects with complex cost elements.
Detail oriented professionals would be beneficial for monitoring budgetary concerns and
separate cost control teams would be useful in identifying cost risks and tracking all costs
incurred throughout the course of the project.
6.3.3 Schedule Dimension
The majority of the projects studied for this research had accelerated timelines which
appears to be a major issue on complex transportation projects that has the potential to affect
other dimensions as well. Experienced schedule professionals and scheduling experts are
recommended for projects experiencing high schedule dimensional complexity. Staff
familiar with scheduling practices, contractor relations, and being able to look ahead would
be best suited for this type of complexity. In addition, professionals familiar with resource
and cost loaded schedules would be useful considering the majority of the project studied
utilized these type of scheduling components. In addition, separate schedule control teams
would benefit the project in order to monitor and anticipate potential delays.
6.3.4 Technical Dimension
Projects expecting high technical scores should implore professionals that have immense
design experience even if the owner is not conducting the majority of the design. This leads
directly into the other type of experience needed in that all of the projects studied procured
their projects through alternative delivery methods. The use of different delivery methods is
not as common in transportation as it is in other construction areas, therefore professionals
with this type of experience may be hard to come by. Nonetheless, any experience with other
delivery methods such as DB, CM@R, and P3 would be beneficial to projects using similar

101
delivery methods. In addition, since the contracts are typically abnormal, utilizing contract
specialists may be an option as well. The technical dimension incorporates a lot of factors
and managers with good delegating skills would be ideal to effectively manage each aspect
associated with this dimension.
6.3.5 Context Dimension
Historically, this dimension has been considered as an external risk. This research
recommends that this dimension be perceived as an integral part of the project and managed
accordingly. Projects with immense context complexity would want to allocate professionals
with excellent people and coordination skills. All of the factors contained in this dimension
relate to external factors and staff with prior experience dealing with affected stakeholders
and groups would be useful. Generally, outgoing, approachable, and good conflict
negotiations skills would be admirable traits for employees designated to this dimension.
This dimension encompasses many different factors that could have varying impacts on a
project. Each project should evaluate what types of external factors are going to require the
most resources and plan accordingly. Other recommendations found through this research
include hiring a marketing consultant, maintaining constant communication with all parties,
and being open, honest, and transparent in all negotiations with external parties. In addition,
attempting to keep the media as an ally instead of a burden could yield positive results.
6.3.6 Financing Dimension
Alternative methods of financing are relatively new to transportation projects. Projects with
high financing complexity may want to hire financial consultants or people outside of the
construction management and engineering roles. Alternately, financial training may be a
way to help assist current project managers in the development of the financing process.
However, if the financing is extremely complex, it is recommended that owner’s look outside
of the construction and engineering departments so that project manager’s time is not spent
dealing with financing issues. As alternative methods of financing become more prevalent,
owners should embrace them and employ professionals familiar with the vast forms of
financing to effectively manage this aspect of a project.

102
Chapter 7 – Research Limitations
This chapter identifies the limitations to the performed research and discusses why the
research is bounded by these constraints. A list of the limitations is presented below with the
following paragraphs summarizing each bulleted item:
• Identified factors of complexity are bounded by previous literature • Findings are limited by the interview participant’s past experience • Scoring and complexity comparisons are subjective • Results are limited by the studied projects • Findings have limited applicability • Factors are analyzed and modeled as discrete when significant interaction is likely • Results are not subjected to tests of statistical significance
The first research limitation is that the defined factors contributing to the complexity of
transportation projects are bounded by the previous literature. The conceptual literature
review and analysis sections serve to identify and define the specific factors within each
dimension that have the potential to contribute to management complexity. However, it can
be assumed that not every possible factor is presented in this research. Some factors found
through the literature review are only mentioned in one, or a few articles, and may be lacking
in previous research. One method used to alleviate this limitation is the use of the “list any
other source of dimensional complexity not discussed above” question found at the end of
each dimension on the questionnaire in Appendix B. The basis of the research was to
identify as many factors as possible and discuss them with the project participants, but it is
likely that some factors contributing to complexity may not be included in the presented
research.
Along with the exclusion of potential complexity factors, the research interviews are limited
by the past experience of the interviewee. The first page of the questionnaire in Appendix B
asks the participant for their number of years in construction related fields in order to verify
that they have ample experience to participate in this study. The questionnaire also asks for
the participant to compare the complexity of the studied project against previous projects,
which is subject to the participant’s past experience. Interviewees were selected based on the
presumption that they are qualified to provide significant information, but the past experience
103
varies with each participant and therefore has the possibility of affecting the results of the
research.
The third limitation is also based on the participant’s past experience. The comparisons and
scoring conducted during the questionnaire use a subjective methodology. Comparing the
studied project against previous projects is a subjective process and depends on the past
experience of the interviewee. The main results of the questionnaire are the numerical
scoring of each dimension; therefore the subjectivity of the comparisons is not as crucial.
The comparisons merely serve as talking points for discussing each dimension’s complexity.
However, the numerical scoring of each dimension is also subjective and could vary
depending on who the participant is from the project. Concerns over subjectivity were
addressed through the use of the summary section of the questionnaire in Appendix B. Since
each dimension is discussed independently it was advantageous of the research to summarize
all of the dimensions together and assure that the participant is comfortable with their
provided responses. The focus of the research is to analyze which dimensions provide the
most complexity and the use of the summary section allows the participant to compare each
dimension and alter their scoring accordingly.
The research process conducted relies on case study projects that are deemed to be of a
complex nature. Each case study and interview takes a substantial amount of time and
coordination. Therefore, the results found are limited by the projects studied. For this type
of study it would be difficult to send out a general questionnaire to many projects and expect
an acceptable return rate with adequate information. The only feasible research approach
was found to be the use of background case study research and in-depth interviews with the
participant, concentrating the results to the individual projects studied.
Adding to the previous limitation, the results found are limited in their applicability. Each
transportation project is different and is comprised of various components. In addition, the
projects studied are all deemed to be complex and non-complex projects are not analyzed for
this methodology. The analysis section discussed some similarities between the studied
projects and recommends that the findings be used on projects with similar characteristics.
However, users of the results need to be careful when applying management methods used in

104
the studied projects. The main focus is to determine which dimensions require more
resources to manage and strategies used by the researched projects are not necessarily
appropriate for all complex transportation projects.
The factors of complexity that were identified and defined for the purpose of the study were
primarily examined as discrete events. Through the course of the interviews and
questionnaires it was apparent that significant interaction is likely between the factors. For
example, expediting the schedule of a transportation project is likely to increase costs and
require more quality control. As an exploratory study into an expanded conceptualization of
project management, it was important to identify and model the substantial number of factors
that contribute to complexity. The research study accomplished this important first step, but
modeling interaction between factors exceeded the scope of this study.
The last limitation presented in this section is the statistical significance of the findings.
Subjectivity is discussed above and leads directly into this limitation. Considering the
limited amount of projects studied and the subjectivity of the participant, the findings are not
subject to validation through testing for statistical significance. The results are merely
reserved for upper level managers to compare their projects with the cases researched, predict
the complexity of each dimension, and allocate resources accordingly.

105
Chapter 8 – Future Research Ideas
One of the purposes of research is to present findings that can be built upon with future
research. This section presents future research ideas that could be conducted in order to
advance the research performed in this study. Since this concept could be perceived as
broad, there are quite a few different approaches that could be undertaken for future research.
One of the main research questions for this study was to determine a way to score each
dimension based on complexity for resource allocation purposes. Projects that have been
completed or are nearing completion were used for this study and the dimensions were
scored by participants that were associated with the project. One future research idea would
be to take a project that is in its early stages, such as the need or conceptual phase, and
predict the scores for each dimension. Near the conclusion of the project, the dimensions
could be scored again and comparisons could be drawn between the initial and final scoring
stages. This idea would potentially generate the differences and presumptions made by the
participant between the different stages of the project.
Another future research idea would be to take the results of this study and apply them to a
group of projects at an upper management level. The stated results for this project are the
ability for the end user to be able to allocate resources based on the type of projects the
organization is undertaking. A verification study would need to be performed to ensure that
the projects’ characteristics match up with those studied in this research and that the
presumed resource allocation is appropriate for the projects based on dimensional
complexity. This basic research idea could evolve in many directions with upper level
managers predicting the radar diagrams of upcoming projects, allocating resources, and
verifying that the projects encounter the predicted results.
The definition of a complex project found in the introduction also states that the results of the
research should be able to be used on all projects, not necessarily ones of a complex nature.
However, all of the cases studied fit the definition of complex. In order to verify that this
research can be used on non-complex projects it would have to be applied through a research
setting creating another future research idea.
106
Lessons learned from the studied cases could also be incorporated into future work. This
research focused on assigning numerical values to the dimensions and mentions some of the
strategies used by the agencies, but a more in depth look at the lessons learned could benefit
managers on future projects. In addition, any future cases studied could gather lessons
learned from those projects and compare and contrast those against successful strategies for
the work presented here.
An important area for follow up studies is to identify interaction effects between the
complexity factors. Intuitively, what creates complexity is not so much discrete factors
which can be managed independently, but interaction between factors which must be
understood at a systems level. A rich area for future research is to model the interaction
effects using a systems level analysis.
The last proposed future research idea would involve the participation of other
representatives from the same projects used in this study. Conducting the same interview
and questionnaire with other participants involved with these projects would assist in the
verification of the results and may lead to alternate perceptions of the complexity found on
the projects. Other management complexity issues may arise as well when using different
points of view and varying project roles.
107
Chapter 9 – Conclusions
There are three main research goals that are presented throughout the course of this research.
The first goal was to identify through a literature search the factors in complex transportation
projects that contribute to management complexity. Based on the results of the literature
review, real world case studies were conducted through questionnaires and interviews to
identify sources of complexity found on current and completed projects that align with the
defined factors found through prior research. Through the interview process the second
objective ranked each dimension numerically and verified that the sources of complexity
found within each dimension justify the scores provided by the participant. The third goal of
the research was then to analyze the dimensions based on the scoring for resource allocation
purposes. The overall intent of the project was to provide project managers and upper level
directors a comprehensive look at the management of complex transportation projects and
provide a conceptual methodology focused on the transition of the project management field.
There are many results found throughout the course of this research that are pertinent to the
management of complex transportation projects. First, the literature review determined that
there are many factors that have the potential to affect the complexity found on a particular
project. Contributing to this finding, additional factors were found through the case studies
concluding that every project encounters many different issues and it is impossible to create a
list that would involve every possible source of complexity. Each project needs to evaluate
the potential challenges and determine the best course of action to mitigate the risks
associated. However, the results presented through the case studies serve as a starting point
for comparisons and potential management strategies. All of the results verify that the
management of complex transportation projects are experiencing a shift in the required
management skills towards a more pragmatic approach. Project managers can no longer
think of the elements of a project as merely risks, proactive planning and communication
need to be staples among professionals in the future.
The second conclusion is based on the set of cases studied and represents more of a set of
conclusions that a single finding. Chapter 6 discussed the similarities found through the
interview process and a list of the most common sources of complexity can be found on Page

108
99. The sources of complexity found through the literature review identified factors that
contribute to management complexity and the most prevalent real-world problems are found
in this list. In summarization, the list contains sources from each dimension concluding that
all of the five dimensions studied in this project have issues that span across multiple
projects. Breaking the list down even further, the studied complex projects are constrained
by accelerated timelines causing cost, design, and quality control issues. In addition to these
factors found in the traditional dimensions, external forces caused by local groups and
multiple types of financing are primary sources of complexity found in the additional context
and financing dimensions. Constant communication with all parties is paramount to the
successful management strategies used in the case studies to alleviate these concerns.
Although many more sources of complexity have been found throughout the research, the
above factors seem to be the driving forces behind the management of complex
transportation project.
The last conclusion is based on the project participant’s results from the scoring of the
dimensions. The radar diagrams presented serve as a method for upper level directors to
evaluate upcoming projects and allocate resources based on the anticipated complexity of
each dimension. Comparing the results of the radar diagrams to the analysis of the interview
discussions, the results appear to be consistent with the management challenges faced on
each individual project. This lends to the conclusion that the dimensional scoring process is
a task that can be performed within an owner’s organization in order to allocate resources
based on the predicted results. Once the dimensions have been compared between projects,
directors should have the capacity to allocate professionals with specific skill sets to the areas
that require that type of experience.
In conclusion, the expected goals of the research appear to have been fulfilled and the results
in this study should serve as a basis for how complex transportation projects should be
viewed in the future. Reiterating, the aim of the project was to be as comprehensive as
possible in providing an overview in the management for complex projects, but it is likely
that other sources of complexity may arise on projects that have not been mentioned, further
requiring additional management strategies.
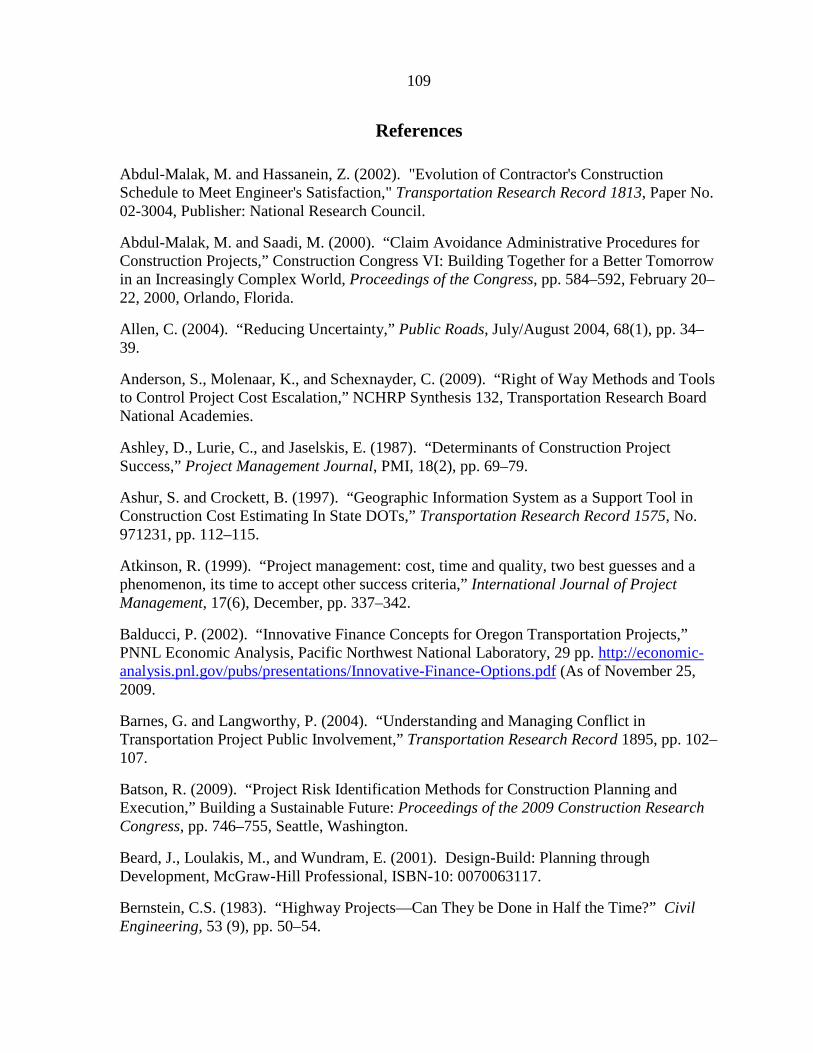
109
References
Abdul-Malak, M. and Hassanein, Z. (2002). "Evolution of Contractor's Construction Schedule to Meet Engineer's Satisfaction," Transportation Research Record 1813, Paper No. 02-3004, Publisher: National Research Council.
Abdul-Malak, M. and Saadi, M. (2000). “Claim Avoidance Administrative Procedures for Construction Projects,” Construction Congress VI: Building Together for a Better Tomorrow in an Increasingly Complex World, Proceedings of the Congress, pp. 584–592, February 20–22, 2000, Orlando, Florida.
Allen, C. (2004). “Reducing Uncertainty,” Public Roads, July/August 2004, 68(1), pp. 34–39.
Anderson, S., Molenaar, K., and Schexnayder, C. (2009). “Right of Way Methods and Tools to Control Project Cost Escalation,” NCHRP Synthesis 132, Transportation Research Board National Academies.
Ashley, D., Lurie, C., and Jaselskis, E. (1987). “Determinants of Construction Project Success,” Project Management Journal, PMI, 18(2), pp. 69–79.
Ashur, S. and Crockett, B. (1997). “Geographic Information System as a Support Tool in Construction Cost Estimating In State DOTs,” Transportation Research Record 1575, No. 971231, pp. 112–115.
Atkinson, R. (1999). “Project management: cost, time and quality, two best guesses and a phenomenon, its time to accept other success criteria,” International Journal of Project Management, 17(6), December, pp. 337–342.
Balducci, P. (2002). “Innovative Finance Concepts for Oregon Transportation Projects,” PNNL Economic Analysis, Pacific Northwest National Laboratory, 29 pp. http://economic-analysis.pnl.gov/pubs/presentations/Innovative-Finance-Options.pdf (As of November 25, 2009.
Barnes, G. and Langworthy, P. (2004). “Understanding and Managing Conflict in Transportation Project Public Involvement,” Transportation Research Record 1895, pp. 102–107.
Batson, R. (2009). “Project Risk Identification Methods for Construction Planning and Execution,” Building a Sustainable Future: Proceedings of the 2009 Construction Research Congress, pp. 746–755, Seattle, Washington.
Beard, J., Loulakis, M., and Wundram, E. (2001). Design-Build: Planning through Development, McGraw-Hill Professional, ISBN-10: 0070063117.
Bernstein, C.S. (1983). “Highway Projects—Can They be Done in Half the Time?” Civil Engineering, 53 (9), pp. 50–54.
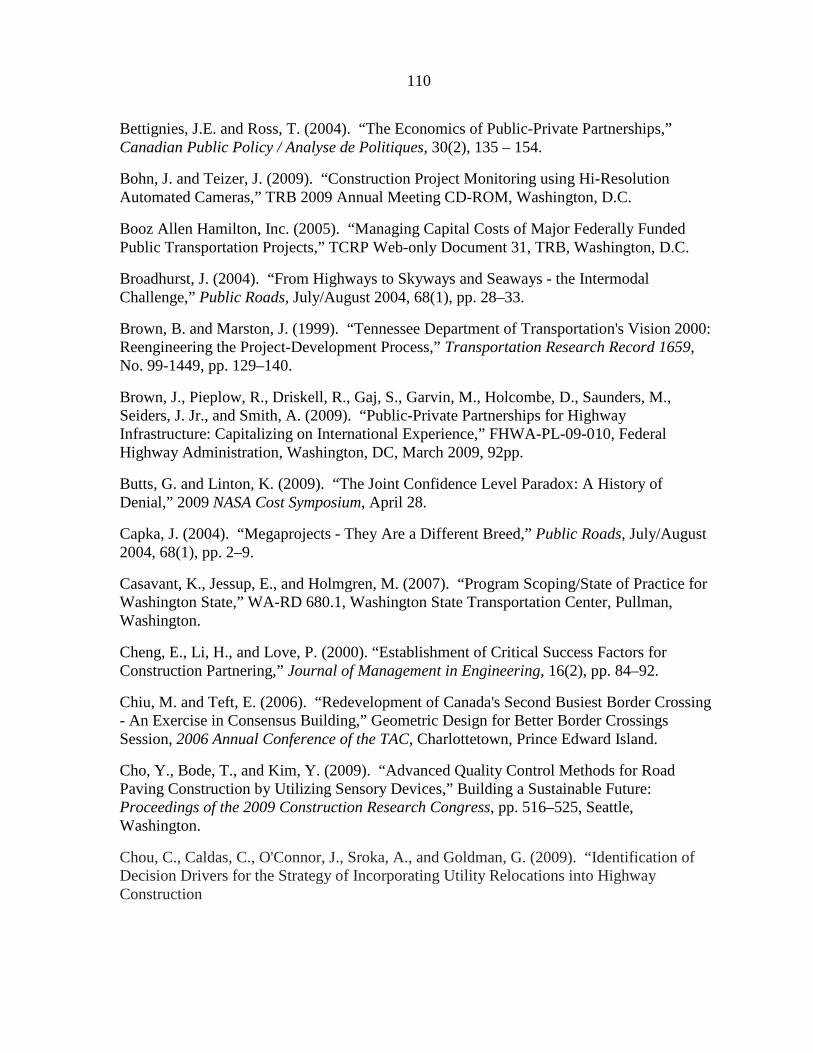
110
Bettignies, J.E. and Ross, T. (2004). “The Economics of Public-Private Partnerships,” Canadian Public Policy / Analyse de Politiques, 30(2), 135 – 154.
Bohn, J. and Teizer, J. (2009). “Construction Project Monitoring using Hi-Resolution Automated Cameras,” TRB 2009 Annual Meeting CD-ROM, Washington, D.C.
Booz Allen Hamilton, Inc. (2005). “Managing Capital Costs of Major Federally Funded Public Transportation Projects,” TCRP Web-only Document 31, TRB, Washington, D.C.
Broadhurst, J. (2004). “From Highways to Skyways and Seaways - the Intermodal Challenge,” Public Roads, July/August 2004, 68(1), pp. 28–33.
Brown, B. and Marston, J. (1999). “Tennessee Department of Transportation's Vision 2000: Reengineering the Project-Development Process,” Transportation Research Record 1659, No. 99-1449, pp. 129–140.
Brown, J., Pieplow, R., Driskell, R., Gaj, S., Garvin, M., Holcombe, D., Saunders, M., Seiders, J. Jr., and Smith, A. (2009). “Public-Private Partnerships for Highway Infrastructure: Capitalizing on International Experience,” FHWA-PL-09-010, Federal Highway Administration, Washington, DC, March 2009, 92pp.
Butts, G. and Linton, K. (2009). “The Joint Confidence Level Paradox: A History of Denial,” 2009 NASA Cost Symposium, April 28.
Capka, J. (2004). “Megaprojects - They Are a Different Breed,” Public Roads, July/August 2004, 68(1), pp. 2–9.
Casavant, K., Jessup, E., and Holmgren, M. (2007). “Program Scoping/State of Practice for Washington State,” WA-RD 680.1, Washington State Transportation Center, Pullman, Washington.
Cheng, E., Li, H., and Love, P. (2000). “Establishment of Critical Success Factors for Construction Partnering,” Journal of Management in Engineering, 16(2), pp. 84–92.
Chiu, M. and Teft, E. (2006). “Redevelopment of Canada's Second Busiest Border Crossing - An Exercise in Consensus Building,” Geometric Design for Better Border Crossings Session, 2006 Annual Conference of the TAC, Charlottetown, Prince Edward Island.
Cho, Y., Bode, T., and Kim, Y. (2009). “Advanced Quality Control Methods for Road Paving Construction by Utilizing Sensory Devices,” Building a Sustainable Future: Proceedings of the 2009 Construction Research Congress, pp. 516–525, Seattle, Washington.
Chou, C., Caldas, C., O'Connor, J., Sroka, A., and Goldman, G. (2009). “Identification of Decision Drivers for the Strategy of Incorporating Utility Relocations into Highway Construction
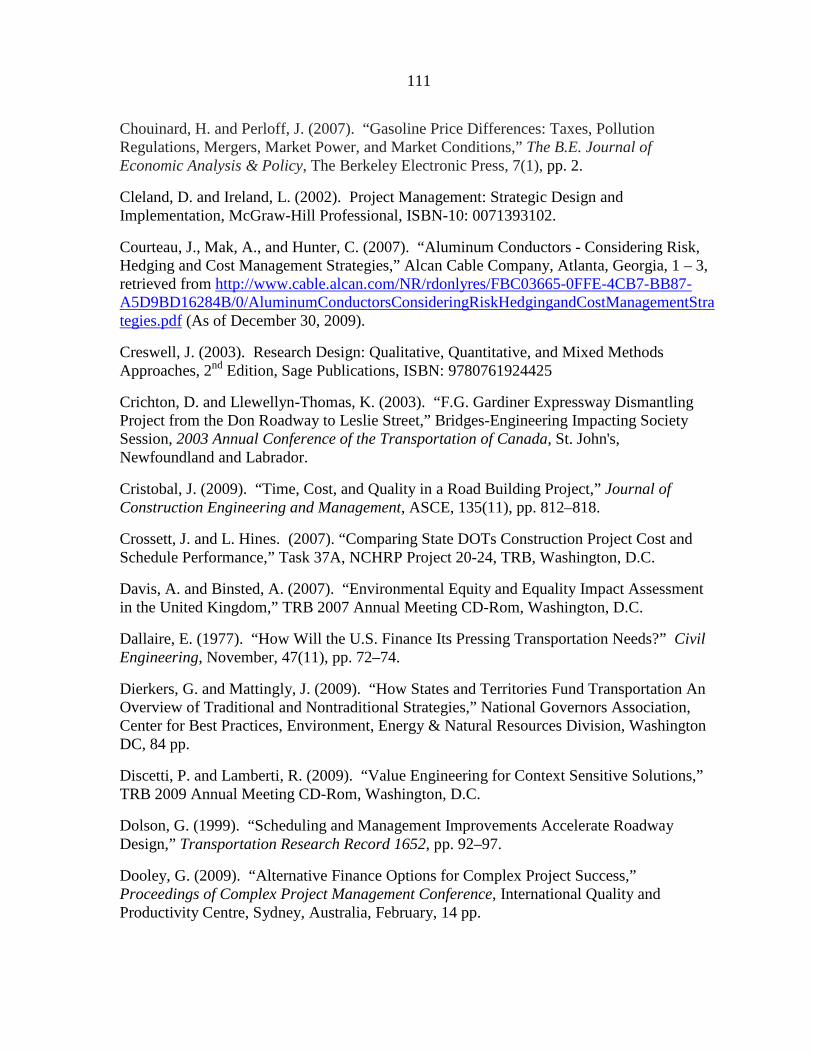
111
Chouinard, H. and Perloff, J. (2007). “Gasoline Price Differences: Taxes, Pollution Regulations, Mergers, Market Power, and Market Conditions,” The B.E. Journal of Economic Analysis & Policy, The Berkeley Electronic Press, 7(1), pp. 2.
Cleland, D. and Ireland, L. (2002). Project Management: Strategic Design and Implementation, McGraw-Hill Professional, ISBN-10: 0071393102.
Courteau, J., Mak, A., and Hunter, C. (2007). “Aluminum Conductors - Considering Risk, Hedging and Cost Management Strategies,” Alcan Cable Company, Atlanta, Georgia, 1 – 3, retrieved from http://www.cable.alcan.com/NR/rdonlyres/FBC03665-0FFE-4CB7-BB87-A5D9BD16284B/0/AluminumConductorsConsideringRiskHedgingandCostManagementStrategies.pdf (As of December 30, 2009).
Creswell, J. (2003). Research Design: Qualitative, Quantitative, and Mixed Methods Approaches, 2nd Edition, Sage Publications, ISBN: 9780761924425
Crichton, D. and Llewellyn-Thomas, K. (2003). “F.G. Gardiner Expressway Dismantling Project from the Don Roadway to Leslie Street,” Bridges-Engineering Impacting Society Session, 2003 Annual Conference of the Transportation of Canada, St. John's, Newfoundland and Labrador.
Cristobal, J. (2009). “Time, Cost, and Quality in a Road Building Project,” Journal of Construction Engineering and Management, ASCE, 135(11), pp. 812–818.
Crossett, J. and L. Hines. (2007). “Comparing State DOTs Construction Project Cost and Schedule Performance,” Task 37A, NCHRP Project 20-24, TRB, Washington, D.C.
Davis, A. and Binsted, A. (2007). “Environmental Equity and Equality Impact Assessment in the United Kingdom,” TRB 2007 Annual Meeting CD-Rom, Washington, D.C.
Dallaire, E. (1977). “How Will the U.S. Finance Its Pressing Transportation Needs?” Civil Engineering, November, 47(11), pp. 72–74.
Dierkers, G. and Mattingly, J. (2009). “How States and Territories Fund Transportation An Overview of Traditional and Nontraditional Strategies,” National Governors Association, Center for Best Practices, Environment, Energy & Natural Resources Division, Washington DC, 84 pp.
Discetti, P. and Lamberti, R. (2009). “Value Engineering for Context Sensitive Solutions,” TRB 2009 Annual Meeting CD-Rom, Washington, D.C.
Dolson, G. (1999). “Scheduling and Management Improvements Accelerate Roadway Design,” Transportation Research Record 1652, pp. 92–97.
Dooley, G. (2009). “Alternative Finance Options for Complex Project Success,” Proceedings of Complex Project Management Conference, International Quality and Productivity Centre, Sydney, Australia, February, 14 pp.
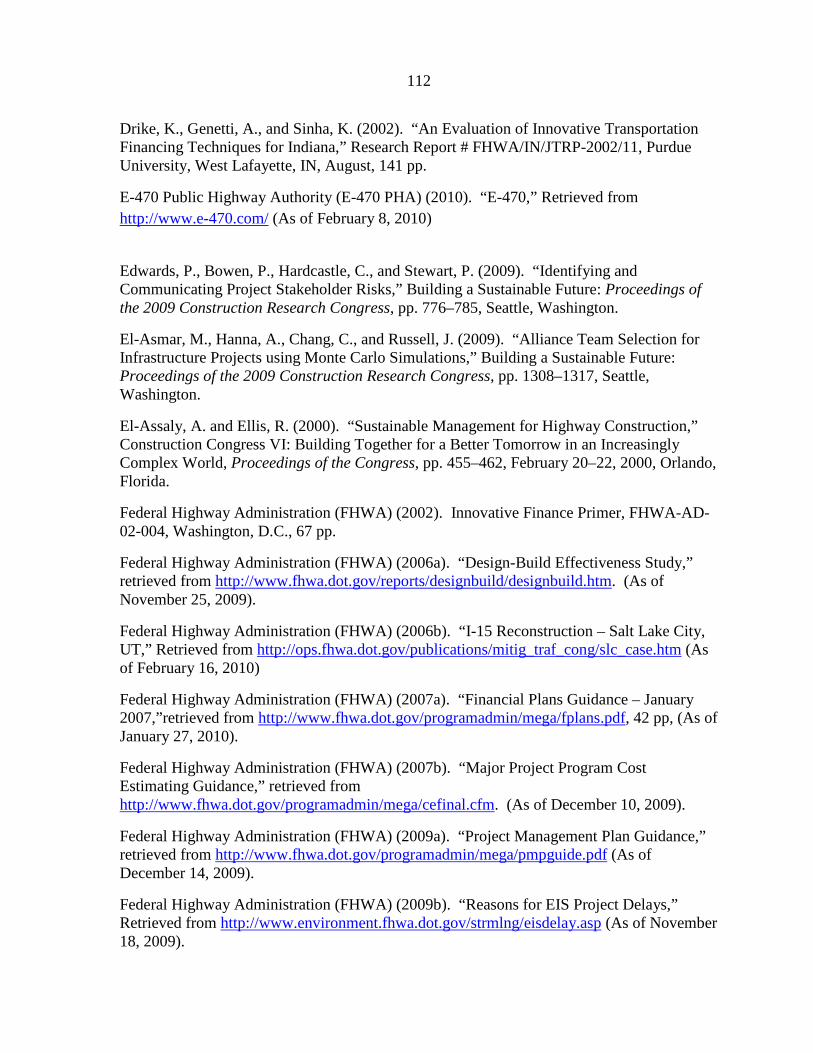
112
Drike, K., Genetti, A., and Sinha, K. (2002). “An Evaluation of Innovative Transportation Financing Techniques for Indiana,” Research Report # FHWA/IN/JTRP-2002/11, Purdue University, West Lafayette, IN, August, 141 pp.
E-470 Public Highway Authority (E-470 PHA) (2010). “E-470,” Retrieved from http://www.e-470.com/ (As of February 8, 2010)
Edwards, P., Bowen, P., Hardcastle, C., and Stewart, P. (2009). “Identifying and Communicating Project Stakeholder Risks,” Building a Sustainable Future: Proceedings of the 2009 Construction Research Congress, pp. 776–785, Seattle, Washington.
El-Asmar, M., Hanna, A., Chang, C., and Russell, J. (2009). “Alliance Team Selection for Infrastructure Projects using Monte Carlo Simulations,” Building a Sustainable Future: Proceedings of the 2009 Construction Research Congress, pp. 1308–1317, Seattle, Washington.
El-Assaly, A. and Ellis, R. (2000). “Sustainable Management for Highway Construction,” Construction Congress VI: Building Together for a Better Tomorrow in an Increasingly Complex World, Proceedings of the Congress, pp. 455–462, February 20–22, 2000, Orlando, Florida.
Federal Highway Administration (FHWA) (2002). Innovative Finance Primer, FHWA-AD-02-004, Washington, D.C., 67 pp.
Federal Highway Administration (FHWA) (2006a). “Design-Build Effectiveness Study,” retrieved from http://www.fhwa.dot.gov/reports/designbuild/designbuild.htm. (As of November 25, 2009).
Federal Highway Administration (FHWA) (2006b). “I-15 Reconstruction – Salt Lake City, UT,” Retrieved from http://ops.fhwa.dot.gov/publications/mitig_traf_cong/slc_case.htm (As of February 16, 2010)
Federal Highway Administration (FHWA) (2007a). “Financial Plans Guidance – January 2007,”retrieved from http://www.fhwa.dot.gov/programadmin/mega/fplans.pdf, 42 pp, (As of January 27, 2010).
Federal Highway Administration (FHWA) (2007b). “Major Project Program Cost Estimating Guidance,” retrieved from http://www.fhwa.dot.gov/programadmin/mega/cefinal.cfm. (As of December 10, 2009).
Federal Highway Administration (FHWA) (2009a). “Project Management Plan Guidance,” retrieved from http://www.fhwa.dot.gov/programadmin/mega/pmpguide.pdf (As of December 14, 2009).
Federal Highway Administration (FHWA) (2009b). “Reasons for EIS Project Delays,” Retrieved from http://www.environment.fhwa.dot.gov/strmlng/eisdelay.asp (As of November 18, 2009).

113
Federal Highway Administration (FHWA) (2009c). “P3 Defined: Long Term Lease of Existing Facilities,” retrieved from http://www.fhwa.dot.gov/ipd/p3/defined/long_term_lease.htm (As of January 30, 2010).
Federal Transit Administration (FTA) (2003). “Project and Construction Management Guidelines,” retrieved from http://www.fta.dot.gov/documents/Construct_Proj_Mangmnt_CD.pdf. (As of November 24, 2009).
Feng, C., Chen, Y., and Huang. J. (2010). “Using the Multi-Dimensional (MD) CAD Model to Develop the Time-Cost Integrated Schedule for Construction Projects,” Automation in Construction, DOI: 10.1016/j.autcon.
Fischer, M. (2000). “Benefits of 4D Models for Facility Owners and AEC Service Providers,” Proceedings of the Construction Congress VI, February, pp. 20–22, Orlando, Florida.
Flyvbjerg, B., Holm, M., and Buhl, S. (2004). “What Causes Cost Overrun in Transport Infrastructure Projects?” Transport Reviews, 24(1), January, pp. 3–18.
Fulton, M. and Vercammen, J. (2009). “Optimal Two-Part Pricing in a Carbon Offset Market: A Comparison of Organizational Types,” Southern Economic Journal, October 2009, retrieved from http://www.thefreelibrary.com/Southern+Economic+Journal/2009/October/1-p5226 (As of January 30, 2010).
Gallay, D. (2006). “Public–Private Partnerships for Financing Federal Capital: Useful or Chimerical?” Public Works Management and Policy, 11(2), pp. 139–151.
Gambatese, J. (2000). “Owner Involvement in Construction Site Safety,” Construction Congress VI: Building Together for a Better Tomorrow in an Increasingly Complex World, Proceedings of the Congress, pp. 661–670, February 20-22, 2000, Orlando, Florida.
Gamez, E. A. and Touran, A. (2009). “A Method of Risk ranking for International Transportation Projects,” Proceedings of 7th International Probabilistic Workshop, pp. 187–203, November, Delft, The Netherlands.
General Services Administration (GSA) (2009). “GSA BIM Guide for 4D Phasing,” GSA BIM Guide Series 04, retrieved from www.gsa.gov/bim (As of December 14, 2009).
Gilbert, L. and Krieger, J. (2009). “Greasing the Wheels: The Crossroads of Campaign Money & Transportation Policy,” White Paper, U.S. PIRG Education Fund, Washington, D.C., November, 31 pp.
Gilham, B. (2008). Small-Scale Social Survey Methods, London and New York: Continuum, ISBN: 9780826496300.
114
Golder Associates Inc. (2009). “Guide for the Process of Managing Risk on Rapid Renewal Projects,” Draft version of SHRP 2 R09, Transportation Research Board of the National Academies.
Government Accountability Office (GAO) (1997). “Transportation Infrastructure: Managing the Costs of Large-Dollar Highway Projects,” GAO/RCED-97-47, February 1997.
Government Accountability Office (GAO) (2008). “Highways and Environment: Transportation Agencies are Acting to Involve Others in Planning and Environmental Decisions,” GAO-08-512-R Highways and Environment.
Government Accountability Office (GAO) (2009). “Public Transportation- Federal Project Approval Process Remains a Barrier to Greater Private Sector Role and DOT Could Enhance Efforts to Assist Project Sponsors,” GAO-10-19, United States Government Accountability Office, Washington, DC, October 2009, 55 pp.
Gransberg, D. and Kelly, E. (2008). “Quantifying Uncertainty of Construction Material Price Volatility Using Monte Carlo,” Cost Engineering, June, 50(6), pp. 14–18.
Gransberg, D. and Molenaar, K. (2004). “Analysis of Owner's Design and Construction Quality Management Approaches in Design/Build Projects,” Journal of Management in Engineering, ASCE, 20(4), October 2004, pp. 162–169.
Gransberg, D. and Molenaar, K. (2008). “Does Design-Build Project Delivery Affect the Future of the Public Engineer?” Transportation Research Record 2081, pp. 3–8.
Gransberg, D. and Riemer C. (2009). “Performance-Based Construction Contractor Prequalification,” NCHRP Synthesis 390, Transportation Research Board National Academies, Washington D.C.
Gransberg, D. and Windel, E. (2008). “Communicating Design Quality Requirements for Public Sector Design/Build Projects,” Journal of Management in Engineering, ASCE, 24(2), April 2008, pp. 105–110.
Gransberg, D., Datin, J., and Molenaar, K. (2008). “Quality Assurance in Design-Build Projects (A Synthesis of Highway Practice),” NCHRP, Synthesis 376, Washington, D.C.
Gransberg, D., Koch, J., and Molenaar, K. (2006). Preparing for Design-Build Projects: A Primer for Owners, Engineers, and Contractors, American Society of Civil Engineers, ISBN-10: 0784408289.
Gransberg, D., Puerto, C., and Humphrey, D. (2007). “Rating Cost Growth from the Initial Estimate to Design Fee for Transportation Projects,” Journal of Construction Engineering and Management, ASCE, 133(6), June 2007, pp. 404–408.
Gray, C. and Larson, E. (2008). Project Management: The Managerial Process, 4th Edition, McGraw-Hill/Irwin, ISBN-10: 0073525154.

115
Greater Austin Chamber of Commerce (GACC) (2005). “2005 InterCity Visit,” Retrieved from http://www.austinchamber.com/TheChamber/AboutTheChamber/Denver05_Intercity/Tollroads.pdf (As of February 8, 2010)
Green Airport (GA) (2010). “Intermodal Facility,” Retrieved from http://www.pvdairport.com/main.aspx?guid=8BA8B370-031D-43BE-8100-A5D1A78D149E (As of February 8, 2010)
Hamilton, B. and Baker, Jr. M. (2003). “Environmental Information Management and Decision Support System - Implementation Handbook,” NCHRP Report 481, Washington D.C., Transportation Research Board.
Harder, P.D. (2009). “Lessons Learned: Florida I595 Project, “Public Works Financing, Newsletter, April, Retrieved from http://www.nossaman.com/showarticle.aspx?show=5635 (As of November 25, 2009).
Hauswirth, D., Hoffman, D., Kane, J., Ozobu, I., Thomas, C., and Wong, P. (2004). “Collaborative Leadership: Success Stories in Transportation Mega Projects,” Retrieved from http://www.fhwa.dot.gov/programadmin/mega/collaborative.cfm (As of February 16, 2010)
Heiligenstein, M. (2009). “The Devolution of Transportation Funding How Innovative Financing Is Putting Local Communities Back in the Drivers Seat,” White Paper, Central Texas Regional Mobility Authority, 14pp, retrieved from http://www.uofaweb.ualberta.ca/ipe//pdfs/TransportPaper-Heiligenstein.pdf (As of January 27, 2010).
Hertogh, M., Baker, S., Staal-Ong, P., and Westerveld, E. (2008). Managing Large Infrastructure Projects: Research on Best Practices and Lessons Learnt in Large, AT Osborne BV, NETLIPSE, ISBN: 9789081002523.
Interview Participant #1, Telephone Interview, February 8, 2010
Interview Participant #2, Telephone Interview, February 11, 2010
Interview Participant #3, Telephone Interview, February 17, 2010
Interview Participant #4, Telephone Interview, February 12 & 18, 2010
Interview Participant #5, Telephone Interview, March 19, 2010
Jongeling, R. and Olofsson, T. (2007). “A Method for Planning of Work-Flow by Combined Use of Location-Based Scheduling and 4D CAD,” Automation in Construction, 16(2), March, pp. 189–198.
Kasi, M. (2007). “Managing Transportation Projects with ASTM International Standards,” ASTM Standardization News, 35(11), November 2007, pp. 26–35.
116
Kerzner, H. (2006). Project Management: A Systems Approach to Planning, Scheduling, and Controlling, 9th ed., John Wiley & Sons, Inc., New Jersey.
Khodakarami, V., Fenton, N., and Neil, M. (2007). “Project scheduling: improved approach to incorporate uncertainty using Bayesian networks,” Project Management Journal, 38(2), pp. 39–49.
Kirby, R. (2007). “Managing Congestion through Innovative Pricing and Financing,” Proceedings of ITE 2007 Technical Conference, 1-6, May, San Diego, California.
Klijn, E., Edelenbos, J., Kort, M., and Twist, M. (2008). “Facing Management Choices: An Analysis of Managerial Choices in 18 Complex Environmental Public-Private Partnership Projects,” International Review of Administrative Sciences, 74(2), pp. 251–282.
Kog, Y., Chua, D., Loh, P., and Jaselskis, E. (1999). “Key determinants for construction schedule performance,” International Journal of Project Management, 17(6), pp. 351–359.
Konchar, M. and Sanvido, V. (1998). “Comparison of U.S. Project Delivery Systems,” Journal of Construction Engineering and Management, November/December 1998, pp. 435–444.
Kraus, E., Quiroga, C., and Le, J. (2008). “Development of a Tool for Utility Conflict Data Management in the Project Development Process,” TRB 2008 Annual Meeting CD-Rom, No. 08-0281, Washington, D.C.
Kyte, C., Perfater, M., Haynes, S., and Lee, H. (2004). “Developing and Validating a Tool to Estimate Highway Construction Project Costs,” Transportation Research Record 1885, pp. 35–41.
Lam, E., Chan, A., and Chan, D. (2008). “Determinants of Successful Design-Build Projects,” Journal of Construction Engineering and Management, ASCE, 134(5), pp. 3–14.
Lee, E., Ibbs, C., Harvey, J., and Roesler. J. (2000). “Construction Productivity and Constraints for Concrete Pavement Rehabilitation in Urban Corridors,” Transportation Research Record 1712, No. 00-1183, pp. 13–22.
Lee, E., Harvey, J., Ibbs, C., and Martin, J. (2002). “Construction Productivity Analysis for Asphalt Concrete Pavement Rehabilitation in Urban Corridors,” Transportation Research Record 1813, No.02-2876, pp. 285–294.
Levitt, R. (1984). “Superprojects and Superheadaches: Balancing Technical Economies of Scale Against Management Diseconomies of Size and Complexity,” Project Management Journal, PMI, 15(4), pp. 82–89.
Little, R. (2006). “Expanding the Infrastructure Tent: Crafting an Inclusive Strategy for Infrastructure Funding,” Public Works Management Policy, 11, pp. 84–91.
Lockhart, C., McGrath, T., and Rost, J. (2008). “Innovative Cost and Schedule Risk Assessment for Large Transportation Projects,” Transportation and Development: Innovative
117
Best Practices 2008, Proceedings of the First International Symposium, pp. 39–44, April 24–26, 2008, Beijing, China.
Lopez del Puerto, C., Gransberg, D., and Shane, J. (2008). “Comparative Analysis of Owner Goals for Design/Build Projects,” Journal of Management in Engineering, ASCE, 24(1), pp. 32–39.
Mahalingam, A., Kashyap, R., and Mahajan, C. (2009). "An Evaluation of The Applicability of 4D CAD on Construction Projects," Automation in Construction, In Press, Corrected Proof, Available online 9 December 2009, ISSN 0926-5805, DOI: 10.1016/j.autcon.2009.11.015.
Marshall, K. R. and Rousey, S. (2009). Guidance for Transportation Project Management, NCHRP Web-Only Document 139, Transportation Research Board ,National Academies, Washington, D.C., 217 pp.
Martin, C. and Does, J. (2005). “Accelerating Highway Bridge Demolition: An Innovative Approach,” Innovations in Bridge Engineering (B) Session, 2005 Transportation Association of Canada, Calgary, Alberta.
Mathur,S. and van Aalst, P. (2009). “Innovative Options For Financing: The Development and Transfer of Technologies,” United Nations Framework Convention on Climate Change, Bonn, Germany, 24 pp., retrieved from http://unfccc.int/resource/docs/publications/innovation_eng.pdf (As of November 25, 2009).
McClure, S., Lowry, J., Rizvi, R., and Woodland, J. (2008). “Public-Private Partnerships: A Case Study in Evaluating ESALs for Long-Term Performance Warranties in New Mexico,” TRB 2008 Annual Meeting CD-ROM, Washington, D.C.
McKim, R., Hegazy, T., Attalla, M. (2000). “Project performance control in reconstruction,” Journal of Construction Engineering and Management, 126(2), pp. 137–141.
McLeod, D. (1996). “Integrating Transportation and Environmental Planning: Applicability of Corridor and Subarea Studies and Decisions on Design Concept and Scope,” Transportation Research Record 1552, pp. 1–7.
Merrow, E., McDonnell, L., and Arguden, R. (1988). “Understanding the Outcome of Mega-Projects: A Quantitative Analysis of Very Large Civilian Projects,” ISBN: 0-8330-0843-9, RAND Corp., Santa Monica, California.
Miller, D., Fields, R., Kumar, A., and Ortiz, R. (2000). “Leadership and Organizational Vision in Managing a Multiethnic and Multicultural Project Team,” Journal of Management in Engineering, November/December 2000, pp. 18–22.
Miller, J. and Lantz, Jr. K. (2008). “Challenges and Solutions to Project Scoping: Insights from Virginia Professionals,” TRB 2009 Annual Meeting CD-ROM, Washington, D.C.

118
Minnesota Department of Transportation (MnDOT) (2005). “Highway 212 Design-Build Project,” Retrieved from http://projects.dot.state.mn.us/zrc/212/index.html (As of February 4, 2010)
Missouri Department of Transportation (MoDOT) (2007). “MoDOT St. Louis Area District New Release”, January 22, 2007, Retrieved from http://www.modot.mo.gov/stlouis/news_and_information/District6News.shtml?action=displaySSI&newsId=7726
Missouri Department of Transportation (MoDOT) (2010). “The New I-64,” Retrieved from http://www.thenewi64.org/index.jsp (As of March 17, 2010)
Molenaar, K.R. (2005). “Programmatic Cost Risk Analysis for Highway Mega-Projects,” ASCE Journal of Construction Engineering and Management, 131(3), pp. 343–353.
Molenaar, K. and Wilson, C. (2009). “A Risk-Based Approach to Contingency Estimation in Highway Project Development,” Building a Sustainable Future, Proceedings of the 2009 Construction Research Congress, pp. 786–790, Seattle, Washington.
Molenaar, K., Smith, R., and Sencer, J. (2000a). “Stakeholder Input in Design-Build Highway Construction,” Construction Congress VI: Building Together for a Better Tomorrow in an Increasingly Complex World, Proceedings of the Congress, pp. 611–620, February 20–22, 2000, Orlando, Florida.
Molenaar, K., Vanegas, J., and Martinez, H. (2000b). “Appropriate Risk Allocation in Design-Build RFPs,” Construction Congress VI: Building Together for a Better Tomorrow in an Increasingly Complex World, Proceedings of the Congress, pp. 1083–1092, February 20–22, 2000, Orlando, Florida.
Morallos, D. and Amekudzi, A. (2008). “The State of the Practice of Value for Money Analysis in Comparing Public Private Partnerships to Traditional Procurements,” Public Works Management Policy, 13, pp. 114 – 127.
Mountain Association for Community Economic Development (MACED) (2008). “Profile: The Opportunity of Carbon Credits for Low-Income Landowners,” retrieved from http://www.usendowment.org/images/Profiles9_Carbon_Credits_MACED_2_.pdf (As of December 30, 2009).
Mrawira, D., Rankin, J., and Christian, A. (2002). “Quality Management System for a Highway Megaproject,” Transportation Research Record 1813, No. 02-4102, pp. 275–284.
Mudholkar, V. (2008). “Six Sigma: Delivering Quality to Mega Transportation Projects,” Transportation and Development: Innovative Best Practices 2008, Proceedings of the First International Symposium, pp. 284–289, April 24-26, 2008, Beijing, China.
Nelson, R. (1997). “Utah’s I-15 Design-Build Project,” Retrieved from http://www.tfhrc.gov/pubrds/pr97-12/p40.htm (As of February 16, 2010)

119
Nelson, J., Jahren, C., and Zutz, A. (2009). “Web-based Collaboration for Iowa DOT Bridge Construction,” Proceedings of the 2009 Mid-Continent Transportation Research Symposium, Ames, IA, August 2009, 4 pp.
Net Resources International (NRI) (2010). “TF Green Airport, Warwick, Rhode Island, USA,” Retrieved from http://www.airport-technology.com/projects/tf_green/ (As of February 8, 2010)
Olszak, L., Goldbach, R., and Long, J. (2007). “Do Context Sensitive Solutions Really Work?” TRB 2008 Annual Meeting CD-ROM, Washington, D.C.
Orski, K. (1999). “Innovative Infrastructure Financing Cooperative Mobility Program,” Center for Technology, Policy and Industrial Development, Massachusetts Institute of Technology, Boston, Massachusetts, retrieved from http://dspace.mit.edu/bitstream/handle/1721.1/1566/section%206.pdf;jsessionid=1D5CB6E428ABB3680596AD5158A6CA94?sequence=7 (As of November 25, 2009).
Pate, W. (2000). “Innovative Design and Construction of Chesapeake and Delaware Canal Bridge,” Transportation Research Record 1696, No. 5B0070, pp. 44–48.
Pennsylvania Department of Transportation (2009). Design Manual Part 1A; Transportation Engineering Procedures: Publication 10A; Chapter 3 - Design Project Management, July, pp. 3-10 to 3-12.
Persad, K., Walton, C., and Franco, P. (2008). “Planning and Financing Tools for Rural/Small Urban Area Projects,” CTR Report#0-6034-P1, Texas Department of Transportation, Austin, Texas, 83 pp.
Pickrell, D. (1990). “Urban Rail Transit Projects: Forecast versus Actual Ridership and Cost,” Report DOT-T-91-04, U.S.D.O.T. , Washington, D.C.
Porro, B. and Schaad, W. (2002). “Risk Management: Illustrated Contribution of Insurers and Reinsurers,” Transportation Research Record 1814, No. 02-3474, pp. 121–123.
Price, W. (2002). “Innovation in Public Finance: Implications for the Nation's Infrastructure,” Public Works Management Policy, 7, pp. 63–90.
Resource Systems Group, Inc. (2007). “Overview Of Innovative Transportation Finance Options,” Briefing Paper, Chittenden County Metropolitan Planning Organization, Burlington, Vermont, October, 9 pp., Retrieved from http://www.ccmpo.info/library/innovative_finance/RSG_IF_fundingoptionsPaper_200710.pdf (As of November 25, 2009).
Rhode Island Airport Corporation (RIAC) (2008). “Work Plan Evaluation Construction Manager @ Risk Warwick Intermodal Station Project,” FHWA Initial Evaluation, September 24, 2008
120
Russell, A., Staub-French, S., Tran, N., and Wong, W. (2009). “Visualizing High-Rise Building Construction Strategies Using Linear Scheduling and 4D CAD,” Automation In Construction, 18(2), March, pp. 219–236.
Salek, M., (2009). “Colorado’s E-470 Tollway,” Retrieved from http://www.mesalek.com/colo/e470.html (As of July 5, 2009)
Sangrey, D., Roberds, W., Reilly, J., McGrath, T., and Boone, S. (2003). “Cost and Schedule Estimates for Large Transportation Projects: A New Approach to Solving an Old Problem,” The Transportation Factor 2003, Annual Conference and Exhibition of the Transportation Association of Canada.
Sanvido, V., Parfitt, K., Guvenis, M., and Coyle, M. (1992). “Critical Success Factors for Construction Projects,” Journal of Construction Engineering and Management, ASCE, 118(1), March, pp. 94–111.
Schaufelberger, J. (2000). “Strategies for Successful Partnering Relationships,” Construction Congress VI: Building Together for a Better Tomorrow in an Increasingly Complex World, Proceedings of the Congress, pp. 463–470, February 20–22, 2000, Orlando, Florida.
Schexnayder, C. and Mayo, R. (2003). Construction Management Fundamentals, McGraw-Hill, ISBN-10: 0072922001.
Schmitt, R., Hanna, A., and Russell, J. (1997). “Improving Asphalt Paving Productivity,” Transportation Research Record 1575, No. 97-1305, pp. 25–33.
Schneck, D., Laver, R., and O'Connor, M. (2009). “Cost Contingencies, Development Basis and Project Application,” TRB 2009 Annual Meeting CD-ROM, #09-0316, Washington, D.C.
Sillars, D. N. (2009). “Development of Decision Model for Selection of Appropriate Timely Delivery Techniques for Highway Projects,” Transportation Research Record 2098, pp. 18–28.
Sinnette, J. (2004). “Accounting for Megaproject Dollars,” Public Roads, July/August 2004, 68(1), pp. 40–47.
Sorel, T. (2004a). “Great Expectations,” Public Roads, July/August 2004, 68(1), 10 – 15.
Sorel, T. (2004b). “The Life Cycle Continuum,” Public Roads, July/August 2004, 68(1), 22 – 27.
Tatum, C. (1984). “Organizing Large Projects: How Managers Decide,” Journal of Construction Engineering and Management, ASCE, 110(3), pp. 346–358.
Thomas, H., Hester, W., Hunter, J., and Logan. P. (1985). “Comparative Analysis of Time and Schedule Performance on Highway Construction Projects Involving Contract Claims,” FHWA, Washington, D.C.

121
State of Rhode Island Department of Transportation (RIDOT) (2010). “Intermodal Planning,” Retrieved from http://www.dot.state.ri.us/engineering/intermod/index.asp (As of February 8, 2010)
Touran, A. (2006). “Owners Risk Reduction Techniques Using a CM,” report submitted to Construction Management Association of America, August.
Touran, A., Bolster, P., and Thayer, S. (1994). “Risk Assessment in Fixed Guideway Construction,” Report FTA-MA-26-0022, Federal Transit Administration, Washington, D.C.
Touran, A., Molenaar, K., Gransberg, D., and Ghavamifar, K. (2009). “A Decision Support System for Project Delivery Method Selection in Transit,” Transportation Research Records 2111, pp. 148–157.
Transportation Association of Canada (TAC) (2009). “Road Pricing in an Urban Context,” TAC Briefing, February 2009.
TransTech Management Inc., Oldham Historic Properties, Inc., and Parsons Brinckerhoff Quade & Douglas, Inc. (2004). “Performance Measures for Context Sensitive Solutions - A Guidebook for State DOTs,” NCHRP Document 69, TRB.
Trapani, R. and Beal, E. (1983). “Glenwood Canyon I-70: Environmental Concern,” Journal of Transportation Engineering, 109(3), May/June 1983, pp. 403–413.
Trauner Consulting Services (2007). “Innovative Procurement Practices: Alternative Procurement and Contracting Methods,” Caltrans, Contract No. 53A0104.
Verhoef, E.T. (2007). “Second-Best Road Pricing through Highway Franchising,” Journal of Urban Economics, September, 62(2), pp. 337–361.
Vining, A. and Boardman, A. (2008). “Public Private Partnerships: Eight Rules for Governments,” Public Works Management and Policy, 13(2), 149 – 161.
Whited, G. and Gatti, W. (2007). “Owner Procured Preliminary Shop Drawings,” Practice Periodical on Structural Design and Construction, ASCE, 12(1), pp. 16 – 21.
Whitty, J. (2007). “Oregon’s Mileage Fee Concept and Road User Fee Pilot Program,” Oregon Department of Transportation, Final Report, November 2007, 101 pp.
Winter, M. and Smith, C. (2006). “Rethinking Project Management,” EPSRC Network 2004-2006, Final Report, EPSRC, Manchester, UK.
Yakowenko, G. (2004). “Megaproject Procurement: Breaking from Tradition,” Public Roads, July/August 2004, 68(1), pp. 48–53.
Yin, R. (2003). Case Study Research: Design and Methods, 3rd Edition Sage Publications, Inc, ISBN-10: 0761925538.

122
Appendix A

123
Literature Tables
Table A.1 – Cost Dimension
Literature
Cost
Risk Preliminary
Program Planning/Construction Issues
Con
tinge
ncy
Unc
erta
inty
Est
imat
es
Cos
t allo
catio
n
Con
trol
Opt
imiz
atio
n
Ince
ntiv
e
Mat
eria
l
Tra
nsit u
ser
Gransberg & Kelly (2008) � � � �
Anderson et al. (2009)
� �
FTA (2003) � � � �
Molenaar & Wilson (2009) � � �
FHWA (2009a) �
Lockhart et al. (2008) � �
Fischer (2000) �
Batson (2009) �
Edwards et al. (2009) �
Kasi (2007) � � � �
Cristobal (2009) �
Porro & Schaad (2002) � �

124
Literature
Cost
Risk Preliminary
Program Planning/Construction Issues
Con
tinge
ncy
Unc
erta
inty
Est
imat
es
Cos
t allo
catio
n
Con
trol
Opt
imiz
atio
n
Ince
ntiv
e
Mat
eria
l
Tra
nsit u
ser
Kyte et al. (2004) �
Brown & Marston (1999)
� � �
GAO (1997) � �
Sangrey et al. (2003) � �
Gray & Larson (2008) � �
Kerzner (2006)
�
Sorel (2004b) � � �
Allen (2004) � � �
Sinnette (2004) � � � �
Gransberg et al. (2007) �
Hertogh et al. (2008) � �
Touran (2006) � �
Ashur & Crockett (1997)
�
Gransberg & Riemer (2009) � �

125
Literature
Cost
Risk Preliminary
Program Planning/Construction Issues
Con
tinge
ncy
Unc
erta
inty
Est
imat
es
Cos
t allo
catio
n
Con
trol
Opt
imiz
atio
n
Ince
ntiv
e
Mat
eria
l
Tra
nsit u
ser
Booz Allen Hamilton, Inc. (2005)
�
Schneck et al. (2009) � � �
Martin & Does (2005) � �
FHWA (2007b) � � � �
Casavant et al. (2007) � � � � �

126
Table A.2 – Schedule Dimension
Literature
Schedule Planning/Construction Technology
Tim
e
Ris
k
Mile
ston
es
Con
trol
Opt
imiz
atio
n
Res
ourc
e av
aila
bilit
y
Vis
ualiz
atio
n
Sys
tem
/Sof
twar
e
Sanvido et al. (1992) � � �
Zhang (2005) � �
Chan et al. (2000) � �
Ashley et al. (1987) � �
Pennsylvania DOT (2009)
�
New York DOT (2004) �
Caltrans – Office of Special Funded Projects (2008)
�
Lam et al. (2008) � �
Levitt (1984) � �
Chan et al. (2004)
Tatum (1984) �
Iyer and Jha (2006)
McKim et al. (2000) � �
Khodakarami et al. (2007)
�
FHWA (2009b) � �
Kog et al. (1999) �
Butts and Linton (2009) � �
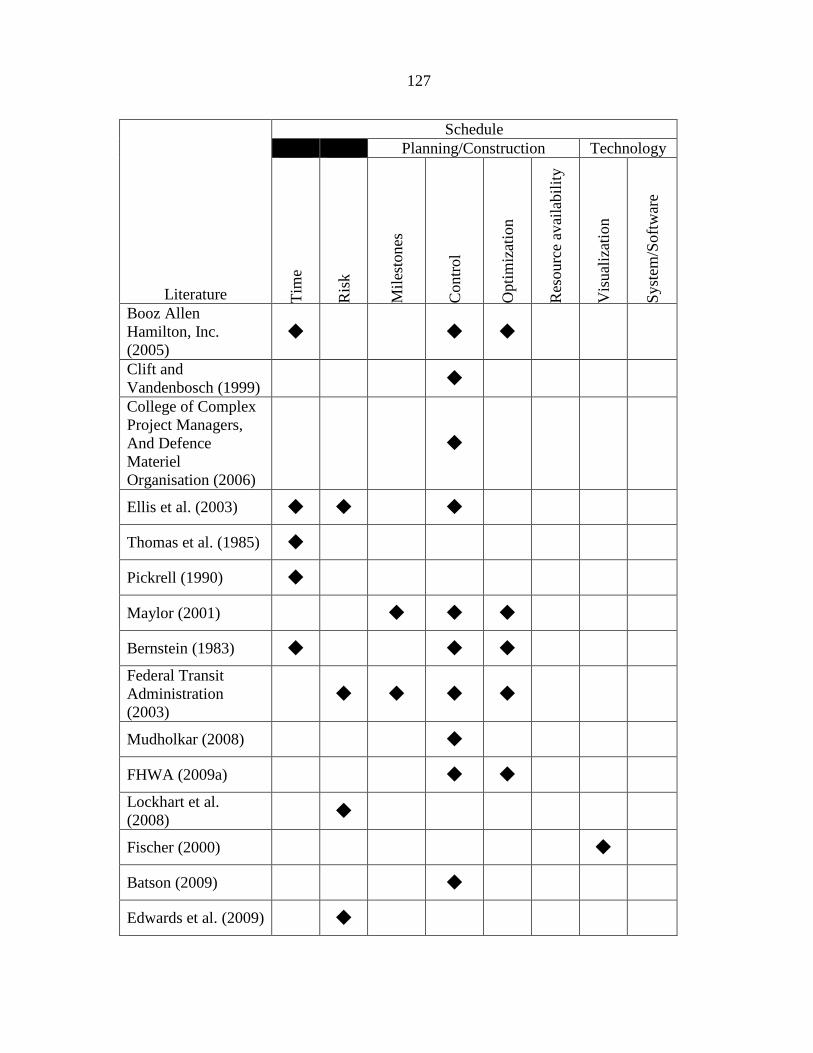
127
Literature
Schedule Planning/Construction Technology
Tim
e
Ris
k
Mile
ston
es
Con
trol
Opt
imiz
atio
n
Res
ourc
e av
aila
bilit
y
Vis
ualiz
atio
n
Sys
tem
/Sof
twar
e
Booz Allen Hamilton, Inc. (2005)
� � �
Clift and Vandenbosch (1999)
�
College of Complex Project Managers, And Defence Materiel Organisation (2006)
�
Ellis et al. (2003) � � �
Thomas et al. (1985) �
Pickrell (1990) �
Maylor (2001) � � �
Bernstein (1983) � � �
Federal Transit Administration (2003)
� � � �
Mudholkar (2008) �
FHWA (2009a) � �
Lockhart et al. (2008)
�
Fischer (2000) �
Batson (2009) �
Edwards et al. (2009) �

128
Literature
Schedule Planning/Construction Technology
Tim
e
Ris
k
Mile
ston
es
Con
trol
Opt
imiz
atio
n
Res
ourc
e av
aila
bilit
y
Vis
ualiz
atio
n
Sys
tem
/Sof
twar
e
Cristobal (2009) � �
Porro and Schaad (2002)
�
Schmitt et al. (1997) � �
Brown and Marston (1999)
� � �
Lee et al. (2002) �
Sangrey et al. (2003) � �
Gray and Larson (2008)
� �
Schexnayder and Mayo (2003)
� �
Kerzner (2006) � �
Sorel (2004b) � � � �
Allen (2004) �
Winter and Smith (2006)
�
Touran (2006) �
Hertogh et al. (2008) �
Dolson (1999) �
Whited and Gatti (2007)
� �
Abdul-Malak and Hassanein (2002)
� �
Crossett and Hines (2007) �

129
Literature
Schedule Planning/Construction Technology
Tim
e
Ris
k
Mile
ston
es
Con
trol
Opt
imiz
atio
n
Res
ourc
e av
aila
bilit
y
Vis
ualiz
atio
n
Sys
tem
/Sof
twar
e
Gamez and Touran (2009) �
Molenaar (2005) �
Flyvbjerg et al. (2004)
� �
Merrow et al. (2008) �
Touran et al. (1994) � � � �
Mahalingam et al. (2009) � �
Feng et al. (2010) � �
Russell et al. (2009) � �
Jongeling and Olofsson (2007) � � �
GSA (2009) �

Table A.3 – Technical Dimension
Literature
Technical Contract Design Construction Technology
Sco
pe
Inte
rnal
str
uctu
re
Pre
qual
ifica
tion
War
rant
ies
Dis
pute
s
Del
iver
y m
etho
d
Met
hod
Rev
iew
s/A
naly
sis
Exi
stin
g co
nditi
ons
Qua
lity
Saf
ety/
Hea
lth
Opt
imiz
atio
n
Clim
ate
Usa
ge
Inte
llige
nt
tran
spor
tatio
n sy
stem
s
Aut
omat
ion
Bernstein (1983) � � �
Dallaire (1977) � �
Gransberg & Riemer (2009)
� � �
Konchar & Sanvido (1998)
�
FTA (2003) � � � � � � � �
Molenaar et al. (2000a)
�
FHWA (2009a) � � � � �
Schaufelberger (2000)
�
Abdul-Malak & El-Saadi (2000)
�
Gambatese (2000)
�
Fischer (2000) �
130

Literature
Technical Contract Design Construction Technology
Sco
pe
Inte
rnal
str
uctu
re
Pre
qual
ifica
tion
War
rant
ies
Dis
pute
s
Del
iver
y m
etho
d
Met
hod
Rev
iew
s/A
naly
sis
Exi
stin
g co
nditi
ons
Qua
lity
Saf
ety/
Hea
lth
Opt
imiz
atio
n
Clim
ate
Usa
ge
Inte
llige
nt
tran
spor
tatio
n sy
stem
s
Aut
omat
ion
Molenaar et al. (2000b)
� �
Cho et al. (2009) � �
El-Asmar et al. (2009)
�
Kasi (2007) � � �
Cristobal (2009) � �
McClure et al. (2008)
� �
Miller & Lantz, Jr. (2008)
�
Bohn & Teizer (2009)
� �
Kyte et al. (2004) �
Olszak et al. (2007)
�
Brown & Marston (1999)
� � �
131

Literature
Technical Contract Design Construction Technology
Sco
pe
Inte
rnal
str
uctu
re
Pre
qual
ifica
tion
War
rant
ies
Dis
pute
s
Del
iver
y m
etho
d
Met
hod
Rev
iew
s/A
naly
sis
Exi
stin
g co
nditi
ons
Qua
lity
Saf
ety/
Hea
lth
Opt
imiz
atio
n
Clim
ate
Usa
ge
Inte
llige
nt
tran
spor
tatio
n sy
stem
s
Aut
omat
ion
Pate (2000) � � � � �
Capka (2004) � �
Broadhurst (2004)
� �
Gray & Larson (2008)
�
Gransberg et al. (2006)
� � � �
Schexnayder & Mayo (2003)
� � �
Beard et al. (2001)
� � �
Sorel (2004b) �
Yakowenko (2004)
� �
Gransberg & Windel (2008)
� �
Lopez del Puerto et al. (2008)
�
132

Literature
Technical Contract Design Construction Technology
Sco
pe
Inte
rnal
str
uctu
re
Pre
qual
ifica
tion
War
rant
ies
Dis
pute
s
Del
iver
y m
etho
d
Met
hod
Rev
iew
s/A
naly
sis
Exi
stin
g co
nditi
ons
Qua
lity
Saf
ety/
Hea
lth
Opt
imiz
atio
n
Clim
ate
Usa
ge
Inte
llige
nt
tran
spor
tatio
n sy
stem
s
Aut
omat
ion
Gransberg & Molenaar (2004)
� �
Touran et al. (2009)
�
Trauner Consulting Services (2007)
�
Gransberg et al. (2008)
� � � �
Hertogh et al. (2008)
Mrawira et al. (2002)
� �
Dolson (1999) � � � �
Gransberg & Riemer (2009)
� �
Cheng et al. (2000)
�
Discetti & Lamberti (2009)
�
133

Literature
Technical Contract Design Construction Technology
Sco
pe
Inte
rnal
str
uctu
re
Pre
qual
ifica
tion
War
rant
ies
Dis
pute
s
Del
iver
y m
etho
d
Met
hod
Rev
iew
s/A
naly
sis
Exi
stin
g co
nditi
ons
Qua
lity
Saf
ety/
Hea
lth
Opt
imiz
atio
n
Clim
ate
Usa
ge
Inte
llige
nt
tran
spor
tatio
n sy
stem
s
Aut
omat
ion
Nelson et al. (2009)
�
Sanvido et al. (1992)
�
Chan et al. (2000)
�
Ashley et al. (1987)
� � � �
Levitt (1984) � �
Tatum (1984) �
Booz Allen Hamilton, Inc. (2005)
�
Hamilton & Baker, Jr. (2003)
�
Sangrey et al. (2003)
�
Schneck et al. (2009)
�
Trapani & Beal (1983)
� � � �
134
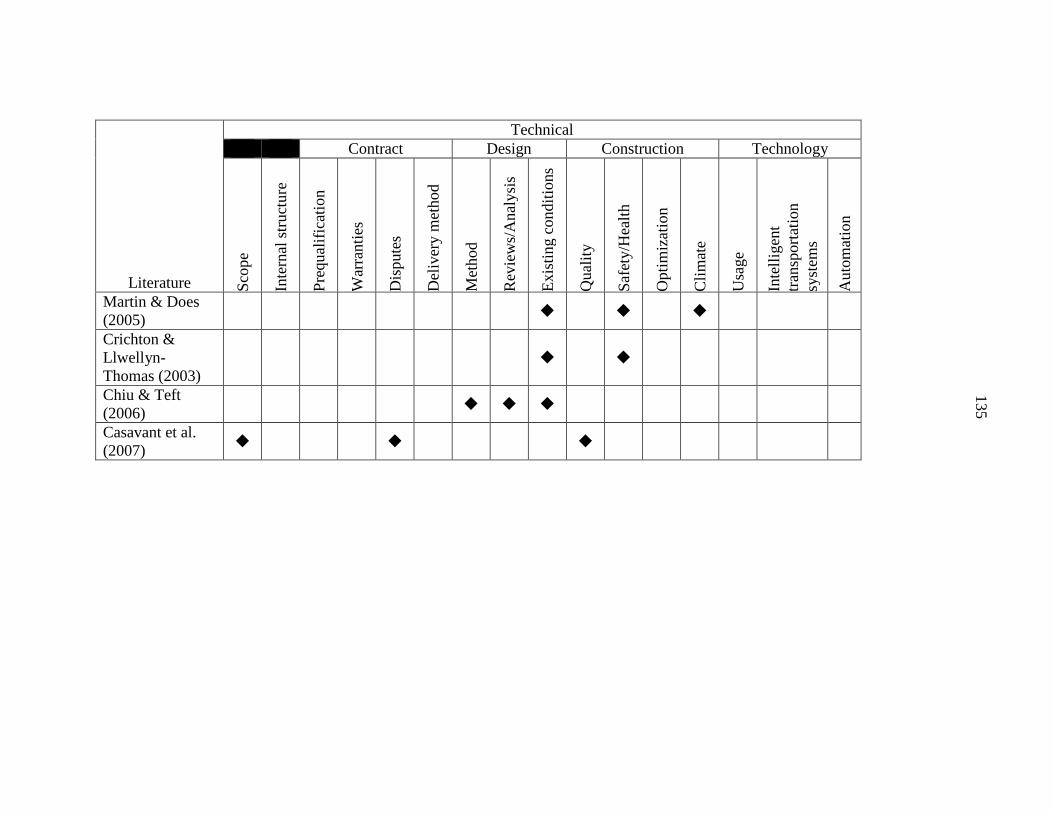
Literature
Technical Contract Design Construction Technology
Sco
pe
Inte
rnal
str
uctu
re
Pre
qual
ifica
tion
War
rant
ies
Dis
pute
s
Del
iver
y m
etho
d
Met
hod
Rev
iew
s/A
naly
sis
Exi
stin
g co
nditi
ons
Qua
lity
Saf
ety/
Hea
lth
Opt
imiz
atio
n
Clim
ate
Usa
ge
Inte
llige
nt
tran
spor
tatio
n sy
stem
s
Aut
omat
ion
Martin & Does (2005)
� � �
Crichton & Llwellyn-Thomas (2003)
� �
Chiu & Teft (2006)
� � �
Casavant et al. (2007)
� � �
135

Table A.4 – Context Dimension
Literature
Context
Stakeholders Project-Specific Local Issues Environmental Legal/Legislative Global/ National
Unusual conditions
Pu
blic
Po
litic
ians
Ow
ne
r
Juris
dic
tion
s
Mai
ntai
ning
cap
acity
Wo
rk z
one
vis
ual
izat
ion
Inte
rmod
al
So
cia
l eq
uity
De
mog
rap
hics
Pu
blic
se
rvic
es
Land
use
Gro
wth
indu
cem
ent
Land
acq
uisi
tion
Eco
nom
ics
Ma
rke
ting
Cul
tura
l
Wo
rkfo
rce
Util
itie
s
Re
sou
rce
ava
ilab
ility
Su
sta
inab
ility
Lim
itatio
ns
Pro
cedu
ral l
aw
Loca
l acc
eptanc
e
Eco
nom
ics
Inci
den
ts
We
ath
er
Fo
rce
maj
eure
Bernstein (1983) � � � � � �
FTA (2003) � � � � �
Molenaar et al. (2000a) � � � �
FHWA (2009a) � �
El-Assaly & Ellis (2000)
�
Edwards et al. (2009)
� � � �
GAO (2008) � � � �
Miller & Lantz, Jr. (2008)
� �
Olszak et al. (2007) � �
Brown & Marston (1999)
� � � �
Lee et al. (2002) � �
136

Literature
Context
Stakeholders Project-Specific Local Issues Environmental Legal/Legislative Global/ National
Unusual conditions
Pu
blic
Po
litic
ians
Ow
ne
r
Juris
dic
tion
s
Mai
ntai
ning
cap
acity
Wo
rk z
one
vis
ual
izat
ion
Inte
rmod
al
So
cia
l eq
uity
De
mog
rap
hics
Pu
blic
se
rvic
es
Land
use
Gro
wth
indu
cem
ent
Land
acq
uisi
tion
Eco
nom
ics
Ma
rke
ting
Cul
tura
l
Wo
rkfo
rce
Util
itie
s
Re
sou
rce
ava
ilab
ility
Su
sta
inab
ility
Lim
itatio
ns
Pro
cedu
ral l
aw
Loca
l acc
eptanc
e
Eco
nom
ics
Inci
den
ts
We
ath
er
Fo
rce
maj
eure
Lee et al. (2000) � �
Pate (2000) � � �
Capka (2004) � � �
Broadhurst (2004) � � � � � �
Gray & Larson (2008)
� � �
Sorel (2004a) � � � � � � �
Gransberg & Molenaar (2008)
� �
Hertogh et al. (2008)
� � � � � � � � � � �
Discetti & Lamberti (2009)
� � � �
Miller et al. (2000) �
Davies and Binsted (2007)
� � �
McLeod (1996) �
137

Literature
Context
Stakeholders Project-Specific Local Issues Environmental Legal/Legislative Global/ National
Unusual conditions
Pu
blic
Po
litic
ians
Ow
ne
r
Juris
dic
tion
s
Mai
ntai
ning
cap
acity
Wo
rk z
one
vis
ual
izat
ion
Inte
rmod
al
So
cia
l eq
uity
De
mog
rap
hics
Pu
blic
se
rvic
es
Land
use
Gro
wth
indu
cem
ent
Land
acq
uisi
tion
Eco
nom
ics
Ma
rke
ting
Cul
tura
l
Wo
rkfo
rce
Util
itie
s
Re
sou
rce
ava
ilab
ility
Su
sta
inab
ility
Lim
itatio
ns
Pro
cedu
ral l
aw
Loca
l acc
eptanc
e
Eco
nom
ics
Inci
den
ts
We
ath
er
Fo
rce
maj
eure
Chou et al. (2009) �
Kraus et al. (2008) �
Ashley et al. (1987) � �
Booz Allen Hamilton, Inc. (2005)
� � � �
Hamilton & Baker, Jr. (2003)
�
Trapani & Beal (1983)
� � �
TransTech Management Inc. et al. (2004)
� � � �
TAC (2009) � � � � � � �
Martin & Does (2005)
� � � � � �
Crichton & Llewellyn-Thomas (2003)
� � � � � � � �
Barnes & Langworthy (2004)
� � � � �
138

Literature
Context
Stakeholders Project-Specific Local Issues Environmental Legal/Legislative Global/ National
Unusual conditions
Pu
blic
Po
litic
ians
Ow
ne
r
Juris
dic
tion
s
Mai
ntai
ning
cap
acity
Wo
rk z
one
vis
ual
izat
ion
Inte
rmod
al
So
cia
l eq
uity
De
mog
rap
hics
Pu
blic
se
rvic
es
Land
use
Gro
wth
indu
cem
ent
Land
acq
uisi
tion
Eco
nom
ics
Ma
rke
ting
Cul
tura
l
Wo
rkfo
rce
Util
itie
s
Re
sou
rce
ava
ilab
ility
Su
sta
inab
ility
Lim
itatio
ns
Pro
cedu
ral l
aw
Loca
l acc
eptanc
e
Eco
nom
ics
Inci
den
ts
We
ath
er
Fo
rce
maj
eure
Chiu & Teft (2006) � � � � � �
Casavant et al. (2007)
� � �
139
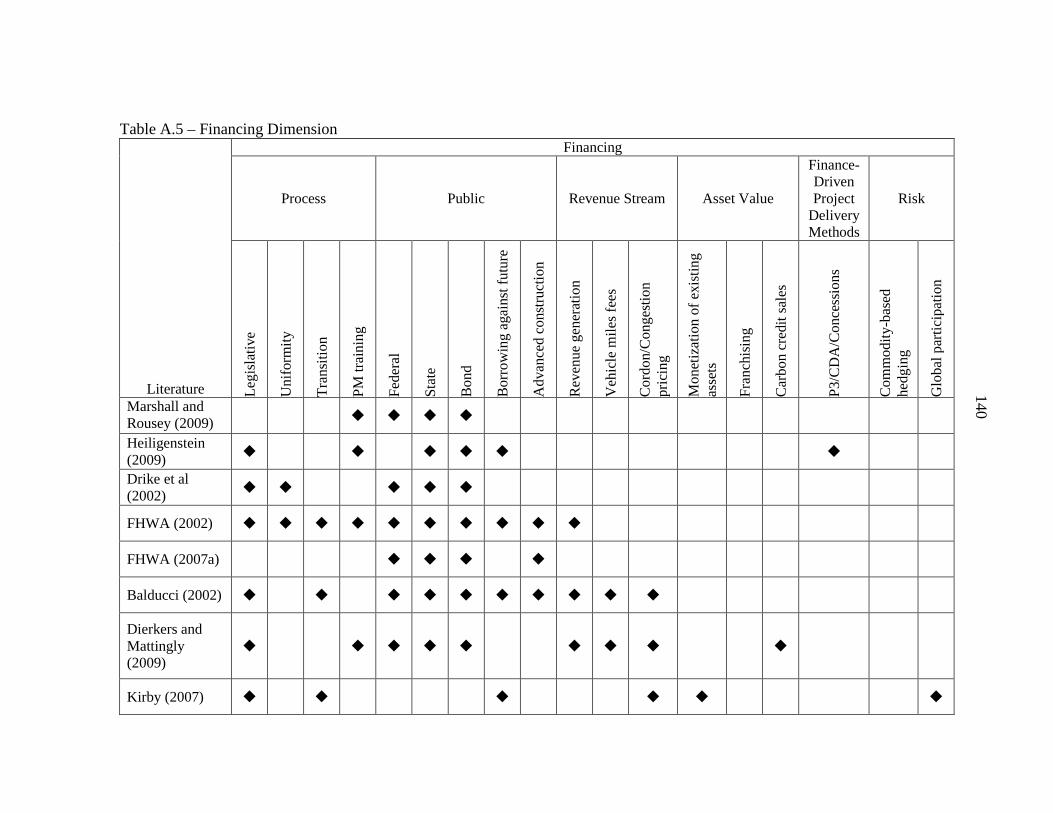
Table A.5 – Financing Dimension
Literature
Financing
Process Public Revenue Stream Asset Value
Finance-Driven Project
Delivery Methods
Risk
Legi
slat
ive
Uni
form
ity
Tra
nsiti
on
PM
trai
ning
Fed
eral
Sta
te
Bon
d
Bor
row
ing
agai
nst f
utur
e
Adv
ance
d co
nstr
uctio
n
Rev
enue
gen
erat
ion
Veh
icle
mile
s fe
es
Cor
don/
Con
gest
ion
pric
ing
Mon
etiz
atio
n of
exi
stin
g as
sets
Fra
nchi
sing
Car
bon
cred
it sa
les
P3/
CD
A/C
once
ssio
ns
Com
mod
ity-b
ased
he
dgin
g
Glo
bal p
artic
ipat
ion
Marshall and Rousey (2009) � � � �
Heiligenstein (2009)
� � � � � �
Drike et al (2002)
� � � � �
FHWA (2002) � � � � � � � � � �
FHWA (2007a) � � � �
Balducci (2002) � � � � � � � � � �
Dierkers and Mattingly (2009)
� � � � � � � � �
Kirby (2007) � � � � � �
140

Literature
Financing
Process Public Revenue Stream Asset Value
Finance-Driven Project
Delivery Methods
Risk
Legi
slat
ive
Uni
form
ity
Tra
nsiti
on
PM
trai
ning
Fed
eral
Sta
te
Bon
d
Bor
row
ing
agai
nst f
utur
e
Adv
ance
d co
nstr
uctio
n
Rev
enue
gen
erat
ion
Veh
icle
mile
s fe
es
Cor
don/
Con
gest
ion
pric
ing
Mon
etiz
atio
n of
exi
stin
g as
sets
Fra
nchi
sing
Car
bon
cred
it sa
les
P3/
CD
A/C
once
ssio
ns
Com
mod
ity-b
ased
he
dgin
g
Glo
bal p
artic
ipat
ion
Orski (1999) � � � � �
MACED (2008) � �
Courteau et al (2007)
� � �
Price (2002) � � � � � � � � � � �
Nichol (2009) � � � � �
Klijn et al (2008) � � � �
Little (2006) � � � � � � � �
Johnston and Gudergan (2007)
� � � �
141

Literature
Financing
Process Public Revenue Stream Asset Value
Finance-Driven Project
Delivery Methods
Risk
Legi
slat
ive
Uni
form
ity
Tra
nsiti
on
PM
trai
ning
Fed
eral
Sta
te
Bon
d
Bor
row
ing
agai
nst f
utur
e
Adv
ance
d co
nstr
uctio
n
Rev
enue
gen
erat
ion
Veh
icle
mile
s fe
es
Cor
don/
Con
gest
ion
pric
ing
Mon
etiz
atio
n of
exi
stin
g as
sets
Fra
nchi
sing
Car
bon
cred
it sa
les
P3/
CD
A/C
once
ssio
ns
Com
mod
ity-b
ased
he
dgin
g
Glo
bal p
artic
ipat
ion
Ortiz and Buxbaum (2008)
� �
Chege and Rwelamila (2001)
� � � � �
Lee (2008) � � � � � � � �
Gokan (2002) � � � � �
Smith (1983) � � � � �
Persad et al (2008)
� � � � � � �
Harder (2009) � � � � � � �
142
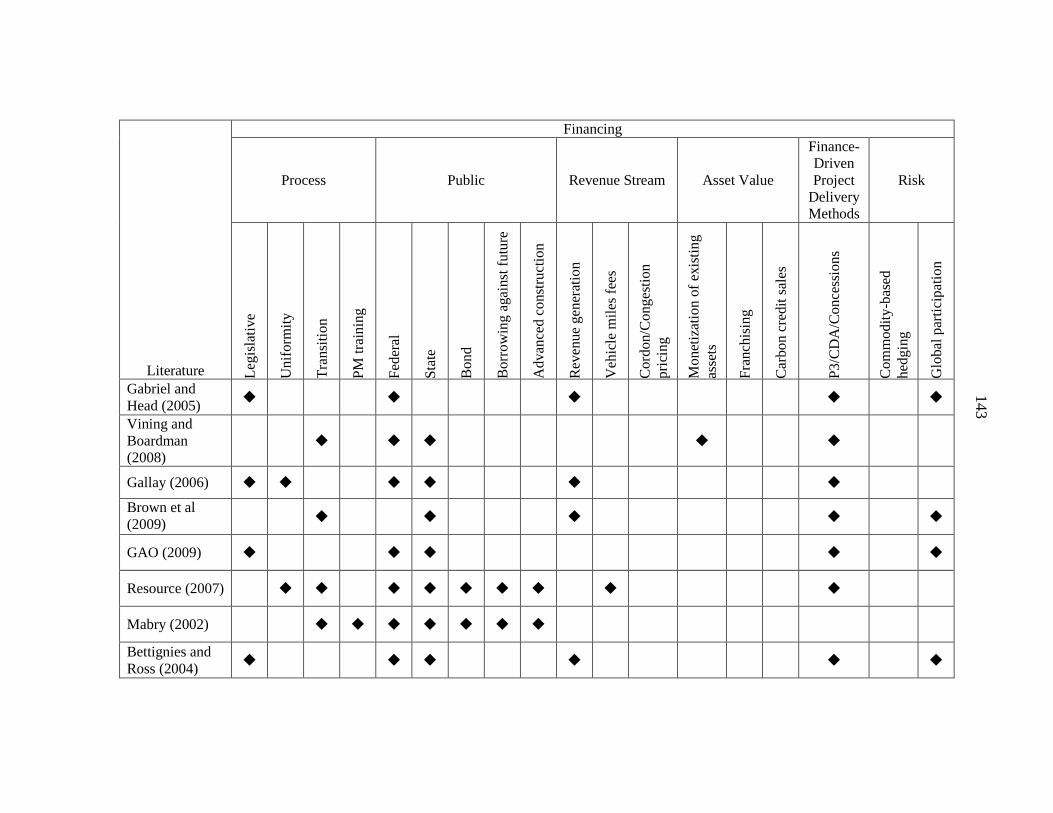
Literature
Financing
Process Public Revenue Stream Asset Value
Finance-Driven Project
Delivery Methods
Risk
Legi
slat
ive
Uni
form
ity
Tra
nsiti
on
PM
trai
ning
Fed
eral
Sta
te
Bon
d
Bor
row
ing
agai
nst f
utur
e
Adv
ance
d co
nstr
uctio
n
Rev
enue
gen
erat
ion
Veh
icle
mile
s fe
es
Cor
don/
Con
gest
ion
pric
ing
Mon
etiz
atio
n of
exi
stin
g as
sets
Fra
nchi
sing
Car
bon
cred
it sa
les
P3/
CD
A/C
once
ssio
ns
Com
mod
ity-b
ased
he
dgin
g
Glo
bal p
artic
ipat
ion
Gabriel and Head (2005)
� � � � �
Vining and Boardman (2008)
� � � � �
Gallay (2006) � � � � � �
Brown et al (2009) � � � � �
GAO (2009) � � � � �
Resource (2007) � � � � � � � � �
Mabry (2002) � � � � � � �
Bettignies and Ross (2004)
� � � � � �
143

Literature
Financing
Process Public Revenue Stream Asset Value
Finance-Driven Project
Delivery Methods
Risk
Legi
slat
ive
Uni
form
ity
Tra
nsiti
on
PM
trai
ning
Fed
eral
Sta
te
Bon
d
Bor
row
ing
agai
nst f
utur
e
Adv
ance
d co
nstr
uctio
n
Rev
enue
gen
erat
ion
Veh
icle
mile
s fe
es
Cor
don/
Con
gest
ion
pric
ing
Mon
etiz
atio
n of
exi
stin
g as
sets
Fra
nchi
sing
Car
bon
cred
it sa
les
P3/
CD
A/C
once
ssio
ns
Com
mod
ity-b
ased
he
dgin
g
Glo
bal p
artic
ipat
ion
Morallos and Amekudzi (2008)
� � � � �
Mathur and van Aalst (2009) � � � � � � � �
Henkin (2009) � � � � � � � � �
Whitty (2007) �
144

145
Appendix B
146
Complex Transportation Projects Questionnaire
Project Name: ________________________________________
Project Role: _________________________________________
How many years of experience do you have in construction related fields? _____________
Approximately, how many projects have you worked on? ____________
The purpose of this questionnaire is to analyze complex transportation projects based on five dimensions of complexity. Each dimension is organized into categories which include specific factors that have the potential to be sources of complexity on the project. The intent of the questionnaire is to analyze the projects on which dimensions are contributing the most to the complexity and require the majority of the focus by the planning departments and project managers throughout all phases of the project. A summary of each dimension as it is used for this questionnaire is presented below:
Cost Dimension
The cost dimension essentially quantifies the scope of the project in dollar terms. This dimension focuses on factors that affect cost growth, control, risk, issues, and management decisions made for planning around these sources of complexity during the preliminary stages and throughout the construction of the project.
Schedule Dimension
The project schedule is associated closely with the cost dimension. This dimension is affected by, and directly affects the cost of the overall project depending on the management and decision making during the venture. The schedule dimension is comprised of the overall time/deadline, risk, milestones, control, and problems associated with managing and planning for issues that arise before and during construction. The advent of new technology is also included as it pertains to affecting the management of the project schedule.
Technical Dimension
The other common project management area typically identified as crucial to project success is the technical dimension. The technical aspects of the project include all of the typical engineering requirements. Issues identified for this dimension include design requirements, scope of the project, quality of construction, and the organizational structure of the owner undertaking the project. This area also includes items such as contract language and structure, and the implementation of new technology for effective management of the project.
Context Dimension
The context dimension refers to all of the external factors that have an impact on the project and can be some of the most difficult to predict and plan for before and during construction.

147
Context includes stakeholders, environmental issues, legal and legislative requirements, local issues, and project specific factors.
Financing Dimension
It is no longer sufficient to merely know a project’s cost. The owner must know how it will be paid for and integrate that knowledge into the project’s scope of work. The mechanics of the financing can have a direct impact on the project’s design, the speed with which it can be delivered, and the ability to achieve contextual requirements. Each dimension within the questionnaire is organized by categories, with factors and their definitions presented below each category. Please rate each category based on its affect on the complexity of the project and the amount of complexity compared to other projects that you have worked on. While ranking each category, consider past experience and background of other projects that you been a part of when comparing the amount of complexity for the categories of the project studied for this questionnaire. After ranking each category, please score the overall dimension as it pertains to the complexity of the overall project at the end of each section. Again, consider all phases of the project and the other dimensions when scoring the complexity caused by a particular dimension.
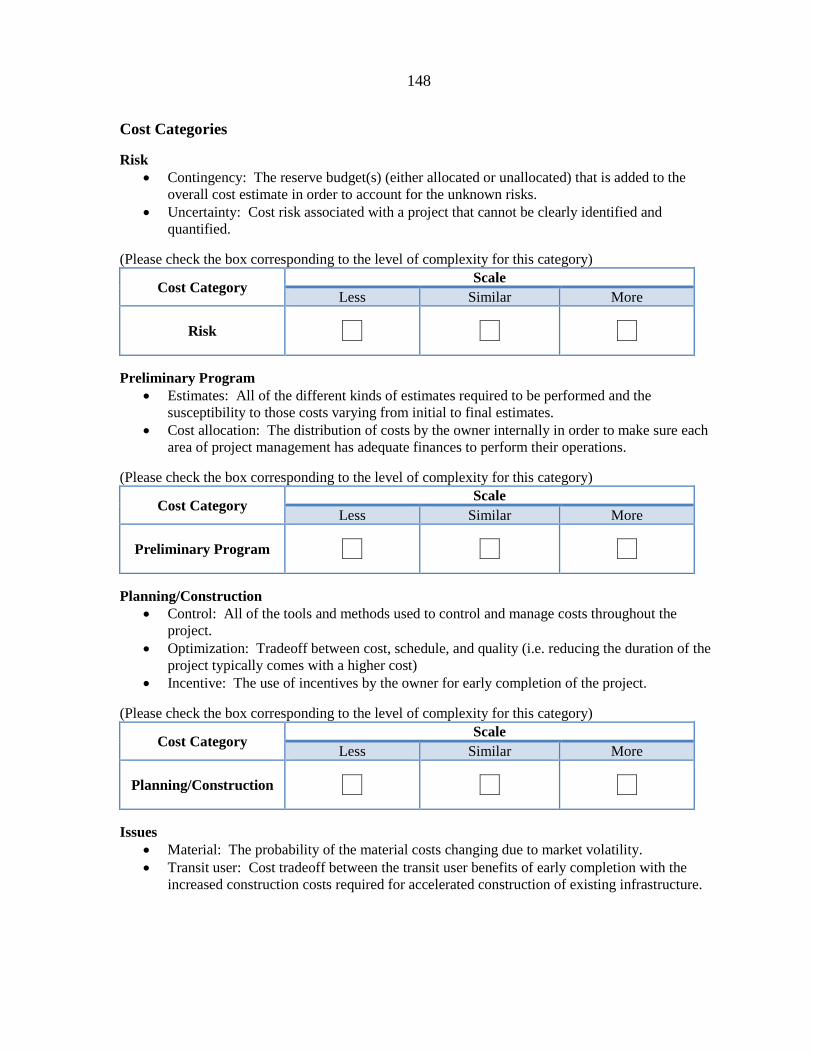
148
Cost Categories
Risk • Contingency: The reserve budget(s) (either allocated or unallocated) that is added to the
overall cost estimate in order to account for the unknown risks. • Uncertainty: Cost risk associated with a project that cannot be clearly identified and
quantified.
(Please check the box corresponding to the level of complexity for this category)
Cost Category Scale
Less Similar More
Risk
Preliminary Program • Estimates: All of the different kinds of estimates required to be performed and the
susceptibility to those costs varying from initial to final estimates. • Cost allocation: The distribution of costs by the owner internally in order to make sure each
area of project management has adequate finances to perform their operations.
(Please check the box corresponding to the level of complexity for this category)
Cost Category Scale
Less Similar More
Preliminary Program
Planning/Construction • Control: All of the tools and methods used to control and manage costs throughout the
project. • Optimization: Tradeoff between cost, schedule, and quality (i.e. reducing the duration of the
project typically comes with a higher cost) • Incentive: The use of incentives by the owner for early completion of the project.
(Please check the box corresponding to the level of complexity for this category)
Cost Category Scale
Less Similar More
Planning/Construction
Issues • Material: The probability of the material costs changing due to market volatility. • Transit user: Cost tradeoff between the transit user benefits of early completion with the
increased construction costs required for accelerated construction of existing infrastructure.

149
(Please check the box corresponding to the level of complexity for this category)
Cost Category Scale
Less Similar More
Issues
Level of Complexity (Please indicate on the line with an “x” the score of the overall complexity for the project based on the cost dimension)
Dimension Scale
Minimal Average High
Cost 10 25 40 55 70 85 100
List any other sources of cost complexity not discussed above:
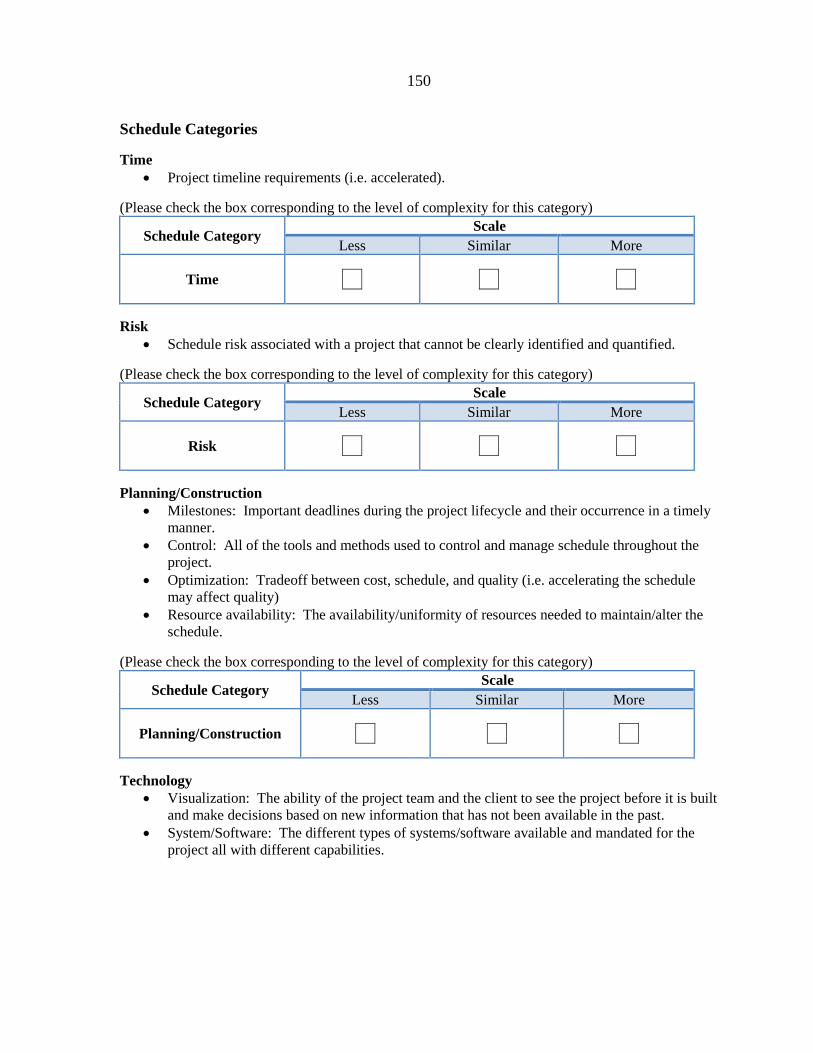
150
Schedule Categories
Time • Project timeline requirements (i.e. accelerated).
(Please check the box corresponding to the level of complexity for this category)
Schedule Category Scale
Less Similar More
Time
Risk • Schedule risk associated with a project that cannot be clearly identified and quantified.
(Please check the box corresponding to the level of complexity for this category)
Schedule Category Scale
Less Similar More
Risk
Planning/Construction • Milestones: Important deadlines during the project lifecycle and their occurrence in a timely
manner. • Control: All of the tools and methods used to control and manage schedule throughout the
project. • Optimization: Tradeoff between cost, schedule, and quality (i.e. accelerating the schedule
may affect quality) • Resource availability: The availability/uniformity of resources needed to maintain/alter the
schedule.
(Please check the box corresponding to the level of complexity for this category)
Schedule Category Scale
Less Similar More
Planning/Construction
Technology • Visualization: The ability of the project team and the client to see the project before it is built
and make decisions based on new information that has not been available in the past. • System/Software: The different types of systems/software available and mandated for the
project all with different capabilities.

151
(Please check the box corresponding to the level of complexity for this category)
Schedule Category Scale
Less Similar More
Technology
Level of Complexity (Please indicate on the line with an “x” the score of the overall complexity for the project based on the schedule dimension)
Dimension Scale
Minimal Average High
Schedule 10 25 40 55 70 85 100
List any other sources of schedule complexity not discussed above:
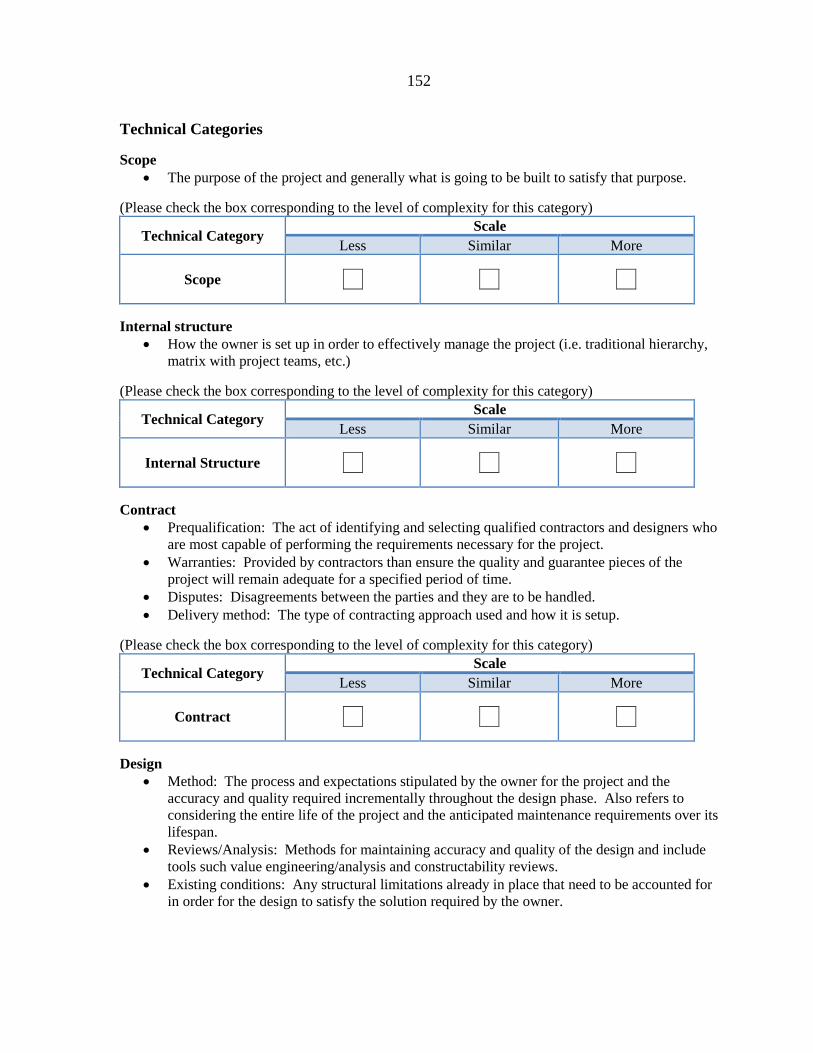
152
Technical Categories
Scope • The purpose of the project and generally what is going to be built to satisfy that purpose.
(Please check the box corresponding to the level of complexity for this category)
Technical Category Scale
Less Similar More
Scope
Internal structure • How the owner is set up in order to effectively manage the project (i.e. traditional hierarchy,
matrix with project teams, etc.)
(Please check the box corresponding to the level of complexity for this category)
Technical Category Scale
Less Similar More
Internal Structure
Contract • Prequalification: The act of identifying and selecting qualified contractors and designers who
are most capable of performing the requirements necessary for the project. • Warranties: Provided by contractors than ensure the quality and guarantee pieces of the
project will remain adequate for a specified period of time. • Disputes: Disagreements between the parties and they are to be handled. • Delivery method: The type of contracting approach used and how it is setup.
(Please check the box corresponding to the level of complexity for this category)
Technical Category Scale
Less Similar More
Contract
Design • Method: The process and expectations stipulated by the owner for the project and the
accuracy and quality required incrementally throughout the design phase. Also refers to considering the entire life of the project and the anticipated maintenance requirements over its lifespan.
• Reviews/Analysis: Methods for maintaining accuracy and quality of the design and include tools such value engineering/analysis and constructability reviews.
• Existing conditions: Any structural limitations already in place that need to be accounted for in order for the design to satisfy the solution required by the owner.

153
(Please check the box corresponding to the level of complexity for this category)
Technical Category Scale
Less Similar More
Design
Construction • Quality: The value of the work that is being put in place by the contractors. • Safety/Health: Maintaining a workplace where workers feel comfortable by all parties. • Optimization: Tradeoff between cost, schedule, and quality (i.e. increasing quality
requirements may increase costs). • Climate: The typical climate where the project is and the construction limitations presented
by the area’s typical climatic conditions.
(Please check the box corresponding to the level of complexity for this category)
Technical Category Scale
Less Similar More
Construction
Technology • Usage: The technology specified to be used for the project for project communications such
as specific project management software, building information modeling and others. • Intelligent transportation systems (ITS): Smart traffic systems for transportation projects for
which the use needs to be analyzed as to their implementation into the project. • Automation: The use of automated or robotic equipment for construction.
(Please check the box corresponding to the level of complexity for this category)
Technical Category Scale
Less Similar More
Technology
Level of Complexity (Please indicate on the line with an “x” the score of the overall complexity for the project based on the technical dimension)
Dimension Scale
Minimal Average High
Technical 10 25 40 55 70 85 100
List any other sources of technical complexity not discussed above:
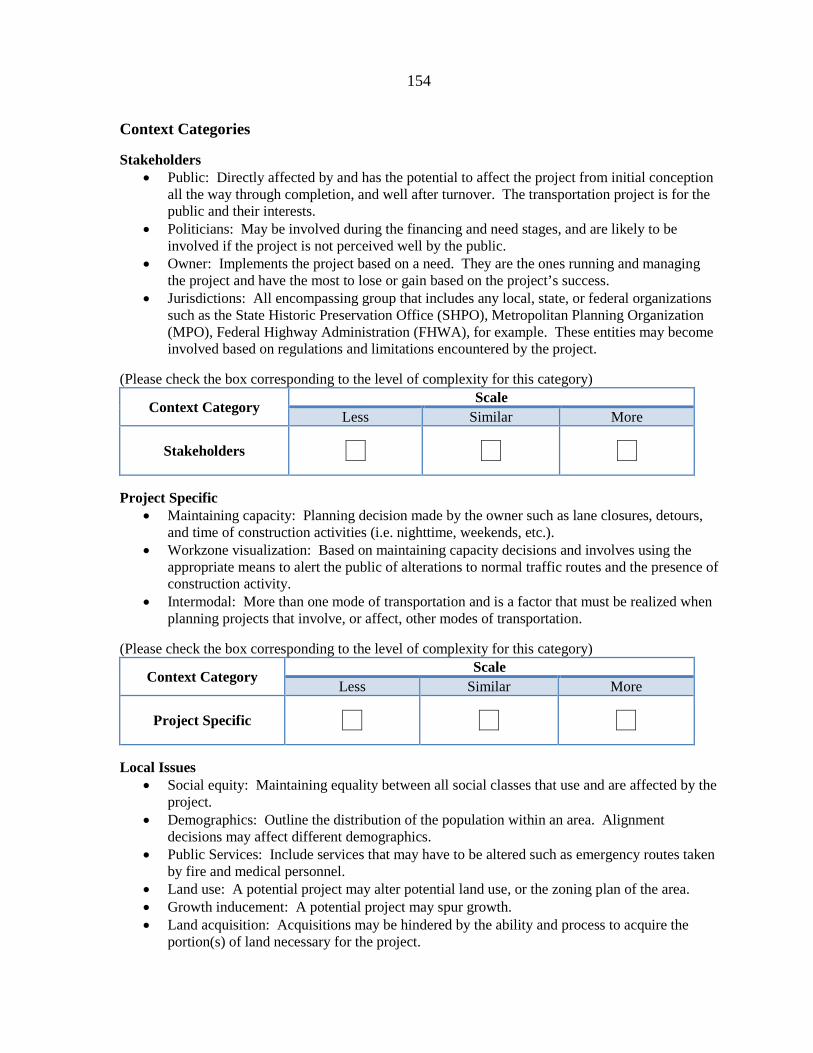
154
Context Categories
Stakeholders • Public: Directly affected by and has the potential to affect the project from initial conception
all the way through completion, and well after turnover. The transportation project is for the public and their interests.
• Politicians: May be involved during the financing and need stages, and are likely to be involved if the project is not perceived well by the public.
• Owner: Implements the project based on a need. They are the ones running and managing the project and have the most to lose or gain based on the project’s success.
• Jurisdictions: All encompassing group that includes any local, state, or federal organizations such as the State Historic Preservation Office (SHPO), Metropolitan Planning Organization (MPO), Federal Highway Administration (FHWA), for example. These entities may become involved based on regulations and limitations encountered by the project.
(Please check the box corresponding to the level of complexity for this category)
Context Category Scale
Less Similar More
Stakeholders
Project Specific • Maintaining capacity: Planning decision made by the owner such as lane closures, detours,
and time of construction activities (i.e. nighttime, weekends, etc.). • Workzone visualization: Based on maintaining capacity decisions and involves using the
appropriate means to alert the public of alterations to normal traffic routes and the presence of construction activity.
• Intermodal: More than one mode of transportation and is a factor that must be realized when planning projects that involve, or affect, other modes of transportation.
(Please check the box corresponding to the level of complexity for this category)
Context Category Scale
Less Similar More
Project Specific
Local Issues • Social equity: Maintaining equality between all social classes that use and are affected by the
project. • Demographics: Outline the distribution of the population within an area. Alignment
decisions may affect different demographics. • Public Services: Include services that may have to be altered such as emergency routes taken
by fire and medical personnel. • Land use: A potential project may alter potential land use, or the zoning plan of the area. • Growth inducement: A potential project may spur growth. • Land acquisition: Acquisitions may be hindered by the ability and process to acquire the
portion(s) of land necessary for the project.

155
• Economics: Influenced by growth inducement, alterations to land use, the rerouting of traffic away from business districts, and the creation of jobs from the project directly or indirectly.
• Marketing: Notification of the public of the project and its progress, particularly those matters directly impacting the public.
• Cultural: The culture(s) of the area and the possible impact on the project. • Workforce: The skill and ability of the workers and the amount of qualified entities that can
fulfill the project requirements. • Utilities: All of the services necessary which may need to be moved and coordinated (i.e.
electricity, gas, etc.).
(Please check the box corresponding to the level of complexity for this category)
Context Category Scale
Less Similar More
Local Issues
Resource Availability • Availability of materials, labor, and equipment due to external factors (not because of cost,
but scarcity)
(Please check the box corresponding to the level of complexity for this category)
Context Category Scale
Less Similar More
Resource Availability
Environmental • Sustainability: Materials or requirements to use environmentally-friendly construction
materials or desires by the owner to use alternative materials or methods. • Limitations: The type of environmental study that is necessary for the project, or any site
specific factors affecting the design and construction of the venture.
(Please check the box corresponding to the level of complexity for this category)
Context Category Scale
Less Similar More
Environmental
Legal/Legislative • Procedural law: The legal channels and limitations that should be followed for
implementation of a transportation project such as permitting, zoning, and land acquisition. Procedural law is also the ability of an owner to use alternative delivery methods designated by law such as Design-Build or Construction Manager at Risk.
• Local acceptance: The ability, experience, or willingness to use different delivery options if procedural law does not restrict the method by the local parties that are likely to be involved with the project.
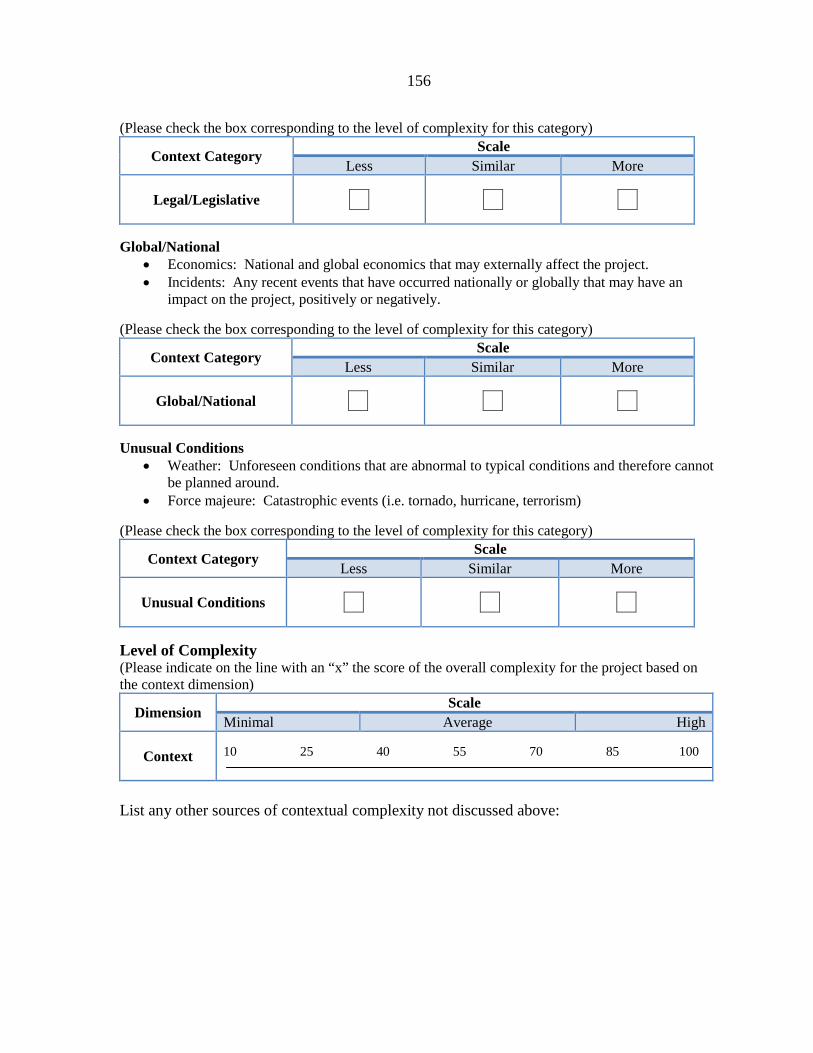
156
(Please check the box corresponding to the level of complexity for this category)
Context Category Scale
Less Similar More
Legal/Legislative
Global/National • Economics: National and global economics that may externally affect the project. • Incidents: Any recent events that have occurred nationally or globally that may have an
impact on the project, positively or negatively.
(Please check the box corresponding to the level of complexity for this category)
Context Category Scale
Less Similar More
Global/National
Unusual Conditions • Weather: Unforeseen conditions that are abnormal to typical conditions and therefore cannot
be planned around. • Force majeure: Catastrophic events (i.e. tornado, hurricane, terrorism)
(Please check the box corresponding to the level of complexity for this category)
Context Category Scale
Less Similar More
Unusual Conditions
Level of Complexity (Please indicate on the line with an “x” the score of the overall complexity for the project based on the context dimension)
Dimension Scale
Minimal Average High
Context 10 25 40 55 70 85 100
List any other sources of contextual complexity not discussed above:

157
Financing Categories
Process • Legislative: The legal limitations placed on financing methods. • Uniformity: The consistency seen between states regarding legislation and financing
techniques. • Transition: The financing of complex projects compared to traditional project financing and
the shift in financial planning. • Project manager (PM) training: The education necessary of project managers for
understanding financial methods.
(Please check the box corresponding to the level of complexity for this category)
Financing Category Scale
Less Similar More
Process
Public • Federal: Provided by the national government and is standard across the nation and is derived
from the annual transportation bill. • State: Independently financed through the particular state that the project is taking place. • Bond: The floating of bonds that public and private entities may invest in to earn a return on
investment on the project. • Borrowing against future funding: Methods that allow the owner to borrow against future
federal funding in order to undertake current projects. • Advance construction: Similar to borrowing against future funding, but it allows states to
independently raise the initial capital for a federally approved project and preserve their eligibility for future federal-aid reimbursement.
(Please check the box corresponding to the level of complexity for this category)
Financing Category Scale
Less Similar More
Public
Revenue Stream • Revenue generation: Any type of financing that is paid for by a generation of revenue from
the infrastructure over a specified period of time. • Vehicle miles traveled fees: User fees that charge the driver a specific cost for using the
infrastructure. • Cordon/Congestion pricing: Reorienting traffic demand to less congested areas and city
centers. Entering the more congested areas during certain hours requires some type of payment.

158
(Please check the box corresponding to the level of complexity for this category)
Financing Category Scale
Less Similar More
Revenue Stream
Asset Value • Monetization of existing assets: An existing road or bridge will be brought up to some
standard of quality and then private entities are invited to take it over for a concession period, derive revenue from it, and then return it to the original standard before turning it over to the agency or another concessionaire.
• Franchising: When private companies are offered the opportunity build and operate income producing facilities such as rest areas or fuel stations on the public right-of-way in return for a portion of the profits.
• Carbon credit sales: The carbon stored by trees and plants has a market value and the credits can be sold in order to help finance the project.
(Please check the box corresponding to the level of complexity for this category)
Financing Category Scale
Less Similar More
Asset Value
Finance-Driven Project Delivery Methods • Public-Private Partnerships (P3)/Comprehensive Development Agreements/Concessions:
Requires both public and private financing. The overall purpose for this category is to gain public access to private capital and create a situation where the developers’ capital is able to bridge the funding gap in a much needed piece of infrastructure and thus accelerate the delivery of its service to the traveling public.
(Please check the box corresponding to the level of complexity for this category)
Financing Category Scale
Less Similar More
Finance-Driven Project Delivery Methods
Risk • Commodity-based hedging: The ability to lock in the material price at the earliest point where
the required quantity is known. • Global participation: The ability to take advantage of different procurement and capital
project delivery cultures around the world. Each nation has its own set of business practices which create competition for financing of transportation projects.
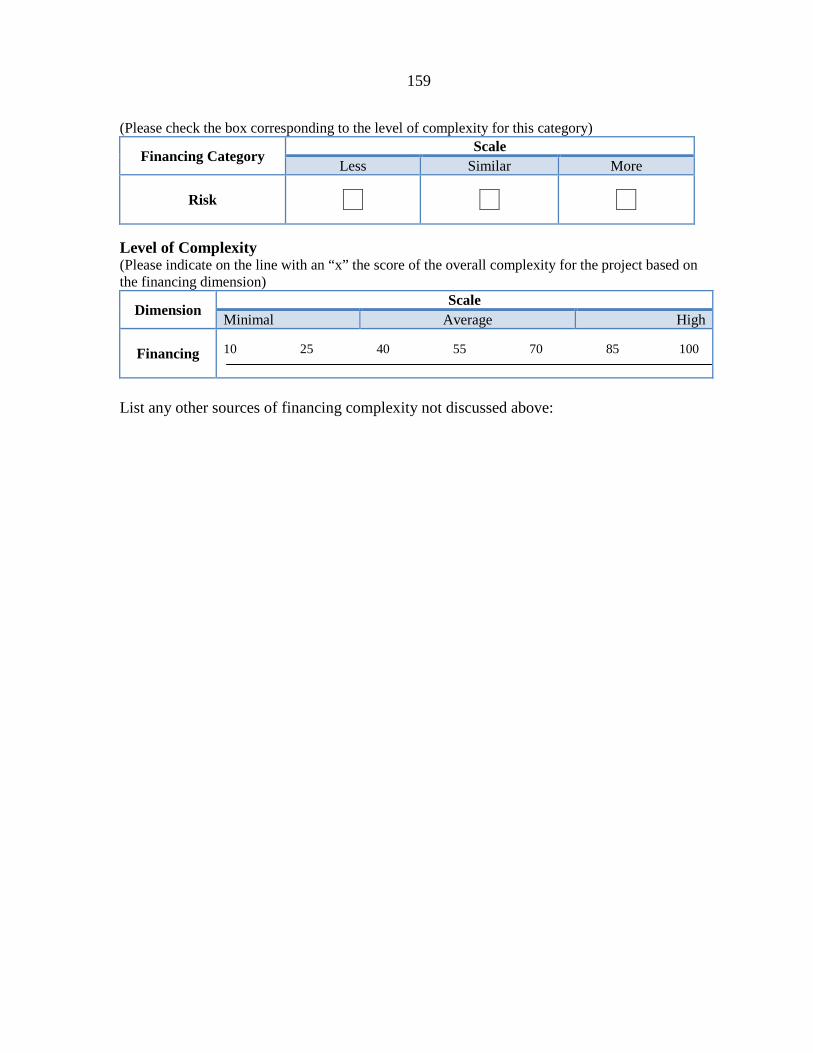
159
(Please check the box corresponding to the level of complexity for this category)
Financing Category Scale
Less Similar More
Risk
Level of Complexity (Please indicate on the line with an “x” the score of the overall complexity for the project based on the financing dimension)
Dimension Scale
Minimal Average High
Financing 10 25 40 55 70 85 100
List any other sources of financing complexity not discussed above:

160
Summary
Based on the results from the scoring, please copy the scores from the dimensions above.
Dimension Scale
Minimal Average High
Cost 10 25 40 55 70 85 100
Schedule 10 25 40 55 70 85 100
Technical 10 25 40 55 70 85 100
Context 10 25 40 55 70 85 100
Financing 10 25 40 55 70 85 100
Yes No Based on your overall concept of the project, are these scores consistent with your overall perception of the complexity for this project?
Yes No The notes/results of the interview will be compiled and sent within 2 days. Are you willing to verify that they are correct within one week of reception?
Comments/Questions:

161
Interview Structure
General Note: Whether the interview is face-to-face or over the phone, while walking
through the questionnaire, the interviewer should take notes about the project and record the
checkbox/score results.
1. Greet the person and thank them for participating in the project 2. Discuss the project and the purpose
a. Identify the areas of the project that have the potential to be problematic for effective project management throughout the project, from planning through closeout
b. Map complex projects based on the 5 dimensions and be able to compare different projects and their resource needs
3. Verify the project that is going to be discussed a. Ask any background questions that may be lacking from the case research b. Fill out the project name and their project role c. Fill out their years of experience and the approximate number of projects that
they have worked on 4. Have the interviewee read the introduction (pgs. 1-2) and answer any questions they
may have 5. Verify that the interviewee understands that when comparing the categories they are
to base it on other projects that they have worked on in their career 6. Verify that the interviewee understands that when scoring the dimensions they are to
consider the other dimensions (i.e. context was much more complex than financing so it should be scored that way, context would ultimately require more resources to manage)
7. Verify that the interviewee considers the sources of complexity throughout all phases of the project (i.e. “they weren’t complex because they were managed well”)
8. Walk through the entire questionnaire, pointing out each dimension and explaining how each one is organized into categories with factors that could affect the complexity of the project, the factors are organized by project stage and/or similarity
a. Point out that each factor has a definition for it, most of which the interviewee should be familiar with
b. Discuss the less, similar, more comparison and how it serves to spark the discussion of each category and serves as a tool for scoring the overall dimension at the end of each section
c. State that it is okay if one dimension or another are not that complex, the point is to determine which dimension(s) are and subsequently require the most management
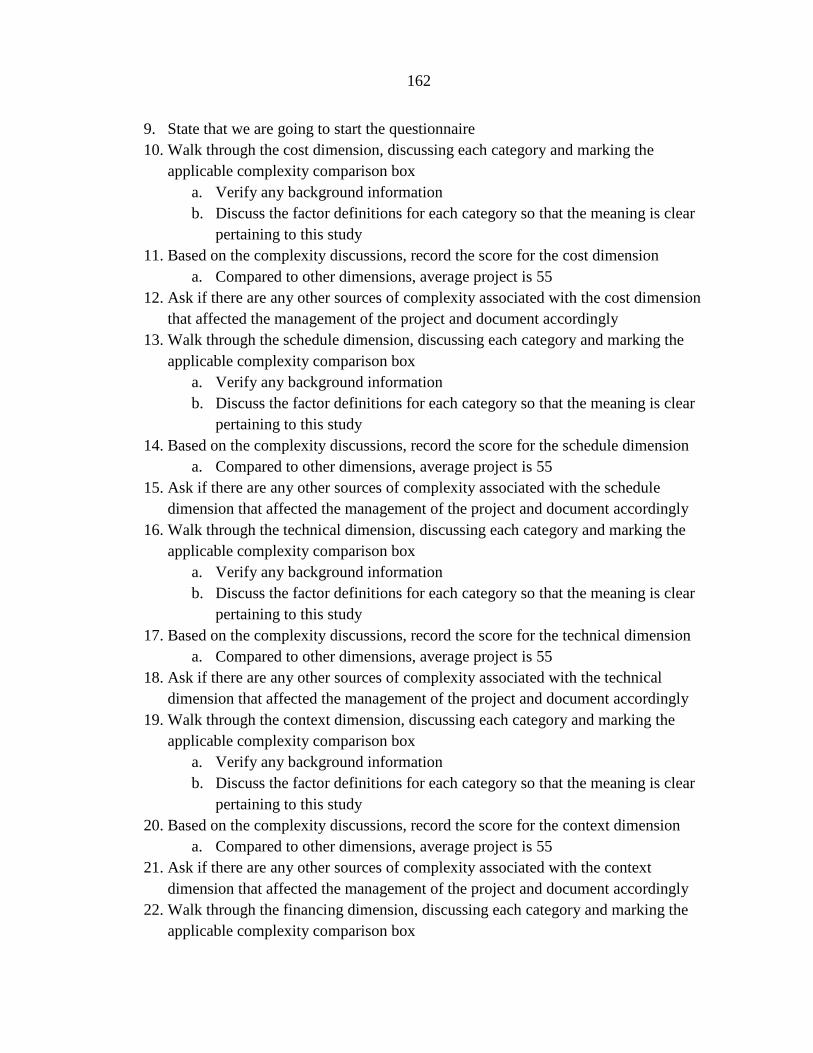
162
9. State that we are going to start the questionnaire 10. Walk through the cost dimension, discussing each category and marking the
applicable complexity comparison box a. Verify any background information b. Discuss the factor definitions for each category so that the meaning is clear
pertaining to this study 11. Based on the complexity discussions, record the score for the cost dimension
a. Compared to other dimensions, average project is 55 12. Ask if there are any other sources of complexity associated with the cost dimension
that affected the management of the project and document accordingly 13. Walk through the schedule dimension, discussing each category and marking the
applicable complexity comparison box a. Verify any background information b. Discuss the factor definitions for each category so that the meaning is clear
pertaining to this study 14. Based on the complexity discussions, record the score for the schedule dimension
a. Compared to other dimensions, average project is 55 15. Ask if there are any other sources of complexity associated with the schedule
dimension that affected the management of the project and document accordingly 16. Walk through the technical dimension, discussing each category and marking the
applicable complexity comparison box a. Verify any background information b. Discuss the factor definitions for each category so that the meaning is clear
pertaining to this study 17. Based on the complexity discussions, record the score for the technical dimension
a. Compared to other dimensions, average project is 55 18. Ask if there are any other sources of complexity associated with the technical
dimension that affected the management of the project and document accordingly 19. Walk through the context dimension, discussing each category and marking the
applicable complexity comparison box a. Verify any background information b. Discuss the factor definitions for each category so that the meaning is clear
pertaining to this study 20. Based on the complexity discussions, record the score for the context dimension
a. Compared to other dimensions, average project is 55 21. Ask if there are any other sources of complexity associated with the context
dimension that affected the management of the project and document accordingly 22. Walk through the financing dimension, discussing each category and marking the
applicable complexity comparison box

163
a. Verify any background information b. Discuss the factor definitions for each category so that the meaning is clear
pertaining to this study 23. Based on the complexity discussions, record the score for the financing dimension
a. Compared to other dimensions, average project is 55 24. Ask if there are any other sources of complexity associated with the financing
dimension that affected the management of the project and document accordingly 25. Have the interviewee transfer each dimension’s score to the summary table and take a
minute to determine if the overall project reflects the scores provided (i.e. context was more complex than financing) and check the appropriate box for the last question
a. If they do not agree with their scores, go back and discuss the applicable dimension(s)
26. Ask if they have any comments/questions and record them in the last section 27. Inform the interviewee that you will compile their notes/results and send them the
next day, ask them to review the document and let you know if there are any mistakes within a week
28. Thank the person for their time and their participation in the study

164
Appendix C

Figure C.1 – Case Studies Location Map
165