Project GROPE-HapticDisplays for Scientific Visualization · Project GROPE-HapticDisplays for...
9
~ Computer Graphics, Volume 24, Number 4, August 1990 Project GROPE-HapticDisplays for Scientific Visualization Frederick P. Brooks, Jr., Ming Ouh-Young §, James J. Battert, and P. Jerome Kilpatrick* Department of Computer Science University of North Carolina at Chapel Hill Chapel Hill, NC 27599-3175 ABSTRACT We began in 1967 a project to develop a haptic+ display for 6-D force fields of interacting protein molecules. We approached it in four stages: a 2-D system, a 3-D system tested with a simple task, a 6-D system tested with a simple task, and a full 6-D molecular docking system, our initial goal. This paper summarizes the entire project-- the four systems, the evaluation experiments, the results, and our observations. The molecular docking system results are new. Our principal conclusions are: *Haptic display as an augmentation to visual display can improve perception and understanding both of force fields and of world models populated with impenetrable objects, • Whereas man-machine systems can outperform computer-only systems by orders of magnitude on some problems, haptic-aug- merited interactive systems seem to give about a two-fold perform- ance improvement over purely graphical interactive systems. Better technology may give somewhat more, but a ten-fold improvement does not seem to be in the cards. • Chemists using GROPE-Ill can readily reproduce the true docking positions for drugs whose docking is known (but not to them) and can find very good docks for drugs whose true docks are unknown. The present tool promises to yield new chemistry research results; it is being actively used by research chemists. • The most valuable result from using GROPE-Ill for drug docking is probably the radically improved situation awareness that serious users report. Chemists say they have a new understanding of the details of the receptor site and its force fields, and of why a particular drug docks well or poorly. • We see various scientific/education applications for haptic displays but believe entertainment, not scientific visualization, will § Now at AT&T Bell Labs, NJ. E-mail: [email protected] tDeceased. Mr. Batter died before completing his Ph.D. disserta- tion. This paper includes his description, results, and observations on the GROPE-I system and experiments. *Now at IBM Corporation, Austin, TX. +Haptics---Z'pertaining to sensations such as touch, temperature, pressure, etc. mediated by skin, muscle, tendon, or joint." [29]. drive and pace the technology. • The hardware-software system technology we have used is barely adequate, and our experience sets priorities for future develop- ment. • Some unexpected perceptual phenomena were observed. All of these worked for us, not against us. KEYWORDS: haptic, force, tactile, scientific visualization, inter- active graphics, virtual worlds. OR CATEGORIES: 1.3.6 Computer graphics interactive tech- niques. J.3 Biology. 1. INTRODUCTION 1.1 Scientific Visualization Scientific visualization aims to help scientists make discoveries b-y improving their perception of data describing the natural world and of predictions of computer models of the natural world [ 15]. Scien- Permissionto copy withoutfee all or part of this materialis granted provided that the copies are not made or distributedfor direct commercialadvantage,the ACM copyright notice and the title of the publicationand its date appear, and noticeis given that copyingis by permissionof the Associationfor ComputingMachinery.To copy otherwise, or to republish,requiresa fee and/orspecific permission. Figure 1. GROPE-HI hapticdisplaysystemin use. ©1990 ACM-0-89791-344-2/90/008/0177 $00.75 177
Transcript of Project GROPE-HapticDisplays for Scientific Visualization · Project GROPE-HapticDisplays for...
~ Computer Graphics, Volume 24, Number 4, August 1990
Project GROPE-HapticDisplays for Scientific Visualization
Frederick P. Brooks, Jr., Ming Ouh-Young §, James J. Battert, and P. Jerome Kilpatrick*
Department of Computer Science University of North Carolina at Chapel Hill
Chape l Hil l , N C 27599-3175
ABSTRACT
We began in 1967 a project to develop a haptic+ display for 6-D force fields of interacting protein molecules. We approached it in four stages: a 2-D system, a 3-D system tested with a simple task, a 6-D system tested with a simple task, and a full 6-D molecular docking system, our initial goal. This paper summarizes the entire project-- the four systems, the evaluation experiments, the results, and our observations. The molecular docking system results are new.
Our principal conclusions are:
* Haptic display as an augmentation to visual display can improve perception and understanding both of force fields and of world models populated with impenetrable objects,
• Whereas man-machine systems can outperform computer-only systems by orders of magnitude on some problems, haptic-aug- merited interactive systems seem to give about a two-fold perform- ance improvement over purely graphical interactive systems. Better technology may give somewhat more, but a ten-fold improvement does not seem to be in the cards.
• Chemists using GROPE-Ill can readily reproduce the true docking positions for drugs whose docking is known (but not to them) and can find very good docks for drugs whose true docks are unknown. The present tool promises to yield new chemistry research results; it is being actively used by research chemists.
• The most valuable result from using GROPE-Ill for drug docking is probably the radically improved situation awareness that serious users report. Chemists say they have a new understanding of the details of the receptor site and its force fields, and of why a particular drug docks well or poorly.
• We see various scientific/education applications for haptic displays but believe entertainment, not scientific visualization, will
§ Now at AT&T Bell Labs, NJ. E-mail: [email protected]
tDeceased. Mr. Batter died before completing his Ph.D. disserta- tion. This paper includes his description, results, and observations on the GROPE-I system and experiments.
*Now at IBM Corporation, Austin, TX.
+Haptics---Z'pertaining to sensations such as touch, temperature, pressure, etc. mediated by skin, muscle, tendon, or joint." [29].
drive and pace the technology.
• The hardware-software system technology we have used is barely adequate, and our experience sets priorities for future develop- ment.
• Some unexpected perceptual phenomena were observed. All of these worked for us, not against us.
KEYWORDS: haptic, force, tactile, scientific visualization, inter-
active graphics, virtual worlds.
OR CATEGORIES: 1.3.6 Computer graphics interactive tech-
niques. J.3 Biology.
1. INTRODUCTION
1.1 Scientific Visualization
Scientific visualization aims to help scientists make discoveries b-y improving their perception of data describing the natural world and of predictions of computer models of the natural world [ 15]. Scien-
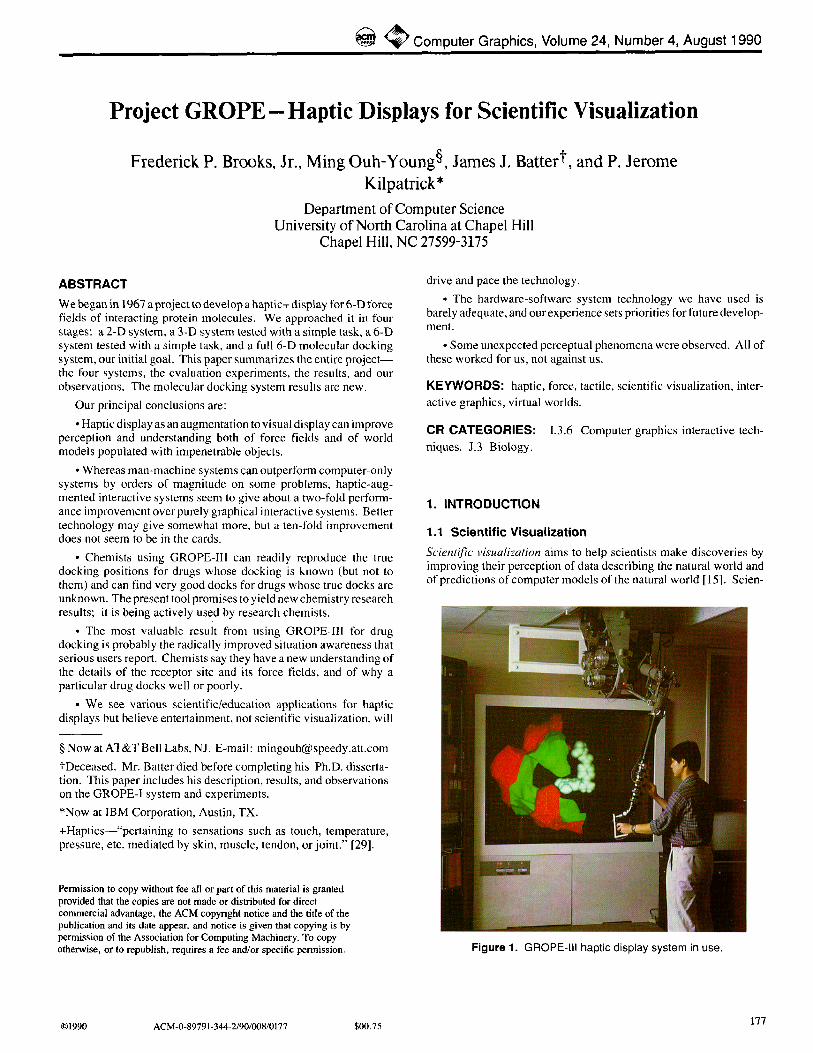
Permission to copy without fee all or part of this material is granted provided that the copies are not made or distributed for direct commercial advantage, the ACM copyright notice and the title of the publication and its date appear, and notice is given that copying is by permission of the Association for Computing Machinery. To copy otherwise, or to republish, requires a fee and/or specific permission. Figure 1. GROPE-HI haptic display system in use.
© 1 9 9 0 ACM-0-89791-344-2/90/008/0177 $00.75 177

@ SIGGRAPH '90, Dallas, August 6-10, 1990
tists can induce generalizations and deduce experimentally testable predictions only as they comprehend and internalize data and the results of model computations. First, manual drawing, then com- puter graphics, and now interactive computer graphics have been the main tools of scientific visualization.
1.2 Can Haptic Displays Help?
We say that scientists grasp new understandings, that they acquire a feel for the behavior of computed models. These very metaphors attest to the power of our haptic senses for understanding the real world. One would expect displays to the haptic senses to enhance our perception of computed worlds. Such force displays have long been used in flight simulators and in teleoperators. Here we report on our testing of haptic displays for scientific visualization (Figure 1).
We know of no other published research on the application of haptic displays to scientific visualization. Richard Feldman of NIH implemented a 6-D Joystring docking device designed by John Staudhammer of the University of Florida. Kent Wilson of UCSD also built a 3-D haptic docking device. Neither seems to have pub- iished evaluations or results.
Margaret Minsky of the MIT Media Lab is developing and evaluating high-performance haptic displays for simulating textures, as her Ph.D. dissertation project [16]. This technology has not yet been applied to a scientific visualization task.
1.3 Project GROPE
Sutherland 's Vision. In 1965 Ivan Sutherland set forth a vision of "The Ultimate Display," a view of a display as a window into a virtual world [25]. This vision, which has provided a research program for interactive computer graphics ever since, included seeing, hearing, and feeling in the virtual world.
UNC Program. Stimulated by this vision, we began a research program in interactive graphics, selected molecular graphics as our principal driving problem, and started in 1967 Project GROPE to develop a haptic display for molecular forces.
Stages. Given the difficulty of this goal, we approached it in stages. For the initial exploration we determined to build a 2-D system for continuous force fields, both radical simplifications. This GROPE- I system was built and tested, and some results published [1].
We then undertook to build a full 6-D system (3 forces, 3 torques), using an existing electrically-coupled remote manipulator and substituting the computer and its world-model for the manipula- tor's slave unit. We providentially encountered Ray Goertz, manipu- lator designer at Argonne National Laboratories, who arranged for us to get a pair of orphaned 6-D-plus-grip master stations for Model E- 3 Argonne Remote Manipulators (ARM's). This ARM has been the transducer for the GROPE-II and GROPE-III systems [8, 5]. It now has its third generation of electronics.
The GROPE-II system used this hardware and represented hard- surface forces but provided only 3 translation degrees of freedom. The computer available, an IBM System/360 Model 75, could produce forces in real time only for a very Simple world model--a table-top, seven child's blocks, and the manipulator tongs. We estimated that 100x more compute power would be necessary for real-time evaluation of molecular forces. Therefore, after building and testing the GROPE-I1 system [13, 3], we mothballed the ARM and waited.
By 1986 our VAXes offered the necessary power, and we began building the GROPE-III system, a full 6-D system [18]. This was tested first in 1988 with a simple world model consisting of a rod hung in space by three springs on each end, a set of experiments we call GROPE-IlIA [19]. We then built a full molecular force-field evaluator and tested it in the GROPE-111B experiments [20].
178
2. HAPTIC DISPLAYS~CHARACTERIZATION
We lump together in the term haptic displays all displays to the haptic senses. Our displays particularly affect the propriopositionat senses (the muscle-mediated sense that tells one where one's limbs are in space) and the pressure sense. Neither we, nor most other haptics researchers, display to the sense of touch proper, so it is misleading to call these tactile displays. Our users explore in the virtual worlds holding a handgrip, an experience somewhat like exploring a dark engine compartment with a screwdriver.
Remote manipulators and teleoperators display to the haptic senses a model of the (ideally) contemporaneous real world at some remote point. Their purpose is to allow the haptic feedback to guide manipulation. There is an extensive literature [2].
Vehicle simulators display models of real or imaginary worlds (as in DisneyWorld's StarTours), so that one may feel the body forces of accelerations and]or the hand-foot forces of vehicle steering (as in Atari's Hard Drivin' video arcade game). There has also been much published research on simulators [7].
Virtual world displays show models of worlds that may be real or not, may be contemporaneous or not, and may be true scale or not. We shall reserve this term, however, for displays in which visual, aural, and haptic displays each show world aspects that one can imagine seeing, hearing, and feeling, respectively, in scientific visualization, of course, one can cross-map these aspects, or can map abstract variables onto visible, aural, or haptic representors. We would not call such a virtual worm display. We know of no research to date that has used haptic representors for anything other than forces, including reactive forces when a moving user encounters modeled obstacles.
3. THE RESEARCH QUESTIONS AND WHAT WE KNOW NOW
Q1. Is the root hypothesis true: Do haptic displays demonstrably aid perception ?
A1. We have demonstrated haptic displays to aid perception in four sets of controlled experiments, each with a different world model.
Q2. How big is the effect? How much can haptic displays help? That is, when one has as communicative a visual display as one can devise,for an application maximally susceptible to haptic display, how large a performance gain can the haptic augmentation ever get?
A2. The most performance enhancement we have been able to measure is 2.2 times, in a simple manipulation task, and 1.7 times in a complex 6-D molecular docking task. This agrees with results reported in the teleoperation literature, where Hill and Salisbury found that force feedback enhanced performance up to two-fold in the docking part of a remote manipulator task (and had no effect on the pre-positioning part of the task) [10, 11].
Q3. For what kinds o f models and data are haptic displays most powerful?
A3. We believe the properties rendering applications most sus- ceptible to fruitful haptic display are at least:
• Importance of force fields to performance
• Complexity of force fields, as to both kinds and distribution of forces
• Difficulty of optical visualization
• Education per se as a goal. One wants to get information and understanding into the head for future use, not just for the task at hand. Almost all scientific visualization has this property.
The molecular docking application is nearly ideal as a test case, both for satisfying these requirements and for potential payoff.
Q4. How good do haptic display technologies have to be to yield
~ Computer Graphics, Volume 24, Number 4, August 1990
any perception augmentation?
A4. The technologies (servo control systems, etc.) we are using are marginally adequate. Indeed, they may be limiting the perform- ance enhancement we observe. (Or they may not. We may be seeing all the performance gain there is to see.)
We find update rate to be critical. We get a marginally useful system at 20 updates/second; good performance on hard-surface forces requires 60-80 ups with our mechanisms.
System lag is crucial. Ours works with lag less than or equal to one update/frame. We have not measured when lag cripples a high- update-rate system [23].
Force and torque resolution and accuracy do not seem to matter much, because of the closed-loop perception-manipulation system of the user. Quantization error on input does matter.
Mechanical backlash, static friction, and other discontinuities are very troublesome. Ordinary dynamic friction is not a major problem. Indeed, one has to have enough to critically damp the servo systems.
We have used finger-hand manipulation in a 2"x 2" working area and hand-arm manipulation in a 3'x 3'x 3' working volume. We believe finger-hand manipulation in a4" x 4" x 4" working volume would be better than either. One may have to move elbow and shoulder, with or without force diplay there, to allow full manipula- tion and force-torque sensing with fingers and wrist.
Q5. What is the perception yield curve for haptic technology enhancement? Where does it approach saturation?
A5. With our mechanism, 80 ups should suffice. However, we measure continuing performance improvement in a texture-perceiv- ing task as update rate is advanced from 500 ups to 1000 ups, which we partly understand.
4. THE HAPTIC SYSTEMS AND EXPERIMENTS
4.1 GROPE-h Haptic Display Improves Perception of Continuous 2-D Force Fields--Batter [1]
Task: Examine simple force fields by moving a probe particle, seeing and feeling the force on the probe. Then, for test fields, draw the force vector length and magnitude, given a probe position and no time to calculate.
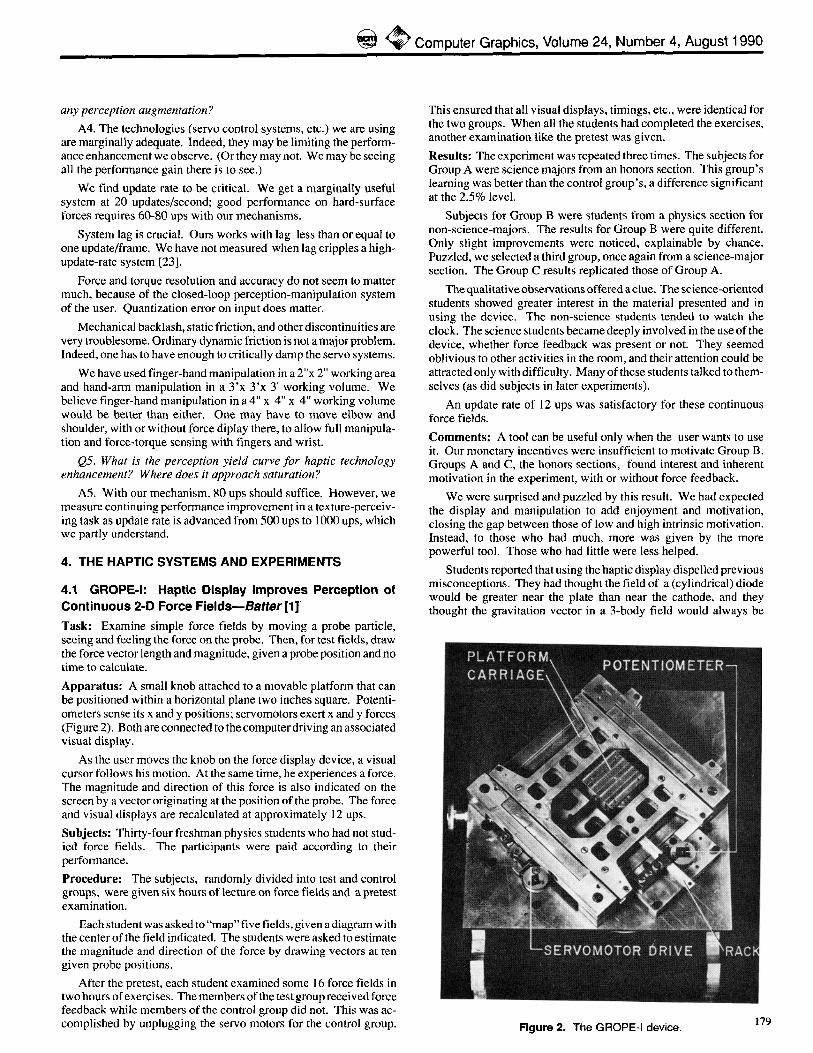
Apparatus: A small knob attached to a movable platform that can be positioned within a horizontal plane two inches square. Potenti- ometers sense its x and y positions; servomotors exert x and y forces (Figure 2). Both are connected to the computer driving an associated visual display.
As the user moves the knob on the force display device, a visual cursor follows his motion. At the same time, he experiences a force. The magnitude and direction of this force is also indicated on the screen by a vector originating at the position of the probe. The force and visual displays are recalculated at approximately 12 ups.
Subjects: Thirty-four freshman physics students who had not stud- ied force fields. The participants were paid according to their performance.
Procedure: The subjects, randomly divided into test and control groups, were given six hours of lecture on force fields and a pretest examination.
Each student was asked to "map" five fields, given a diagram with the center of the field indicated. The students were asked to estimate the magnitude and direction of the force by drawing vectors at ten given probe positions.
After the pretest, each student examined some 16 force fields in two hours of exercises. The members of the test group received force feedback while members of the control group did not. This was ac- complished by unplugging the servo motors for the control group.
This ensured that all visual displays, timings, etc., were identical for the two groups. When all the students had completed the exercises, another examination like the pretest was given.
Results: The experiment was repeated three times. The subjects for Group A were science majors from an honors section. This group's learning was better than the control group's, a difference significant at the 2.5% level.
Subjects for Group B were students from a physics section for non-science-majors. The results for Group B were quite different. Only slight improvements were noticed, explainable by chance. Puzzled, we selected a third group, once again from a science-major section. The Group C results replicated those of Group A.
The qualitative observations offered a clue. The science-oriented students showed greater interest in the material presented and in using the device. The non-science students tended to watch the clock. The science students became deeply involved in the use of the device, whether force feedback was present or not. They seemed oblivious to other activities in the room, and their attention could be attracted only with difficulty. Many of these students talked to them- selves (as did subjects in later experiments).
An update rate of 12 ups was satisfactory for these continuous force fields.
Comments: A tool can be useful only when the user wants to use it. Our monetary incentives were insufficient to motivate Group B. Groups A and C, the honors sections, found interest and inherent motivation in the experiment, with or without force feedback.
We were surprised and puzzled by this result. We had expected the display and manipulation to add enjoyment and motivation, closing the gap between those of low and high intrinsic motivation. Instead, to those who had much, more was given by the more powerful tool. Those who had little were less helped.
Students reported that using the haptic display dispelled previous misconceptions. They had thought the field of a (cylindrical) diode would be greater near the plate than near the cathode, and they thought the gravitation vector in a 3-body field would always be
Figure 2. The GROPE-I device. 179
O SIGGRAPH '90, Dallas, August 6-10, 1990
directed at one of the bodies.
Users could scale the forces to suit themselves. Most preferred a maximum force of about 8 oz.
4.2 GROPE-Ih Haptic Display Improves Seeking-Grasp- ing of Virtual Blocks in 3-DmKilpatrick [13] Task: Grasp and manipulate seven virtual child's blocks on and over the surface of a virtual table. As in GROPE-I, the force feedback can be used or disabled without changing any other part of the display or environment.
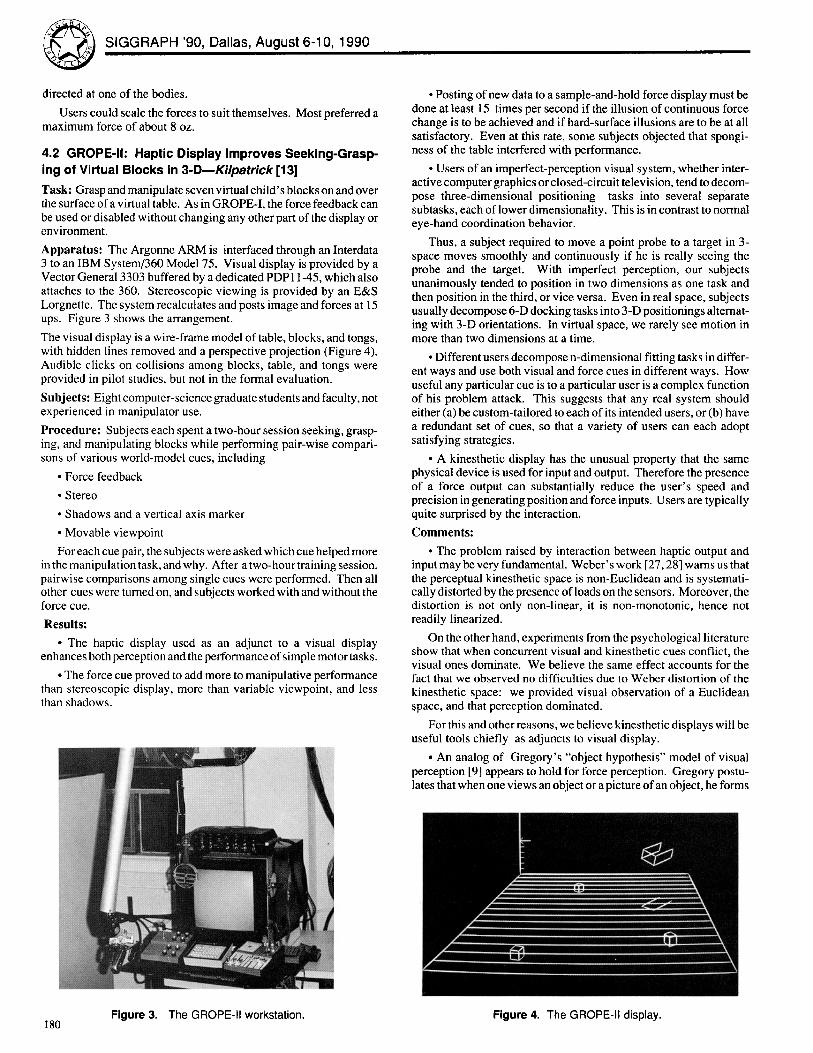
Apparatus: The Argonne ARM is interfaced through an Interdata 3 to an IBM System/360 Model 75. Visual display is provided by a Vector General 3303 buffered by a dedicated PDP11-45, which also attaches to the 360. Stereoscopic viewing is provided by an E&S Lorgnette. The system recalculates and posts image and forces at 15 ups. Figure 3 shows the arrangement.
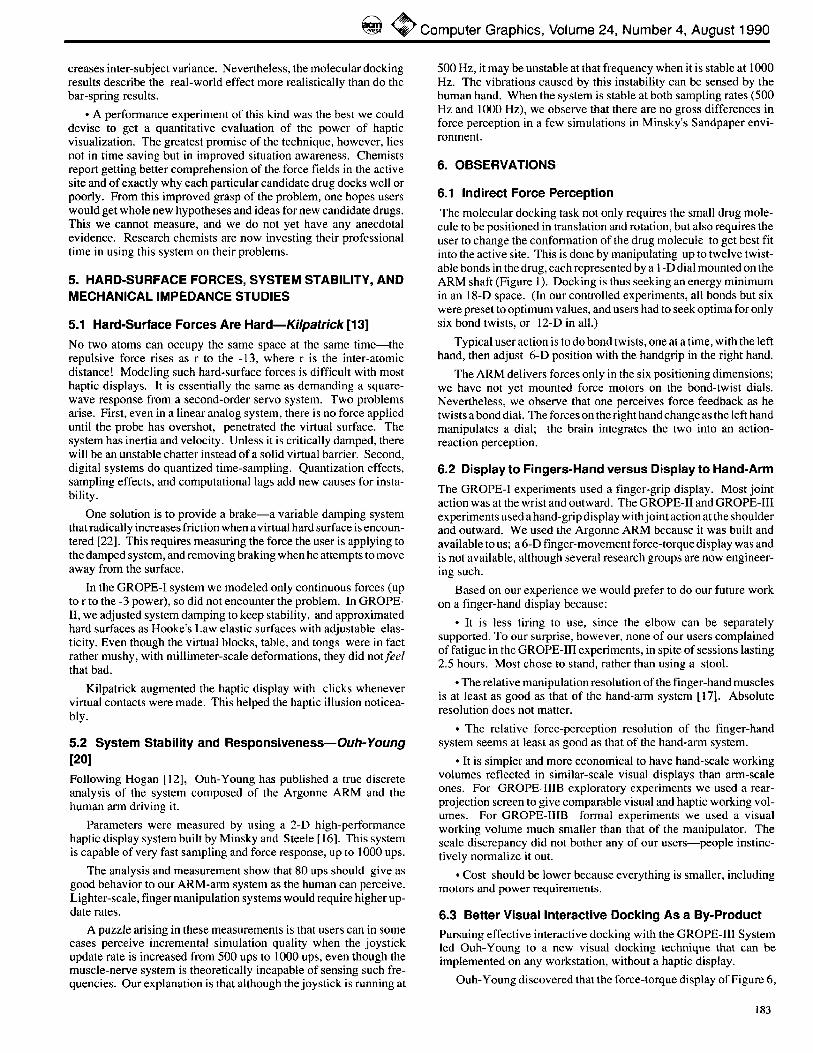
The visual display is a wire-frame model of table, blocks, and tongs, with hidden lines removed and a perspective projection (Figure 4). Audible clicks on collisions among blocks, table, and tongs were provided in pilot studies, but not in the formal evaluation.
Subjects: Eight computer-science graduate students and faculty, not experienced in manipulator use.
Procedure: Subjects each spent a two-hour session seeking, grasp- ing, and manipulating blocks while performing pair-wise compari- sons of various world-model cues, including
• Force feedback
• Stereo
• Shadows and a vertical axis marker
• Movable viewpoint
For each cue pair, the subjects were asked which cue helped more in the manipulation task, and why. After a two-hour training session. pairwise comparisons among single cues were performed. Then all other cues were turned on, and subjects worked with and without the force cue.
Results:
• The haptic display used as an adjunct to a visual display enhances both perception and the performance of simple motor tasks.
• The force cue proved to add more to manipulative performance than stereoscopic display, more than variable viewpoint, and less than shadows.
• Posting of new data to a sample-and-hold force display must be done at least ] 5 times per second if the illusion of continuous force change is to be achieved and if hard-surface illusions are to be at all satisfactory. Even at this rate, some subjects objected that spongi- ness of the table interfered with performance.
• Users of an imperfect-perception visual system, whether inter- active computer graphics or closed-circuit television, tend to decom- pose three-dimensional positioning tasks into several separate subtasks, each of lower dimensionality. This is in contrast to normal eye-hand coordination behavior.
Thus, a subject required to move a point probe to a target in 3- space moves smoothly and continuously if he is really seeing the probe and the target. With imperfect perception, our subjects unanimously tended to position in two dimensions as one task and then position in the third, or vice versa. Even in real space, subjects usually decompose 6-D docking tasks into 3-D positionings alternat- ing with 3-D orientations. In virtual space, we rarely see motion in more than two dimensions at a time.
• Different users decompose n-dimensional fitting tasks in differ- ent ways and use both visual and force cues in different ways. How useful any particular cue is to a particular user is a complex function of his problem attack. This suggests that any real system should either (a) be custom-tailored to each of its intended users, or (b) have a redundant set of cues, so that a variety of users can each adopt satisfying strategies.
• A kinesthetic display has the unusual property that the same physical device is used for input and output. Therefore the presence of a force output can substantially reduce the user's speed and precision in generating position and force inputs. Users are typically quite surprised by the interaction.
Comments: • The problem raised by interaction between haptic output and
input may be very fundamental. Weber's work [27, 28] warns us that the perceptual kinesthetic space is non-Euclidean and is systemati- cally distorted by the presence of loads on the sensors. Moreover, the distortion is not only non-linear, it is non-monotonic, hence not readily linearized.
On the other hand, experiments from the psychological literature show that when concurrent visual and kinesthetic cues conflict, the visual ones dominate. We believe the same effect accounts for the fact that we observed no difficulties due to Weber distortion of the kinesthetic space: we provided visual observation of a Euclidean space, and that perception dominated.
For this and other reasons, we believe kinesthetic displays will be useful tools chiefly as adjuncts to visual display.
• An analog of Gregory's "object hypothesis" model of visual perception [9] appears to hold for force perception. Gregory postu- lates that when one views an object or a picture of an object, he forms
Figure 3. The GROPE-II workstation, Figure 4. The GROPE-II display. 180

~ Computer Graphics, Volume 24, Number 4, August 1990
a hypothesis about its structure which he uses to predict how it will look from other viewpoints. He believes one tends to select the most probable structure to hypothesize, making it "difficult, perhaps sometimes impossible, to see very unusual objects."
We postulate, based on Kilpatrick's observations and Batter's, that displayed forces are similarly interpreted as the most likely forces. Since we commonly experience only constant or linear force fields, these are the only ones we interpret correctly. Batter found, for example, that subjects were unable to distinguish among square- law and cube-law fields without direct comparison.
4.3 GROPE-IlIA: Haptie Display Alone Can Be Better Than Visual Display Alone for Simple Force Fields--Ouh- Young [19] Task: Find the minimum-energy position and orientation of a virtual bar suspended in space by six springs with random anchor points and elastic constants (Figure 5).
Apparatus: The Argonne ARM is attached to a dedicated Sun4. Visual display is on an E & S PS-330 color vector display. Stereo vision is provided by a Tektronix alternating polarization plate and polarized glasses. The user can use the handgrip to change viewpoint location and viewing orientation, and to manipulate the bar.
The user has an auxiliary control, held in the free hand, which gives viewpoint rotation about the Y-axis of the virtual world, to give kinetic depth effect. The use of this aid costs time; subjects used it less than 20% of the time.
On the screen there are two colored spheres landmarking the virtual space. They are unrelated to the docking task, but provide visual cues to the relative positions of objects in the virtual world. The springs are invisible (Figure 6).
A New Visual Representation of Forces and Torques: The resul- tant of all translational forces on an object is represented as a 3-D vector with one end fixed at the center of a sphere located at the geo- metric center of the object. The resultant of all torques on an object is represented as a pair of 3-D vectors tangent to the sphere. Vector lengths are proportional to the forces and torques. Visually these vectors would appear as three springs attached to the sphere--one pulling the sphere through the center, the others, tangent, rotating the sphere.
There are infinitely many equivalent torque vectors tangent to a sphere. For any non-zero torque, there are exactly two with origins on the occluding contour of the sphere (except for the degenerate case where all torque vectors are parallel to the viewing plane). We display only the one of these that is not itself occluded by the sphere. Figure 6 shows this visual representation.
Subjects: Seven volunteer computer science students and staff. All subjects were able to see stereo. One subject ($2) was very experi- enced in using the ARM; the others were relatively inexperienced.
Procedure: We studied performance with only force feedback (F) and with only visual presentation of force and torque vectors (V).
Pl
P4 spr~ngk i~P2 ~ f a sprtngkl P2
- ' - a bar. 4inches long
Figure 5. The simplified docking task. The goal is to find the zero- force position and orientation of the bar, where P1 to P6 are
positions in 3-D, and kl to k6 are the elastic constants for springs.
Our hypothesis was that F would have a significantly lower potential energy level after 15, 30, 45, and 60 seconds in a 60 second trial.
For each trial, the subjects were told to reduce the system energy by minimizing the forces and torques. They were told to do the tests as fast as they could in 60 seconds. Each subject participated in two sessions: an hour of training one day; and an hour of experiment the next day. Each subject was trained until performance stopped improving. Training generally took about 20 minutes for F but about 40 minutes for V.
Design. Each of the six trials used gave the subject an initial random configuration of the springs. The within-subject design is a one-way analysis of variance with a Latin square of repeated measures. The same six trials were used for each method by each subject, but the trials were disguised by changing the initial viewpoint each time.
Results. Figure 7 shows completion times and the potential energy after 60 seconds. Energy levels were significantly lower with F than with V at 15, 30, 45, and 60 seconds. We observed that most sub- jects using F had reached steady state by 30 seconds into a trial. Some subjects reached steady state using V after 30 seconds, but many were still improving their docking position at 60 seconds.
Comparing the mean completion times for the two methods shows a haptic performance advantage of 2.2 times. Almost all subjects reported surprise that they could do blind docking at all, much less that they could do it faster than visual docking. This result may be true only for energy spaces with only one minimum.
The mean final energy for F was half as large as that of V, i.e., F users got better docking when they ran for the same time.
Comments:
• Since this energy space has only one minimum, this is really a toy problem better solved by computation than by interaction. Indeed, if the force-driven ann is just turned loose, it makes its way to the global minimum. Hence results from this experiment should not be generalized.
• Our visual presentation of the forces and torques are two independent vectors. During the visual docking, we observed that the subjects dealt with force and torque vectors separately. Most subjects shorten the force vector first and then the torque vector. This is not always the best way of minimizing energy. When the subjects were docking using force, they did translation and rotation at the same time in continuous motion. F's being twice as fast as V also suggests that subjects treated forces and torques as independent entities when working visually.
Figure 6. Visual display for GROPE-IlIA. 181

O SIGGRAPH '90, Dallas, August 6-10, 1990
Mean completion times in seconds and final energies for six trials.
N~NN~ Time V
$1 57.0 $2 18.3 $3 45.O $4 37.5 $5 29.2 $6 53.0 $7 50.1
mean l 41.4
Time F Mean Time
17.7 37.3 12.4 15.4 16.8 30.9 22.4 29.9 12,9 21.0 25.1 39.1 24.6 37.3
18.9 30.1
Energy V
1,14 0.49 1.38 1.55 0,45 1.04 0.98
1.00
Energy F
0.23 0.45 0.53 1.03 0.36 0.62 0.30
0.50
Figure 7. Performance data for V and F of a simple docking task.
4.4 GROPE-IIIB: Haptic Display Improves Performance in a Complex Molecular Docking Task--Ouh-Young [18, 20] Task. Dock each of four drugs into the active site of the protein molecule dihydrofolate reductase, orienting the drug and adjusting up to six of its internal twistable bonds so as to give the lowest potential energy of the docked combination, Consider surface ge- ometry, electrostatic forces, van der Waars forces, hydrophobicity- hydrofelicity, and hydrogen bonding. Docking is complete when the energy is within a tolerance of the best-known real energies. (The true docking conformation is not known for some of the drugs [ 14].)
Apparatus. The Argonne ARM is attached to a dedicated Sun4. The ARM is augmented with individual dials for the twistable bonds in the drug. Figure l shows the ARM with a large screen visual display used in pilot studies. The visual display used in the experiments is an E & S PS-330, because it offers stereo vision by a Tektronix alternating polarizing plate.
Figure 8 shows the drug, represented by bond vectors, with the active site represented by a Connolly [6] dot surface, colored to show electrostatic charge. Van der Waals collisions are marked by flashing yellow vectors. Hydrogen bonds between drug and protein can be examined on request. A gnomon shows the orientation of the virtual space. Two energy "thermometers" show the total potential binding energy, which is to be minimized, and the internal potential energy of the drug molecule in its current conformation. This latter variable shows stresses due to inappropriate bond twists. The word GOAL signals achievement of the target energy tolerance. This is a rich visual environment, richer than most other visual molecular docking tools provide.
The evaluation of intermolecular forces is too complex to do in real time even to the accuracy used in ordinary molecular modeling. We use the approximate method of Pattabiriman and Langridge [21 ], whereby one precomputes component forces at gridpoints around the active site for probe atoms of each atom type. The forces, torques, and energies for a small drug molecule can then be computed at run time by vector-summing the force components for each of its atoms. This algorithm was a crucial development; it made real-time docking possible.
Subjects: The subjects were twelve experienced biochemists from UNC-CH, Duke University, and Burroughs-Wellcome Research Center in Research Triangle Park. All had worked on molecular- modeling problems for at least two years.
Procedure: After a training session with the two training drugs, the subjects were allowed 2.5 hours (more than enough) to dock the four test drugs from random starting positions, with five minutes' rest between each dockin/~, and three minutes to study the geometries of the next test drug before beginning actual manipulation. Energies and drug position and conformation were recorded every 1.5 sec- onds.
Figure 8. GROPE-IIIB visual display: drug docked in DHFR active site, with energy thermometers.
A balanced statistical design was used with two methods: dock- ing with (F) and without (NF) force-torque feedback, with the same visual display and energy thermometers for both. All four drugs had equal occurenee in trial ordering and in being in the F and NF groups. All were about equal in docking difficulty.
Results:
• Overall elapsed time performance with haptic feedback was improved, but the difference was not significant. Mean docking time for one drug was about 13 minutes.
• Subjects decomposed docking into I-D bond twists and 6-D rigid body docking maneuvers, and spent about equal time on each. Interesting results emerge when these are analyzed separately.
• The 6-D rigid-body docking part of the task was about 30% faster with force than without, and this difference is significant (p <0.05)
• The 1-D bond-twisting part of the task was about the same speed with and without handgrip forces. Note that the bond-twisting dials themselves do not have force feedback. Moreover, the I-D internal energy thermometer provides complete visual feedback for a 1-D twisting manipulation.
• Drug trajectory path-lengths were 41% shorter with haptic feedback (significant, p <0.01). Users proceeded more directly toward the correct minimum.
• Think-time, when subjects were manipulating nothing, was about 35% of the total docking time. If this is subtracted out, the 6-D docking is 1.75 times faster with force-torque than without.
• The dockings found by ARM users were generally better in energy or hydrogen bonding than those found by pure computation using the common Ellipsoidal algorithm.
Comments:
• Subjects liked the haptic display very much. They used force cues unconsciously and in the training session were unaware of forces until they were turned off. Subjects see the haptic display as a fast way to test many hypotheses in a short time, and a fast way to see how to set up and guide batch computations.
• We were initially surprised that the performance improvement on the complex docking task did not approach the 2.2 factor seen on the simple bar-spring task. Upon reflection, the reasons became clear, Think-time is a big dilution. Here the subjects are searching among many local minima in a complex space. They spend about a third of their time changing viewpoints, thinking, and interactively checking hydrogen bonds to see if the proposed solution is indeed the global minimum. The simpler bar-spring task needed no such time. Think-time both dilutes the performance improvements and in-
~ " Computer Graphics, Volume 24, Number 4, August 1990
creases inter-subject variance. Nevertheless, the molecular docking results describe the real-world effect more realistically than do the bar-spring results.
• A performance experiment of this kind was the best we could devise to get a quantitative evaluation of the power of haptic visualization. The greatest promise of the technique, however, lies not in time saving but in improved situation awareness. Chemists report getting better comprehension of the force fields in the active site and of exactly why each particular candidate drug docks well or poorly. From this improved grasp of the problem, one hopes users would get whole new hypotheses and ideas for new candidate drugs. This we cannot measure, and we do not yet have any anecdotal evidence. Research chemists are now investing their professional time in using this system on their problems.
5. HARD-SURFACE FORCES, SYSTEM STABILITY, AND MECHANICAL IMPEDANCE STUDIES
5.1 Hard-Surface Forces Are HardmKilpatrick [13]
No two atoms can occupy the same space at the same time--the repulsive force rises as r to the -13, where r is the inter-atomic distance! Modeling such hard-surface forces is difficult with most haptic displays. It is essentially the same as demanding a square- wave response from a second-order se~o system. Two problems arise. First, even in a linear analog system, there is no force applied until the probe has overshot, penetrated the virtual surface. The system has inertia and velocity. Unless it is critically damped, there will be an unstable chatter instead of a solid virtual barrier. Second, digital systems do quantized time-sampling. Quantization effects, sampling effects, and computational lags add new causes for insta- bility.
One solution is to provide a brake--a variable damping system that radically increases friction when a virtual hard surface is encoun- tered [22]. This requires measuring the force the user is applying to the damped system, and removing braking when he attempts to move away from the surface.
In the GROPE-I system we modeled only continuous forces (up to r to the -3 power), so did not encounter the problem. In GROPE- II, we adjusted system damping to keep stability, and approximated hard surfaces as Hooke's Law elastic surfaces with adjustable elas- ticity. Even though the virtual blocks, table, and tongs were in fact rather mushy, with millimeter-scale deformations, they did not feel that bad.
Kilpatrick augmented the haptic display with clicks whenever virtual contacts were made. This helped the haptic illusion noticea- bly.
5.2 System Stability and Responsiveness--Ouh-Young [2O]
Following Hogan [12], Ouh-Young has published a true discrete analysis of the system composed of the Argonne ARM and the human arm driving it.
Parameters were measured by using a 2-D high-performance haptic display system built by Minsky and Steele [16]. This system is capable of very fast sampling and force response, up to 1000 ups.
The analysis and measurement show that 80 ups should give as good behavior to our ARM-arm system as the human can perceive. Lighter-scale, finger manipulation systems would require higher up- date rates.
A puzzle arising in these measurements is that users can in some cases perceive incremental simulation quality when the joystick update rate is increased from 500 ups to 1000 ups, even though the muscle-nerve system is theoretically incapable of sensing such fre- quencies. Our explanation is that although the joystick is running at
500 Hz, it may be unstable at that frequency when it is stable at 1000 Hz. The vibrations caused by this instability can be sensed by the human hand. When the system is stable at both sampling rates (500 Hz and 1000 Hz), we observe that there are no gross differences in force perception in a few simulations in Minsky's Sandpaper envi- ronment.
6. OBSERVATIONS
6.1 Indirect Force Perception
The molecular docking task not only requires the small drug mole- cule to be positioned in translation and rotation, but also requires the user to change the conformation of the drug molecule to get best fit into the active site. This is done by manipulating up to twelve twist- able bonds in the drug, each represented by a 1 -D dial mounted on the ARM shaft (Figure 1). Docking is thus seeking an energy minimum in an 18-D space. (In our controlled experiments, all bonds but six were preset to optimum values, and users had to seek optima for only six bond twists, or 12-D in all.)
Typical user action is to do bond twists, one at a time, with the left hand, then adjust 6-D position with the handgrip in the right hand.
The ARM delivers forces only in the six positioning dimensions; we have not yet mounted force motors on the bond-twist dials. Nevertheless, we observe that one perceives force feedback as he twists a bond dial. The forces on the right hand change as the left hand manipulates a dial; the brain integrates the two into an action- reaction perception.
6.2 Display to Fingers-Hand versus Display to Hand-Arm
The GROPE-I experiments used a finger-grip display. Most joint action was at the wrist and outward. The GROPE-II and GROPE-Ill experiments used a hand-grip display with joint action at the shoulder and outward. We used the Argonne ARM because it was built and available to us; a 6-D finger-movement force-torque display was and is not available, although several research groups are now engineer- ing such.
Based on our experience we would prefer to do our future work on a finger-hand display because:
• It is less tiring to use, since the elbow can be separately supported. To our surprise, however, none of our users complained of fatigue in the GROPE-Ill experiments, in spite of sessions lasting 2.5 hours. Most chose to stand, rather than using a stool.
• The relative manipulation resolution of the finger-hand muscles is at least as good as that of the hand-arm system [17]. Absolute resolution does not matter.
• The relative force-perception resolution of the finger-hand system seems at least as good as that of the hand-arm system.
• It is simpler and more economical to have hand-scale working volumes reflected in similar-scale visual displays than arm-scale ones. For GROPE-IIIB exploratory experiments we used a rear- projection screen to give comparable visual and haptic working vol- umes. For GROPE-IIIB formal experiments we used a visual working volume much smaller than that of the manipulator. The scale discrepancy did not bother any of our users--people instinc- tively normalize it out.
• Cost should be lower because everything is smaller, including motors and power requirements.
6.3 Better Visual Interactive Docking As a By-Product Pursuing effective interactive docking with the GROPE-Ill System led Ouh-Young to a new visual docking technique that can be implemented on any workstation, without a haptie display.
Ouh-Young discovered that the force-torque display of Figure 6,
183

SIGGRAPH '90, Dallas, August 6-10, 1990
combined with a Pattabiraman force-torque evaluator, sufficed to help chemists find the convergence neighborhood of the global minimum. The chemist then switches to a while-you-watch algo- rithmic minimizer, which uses a Pattabiraman approximate energy evaluator until it is close to the minimum. This speeds the whole process up to interactive-session times, even if not so much as the haptic display does.
7. FUTURE PROSPECTS
7.1 Carriers of Technology All of scientific visualization has been technologically enabled by the interactive graphics commercial base supported by word process- ing, spreadsheets, desktop publishing, CAD-CAM, flight simula- tors, and entertainment. Indeed, almost all of computer graphics has been technologically enabled by the commercial base of television.
We expect the same processes to pace the development and cost ofhaptic display hardware. The manufacturing robotics industry, the video game industry, and the vehicle simulator industry will develop the technologies, which will be adapted for teleoperation and for scientific visualization.
7.2 Applications for Haptic Displays Molecules. We believe the pharmaceutical industry has a substantial potential for using haptic displays, but that such applications will develop very slowly over the decade.
Besides drug-enzyme docking, one can imagine applications in DNA intercalators, in protein design, and in studies of protein folding and packing. Feeling these subtle force fields could matter a lot to a researcher seeking insight and new hypotheses.
Other Scientific Visualization. Static scalar and vector fields abound: in geology, in seismology, in structures engineering, in magnetics design, in electron device design, in materials design. Haptic display can aid in the comprehension and exploration of these fields and in non-linear optimizations within them.
Haptics can perhaps aid perception most when large variations in magnitudes occur in the fields. The eye quickly recognizes bigger and smaller in visual representations, and it is superb at detecting dis- continuities. But one does not readily internalize that "This density is ten times that one." A haptic display makes magnitudes vivid.
Our more distant dreams include the testing of a tensor-field haptic display, in which one haptic manipulator-display allows one to apply force, and a second one allows one to explore the resultant forces all over the field. This dream awaits a radical upgrade in com- puting power, just as our molecular work had to wait from 1976- 1986. Never mind; the compute power will come.
Education. Systems for scientific visualization will be very useful for education, but educational applications will not by themselves pay for haptic displays.
CAD, CAM, and CAE. As mechanisms get smaller and more complex, design for manufacturability becomes more important. We foresee haptic displays used to design as sembly sequences and to test ease-of-assembly of virtual models in early design development.
Essentially the same problem arises in planning the installation, repair, and removal of heavy equipment in a building. Bechtel already offers a graphics package to help architects and engineers script and test equipment movement plans. Collision-detection is necessary. Packages with audible and later haptic warnings will surely appear.
Why should one add haptic display to a system that already does bump detection and audible notification? Because the designer really wants to know not merely that his plan does not work, but what other motion-path might work. That is much easier to explore when one can feel the constraints [13].
Just impeding the collision-causing motion in a visual-only display does not help task performance, but indeed hinders it [26].
Entertainment. StarTours and Hard Drivin' are just the beginnings ofhaptic displays in entertainment. The fact that approximate forces suffice for strong illusions is important for cost/performance in en- tertainment. We believe entertainment will be the fastest-growing application of haptic displays in the 90's.
Invitation. We will be glad to host and help researchers who want to build and test a scientific visualization application on the GROPE- III system. The support software is packaged and documented. Communicate with Dr. William V. Wright, [email protected], 919/962-1838.
Acknowledgements. We keenly appreciate support for this research:
In the 1960's and 1970's by the U.S. Atomic Energy Commis- sion, now part of the Department of Energy, and by the National Science Foundation.
In the 1980' s by the National Center for Research Resources, Na- tional Institutes of Health.
The Argonne Remote Manipulator was furnished by the Argonne National Laboratory. The GROPE-I device was lent to us by Prof. Thomas Sheridan of MIT. Dr. Lee Kuyper of Burroughs-Wellcome provided the molecular data.
Margaret Minsky made her apparatus available for our imped- ance studies of the human arm.
We are indebted to all of the team through the years: especially to the students whose work is explicitly cited; to our technical s taf f - - John Hughes, David Harrison, Phil Stancil, James Ross; to Michael Pique and James S. Lipscomb, who have shared the vision and encouraged the work at every turn; to our experimental participants; and to our chemist collaborators--lane and Dave Richardson of Duke, Michael Cory and Lee Kuyper of Burroughs-Wellcome.
REFERENCES [1 ] Batter, J.J. and Brooks, F.P., Jr. GROPE-I: A computer display to the sense of feel. Information Processing, Proc. 1FIP Congress 71,759-763.
[2] Bejczy, A.K. Sensors,controls, and man-machine interface for advanced teleoperation. Science 208 (1980), 1327-1335,.
[3] Brooks, F.P., Jr. The computer scientist as toolsmith: Studies in interactive computer graphics. In Information Processing 77, 625- 634. B. Gilchrist, ed. North-Holland: Amsterdam, 1977.
[4] Brooks, F.P., Jr. Grasping reality through illusion: Interactive graphics serving science. Invited keynote address. Published in CHI'68 Proceedings, May 1988. Addison-Wesley: Reading, MA. 1 - 11.
[5] Capowski, J.J. Remote Manipulators as a Computer Input Device. M.S. Thesis, Computer Science Department, University of North Carolina, Chapel Hill, 1971.
[6] Connolly, M.L. Solvent-accessible surfaces of proteins and nucleic acids. Science 221 (August 1983), 709-713.
[7] Deyo, R., Briggs, J., and Doenges, P. Getting graphics in gear. Proceedings of SIGGRAPH'86 (Dallas, Texas, August 18-22, 1986). In Computer Graphics 22, 4 (August 1986), 317-326.
[8] Goertz, R.C. et al. The ANL Model 3 master slave manipula- t o r s - I t s design and use in a cave. Proc. of the Ninth Conference on Hot Laboratories and Equipment, Washington, D.C., United States Atomic Energy Commission, 1961.
[9] Gregory, R.L. Eye andBrain. 2nd ed. McGraw- Hill: New York, 1973.
[10] Hill, J.W. and Salisbury, J.K., Jr. Two measures of performance

' ~ Computer Graphics, Volume 24, Number 4, August 1990
in a peg-in-hole manipulation task with force feedback. Paper pre- sented at Thirteenth Annual Conference on Manual Control, MIT (June 15-17, 1977).
[ 11] Hill, J.W. and Salisbury, J.K., Jr. Study to design and develop remote manipulator system. Quarterly Reports 5, 6 (January 1978). Stanford Research Institute, Menlo Park, CA.
[ 12] Hogan, N. Stable execution of contact tasks using impedance control. Proceedings of lEEE Robotics and Automation Conference, Raleigh, NC (t987), 1047-1054.
[13] Kilpatrick, P.J. The Use of Kinesthetic Supplement in an Inter- active System. Ph.D dissertation, Computer Science Department, University of North Carolina at Chapel Hill, 1976.
[14] Kuyper, L. Receptor-based design of Dihydrofolate Reductase inhibitors: Comparison of crystallographically determined enzyme binding with enzyme affinity in a series of earboxy-substituted Trimethoprim analogues." J. Med. Chem.. 1122, 25 (1982), 1120- 1124.
[15] McCormick, B.H., DeFanti, T.A., Brown, M.D., eds. Visuali- zation in scientific computing. Computer Graphics 21, 6 (Nov. 1987), and SIGGRAPH Video Review, Issues 28-29 (Nov. 1987).
[16] Minsky, M., Ouh-young, M., Steele, O., Brooks, F. P., Jr., Behensky, M. Feeling and seeing: Issues in force display. Proc. of 1990 Symposium on Interactive 3D Graphics, Snowbird, Utah, March 1990. Published in Computer Graphics 24, 2 (March 1990), 235-244.
[17] Mowbray, G. H. and Gebhard, J. W. Man's senses as informa- tion channels. In H.W. Sinaiko, ed. Selected Papers on Human Factors in the Design and Use of Control Systems. Dover: New York, 1961. p. 118.
[ 18] Ouh-Young, M., Pique, M., Hughes, J., Srinivasan, N., Brooks, F.P., Jr. Using a manipulator for force display in molecular docking. Proc. IEEE Robotics and Automation Conference 3 (Philadelphia, April 1988), 1824-1829.
[19] Ouh-Young, M., Beard, D.V., Brooks, F.P., Jr. Force display performs better than visual display in a simple 6-D docking task. Proc. IEEE International Conference on Robotics and Automation (Arizona, May 1989), 1462-1466.
[20] Ouh-Young, M. Force Display in Molecular Docking. Ph.D. Dissertation, Computer Science Department, University of North Carolina, Chapel Hill, 1990.
[21 ] Pattabiraman, N. et al. Computer graphics and drug design: Real time docking, energy calculation and minimization. Journal of Computational Chemistry 6 (1985), 432-436.
[22] Smith, M.J. Tactile Interface for Three-Dimensional Com- puter-Simulated Environments: Experimentation and the Design of a Brake-Motor Device. M.S. Thesis, Mechanical Engineering De- partment., Massachusetts Institute of Technology, 1988.
[23] Stark, L.W., Kim, W.S., Tendick, F. Cooperative control in telerobotics. Proc. IEEE International Conference on Robotics and Automation (Philadelphia, April 1988), 593-595.
[24] Steelman, H.S. The GROPE-I System: An Analysis of Friction and Backlash Problems. M.S. Thesis, Computer Science Depart- ment, University of North Carolina, Chapel Hill, 1968.
[25] Sutherland, I.E. The ultimate display. Information Processing 1965, Proc. 1FIP Congress 65, 506-508.
[26] Turk, G. Interactive Collision Detection for Molecular Graph- ics. M.S. thesis, Computer Science Department, University of North Carolina at Chapel Hill, 1989.
[27] Weber, C.O. The properties of space and time in kinaesthetic fields of force. Am. J. of Psychology 38, 4 (1927), 597-606.
[28] Weber, C.O. The properties of space and time in kinaesthetic fields of force. Am.J. of Psychology 41, 1 (1929), 95-105.
[29] Webster's New International Dictionary. 2nd ed. Merriam: Springfield, MA.
185