
Project Final Report for Distributed Solar...
36
Project Final Report for Distributed Solar Generation Laura Criste, John Hoffman, Josh Grant George Mason University May 12, 2017
Transcript of Project Final Report for Distributed Solar...

Project Final Report
for
Distributed Solar Generation
Laura Criste, John Hoffman, Josh Grant
George Mason University
May 12, 2017

2
1 TABLE OF CONTENTS
2 Acknowledgements ................................................................................................................. 2
3 Executive Summary ................................................................................................................. 3
4 Background .............................................................................................................................. 4
5 Problem.................................................................................................................................... 7
6 Scope ....................................................................................................................................... 8
7 Data Collection and Utilization .............................................................................................. 10
10 Sensitivity Analysis ............................................................................................................ 22
12 Limitations .......................................................................................................................... 24
13 Future Work ....................................................................................................................... 24
14 Appendix A: Project Plan ................................................................................................... 26
15 Appendix B: R Probability Distribution Code ..................................................................... 30
16 Appendix C: Monthly Probability Distributions .................................................................. 32
17 Appendix D: Team Biographies and Roles ....................................................................... 36
2 ACKNOWLEDGEMENTS
The team would like to express its appreciation to the sponsor, NOVEC, for dedicating the time
and resources to support the SEOR graduate program. The team would like to thank Robert
Bisson, NOVEC’s Vice President Electric System Development, who provided the challenge,
and offered key guidance throughout the project. Mr. Bisson was very gracious with his time,
including a couple of Saturdays, always happy to discuss our progress, and available to help
resolve issues the team encountered.
The team would also like to recognize Angie Thomas, NOVEC Manager of Forecasting and
NERC Compliance & Business Systems, and Kevin Whyte, NOVEC Manager of Distribution
Engineering. Ms. Thomas was a key POC for the team, and was instrumental in facilitating
interactions with NOVEC. Mr. Whyte was able to identify, extract, and provide the data required
to complete the DSG project. Mr. Whyte’s expertise, and knowledge of the system allowed for
the transmission and receipt of these exceptionally large data sets.
Finally, the team would like to acknowledge Dr. Kathryn Laskey, Systems Engineering and
Operations Research Professor at George Mason University Volgenau School of Engineering.
Dr. Laskey was the instructor for the Capstone Project, and provided key guidance and insight
along the way, assuring the success of our team.

3
3 EXECUTIVE SUMMARY
The Northern Virginia Electric Cooperative presented the George Mason University Systems
Engineering and Operations Research graduate capstone class with a problem concerning
distributed solar generation, and its ability to recover costs associated with electric distribution.
NOVEC recovers its operational and infrastructure costs through a monthly flat fee and a per
kilowatt hour charge to distribute electricity to the customer. The pricing structure is the same for
solar and non-solar customers, so the charges are distributed based on the kilowatt hours of
electricity the customer uses. Customers with solar panels reduce the amount of power sold by
NOVEC but they do not reduce the distribution costs because NOVEC must be prepared to
distribute power to them any time the solar panels are not producing energy. This requirement
increase the cost to distribute each kilowatt hour and reduces NOVEC’s revenue. If NOVEC
increase the distribution charge, it would unfairly impact the customers without solar panels.
The SEOR capstone team evaluated solar customers’ use of NOVEC’s operations and
infrastructure, projected the impact of an increasing solar penetration level, and proposed two
methods to recover NOVEC’s distribution costs without discouraging solar panel use or
burdening the non-solar customers with all of the increased costs. Both methods recommend
separating the pricing structure for solar and non-solar customers.
The first method is to recover costs by increasing the distribution charge proportionally by
kilowatt hour used for only solar customers. The second method is to recover costs by first
charging solar customers NOVEC’s current pricing structure rate to distribute excess solar
energy back to NOVEC and then recover any costs not accounted for by the redistribution
charge by increasing the distribution charge proportionally by kilowatt hour used for all
customers. The final recommendation is a combination of the two methods and dependent on
the solar penetration level.
4
4 BACKGROUND
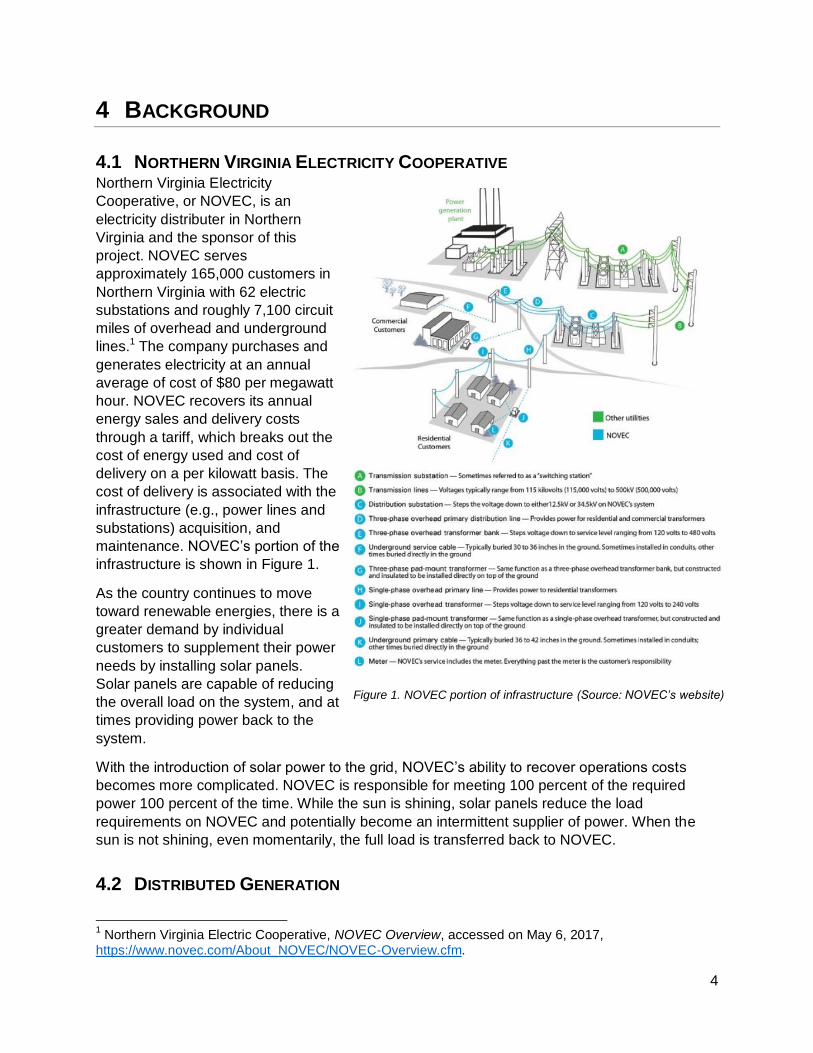
4.1 NORTHERN VIRGINIA ELECTRICITY COOPERATIVE Northern Virginia Electricity
Cooperative, or NOVEC, is an
electricity distributer in Northern
Virginia and the sponsor of this
project. NOVEC serves
approximately 165,000 customers in
Northern Virginia with 62 electric
substations and roughly 7,100 circuit
miles of overhead and underground
lines.1 The company purchases and
generates electricity at an annual
average of cost of $80 per megawatt
hour. NOVEC recovers its annual
energy sales and delivery costs
through a tariff, which breaks out the
cost of energy used and cost of
delivery on a per kilowatt basis. The
cost of delivery is associated with the
infrastructure (e.g., power lines and
substations) acquisition, and
maintenance. NOVEC’s portion of the
infrastructure is shown in Figure 1.
As the country continues to move
toward renewable energies, there is a
greater demand by individual
customers to supplement their power
needs by installing solar panels.
Solar panels are capable of reducing
the overall load on the system, and at
times providing power back to the
system.
With the introduction of solar power to the grid, NOVEC’s ability to recover operations costs
becomes more complicated. NOVEC is responsible for meeting 100 percent of the required
power 100 percent of the time. While the sun is shining, solar panels reduce the load
requirements on NOVEC and potentially become an intermittent supplier of power. When the
sun is not shining, even momentarily, the full load is transferred back to NOVEC.
4.2 DISTRIBUTED GENERATION
1 Northern Virginia Electric Cooperative, NOVEC Overview, accessed on May 6, 2017,
https://www.novec.com/About_NOVEC/NOVEC-Overview.cfm.
Figure 1. NOVEC portion of infrastructure (Source: NOVEC’s website)
5
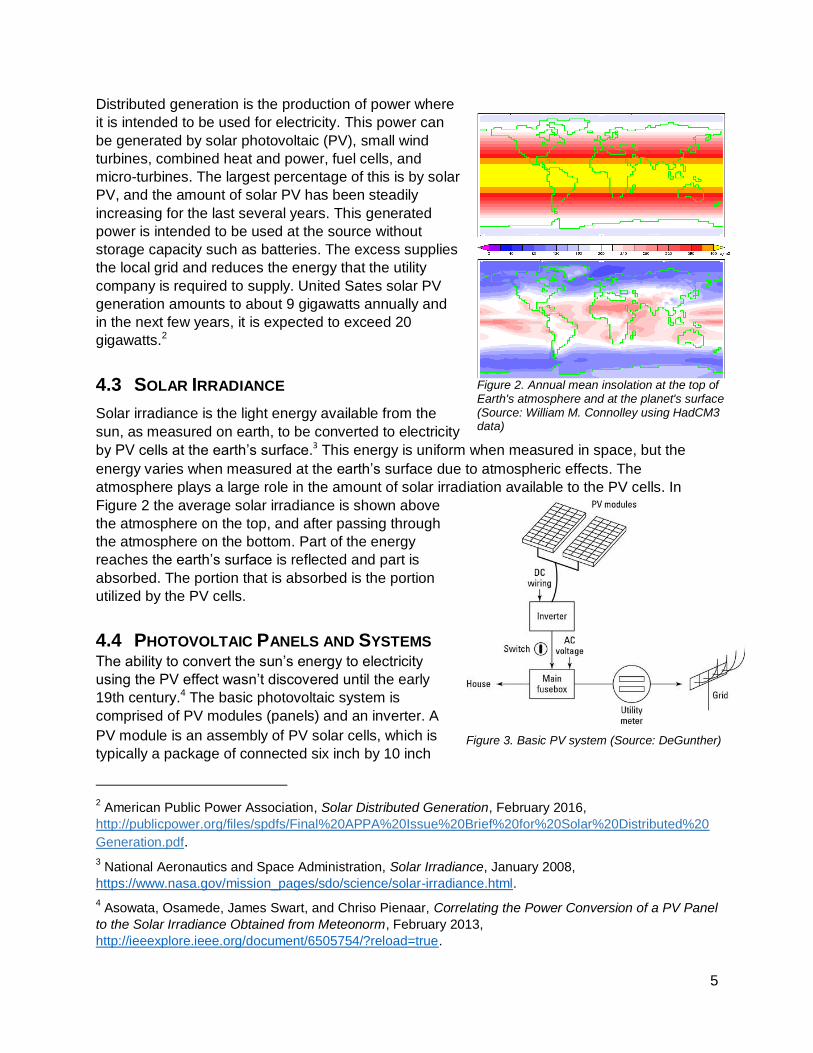
Figure 2. Annual mean insolation at the top of Earth's atmosphere and at the planet's surface (Source: William M. Connolley using HadCM3 data)
Distributed generation is the production of power where
it is intended to be used for electricity. This power can
be generated by solar photovoltaic (PV), small wind
turbines, combined heat and power, fuel cells, and
micro-turbines. The largest percentage of this is by solar
PV, and the amount of solar PV has been steadily
increasing for the last several years. This generated
power is intended to be used at the source without
storage capacity such as batteries. The excess supplies
the local grid and reduces the energy that the utility
company is required to supply. United Sates solar PV
generation amounts to about 9 gigawatts annually and
in the next few years, it is expected to exceed 20
gigawatts.2
4.3 SOLAR IRRADIANCE
Solar irradiance is the light energy available from the
sun, as measured on earth, to be converted to electricity
by PV cells at the earth’s surface.3 This energy is uniform when measured in space, but the
energy varies when measured at the earth’s surface due to atmospheric effects. The
atmosphere plays a large role in the amount of solar irradiation available to the PV cells. In
Figure 2 the average solar irradiance is shown above
the atmosphere on the top, and after passing through
the atmosphere on the bottom. Part of the energy
reaches the earth’s surface is reflected and part is
absorbed. The portion that is absorbed is the portion
utilized by the PV cells.
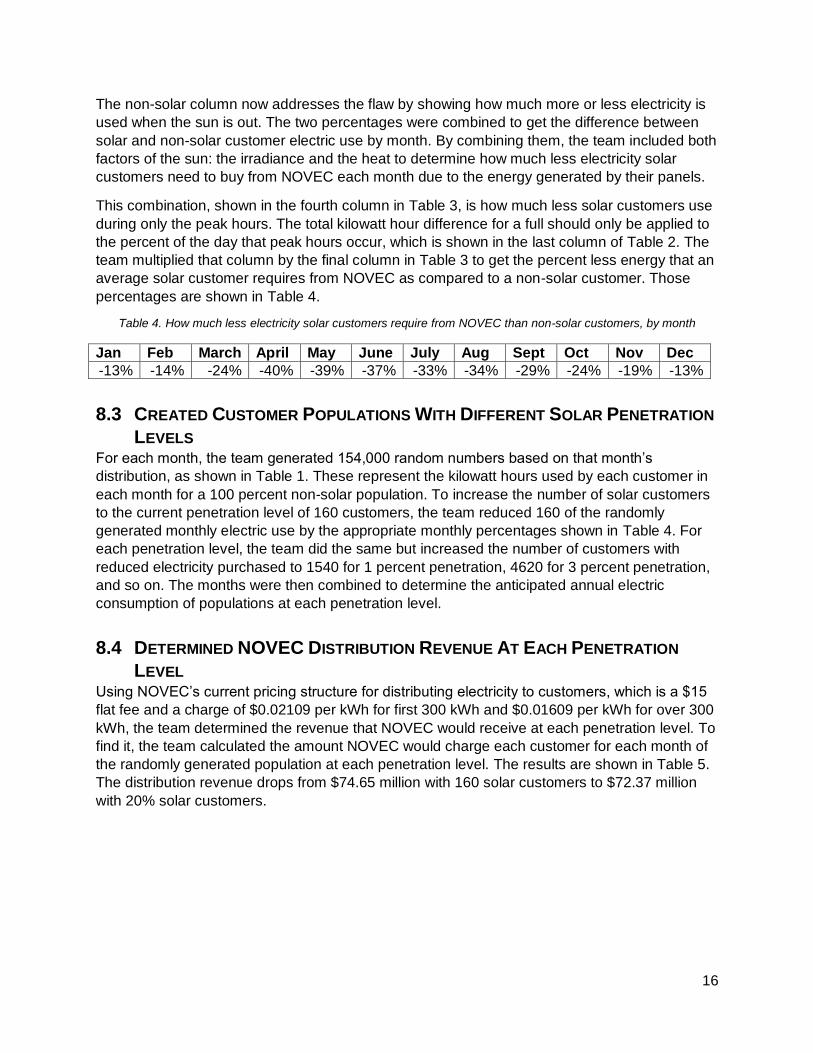
4.4 PHOTOVOLTAIC PANELS AND SYSTEMS The ability to convert the sun’s energy to electricity
using the PV effect wasn’t discovered until the early
19th century.4 The basic photovoltaic system is
comprised of PV modules (panels) and an inverter. A
PV module is an assembly of PV solar cells, which is
typically a package of connected six inch by 10 inch
2 American Public Power Association, Solar Distributed Generation, February 2016,
http://publicpower.org/files/spdfs/Final%20APPA%20Issue%20Brief%20for%20Solar%20Distributed%20
Generation.pdf.
3 National Aeronautics and Space Administration, Solar Irradiance, January 2008,
https://www.nasa.gov/mission_pages/sdo/science/solar-irradiance.html.
4 Asowata, Osamede, James Swart, and Chriso Pienaar, Correlating the Power Conversion of a PV Panel
to the Solar Irradiance Obtained from Meteonorm, February 2013,
http://ieeexplore.ieee.org/document/6505754/?reload=true.
Figure 3. Basic PV system (Source: DeGunther)

6
solar cells.5 The panels generate a direct current (DC), which the inverter converts to an
alternating current (AC). The AC power is fed into the fuse box. The output of today’s panels
typically range from 100 to 365 watts under standard test conditions, which is the best the
panels can produce under ideal conditions.6
The modules create PV systems that supply solar energy to commercial and residential
buildings. Adding these systems to a home or commercial building may lead to the utility meter
being change to a net meter to measure when power is being fed back onto the grid.
4.5 COST OF BUYING AND OWNING SOLAR PANELS When considering the cost of any system, operating and maintaining the system should be
factored into the equation. For solar panels, this cost is minimal.
The main cost associated with solar panels is purchase and installation, which ranges from
approximately $25,000 to $35,000.7 If the system is being installed on a roof, the age of the roof
should be a consideration. If the roof needs to be replaced during the life of the solar panels,
they will need to be removed, and reinstalled. Removing the panels costs between $300 and
$500, and assuming the cost to reinstall is similar, the total could approach $1,000.8 This should
be the main consideration related to the ongoing cost of owning solar panels.
Repair and cleaning costs should be negligible. PV systems do not tend to break because there
are no moving parts, and if something does break, the warranties usually cover many years
since the life expectancy of the system is 25 years.
Accumulation of dirt on the panels reduces their efficiency, but rain is very effective at keeping
them clean due to them being tilted to optimize sun collection. Even without rain, the efficiency
loss is small. During a 145 day drought in California, uncleaned solar panels lost 7.4 percent
efficiency.9 Since cleaning costs between $10 and $20 per panel, the solar customer is unlikely
to see a return on the investment and should wait for the next rain instead.
4.6 INCENTIVES Historically, there have been tax incentives at the federal, state, and local government levels for
the installation of residential solar panels. While most state incentives expired at the end of
2016, there are still federal and Prince William County incentives for installing residential solar
panels.
5 DeGunther, Rik, The Basic Components of a Home Solar Power System, Accessed on May 6, 2017,
http://www.dummies.com/home-garden/green-living/energy-sources/the-basic-components-of-a-home-solar-power-system/.
6 Sunrise Solar, Solar Panel, September 2016, http://www.sunrisesolarmd.com/news/solar-panel.
7 Solar Power Authority, How Much Does it Cost to Install Solar on an Average US House?, April 2016,
https://www.solarpowerauthority.com/how-much-does-it-cost-to-install-solar-on-an-average-us-house/.
8 Ioana Patringenaru (2013).
9 Patringenaru, Ioana, Cleaning Solar Panels Often Not Worth the Cost, Engineers at UC San Diego Find,
UC San Diego News Center, August 2013, http://ucsdnews.ucsd.edu/pressrelease/cleaning_solar_panels_often_not_worth_the_cost_engineers_at_uc_san_diego_fi.

7
At the Federal government level there is a 30 percent solar Investment Tax Credit (ITC) for
residential installation of solar panels through 2019. This drops to 26 percent in 2020, 22
percent in 2021, and then to zero after 2021. The ITC is based on the amount of investment in
solar property, which can include labor costs for preparing, installing and connecting the panels
to the home.10
Prince William County offers a tax exemption for installed certified solar energy equipment. This
exemption pertains to property tax, and is good for five years as long as the equipment is
operational during that year.11
5 PROBLEM
Network costs do not decrease as the proportion of solar panel users, also called the solar
penetration level, increases. As the solar penetration level increases, network costs could go up
due to a requirement for a more rigorous grid. Since the greater the penetration level, the less
total power consumed, the cost per kilowatt hour must increase in order to recover network
costs. The customers with solar generation capability are driving the increased costs and
transferring a large portion of those costs to the customers without solar generation. This could
drive the incentive to install more solar panels and force the cost of distribution higher, making
the NOVEC’s requirement of recovering its costs increasingly difficult.
Approximately 0.1 percent, or 160, of NOVEC’s residential customers own and operate solar
panels. This proportion is only expected to increase with a national interest in renewable
energy, expiring tax incentives, and the dropping cost of system acquisition and installation.
NOVEC asked the team to develop a model that considers different proportions of distributed
solar generation to determine a fair pricing structure, the goal being to recommend a method for
charging customers based on a combination of kilowatt hours used and the proportion of the
operations and infrastructure required from NOVEC.12 The result must both allow NOVEC to
meet the operational and financial requirements of a healthy utility provider and avoid
discouraging its customers to supplement power requirements through the installation of solar
panels.
The recommendation must determine whether there is a penetration level where NOVEC should
switch from charging customers by unit of energy to charging for the proportion of the system
used. The team does this by exploring solar penetration levels at one, three, five, 10, 15, and 20
percent. Each of these levels may have a different recommendation that includes changing the
cost per unit of energy consumed, creating a fee based on percent of system consumed, or a
combination of the two.
10
Department of Energy, Residential Renewable Energy Tax Credit, Accessed on May 7, 2017, https://energy.gov/savings/residential-renewable-energy-tax-credit.
11 Prince William County, Solar Exemption, Accessed on May 7, 2017,
http://www.pwcgov.org/government/dept/finance/pages/solar.aspx.
12 Massachusetts Institute of Technology, The Future of Solar Energy, 2015, https://energy.mit.edu/wp-
content/uploads/2015/05/MITEI-The-Future-of-Solar-Energy.pdf.

8
6 SCOPE
This project considers residential customers, who grow at a rate of between two and three
percent each year, rather than residential and commercial customers because there is
insufficient data available for commercial customers using solar generation.
The project also focuses on the cost of NOVEC’s operations and not on the cost of energy.
There are three electric energy price predictor variables that make the price of energy volatile
and difficult to predict: fuel, weather, and equipment outages. Predicting quantitative savings
from reduced energy purchases under these uncertainties could be its own semester-long
project, making it out of scope for this semester. Further, NOVEC has a solid methodology for
energy purchasing that involves accounting for solar users and the threat of weather and
outages through financial hedging and risk analysis. Therefore, the team focused on recovering
costs through changing the distribution cost structure rather than how and when NOVEC
purchases electricity.
6.1 PROJECT USE CASES NOVEC customers, solar and non-solar, have varying requirements of the electrical grid.
Ultimately, both customer sets require an electrical grid that can meet 100 percent of their
demand. The solar customer has an additional requirement of being able to pass excess energy
back to the electrical grid.
6.1.1 Use Case 1: No Solar
This use case describes a non-solar customer’s use of the electrical grid. The customer is 100
percent dependent on the grid, 100 percent of the time.
Figure 4. Use case 1
6.1.2 Use Case 2: Solar Without Sun
This use case describes a solar customer’s use of the electrical grid when the sun is not shining
(e.g. nights or cloudy days). The customer is 100% dependent on the grid.

9
Figure 5. Use case 2
6.1.3 Use Case 3: Solar with Sun and High Load
This use case describes a solar customer’s use of the electrical grid when the sun is shining
and the customer is in a time of high energy demand. The solar panel will meet a portion of the
demand and the customer is dependent on the electrical grid for the remainder of the
customer’s power needs.
Figure 6. Use case 3
6.1.4 Use Case 4: Solar with Sun and Low Load
This use case describes a solar customer’s use of the electrical grid when the sun is shining
and the customer is in a time of low energy demand. The solar panel will fully meet the
customer’s demand, and any excess power is provided back to the electrical grid.
Figure 7. Use case 4
6.2 PROJECT REQUIREMENTS The operational requirements include probability distributions based on current electricity
consumption on a monthly basis. Solar penetration levels shall be considered at 1%, 3%, 5%,
10%, 15%, and 20% of NOVEC customers. This will allow NOVEC to predict solar generation

10
consumption and determine the impact to its infrastructure requirements. The data to develop
these distributions was provided by NOVEC.
The financial requires include a cost recovery methodology, which provides NOVEC a cost
structure that gives a high probability of recovering all its operational cost on an annual basis.
The cost recovery methodology shall provide recommendations that continue to provide a
financial savings to the solar customer.
For the purpose of this project, the team assumed that NOVEC is required to purchase excess solar power at the same rate that it sells electricity to the solar customer and that solar users won’t increase the size of their solar panels. The team also assumed that NOVEC’s operating costs and total customer size will remain steady. Finally, the team also assumed that the data provided by NOVEC is a good representation of all NOVEC customers.
7 DATA COLLECTION AND UTILIZATION
NOVEC provided the data and documentation needed to complete the analysis. That
information and the portions the team used is explained below.
7.1 DATA ON ENERGY DELIVERED TO AND FROM NOVEC NOVEC provided a sample of the kilowatt hours of electricity that NOVEC delivered to 471 non-
solar customers. The data was given in hourly kilowatt hours delivered from January 1, 2014
through February 17, 2017. NOVEC provided a sample of 38 solar customers’ hourly kilowatt
hour use over the same time period. For solar, the data included the kilowatt hours NOVEC
delivered, the kilowatt hours the solar customer provided back to NOVEC and the net kilowatt
hours used by the solar customer. The team condensed the hourly non-solar customer electric
use into monthly kilowatt hours used.
The approximately three years of data was chosen as a result of the team studying whether
three years of irradiance is similar. The team collected the most current 10 years of irradiance
data they could find in the Northern Virginia area, 2001 through 2010. The team separated it
into months and found the average irradiance over the 10 years by month. The team then
calculated the average irradiance for each set of consecutive years for each month. Finally the
team determined the percent difference between each month for each set of three consecutive
years and that same month for the set of all 10 years. The largest difference in irradiance was in
the average of all January irradiance and January irradiance for 2001 through 2003, and the
difference was 0.16 percent. The team determined that irradiance stayed consistent in three-
year chunks over 10 years, so it would be unlikely for irradiance from 2014 through 2016 to vary
drastically. The team used this reasoning to ask for three years of data, which would also
provide a large sample without being too large to analyze in Excel.
7.2 DATA ON ENERGY DELIVERED TO NOVEC’S TOTAL CUSTOMER BASE Data for hourly total residential energy use from January 1, 2014 through February 17, 2017
was also provided by NOVEC. The data included the sum of hourly kilowatt hours that NOVEC
provided to its entire residential customer base.

11
NOVEC provided another breakdown of this data by residential class. This dataset is presented
in monthly kilowatt hours used by five groups of residential customers for 2014 through 2016. It
also provides the number of customers in each group. NOVEC had 152,478 residential
customers in December 2016. NOVEC’s customer base grows approximately 1 percent
annually, so the team conducted the analysis assuming a 154,000 residential customers.
7.3 FINANCIALS FOR 2014 AND 2015 The finance documentation included NOVEC’s revenues and expenses by month, divided by
commercial and residential sales. It also included the company’s net margins. The revenues
include distribution, electricity supply and other revenues. The team considered all revenues
other than those from the electricity supply since those are the operating and distribution
revenues. The expenses include purchasing electricity, distribution, interest on debt, taxes,
administrative, and other miscellaneous costs. The team considered all expenses other than the
transmission and distribution costs.
7.4 RESIDENTIAL RATES NOVEC published its rates on its website.13 The rates for residential services are Schedule R-1.
These rates apply to “residential customers, residential-farm customers, and churches located
on or near the Cooperative’s distribution lines.” There is a monthly rate of $15 plus a distribution
delivery charge and an electricity supply service charge. To deliver the energy, NOVEC charges
$0.02109 per kilowatt hour for the first 300 kilowatt hours or less and $0.01609 per kilowatt hour
for any additional kilowatt hours delivered. NOVEC charges $0.09731 per kilowatt hour for the
energy itself. The team used this pricing structure in its analysis to compare NOVEC’s current
revenue to possible future revenues with more solar panel users.
NOVEC also lists “Time-of-Use Pricing” on its website, where weekdays from June through
September, between 1pm and 6pm the energy charge is higher and during the remaining hours,
there is a discount.14 The team did not consider this pricing because it doesn’t apply to the
distribution and because the team studied monthly rather than hourly customer energy use.
8 METHODOLOGY
8.1 FOUND PROBABILITY DISTRIBUTIONS OF HISTORIC ELECTRIC USE The team used NOVEC’s data for kilowatt hours distributed to non-solar customers and
converted it from hourly data to monthly electric use per customer. With this data, the team used
R to find a probability distribution of historic non-solar customer electric use for each month.15
The first step for determining what distribution best fit our data was to obtain the Cullen and
Fray graph, seen in Figure 8, for each month. The Cullen and Fray graph plots the squared
13
Northern Virginia Electric Cooperative, Terms and Conditions for Providing Electric Service, August 2011, Pg. 45, https://www.novec.com/Customer_Services/upload/Terms-and-Conditions-with-VA-SCC-approved-for-filing-stamp.pdf. 14
Northern Virginia Electric Cooperative, Time-of-Use Pricing, accessed on April 29, 2017, https://www.novec.com/Save/tou.cfm. 15
See Appendix B for the code and a guide to using it.

12
kurtosis and the squared skewness against each other to see what distribution(s) are a likely fit.
For example, in Figure 8, the blue dot representing the team’s data falls between the lines that
represent lognormal and gamma. This indicates that our data is likely to follow a gamma,
lognormal, or Weibull distribution. The reason that the data may also fit a Weibull distribution is
because the estimate for a Weibull distribution falls somewhere between lognormal and gamma
on the Cullen Fray graph.
Figure 8. Cullen and Fray Graph for the month of June
Figure 9. June Weibull distribution fit check

13
Because the data most likely follows a Gamma, lognormal, or Weibull distribution, the next step
was to find which of the three distributions provides the best fit. The Q-Q and P-P plots indicate
that a Weibull distribution is a good fit for the data, which is shown in Figure 9.
Although the best fit for each month was not always a Weibull distribution, the team chose a
Weibull distribution for each month because it offered simplify without removing much accuracy.
The resulting distributions are shown in Table 1.16
Table 1. Shape and scale of Weibull distribution corresponding to kWh distributed to non-solar customers
Month Shape Scale
January 1.3006 2113.7
February 1.2987 1809.95
March 0.55083 987.134
April 1.7427 899.534
May 1.4933 1398.07
June 1.5802 1788.9
July 1.5873 2088.1
August 1.4423 1921.347
September 1.4694 1515
October 1.2853 1771
November 1.0624 999.411
December 1.3931 1461.8
8.2 DETERMINED HOW MUCH LESS ELECTRICITY SOLAR CUSTOMERS
PURCHASE FROM NOVEC THAN NON-SOLAR CUSTOMERS The solar customer sample size was too small to use the same probability distribution method
as for non-solar customers. Instead, the team used the solar and non-solar data for the amount
of kilowatt hours that NOVEC distributes to find the percent difference in electricity each
customer type uses during “peak” hours. The team defined peak hours differently for each
month by viewing the average kilowatt hours distributed to solar customers by NOVEC by the
hour and determining which hours had a noticeable drop in purchased power. These were
assumed to be the hours with sunlight and the hours that the solar panels were supplying
electricity. Table 2 shows which hours were considered peak in each month.
16
To see a graphical representation of all distributions and the fit tests conducted, see Appendix C.

14
Table 2. Peak hours for each month
Month Peak hours Number of peak hours
Percent of peak hours
January 1000-1700 8 33%
February 0900-1800 10 42%
March 0900-1800 10 42%
April 0800-1800 11 46%
May 0800-1700 10 42%
June 0800-1700 10 42%
July 0800-1700 10 42%
August 0800-1700 10 42%
September 0800-1700 10 42%
October 0800-1700 10 42%
November 0900-1700 9 38%
December 0900-1700 9 38%
To approximate how much less electricity solar customers use during the peak hours, the team
compared the average monthly kilowatt hours that solar customers bought from NOVEC during
peak and non-peak hours. This method is shown in Figure 10 for January.
Figure 10. January example for finding decrease in electricity that solar customers buy from NOVEC during peak hours
This method has a flaw, which the team addressed. The method assumes that in peak hours
customers will not use more electricity. This is a bad assumption because peak hours are
aligned with hours of sunlight, and in the summer, more electricity is used during the day. To

15
address the issue, the team completed the same calculation of removing peak hours and
comparing the difference in kilowatt hours purchased from NOVEC for non-solar customers.
This showed the difference in the amount of electricity the non-solar customers use during the
peak hours or daylight hours. In the winter, they use less electricity during the day because the
sun warms their homes and requires less heat. During the summer, they use more electricity
during the day also because the sun warms their homes and requires more air conditioning.
This step of the method is shown in Figure 11 for January.
Figure 11. January example for finding difference in electricity that non-solar customers buy from NOVEC during peak hours
To see the percent difference of solar-customer electric use from non-peak to peak and of the
non-solar user electric use from non-peak to peak for all months, see Table 3.
Table 3. Difference in electric bought between non-peak and peak hours for solar and non-solar customers
Month Solar Non-solar Difference between solar and non-solar
January -49% -10% -39%
February -50% -16% -34%
March -63% -6% -56%
April -82% 5% -87%
May -69% 25% -94%
June -49% 39% -88%
July -36% 42% -78%
August -38% 43% -81%
September -40% 30% -70%
October -51% 7% -58%
November -56% -6% -50%
December -38% -4% -34%
16
The non-solar column now addresses the flaw by showing how much more or less electricity is
used when the sun is out. The two percentages were combined to get the difference between
solar and non-solar customer electric use by month. By combining them, the team included both
factors of the sun: the irradiance and the heat to determine how much less electricity solar
customers need to buy from NOVEC each month due to the energy generated by their panels.
This combination, shown in the fourth column in Table 3, is how much less solar customers use
during only the peak hours. The total kilowatt hour difference for a full should only be applied to
the percent of the day that peak hours occur, which is shown in the last column of Table 2. The
team multiplied that column by the final column in Table 3 to get the percent less energy that an
average solar customer requires from NOVEC as compared to a non-solar customer. Those
percentages are shown in Table 4.
Table 4. How much less electricity solar customers require from NOVEC than non-solar customers, by month
Jan Feb March April May June July Aug Sept Oct Nov Dec
-13% -14% -24% -40% -39% -37% -33% -34% -29% -24% -19% -13%
8.3 CREATED CUSTOMER POPULATIONS WITH DIFFERENT SOLAR PENETRATION
LEVELS For each month, the team generated 154,000 random numbers based on that month’s
distribution, as shown in Table 1. These represent the kilowatt hours used by each customer in
each month for a 100 percent non-solar population. To increase the number of solar customers
to the current penetration level of 160 customers, the team reduced 160 of the randomly
generated monthly electric use by the appropriate monthly percentages shown in Table 4. For
each penetration level, the team did the same but increased the number of customers with
reduced electricity purchased to 1540 for 1 percent penetration, 4620 for 3 percent penetration,
and so on. The months were then combined to determine the anticipated annual electric
consumption of populations at each penetration level.
8.4 DETERMINED NOVEC DISTRIBUTION REVENUE AT EACH PENETRATION
LEVEL Using NOVEC’s current pricing structure for distributing electricity to customers, which is a $15
flat fee and a charge of $0.02109 per kWh for first 300 kWh and $0.01609 per kWh for over 300
kWh, the team determined the revenue that NOVEC would receive at each penetration level. To
find it, the team calculated the amount NOVEC would charge each customer for each month of
the randomly generated population at each penetration level. The results are shown in Table 5.
The distribution revenue drops from $74.65 million with 160 solar customers to $72.37 million
with 20% solar customers.

17
Table 5. NOVEC's expected revenue at each solar penetration level, as compared with current distribution revenue.
Solar penetration level and number of customers
Distribution revenue (in millions)
Current (160 customers) $74.65
1 percent (1,540 customers) $74.60
3 percent (4,620 customers) $74.37
5 percent (7,700 customers) $74.12
10 percent (15,400 customers) $73.54
15 percent (23,100 customers) $72.94
20 percent (30,800 customers) $72.37
It’s important to note that the distribution revenue isn’t divided by commercial and residential in
NOVEC’s 2014 or 2015 financials, which makes it difficult to compare NOVEC’s distribution
revenue to the revenue determined by the randomly generated population with 160 solar
customers.
About 60 percent of NOVEC’s 2015 electric sales came from residential customers, and 60
percent of NOVEC’s 2015 distribution revenue was about 58.25 million. Although this is not a
precise number, the approximation shows that the $74.65 million that came from the randomly
generated population is probably larger than NOVEC’s actual distribution revenue.
For this reason, the calculations for finding a new pricing structure are compared to $74.65
million, which is the revenue the team found for the randomly generated population with 160
solar customers. This is the revenue each pricing structure method will recover.
8.5 APPLIED NEW PRICING STRUCTURES All the pricing structure methods began with determining the difference in revenue with 160
solar customers and the revenue at each of the other solar penetration levels, shown in Table 5.
This is the amount the new pricing structure would need to charge in order for NOVEC to
continue recovering costs the way it currently is.
8.5.1 Flat fee increase
One method for increasing NOVEC’s revenue was to increase the flat fee to account for the
reduction in revenue as solar customers increase. This method was rejected because it puts the
bulk of the cost on non-solar customers.
8.5.2 Proportional increase for all customers
Another method was to increase the per kilowatt hour distribution charge proportionally to
account for the decrease in revenue. This method was also rejected because it also puts the
bulk of the cost on non-solar customers.
8.5.3 Proportional increase for only solar customers
The third method was increasing the per kilowatt hour distribution charge proportionally for only
the solar customers to account for the decrease in revenue. The table below shows the different
rates for each penetration level. The non-solar rate stayed consistently at $0.02109 per kilowatt
18
hour for the first 300 kilowatt hours or less and $0.01609 per kilowatt hour for any additional
kilowatt hours delivered, which matches the 160 solar customer level.
Table 6. Solar rates with proportional increase for only solar customers at each penetration level
Solar penetration level Solar rate (first 300 kWh) Solar rate (beyond 300 kWh)
160 customers $0.02109 $0.01609
1 percent $0.02366 $0.01866
3 percent $0.02571 $0.02071
5 percent $0.02653 $0.02153
10 percent $0.02653 $0.02153
15 percent $0.02668 $0.02168
20 percent $0.02666 $0.02166
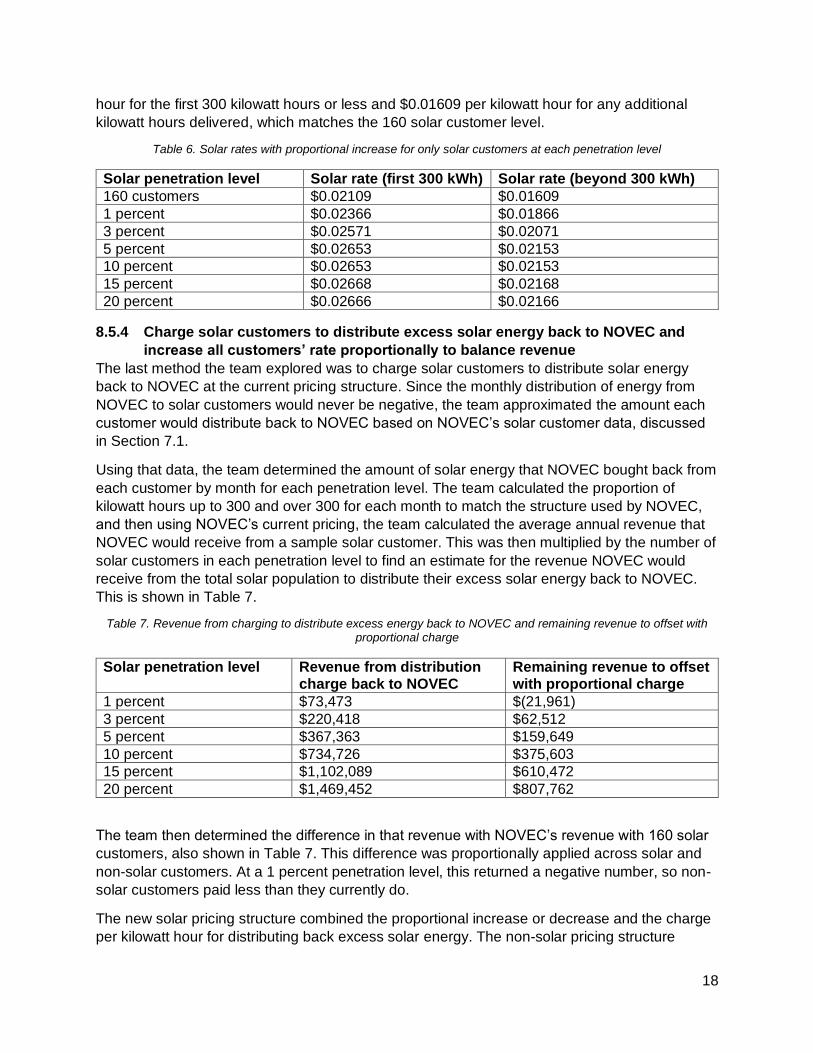
8.5.4 Charge solar customers to distribute excess solar energy back to NOVEC and
increase all customers’ rate proportionally to balance revenue
The last method the team explored was to charge solar customers to distribute solar energy
back to NOVEC at the current pricing structure. Since the monthly distribution of energy from
NOVEC to solar customers would never be negative, the team approximated the amount each
customer would distribute back to NOVEC based on NOVEC’s solar customer data, discussed
in Section 7.1.
Using that data, the team determined the amount of solar energy that NOVEC bought back from
each customer by month for each penetration level. The team calculated the proportion of
kilowatt hours up to 300 and over 300 for each month to match the structure used by NOVEC,
and then using NOVEC’s current pricing, the team calculated the average annual revenue that
NOVEC would receive from a sample solar customer. This was then multiplied by the number of
solar customers in each penetration level to find an estimate for the revenue NOVEC would
receive from the total solar population to distribute their excess solar energy back to NOVEC.
This is shown in Table 7.
Table 7. Revenue from charging to distribute excess energy back to NOVEC and remaining revenue to offset with proportional charge
Solar penetration level Revenue from distribution charge back to NOVEC
Remaining revenue to offset with proportional charge
1 percent $73,473 $(21,961)
3 percent $220,418 $62,512
5 percent $367,363 $159,649
10 percent $734,726 $375,603
15 percent $1,102,089 $610,472
20 percent $1,469,452 $807,762
The team then determined the difference in that revenue with NOVEC’s revenue with 160 solar
customers, also shown in Table 7. This difference was proportionally applied across solar and
non-solar customers. At a 1 percent penetration level, this returned a negative number, so non-
solar customers paid less than they currently do.
The new solar pricing structure combined the proportional increase or decrease and the charge
per kilowatt hour for distributing back excess solar energy. The non-solar pricing structure

19
increased or decreased only based on the proportional change. The different pricing structures
are shown in Table 8.
Table 8. Rates for solar and non-solar customers for the fourth method
Solar penetration level
Non-solar rate (first 300 kWh)
Non-solar rate (beyond 300 kWh)
Solar rate (first 300 kWh)
Solar rate (beyond 300 kWh)
160 customers $0.02109 $0.01609 $0.02109 $0.01609
1 percent $0.02108 $0.01608 $0.02474 $0.01974
3 percent $0.02111 $0.01611 $0.02471 $0.01971
5 percent $0.02115 $0.01615 $0.02475 $0.01975
10 percent $0.02123 $0.01623 $0.02483 $0.01983
15 percent $0.02132 $0.01632 $0.02492 $0.01992
20 percent $0.02140 $0.01640 $0.025100 $0.02000
9 ANALYSIS
The team analyzed the third and fourth pricing structure methods as described in sections 8.5.3
and 8.5.4. The other methods were rejected because they put the bulk of the cost on non-solar
customers. Both of the remaining methods have a different pricing structure for solar and non-
solar customers with solar customers paying for either all or more of the cost.
For both methods, the team analyzed the results to determine the difference in monthly
distribution payment to NOVEC for both solar and non-solar customers and the additional time it
would take for solar customers to see a return on their investment in solar panels.
9.1 AVERAGE DISTRIBUTION PAYMENT CHANGE To analyze the distribution payment change, the team calculated the average payment for solar
and non-solar customers at the current pricing structure and the two methods that were
determined to be fair. This is shown in Table 9.
Table 9. Average monthly distribution payment to NOVEC under different pricing structures
Current pricing structure
Proportional increase for only solar
Solar pays to distribute excess solar back and proportional increase to balance revenue
Solar penetration level
Non-solar
Solar Non-solar
Solar Non-solar Solar
160 customers $40.40 $34.17 N/A N/A N/A N/A
1 percent $40.43 $33.84 $40.43 $36.62 $40.42 $37.80
3 percent $40.43 $34.13 $40.43 $39.23 $40.46 $38.13
5 percent $40.42 $34.13 $40.42 $39.84 $40.64 $38.17
10 percent $40.42 $34.13 $40.42 $40.14 $40.76 $38.26
15 percent $40.40 $34.16 $40.40 $40.34 $40.87 $38.39
20 percent $40.41 $34.15 $40.41 $40.31 $41.00 $38.47

20
As the solar penetration level increases the non-solar and solar average NOVEC payments stay
approximately the same. They are slightly different due to the randomly generated kilowatt
hours used by each customer.
In the proportional increase for only solar customers option, the average non-solar charge stays
the same, which confirms that the calculations are correct. The solar charge increases with
each penetration level until 20 percent penetration, when it when decreases. The charge
increase ranges from about $33 annually at the 1 percent solar penetration level to about $74 at
the 15 percent solar penetration level.
In the charge solar customers to distribute excess solar back to NOVEC option, the average
non-solar customer saves 10 cents annually when the solar penetration is 1 percent. The
charge increases as the solar penetration level increases, with the highest average difference at
the 20 percent penetration level. At that level, the non-solar customer pays an average increase
of about $7 annually. The solar customer pays a fairly consistent level extra at all solar
penetration levels, ranging from about a $48 increase at 1 percent to about a $52 increase at 20
percent.
The first option is cheaper for solar customers at the 1 percent penetration level and more
expensive in all higher penetration levels. For non-solar customers, the cost increase in the
second option is small, about 60 cents per month.
9.2 MAXIMUM PAYMENT INCREASE The team also determined the maximum payment of solar and non-solar customers for each
pricing structure to understand the largest monthly increase that a customer would see, shown
in Table 10.
Table 10. Maximum monthly distribution payment to NOVEC under different pricing structures
Current pricing structure
Proportional increase for only solar
Solar pays to distribute excess solar back and proportional increase to balance revenue
Solar penetration level
Non-solar
Solar Non-solar
Solar Non-solar Solar
160 customers $1563.60 $360.34 N/A N/A N/A N/A
1 percent $1474.80 $488.61 $1474.80 $563.93 $1474.08 $595.81
3 percent $1189.61 $793.15 $1189.61 $1016.31 $1191.27 $968.10
5 percent $1379.99 $591.79 $1379.99 $776.50 $1800.84 $722.64
10 percent $1565.33 $693.85 $1565.33 $922.94 $2052.27 $851.33
15 percent $1610.80 $797.03 $1610.80 $1068.10 $2121.24 $982.65
20 percent $2148.20 $1004.72 $2148.20 $1347.11 $2843.73 $1244.63
The maximum solar customer kilowatt hour use varies substantially between penetration levels
because of the randomly generated populations. Typically, the larger the penetration level, the
21
larger the maximum because there are more opportunities to see a larger value as the randomly
generated population is created. The values should be compared across rows for this reason.
The customers who use the most electricity will see large increases in their monthly bills. For
example, the non-solar customer who uses the most electricity would pay almost $700, or 32
percent, more per month in the second option at a 20 percent penetration level. The average
customer would pay only 1.5 percent more.
The solar customer using the most electricity would pay about $240, or 24 percent, more per
month in the second option at a 20 percent penetration level. In the first option, the solar
customer would pay 34 percent more at the 20 percent solar penetration level. The average
customer would pay 18 percent more in the first option and 12 percent more in the second
option at the 20 percent level, which is closer to the increase that requires the most electricity
from NOVEC than it was for the non-solar customer.
The biggest takeaway from this analysis is that even small changes in the pricing structure can
have large impacts on customers who use a large amount of electricity. NOVEC could consider
another pricing structure where the charge to distribute over 300 kilowatt hours remains
unchanged or increases at a lower rate and the fee to distribute under 300 kilowatt hours is
where all or the majority of the cost increases.
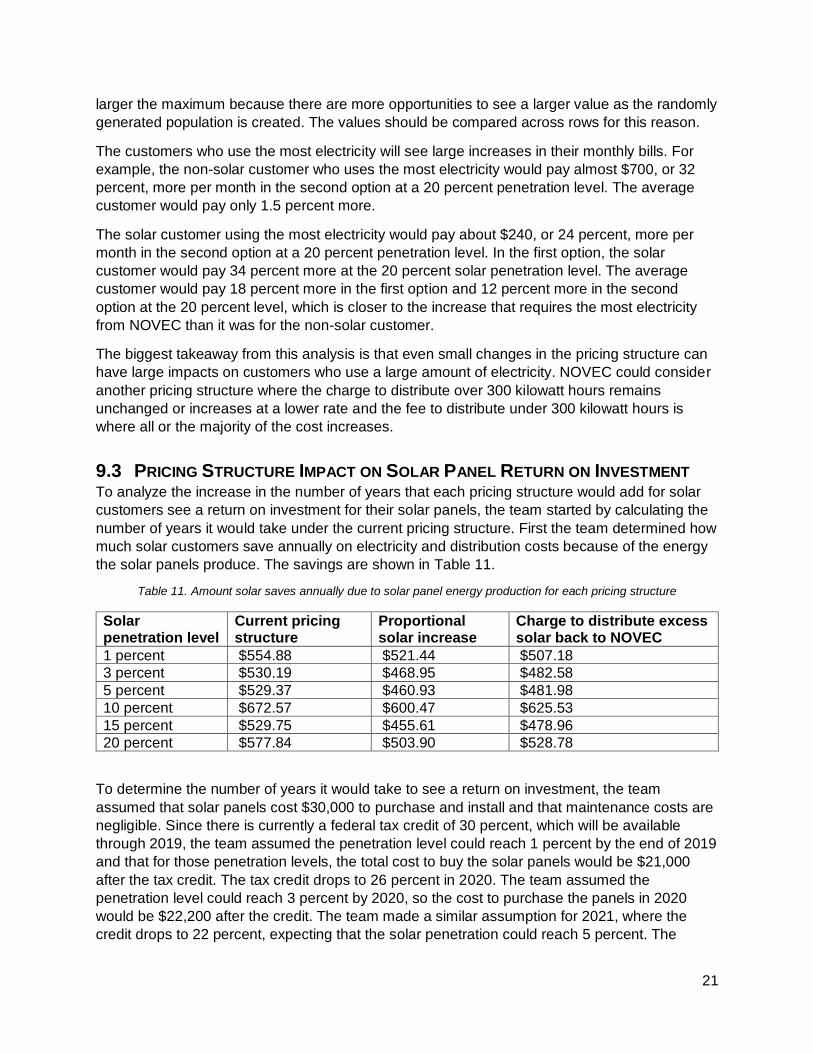
9.3 PRICING STRUCTURE IMPACT ON SOLAR PANEL RETURN ON INVESTMENT To analyze the increase in the number of years that each pricing structure would add for solar
customers see a return on investment for their solar panels, the team started by calculating the
number of years it would take under the current pricing structure. First the team determined how
much solar customers save annually on electricity and distribution costs because of the energy
the solar panels produce. The savings are shown in Table 11.
Table 11. Amount solar saves annually due to solar panel energy production for each pricing structure
Solar penetration level
Current pricing structure
Proportional solar increase
Charge to distribute excess solar back to NOVEC
1 percent $554.88 $521.44 $507.18
3 percent $530.19 $468.95 $482.58
5 percent $529.37 $460.93 $481.98
10 percent $672.57 $600.47 $625.53
15 percent $529.75 $455.61 $478.96
20 percent $577.84 $503.90 $528.78
To determine the number of years it would take to see a return on investment, the team
assumed that solar panels cost $30,000 to purchase and install and that maintenance costs are
negligible. Since there is currently a federal tax credit of 30 percent, which will be available
through 2019, the team assumed the penetration level could reach 1 percent by the end of 2019
and that for those penetration levels, the total cost to buy the solar panels would be $21,000
after the tax credit. The tax credit drops to 26 percent in 2020. The team assumed the
penetration level could reach 3 percent by 2020, so the cost to purchase the panels in 2020
would be $22,200 after the credit. The team made a similar assumption for 2021, where the
credit drops to 22 percent, expecting that the solar penetration could reach 5 percent. The

22
panels in 2020 would cost $23,400. After 2020, the credits are no longer offered. The team
assumed the solar population will not reach the 10, 15, or 20 percent penetration levels before
2020. Therefore the solar panels would cost the buyer the full $30,000 after 2020.
See section 4.5 for more information on the cost of owning solar panels. To calculate the
number of years before the owners see a return on investment, the team calculated the amount
solar customers currently save in distribution and energy costs. As a reminder, NOVEC charges
$0.09731 per kilowatt hour for the energy itself. The same method was used to determine the
years until return on investment with the two proposed pricing structure options. The results are
shown in Table 12.
Table 12. Years to see a return on solar panel investment and the increase in ROI for the proposed pricing structures
Solar penetration level
Current pricing structure (years)
Proportional solar increase (percent more years)
Charge to distribute excess solar back to NOVEC (percent more years)
1 percent 37.85 6% 9%
3 percent 41.87 13% 10%
5 percent 44.20 15% 10%
10 percent 44.61 12% 8%
15 percent 56.63 16% 11%
20 percent 51.92 15% 9%
The number of years to ROI are high at the current pricing structure since solar panels typically
last 25 years before needing to be replaced. This is probably the case for one of three reasons:
solar users didn’t purchase them to save money and instead purchased them for environmental
reasons, the cost or tax incentive assumptions are incorrect, or the data provided by NOVEC
didn’t provide a good sample of the difference in solar and non-solar use. It’s important to
compare the percent difference in the number of years at each of the penetration levels rather
than the exact number of years for this reason.
10 SENSITIVITY ANALYSIS
10.1 RESULTS WITH INCREASED EFFICIENCY One of the team’s assumptions was that the average solar panel used by NOVEC’s solar
customers would have an efficiency of 17 percent, which is typical according to solar panel
manufactures.17 The efficiency of a solar panel refers to the percentage of sunlight that reaches
a solar panel is converted into electricity. For a sensitivity analysis, the team studied the impact
that changing the average efficiency of solar panels would have on the results. This provides
NOVEC different pricing options if in the future it observes an increase in solar panel efficiency.
As solar users gain access to more efficient solar panels, they will need less electricity from
NOVEC and will sell back more electricity. Figure 12 shows that as solar users gain access to
more efficient solar panels, the fee that they pay for distribution will also increase.
17
Suniva, Suniva Optimum Series Monocrystalline Solar Modules, August 2015, http://sunelec.com/sunivaopt340specs.pdf.

23
Figure 12. Pricing options for increased solar panel efficiency
One of NOVEC’s goals is to not dissuade users from switching to solar panels. Although solar
users will be subjected to a higher distribution fee as solar panel efficiency increases, Figure 11
shows that solar users will still increase their yearly saving through reducing the cost of the
energy itself with more efficient solar panels.
Figure 13. Yearly savings for solar users
11 RECOMMENDATIONS
The team recommends either not changing the pricing structure or increasing the distribution
rate only for solar until somewhere between 1 and 3 percent. The exact penetration is an option
for future work. Before the 3 percent penetration level, the pricing increase for only solar is best
for solar customers and non-solar customers would stay at the same rate rather than getting a
discount. Solar customers would also have a shorter time until they get a return on their solar
panel investment.
At and above 3 percent solar penetration, the team recommends changing the pricing structure
to the option where NOVEC charges the solar customer to distribute excess solar energy to
NOVEC to make up for a portion of the lost revenue and the remaining revenue is recovered
through a proportional increase to all customers. The solar customer will still see savings

24
through a decrease in the electricity charge per kilowatt hour. This method puts the majority of
the increased cost on solar customers while choosing the option with the fewer years before
they see a return on investment. Table 13 provides the recommended pricing structure at each
penetration level. At all penetration levels, NOVEC would still charge a flat $15 each month and
would still charge $0.09731 for each kilowatt of electricity consumed.
Table 13. Recommended pricing structure at each penetration level
Solar penetration level
Non-solar rate (first 300 kWh)
Non-solar rate (beyond 300 kWh)
Solar rate (first 300 kWh)
Solar rate (beyond 300 kWh)
160 customers $0.02109 $0.01609 $0.02109 $0.01609
1 percent $0.02109 $0.01609 $0.02366 $0.01866
3 percent $0.02111 $0.01611 $0.02471 $0.01971
5 percent $0.02115 $0.01615 $0.02475 $0.01975
10 percent $0.02123 $0.01623 $0.02483 $0.01983
15 percent $0.02132 $0.01632 $0.02492 $0.01992
20 percent $0.02140 $0.01640 $0.025100 $0.02000
12 LIMITATIONS
There were a couple of limitations, and the team recommended ways to address them in the
Future Work section. First, the sample data wasn’t a good representation of total population.
The team received about three years of data for 450 non-solar customers and 38 solar
customers. The sample population led to a distribution that used 13 percent more kWh annually
than residential totals. The difference ranged from 15 percent less and 41 percent more
depending on the month.
The second limitation is that the non-solar data consisted of almost 4 million entries, which
made the data difficult to work with in Excel. The team moved the data to R in order to sort, filter
and clean up the data. Since not all teammates had the technical expertise to use R or another
programming language, the team then continued the work in Excel, and the spreadsheets were
very slow and difficult to use.
13 FUTURE WORK
The team conceived a number of ideas for follow-on work through research and discussions
with the project sponsor. These ideas were either out of scope or there was not enough time
remaining to explore them. The team recommends that either a future George Mason University
team or NOVEC considers the following options.
As a fifth pricing structure option, a future team could separate the solar population into different
groups based on solar use to explore charging each group a different rate. This would allow
NOVEC to charge a higher rate to solar customers with larger houses who would likely require
more electricity from NOVEC during hours without much sunlight, therefore requiring more of
NOVEC’s infrastructure. This may be an even fairer way to distribute the cost.

25
As a sixth pricing structure option, NOVEC could consider another keeping the rate to distribute
over 300 kilowatt hours the same or increase it at a lower rate and increasing the fee to
distribute under 300 kilowatt hours only or more rapidly.
To expand upon the current recommendation, another project could find the exact penetration at
which it is best to switch from the option that increases only the solar costs and the one that
charges solar customers to distribute the excess energy back to NOVEC.
As another method for determining the amount of electricity the solar customers’ panels
produce, NOVEC could convert the historical monthly irradiance to the electricity a typical
residential solar panel would produce. The decrease in monthly solar use could be used to
increase the solar penetration level.
Three options arose as possibilities for the future even though they are not issues currently. It
would be interesting to study customers who are able to store their excess solar energy, the
difference in NOVEC’s revenue if it was not required by law to buy back excess solar energy,
and the impact is residential customers bought larger solar panels that produce more energy.
Two options arose as ways to improve the results. First, because the sample data provided by
NOVEC didn’t align with the data for the full residential population, the team recommends using
the methodology outlined in this paper with the data for all residential customers to find the
results with more accurate data. Secondly, to speed up the analysis, NOVEC would benefit from
moving the Excel files into a database or code.

26
14 APPENDIX A: PROJECT PLAN
The project plan defines the work to be completed, assigns resources, coordinates the
execution, and defines the method of tracking the progress. The team scoped the project to take
approximately 15 weeks to complete on a part time basis by a team of three. The team was two
operations research students and one systems engineering student. A combined work
breakdown structure (WBS) and Gantt chart are shown in Figure 14. The team tracked the
project was using earned value management (EVM). The team initially scheduled the project to
conclude on May 16 after 321.75 hours of effort. As the project progressed, some tasks were
removed to make the May 8 deadline and hours were adjusted to 297.25 hours.

14.1 WORK BREAKDOWN STRUCTURE AND SCHEDULE The work breakdown structure (WBS) is developed by identifying the components required to complete the effort and dividing those
components into manageable work sets. The main components of this effort were project management, research, analysis, and
reporting. The WBS for this effort is shown in Figure 14 with the associated schedule in the form of a Gantt chart.
Figure 14. Work breakdown structure and Gantt chart

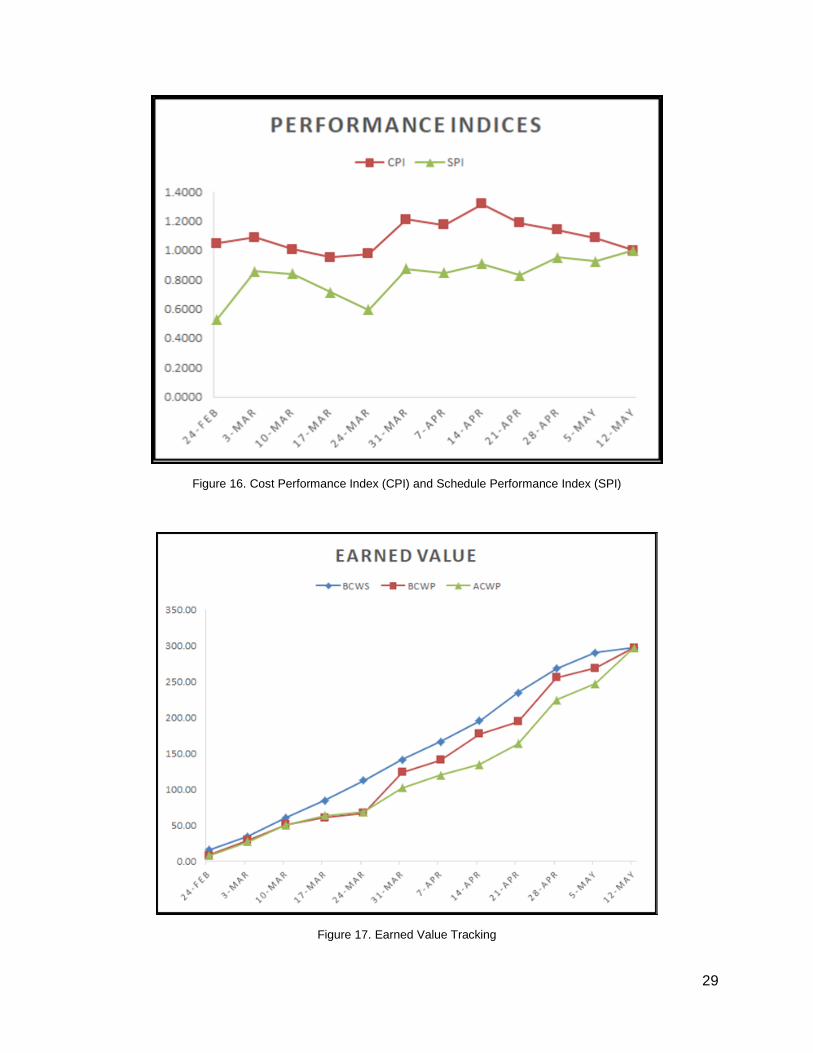
14.2 EARNED VALUE MANAGEMENT
EVM is a method of tracking progress towards a project’s completion. With the effort broken
down into the WBS above, each work package is assigned a value. As a work package is
completed, the project earns the value of that package. The work completed is continuously
compared to the work scheduled and the cost of the work completed.
Figure 15. Weekly tracking of the DSG Team’s performance against Cost and Schedule.
Acronyms
BCWS – Budgeted Cost of Work Scheduled
BCWP – Budgeted Cost of Work Performed
ACWP – Actual Cost of Work Performed
CV – Cost Variance (BCWP – ACWP)
CPI – Cost Performance Index (BCWP/ACWP)
SV – Schedule Variance (BCWP – BCWS)
SPI – Schedule Performance Index (BCWP/BCWS)
29
Figure 16. Cost Performance Index (CPI) and Schedule Performance Index (SPI)
Figure 17. Earned Value Tracking
30
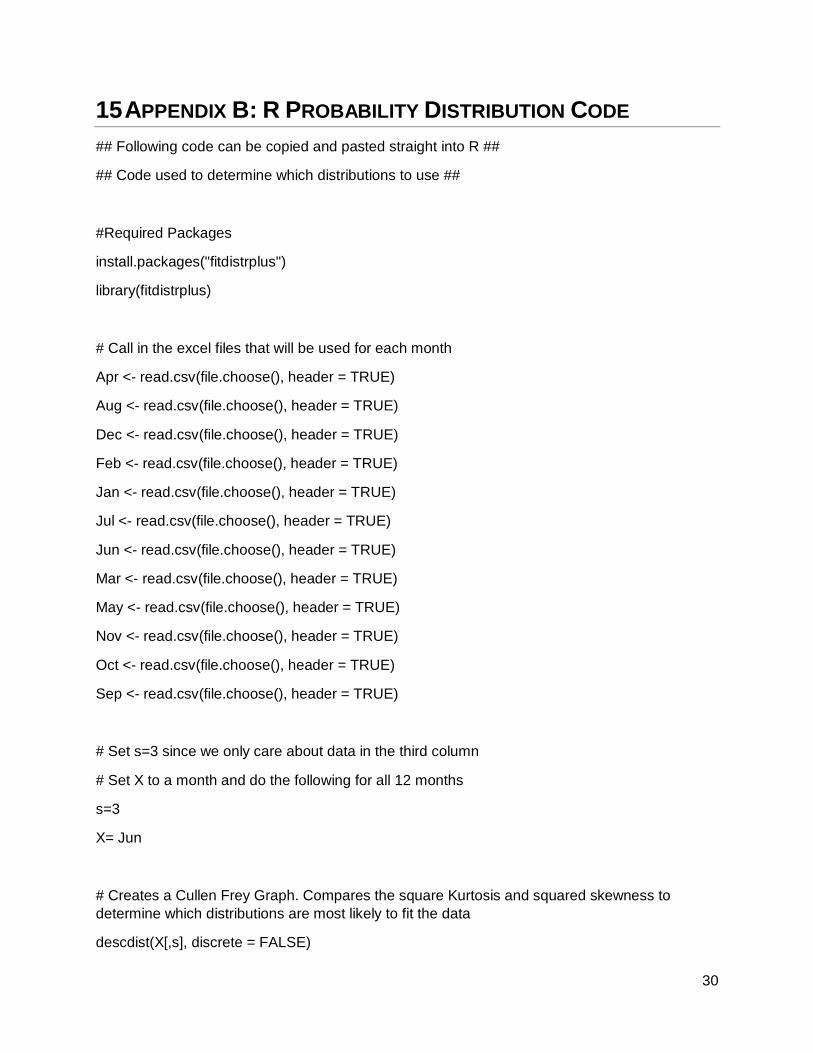
15 APPENDIX B: R PROBABILITY DISTRIBUTION CODE
## Following code can be copied and pasted straight into R ##
## Code used to determine which distributions to use ##
#Required Packages
install.packages("fitdistrplus")
library(fitdistrplus)
# Call in the excel files that will be used for each month
Apr <- read.csv(file.choose(), header = TRUE)
Aug <- read.csv(file.choose(), header = TRUE)
Dec <- read.csv(file.choose(), header = TRUE)
Feb <- read.csv(file.choose(), header = TRUE)
Jan <- read.csv(file.choose(), header = TRUE)
Jul <- read.csv(file.choose(), header = TRUE)
Jun <- read.csv(file.choose(), header = TRUE)
Mar <- read.csv(file.choose(), header = TRUE)
May <- read.csv(file.choose(), header = TRUE)
Nov <- read.csv(file.choose(), header = TRUE)
Oct <- read.csv(file.choose(), header = TRUE)
Sep <- read.csv(file.choose(), header = TRUE)
# Set s=3 since we only care about data in the third column
# Set X to a month and do the following for all 12 months
s=3
X= Jun
# Creates a Cullen Frey Graph. Compares the square Kurtosis and squared skewness to
determine which distributions are most likely to fit the data
descdist(X[,s], discrete = FALSE)

31
# All 12 months for our data seemed to be a close fit to either lognormal, gamma, or weibull
fit.g <- fitdist(X[,s], "gamma",method = "mme")
fit.ln <- fitdist(X[,s], "lnorm")
fit.w <- fitdist(X[,s], "weibull")
# Check the fit for the three possible distributions
plot(fit.g)
plot(fit.ln)
plot(fit.w)
# qqplot(X[,s], y=1:5,distribution = "weibull", scale=837, shape=1.3, las=1, pch=19)
# Used to determine the scale and shape for each month assuming that they have a weibull
distribution
fitdistr(Jan[,s], densfun="weibull", lower = 0)
fitdistr(Feb[,s], densfun="weibull", lower = 0)
fitdistr(Mar[,s], densfun="weibull", lower = 0)
fitdistr(Apr[,s], densfun="weibull", lower = 0)
fitdistr(May[,s], densfun="weibull", lower = 0)
fitdistr(Jun[1:549,s], densfun="weibull", lower = 0) #the last data point in June was causing
some issues
fitdistr(Jul[,s], densfun="weibull", lower = 0)
fitdistr(Aug[,s], densfun="weibull", lower = 0)
fitdistr(Sep[,s], densfun="weibull", lower = 0)
fitdistr(Oct[,s], densfun="weibull", lower = 0)
fitdistr(Nov[,s], densfun="weibull", lower = 0)
fitdistr(Dec[,s], densfun="weibull", lower = 0)
32
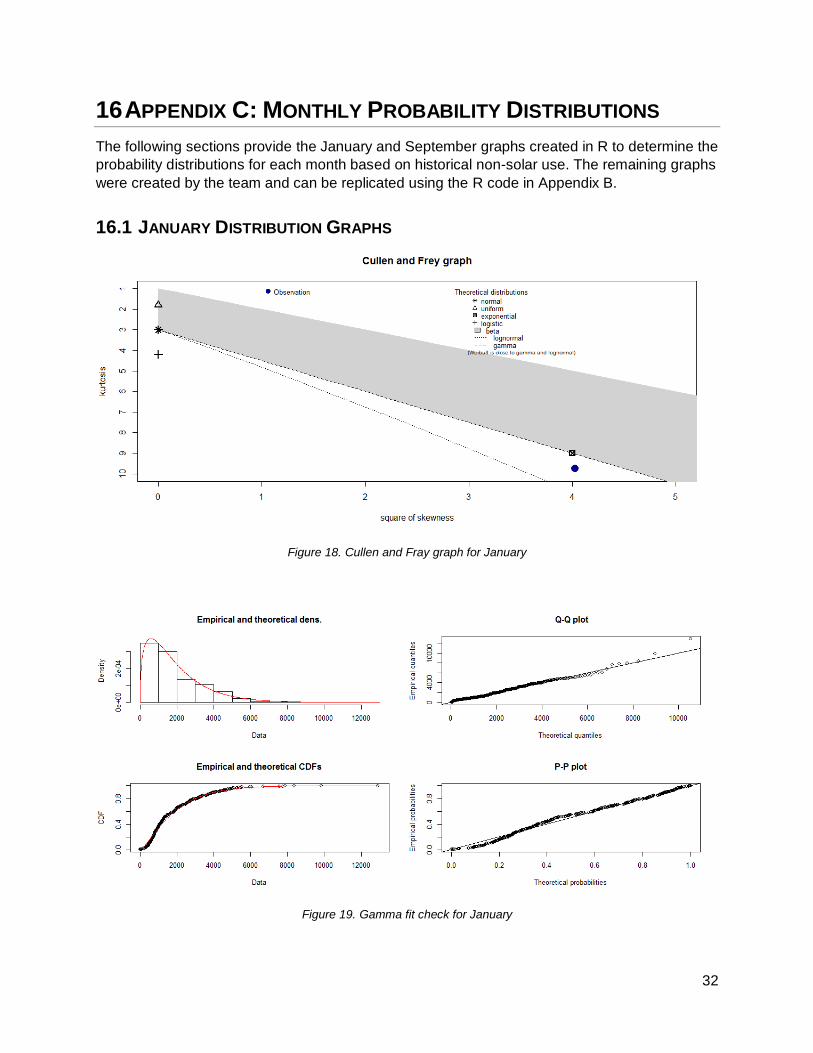
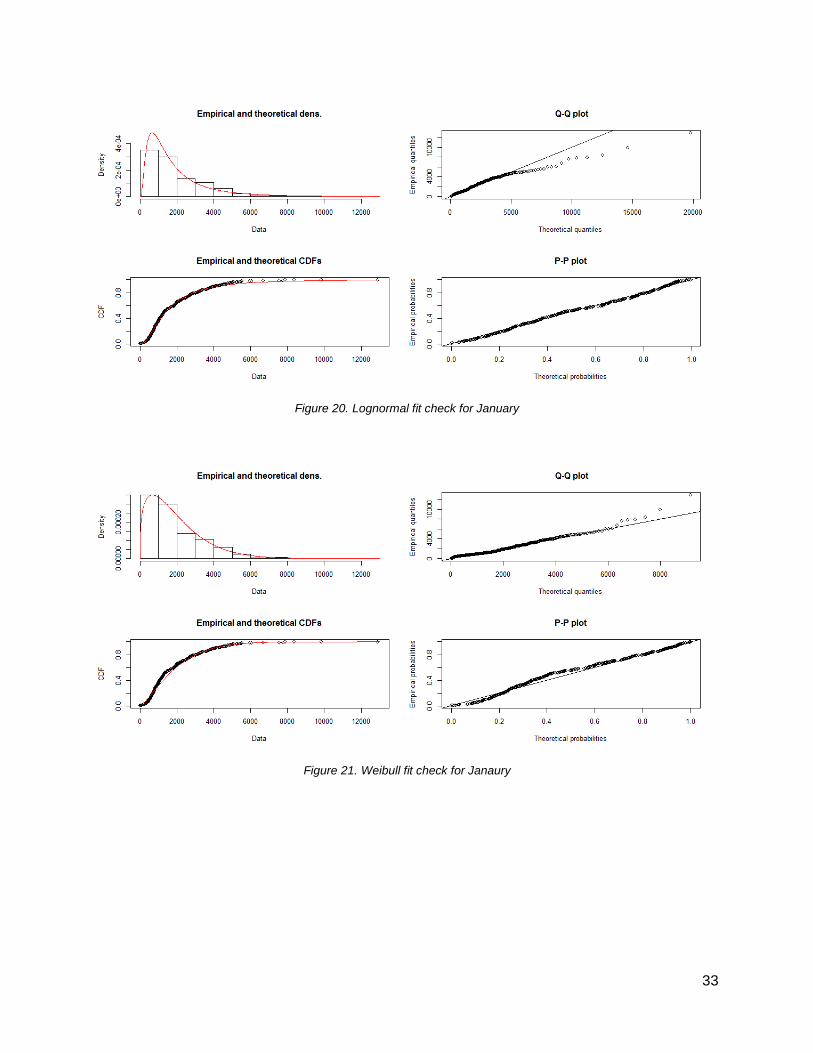
16 APPENDIX C: MONTHLY PROBABILITY DISTRIBUTIONS
The following sections provide the January and September graphs created in R to determine the
probability distributions for each month based on historical non-solar use. The remaining graphs
were created by the team and can be replicated using the R code in Appendix B.
16.1 JANUARY DISTRIBUTION GRAPHS
Figure 18. Cullen and Fray graph for January
Figure 19. Gamma fit check for January
33
Figure 20. Lognormal fit check for January
Figure 21. Weibull fit check for Janaury

34
16.2 SEPTEMBER DISTRIBUTION GRAPHS
Figure 22. Cullen and Fray graph for September
Figure 23. Gamma fit check for September

35
Figure 24. Lognormal fit check for September
Figure 25. Weibull fit check for September

36
17 APPENDIX D: TEAM BIOGRAPHIES AND ROLES
LAURA CRISTE Laura Criste is a federal market analyst with Bloomberg Government focusing on information
technology and homeland security. She studies and reports on government contract spending
and writes a weekly column called “This Is IT.” Previously, she was an analyst at ANSER’s
homeland security federally funded R&D center. There, she informed homeland security
strategy, including the 2014 Quadrennial Homeland Security Review, by examining activities,
mandates, budgets, and threats. Laura has a bachelor’s degree in economics and physics from
the University of Virginia and is completing a masters in operations research at George Mason
University.
During this master’s project for NOVEC, Laura took the lead in developing the methodology and
analyzing the data to determine alternative pricing structures. She also took the lead on creating
and presenting the progress and results.
JOSH GRANT Josh Grant is developing the role of supply chain analyst for Springs Window Fashions in
Middleton, Wisconsin. He is completing a masters of operations research at George Mason
University. Josh previously interned with the Center for Army Analysis Operations Analysis
Division while earning his undergraduate degree in civil engineering and mathematics at the
Virginia Military Institute.
For the Distributed Solar Generation project, Josh completed the sensitivity analysis and
aggregated the monthly distributions of electric energy use by NOVEC customers.
JOHN HOFFMAN John Hoffman is a 27-year professional currently working for a Federal Government Contractor
in a Systems Engineering and Technical Assistance (SETA) role. He obtained his Project
Management Professional (PMP) accreditation in 2009 from the Project Management Institute
(PMI), and is currently completing a Masters in Systems Engineering at George Mason
University.
John’s contributions to the Distributed Solar Generation project include developing the project
structure and schedule, tracking and reporting team progress, developing the framework and
drafting of the deliverables, and building the final website.


