PROJECT DESIGN DOCUMENT (PDD) - CDM Loan … design document form for small-scale CDM project...
44
CDM-PDD-SCC-FORM Version 05.0 Page 1 of 44 Project design document form for small-scale CDM project activities (Version 05.0) PROJECT DESIGN DOCUMENT (PDD) Title of the project activity 11.35 MW bundled renewable energy based power generation by Interocean Group Version number of the PDD 01 Completion date of the PDD 04/02/2015 Project participant(s) Interocean Shipping (I) Pvt. Ltd. Host Party India (host) Sectoral scope and selected methodology(ies), and where applicable, selected standardized baseline(s) Sectoral Scope-I: Energy industries (renewable/non- renewable sources) Methodology: AMS.I.D: “Grid connected renewable electricity generation” Reference: Version-18, EB-81, valid from– 28/11/2014 Estimated amount of annual average GHG emission reductions The annual average emission reductions of the project activities over the crediting period of 7 years are expected to be 20648 tCO 2 e.
Transcript of PROJECT DESIGN DOCUMENT (PDD) - CDM Loan … design document form for small-scale CDM project...

CDM-PDD-SCC-FORM
Version 05.0 Page 1 of 44
Project design document form for small-scale CDM project activities
(Version 05.0)
PROJECT DESIGN DOCUMENT (PDD)
Title of the project activity 11.35 MW bundled renewable energy based power generation by Interocean Group
Version number of the PDD 01
Completion date of the PDD 04/02/2015
Project participant(s) Interocean Shipping (I) Pvt. Ltd.
Host Party India (host)
Sectoral scope and selected methodology(ies), and where applicable, selected standardized baseline(s)
Sectoral Scope-I: Energy industries (renewable/non-renewable sources) Methodology: AMS.I.D: “Grid connected renewable electricity generation”
Reference: Version-18, EB-81, valid from– 28/11/2014
Estimated amount of annual average GHG emission reductions
The annual average emission reductions of the project activities over the crediting period of 7 years are expected to be 20648 tCO2e.

CDM-PDD-SCC-FORM
Version 05.0 Page 2 of 44
SECTION A. Description of project activity
A.1. Purpose and general description of project activity >> The proposed project activity is a bundle project activity involves installation and operation of 5 number of Wind Turbine Generators (WTGs) having individual capacity 2*2000kW (G97) & 1*850kW manufactured and supplied by Gamesa Wind Turbines Pvt. Ltd, 1*2000kW manufactured and supplied by Inox Wind, 1*1500kW manufactured and supplied by Regen and 3 MW solar PV with aggregated installed capacity of 11.35MW in Madhya Pradesh, Maharashtra and Karnataka state of India. The proposed project activity is promoted by Interocean Shipping India Pvt. Ltd. and Interocean Shipping Company with a view to align itself with sustainable development policies of India has undertaken this project to produce green power using wind as an energy source. Description of Project Activity: The project activity has been undertaken to harness the available wind/solar power potential to generate clean power Madhya Pradesh, Maharashtra and Karnataka. The project activity will install and operate 5 number of sophisticated, state-of art Wind Turbine Generators (WTG) consisting of 3*2000kW, 1*1500kW and 1*850kW with installed capacity of 8.35 MW and 3MW solar PV based power generation project with aggregated installed capacity of bundle as 11.35 MW. The project will generate approximately 21234MWh of electricity per annum, which will be sold to state electricity board of Madhya Pradesh, Maharashtra and Karnataka states of India. The WTGs in state of Madhya Pradesh and Maharashtra are connected to NEWNE regional grid and 3 MW solar PV in Karnataka State is connected to Southern regional grid of India. The project activity will displace approximately 4599MWh from Southern Grid and 16635MWh from NEWNE grid. The project activity will help in green house gas (GHG) emission reduction by using renewable resources (wind energy) for generating power which otherwise would have been generated using grid mix power plants, which is dominated by fossil fuel based thermal power plants. The project activity is a green field project aimed at utilising wind to produce power. The technological details have been provided in Section A.4.3. The project activity doesn’t involve any GHG emission sources. The estimated annual average and the total CO2e emission reduction by the project activity over the first renewable crediting period of 7 years are expected to be 20648tCO2e and 144536tCO2e respectively. The spatial extent of project boundary is the Southern grid and NEWNE. The project activity will supply electricity to respective grid through transmission lines connected through sub-stations.
Since the project activity will generate electricity through wind energy, a clean renewable energy source it will not cause any negative impact on the environment and thereby contributes to climate change mitigation efforts.
Unique ID Village District State Owner
WTG1-GAL16 (0.85MW)
Bhindewade Kolhapur Maharashtra Interocean Shipping Company
WTG2-R91 (2MW) Chandgarh Dewas Madhya Pradesh Interocean Shipping (I) Pvt. Ltd.
WTG3-Gch113N (2MW)
Chandgarh Dewas Madhya Pradesh Interocean Shipping Company
WTG4-Rh5_05 (1.5MW)
Hatuniya Mandsaur Madhya Pradesh Interocean Shipping Company
WTG5-(2MW) Nipaniya Mandsaur Madhya Pradesh Interocean Shipping Company
3MW Solar Chelur Hobli Chikkaballapur Karnataka Interocean Shipping (I) Pvt. Ltd.

CDM-PDD-SCC-FORM
Version 05.0 Page 3 of 44
Pre-project Scenario/Baseline Scenario: In the pre project scenario, the equivalent amount of electricity would have been generated by grid connected fossil fuel based power plants. The project activity is a Greenfield project activity with no power generation facility existing at the project site in the pre-project scenario. In the pre-project scenario equivalent amount of electricity that would be generated by the project activity and sold to southern grid, would have been generated by grid mix power plants, which is dominated by fossil fuel based thermal power plan. As established in section B.4, the baseline scenario for the project activity is same as continuation of the pre-project scenario wherein equivalent amount of electricity shall be generated from carbon intensive southern grid and NEWNE grid. The project activity will thus reduce the anthropogenic emissions of Green House Gases (GHGs) in to the atmosphere associated with the equivalent amount of electricity generation from the fossil fuel based grid connected power plant. Project’s Contribution to Sustainable Development Indian economy is highly dependent on “Coal” as fuel to generate energy and for production processes. Thermal power plants are the major consumers of coal in India and yet the basic electricity needs of a large section of population are not being met. This results in excessive demands for electricity and places immense stress on the environment. Changing coal consumption patterns will require a multi-pronged strategy focusing on demand, reducing wastage of energy and the optimum use of renewable energy (RE) sources.
Government of India has stipulated following indicators for sustainable development in the interim approval guidelines1 for CDM projects.
1. Social well-being The proposed CDM project activity leads to direct and indirect employment benefits accruing out of ancillary units for manufacturing towers for erecting the WTG and mounting structure for solar PV and for maintenance during operation of the project activity; It will lead to development of infrastructure around the project area in terms of improved road network etc. and will also improve in availability of electricity to the region.
2. Economical well-being
Being a renewable resource, using wind and solar energy to generate electricity contributes to conservation precious natural resources. The project contributes to the economic sustainability through promotion of decentralization of economic power, leading to diversification of the national energy supply, which is dominated by conventional fuel based generating units. Locally, improvement in infrastructure will provide new opportunities for industries and economic activities to be setup in the area. Apart from getting better employment opportunities, the local people will get better prices for their land, thereby resulting in overall economic development.
3. Environmental well-being
The project utilizes wind energy for generating electricity which is a clean source of energy. The project activity will not generate any air pollution, water pollution or solid waste to the environment which otherwise would have been generated through fossil fuels. Also it will contribute to reduction GHG emissions. Thus the project causes no negative impact on the surrounding environment contributing to environmental well-being.
4. Technological well-being
1 Designated National Authority (CDM India) web site: http://www.cdmindia.gov.in/approval_process.php

CDM-PDD-SCC-FORM
Version 05.0 Page 4 of 44
The project activity employs state of art technology i.e. 2MW WTGs which has high power generation potential with optimised utilization of land. Also the solar PV project is a emerging technology and will lead to penetration of solar technology in the region. Hence, the project leads to technological well-being.
In view of the above, the project participant considers that the project activity profoundly contributes to the sustainable development.
A.2. Location of project activity
A.2.1. Host Party >> India
A.2.2. Region/State/Province etc. >> Madhya Pradesh Maharashtra Karnataka
A.2.3. City/Town/Community etc. >>
Village-Bhendewade, District- Kolhapur, Maharashtra, India
Village-Chandgarh, District-Dewas, Madhya Pradesh, India
Village-Hatuniya, District- Mandsaur, Madhya Pradesh, India
Village-Nipaniya, District- Mandsaur, Madhya Pradesh, India Village-Chelur Hobli, District-Chikkaballapur, Karnataka, India
A.2.4. Physical/Geographical location >> Chandgarh, Hatuniya and Nipaniya villages are located in Dewas and Mandsaur district of Madhya Pradesh state about 50-80 km from Indore, nearest airport is at Indore and nearest railway station is Dewas. Bhindewadi is located in Kolhapur district, Maharashtra, nearest nearest airport is Kolhapur about 40 km. Chelur Hobli is located in Chikkaballapur district of Karnataka State, and nearest airport is Bengluru.
The physical address and geographic co-ordinate of WTGs under the project is provided below.
Unique ID Longitude Latitude Address
WTG1-GAL16 730 55’ 43.3” E 160 59’ 33” N Bhindewade, Kolhapur, Maharashtra
WTG2-R91 760 22’ 30” E 230 09’ 18”N Chandgarh, Dewas, Madhya Pradesh
WTG3-Gch113N 760 15’ 46” E 220 09’ 57” N Chandgarh, Dewas, Madhya Pradesh
WTG4-Rh5_05 750 12’ 2.6” E 230 49’ 40” N Hatuniya, Mandsaur, Madhya Pradesh
WTG5- 750 33’ 32” E 240 11’ 42” N Nipaniya, Mandsaur, Madhya Pradesh
3MW Solar 770 48’ 11” E 130 45’ 42” N Chelur Hobli, Chikkaballapur, Karnataka

CDM-PDD-SCC-FORM
Version 05.0 Page 5 of 44
Project sites
A.3. Technologies and/or measures >> According to Appendix B of the Simplified Modalities and Procedures (M&P) for small-scale CDM project activities, the project activity falls under:
Type: I-Renewable Energy Projects
Category: AMS I. D. - Grid connected renewable electricity generation
Technology/Measure Wind power technology details – The technology employed, converts wind energy to electrical energy. In wind power generation, energy of wind is converted into mechanical energy and subsequently into electrical energy. The project activity is the installation of an environmentally

CDM-PDD-SCC-FORM
Version 05.0 Page 6 of 44
safe and sound technology since there are no GHG emissions associated with the electricity generation. The technical specifications of the WTGs have been provided as below.
Turbine model DF 2000 Inox V87 Regen G97 Gamesa
Rated power 2000 kW 1500 kW 2000 kW
Rotor diameter 93.3 m 87 m 97m
Hub height 80 m 85 m 90 m
Turbine Type TC III B GL III B Horizontal axis wind
turbine with variable rotor speed
Rated rotational speed 15.9 9-17.3 rpm 9.6-17.8 rpm
No of Blades 3 3 3
Wind cut in speed 3 3 m/s 3 m/s
Rated wind speed 11.5 12 m/s 12 m/s
Cut out wind speed 20 22 m/s 22 m/s
Gear box type 2 planetary & 1 parallel shaft
--- 3 stages (1 planetary & 2 parallel)
Generator type
Double fed induction generator
Variable Speed, Multipole Synchronous with Permanent Magnet Excitation
Doubly-fed machine
Braking
Aerodynamic Brake, Full span independent blade pitching, mechanical disc brakes
Aerodynamic Brake, Single Pitch Control/triple redundant
Aerodynamic and emergency mechanical
Output Voltage 690V 690V 690V
Turbine model G-58 Gamesa
Rated power 850 kW
Rotor diameter 58 m
Hub height 71 m
Turbine Type --
Rated rotational speed 14.6 -30.8 rpm
No of Blades 3
Wind cut in speed 3
Rated wind speed 12
Cut out wind speed 21
Gear box type 2 planetary & 1 Helical
Generator type Double fed machine
Braking Aerodynamic Brake, Hydraulic, mechanical disc brakes
Output Voltage 690V

CDM-PDD-SCC-FORM
Version 05.0 Page 7 of 44
The average lifetime of the WTGs under project activity is around 25 years as per the equipment supplier specifications. The plant load factor estimated as 21% (Gamesa) for Chandgarh Dewas, 23.58% (Inox) for Nipaniya, Mandsaur and 25%(Regen) for Hatuniya, Mandsaur assessed by third party. In the absence of the project activity the equivalent amount of electricity would have been generated by NEWNE grid, which is predominantly based on fossil fuels2, hence baseline scenario of the project activity is the grid based electricity system, which is also the pre-project scenario.Apart from the above technical specification of WTGs, the connectivity of all the WTGs is to a central Monitoring Station (CMS) through high speed WLAN modem or fibre optic cable, which helps in providing real time status of the turbine at CMS with easy GUI (Graphical User Interface) and ability to monitor the functioning of the turbine from CMS.
A Supervisory Control & Data Acquisition System (SCADA) provides a graphical representation of data providing ease to understand the behaviour of WTG, long time data storage facility, access to daily generation report and power curve related information & helps to analyze the problem with graphical tools offline as well as online. The other specifications include a safety system with instrumentation for tracking individual functions of the wind electric generator. 3MW Solar PV: The instant project activity involves installation of a 3 MW solar power project based on polycrystalline/thin film technology. The major components of the solar project are the solar modules, module mounting structures, transformer etc. The solar modules are mounted on the module mounting structures. The solar module is a packaged, connected assembly of solar cells which uses the incident photons from the sun light and converts it into electricity. The solar module generates DC power, which is converted to AC power with the help of inverters. The instant project encompasses the following:
Particulars Details Nominal Power 3.00 MW AC power No. of modules 30928 Module make First Solar Module Type 97Wp Rated Voltage 37.6 V Rated Current 8.25-8.32 Amp Mounting Fixed structure Tilt angle (slope) of module
21 º
Inverter Schneider make 5*630kW 2 http://www.cea.nic.in/executive_summary.html
PV Modules
Inverters PV Modules
PV Modules
Inverters
Energy Meters
Southern regional grid

CDM-PDD-SCC-FORM
Version 05.0 Page 8 of 44
Fig 1: Schematic arrangements of systems and monitoring equipment The average lifetime of the modules under project activity is around 25 years as per the equipment supplier specifications. The plant load factor assessed by third party as 17.5% for the project site. In the absence of the project activity the equivalent amount of electricity would have been generated by the Southern grid, which is predominantly based on fossil fuels3, hence baseline scenario of the project activity is the grid based electricity system, which is also the pre-project scenario. The solar project converts the incident sunlight into electricity and is a GHG emission free form of energy generation. The technology and the project do not pose any adverse threat to the environment and contribute positively in reducing GHG emissions by displacing energy generation from fossil fuel powered projects. The proposed project activity is environmentally safe to implement and operate. The Solar PV modules are manufactured by first Solar, the rest of the equipment required by the project activity are available in the country.
A.4. Parties and project participants
Party involved (host) indicates host Party
Private and/or public entity(ies) project participants (as applicable)
Indicate if the Party involved wishes to be considered as project participant (Yes/No)
India (Host) Private entity-Interocean Shipping (I) Pvt. Ltd.
No
A.5. Public funding of project activity >> No public funds either from Annex 1 Parties or any other country has been used for any element of the CDM project activity.
A.6. Debundling for project activity >> The project activity is not a debundled component of a larger project activity as explained below. As per clause 12(c) of the Simplified Modalities and Procedures for small scale clean development mechanism project activities (decision 4/CMP.1, Annex II), “To use simplified modalities and procedures for small-scale CDM project activities, a proposed project activity shall: Not be a debundled component of a larger project activity, as determined through appendix C to this annex.” As per clause 2 of the Appendix C of the Simplified Modalities and Procedure for Small-Scale CDM project activities (consolidated in Guidelines on assessment of de-bundling for SSC project activities, Version 03.1, EB54, Annex 13), “A proposed small-scale project activity shall be deemed to be a debundled component of a large project activity if there is a registered small-scale CDM project activity or an application to register another small-scale CDM project activity: (a) With the same project participants; (b) In the same project category and technology/measure; and
3 http://www.cea.nic.in/executive_summary.html
CDM-PDD-SCC-FORM
Version 05.0 Page 9 of 44
(c) Registered within the previous 2 years; and (d) Whose project boundary is within 1 km of the project boundary of the proposed small- scale activity at the closest point.” There is no other project activity by same project proponents applied or registered within previous 2 years with UNFCCC under CDM, whose boundary is within 1km of the boundary of the proposed project activity. Hence, the project activity is not a de-bundled component of a large-scale project activity.
SECTION B. Application of selected approved baseline and monitoring methodology and standardized baseline
B.1. Reference of methodology and standardized baseline >> Following approved baseline & monitoring methodology is applied; Title: Type-I, Renewable Energy Project Methodology: I.D. Grid Connected renewable electricity generation Version: 18, valid from 28/11/2014. Scope: 01, EB 81 Reference: The approved baseline methodology has been referred from the “Indicative simplified baseline and monitoring methodologies for selected small-scale CDM project activity categories.” http://cdm.unfccc.int/methodologies/DB/W3TINZ7KKWCK7L8WTXFQQOFQQH4SBK The tools referenced in this methodology used for the proposed project includes:
-‐ Tool to calculate the emission factor for an electricity system Version 04.0.0, Annex 15 of EB 75 Report
-‐ Tool to calculate project or leakage CO2 emissions from fossil fuel combustion Version 02.0.0, Annex 11 of EB 41 Report
Guidelines: -‐ Guidelines on the Assessment of Investment Analysis Version-05, Annex-5 of EB62 Report -‐ General guidelines for SSC CDM methodologies, Version 20, EB 76, Annex 11. -‐ Guidelines on the demonstration of additionality of small-scale Project activities” Version 09
EB 68 Annex 28
B.2. Project activity eligibility >> As per the Para 12 of Simplified M & P for small-scale CDM project activities (FCCC/CP/2002/7/Add.3, Page 21) – “to use simplified modalities and procedures for small-scale CDM project activities, a proposed project activity shall meet eligibility criteria for a small scale CDM project activity4” . AMS 1D Version 18 has been used and justifications for the eligibility conditions are provided below. Applicability Conditions Position of the project activity vis-à-vis
applicability conditions 1. This methodology comprises renewable energy generation units, such as photovoltaic, hydro, tidal/wave, wind, geothermal and renewable biomass
a) a) Supplying electricity to a national or a
The project activity involves 8.35 MW wind and 3MW solar based power generation project with aggregated installed capacity 11.35MW the net electricity generated will be supplied to NEWNE regional grid and Southern regional grid.
4 http://cdm.unfccc.int/Reference/Documents/AnnexII/English/annexII.pdf

CDM-PDD-SCC-FORM
Version 05.0 Page 10 of 44
Applicability Conditions Position of the project activity vis-à-vis applicability conditions
regional grid
b) b) Supplying electricity to an identified consumer facility via national/regional grid through a contractual arrangement such as wheeling.
2. Illustration of respective situations under which each of the methodology (i.e. “AMS-I.D.: Grid connected renewable electricity generation”, “AMS-I.F.: Renewable electricity generation for captive use and mini-grid” and “AMS-I.A.: Electricity generation by the user) applies is included in the appendix.
As per Table No 2 of AMS – I. D. / Version 18, the AMS I.D is applicable to the project activity.
3. This methodology is applicable to project activities that (a) Install a Greenfield plant; (b) Involve a capacity addition in (an) existing plant(s); (c) Involve a retrofit of (an) existing plant(s); (d) Involve a rehabilitation of (an) existing plant(s)/unit(s); or (e) Involve a replacement of (an) existing plant(s).
The project activity is installation of new WTG’s and Solar PV. PPs doesn’t have any power generation projects at the proposed project site prior to the implementation of the project activity.
4. Hydro power plants with reservoirs 5 that satisfy at least one of the following conditions are eligible to apply this methodology:
• a) The project activity is implemented in an existing reservoir with no change in the volume of reservoir;
• b) The project activity is implemented in an existing reservoir 6 , where the volume of reservoir is increased and the power density of the project activity, as per definitions given in the Project Emissions section, is greater than 4 W/m2;
• c) The project activity results in new reservoirs and the power density of the power plant, as per definitions given in the Project Emissions section, is greater than 4 W/m2.
The project activity is a wind/solar based power plant. Hence, not applicable
5. If the new unit has both renewable and non-renewable components (e.g. a wind/diesel unit), the eligibility limit of 15MW for a small-scale CDM project activity applies only to the renewable component. If the new unit co fires fossil fuel7, the capacity of the entire unit shall not exceed the limit of 15MW.
The project activity is only 11.35MW Wind and Solar based renewable electricity generation project. It does not include any non-renewable unit and co-firing system.
5 A reservoir is a water body created in valleys to store water generally made by the construction of a dam. 6 A reservoir is to be considered as an .existing reservoir. if it has been in operation for at least three years
before the implementation of the project activity. 7 Co-fired system uses both fossil and renewable fuels.

CDM-PDD-SCC-FORM
Version 05.0 Page 11 of 44
Applicability Conditions Position of the project activity vis-à-vis applicability conditions
6. Combined heat and power (co-generation) systems are not eligible under this category.
The project activity does not involve combined heat and power generation system as it is only a wind power project.
7. In the case of project activities that involve the addition of renewable energy generation units at an existing renewable power generation facility, the added capacity of the units added by the project should be lower than 15 MW and should be physically distinct8 from the existing units.
It is a Greenfield project and not the extension of an existing renewable energy facility.
8. In the case of retrofit or replacement, to qualify as a small-scale project, the total output of the retrofitted or replacement unit shall not exceed the limit of 15 MW.
The project activity is not the retrofitting or replacement of an existing facility for renewable energy generation. Hence this criteria in not applicable.
9.In the case of landfill gas, waste gas, wastewater treatment and agro-industries projects, recovered methane emissions are eligible under a relevant Type III category. If the recovered methane is used for electricity generation for supply to a grid then the baseline for the electricity component shall be in accordance with procedure prescribed under this methodology. If the recovered methane is used for heat generation or cogeneration other applicable Type-I methodologies such as “AMS-I.C.: Thermal energy production with or without electricity” shall be explored.
The proposed project activity is a wind and solar based power project, hence criterion not applicable.
10.In case biomass is sourced from dedicated plantations, the applicability criteria in the tool “Project emissions from cultivation of biomass” shall apply.
The proposed project activity is a wind and solar based power project, hence criterion not applicable.
Table 2: Applicability of AMS-I.D, AMS-I.F and AMS-I.A based on project types
Project type AMS-I.A AMS-I.D AMS-I.F 1 Project supplies electricity to a national/regional
grid √
2 Project displaces grid electricity consumption (e.g. grid import) and/or captive fossil fuel electricity generation at the user end (excess electricity may be supplied to a grid)
√
3 Project supplies electricity to an identified consumer facility via national/regional grid (through a contractual arrangement such as wheeling)
√
8 Physically distinct units are those that are capable of generating electricity without the operation of existing
units, and that do not directly affect the mechanical, thermal, or electrical characteristics of the existing facility. For example, the addition of a steam turbine to an existing combustion turbine to create a combined cycle unit would not be considered “physically distinct”.
CDM-PDD-SCC-FORM
Version 05.0 Page 12 of 44
4 Project supplies electricity to a mini grid9 system where in the baseline all generators use exclusively fuel oil and/or diesel fuel
√
5 Project supplies electricity to household users (included in the project boundary) located in off grid areas
√
The project activity is installation of 11.35 MW of wind and solar based power generation and there would not be any change in the capacity of the project during its crediting period. Since the project will supply the generated renewable electricity to NEWNE regional grid and Southern regional grid systems and the capacity of the project activity is well below the qualifying limit of 15 MW. Hence the choice of project Type I and category is justified.
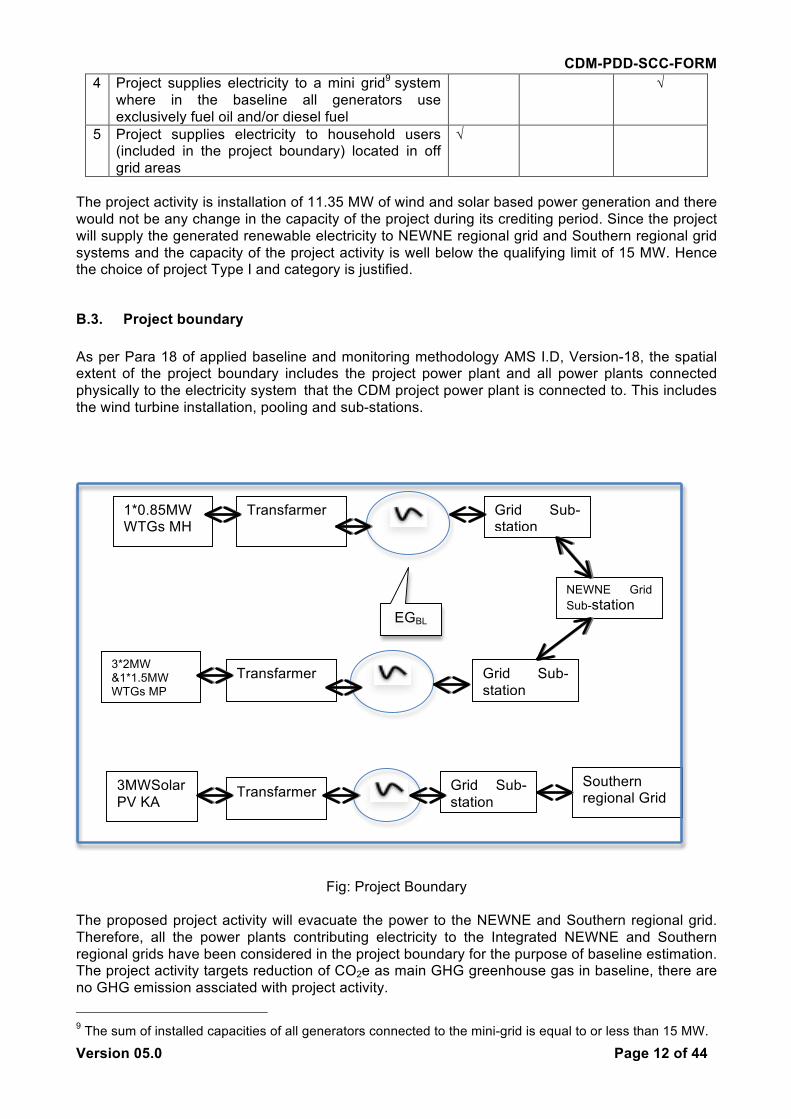
B.3. Project boundary As per Para 18 of applied baseline and monitoring methodology AMS I.D, Version-18, the spatial extent of the project boundary includes the project power plant and all power plants connected physically to the electricity system that the CDM project power plant is connected to. This includes the wind turbine installation, pooling and sub-stations.
Fig: Project Boundary The proposed project activity will evacuate the power to the NEWNE and Southern regional grid. Therefore, all the power plants contributing electricity to the Integrated NEWNE and Southern regional grids have been considered in the project boundary for the purpose of baseline estimation. The project activity targets reduction of CO2e as main GHG greenhouse gas in baseline, there are no GHG emission assciated with project activity. 9 The sum of installed capacities of all generators connected to the mini-grid is equal to or less than 15 MW.
1*0.85MW WTGs MH
Transfarmer
EGBL
Grid Sub-station
Southern regional Grid
3*2MW &1*1.5MW WTGs MP
Transfarmer
Grid Sub-station
3MWSolar PV KA
Transfarmer
Grid Sub-station
NEWNE Grid Sub-station

CDM-PDD-SCC-FORM
Version 05.0 Page 13 of 44
B.4. Establishment and description of baseline scenario >> The project activity involves installation of 5 wind turbine generators for the generation of electrical energy with installed capacity of 8.35MW and 3MW solar PV based power generation project. The generated power will be sold to NEWNE regional grid and Southern regional grid, which otherwise would have been generated by respective regional grid, which possesses a mix of generation types with fossil fuel fired power plants. As per para 19 of AMS-I.D. (Version 18) “The baseline scenario is that the electricity delivered to the grid by the project activity would have otherwise been generated by the operation of grid-connected power plants and by the addition of new generation sources into the grid. Project activity supplies electricity to NEWNE regional grid and Southern regional grid of India. In the absence of the project activity same amount electricity would have been generated from NEWNE grid and Sourhern grid, in which the electricity is generated by the fossil fuel intensive power plant (Coal based). Thus baseline is in line with para 19 of AMS-I.D. (Version 18). Para 22 of AMS-I.D. (Version 18) calculates baseline emissions as: BEy = EG PJ,y × EFgrid,.y. .....(A) Where, BEy = Baseline Emissions in year y; t CO2 EG PJ,y = Quantity of net electricity generation that is produced and fed into the grid as
a result of the implementation of the CDM project activity in year y (MWh) EFgrid,.y = Combined margin CO2 emission factor for grid connected power generation
in year y calculated using the latest version of the “Tool to calculate the emission factor for an electricity system” (t CO2/MWh)
Accordingly, the emission factor of the grid will be used to estimate emission reductions. As per para 23 of AMS-I.D. (Version 18), PP has chosen option (a) and used the combined margin (CM) approach to calculate emission factor, as official data is available for operating margin (OM) and build margin (BM) values, whereas no such data exists in the public domain to support choice of option (b). Hence, EFgrid,.y = EF grid,CM,y .....(B) DATA USED

CDM-PDD-SCC-FORM
Version 05.0 Page 14 of 44
Parameters Description Source EF NEWNE,OM,y Operating margin CO2 emission factor
for the project electricity system in year y
Calculated as per “Tool to calculate the emission factor for an electricity system (Version 04.0.0)” using data from Central Electricity Authority of India’s (CEA) “Baseline Carbon Dioxide Emission Database Version 9.0” 10
EF NEWNE,BM,y Build margin CO2 emission factor for the project electricity system in year y
EF NEWNE,CM,y Combined margin CO2 emission factor for the project electricity system in year y
EG facility(NEWNE),y Quantity of net electricity supplied by the candidate project activity to the grid in year y (8059MWh)
Estimated generation based on rated capacity of the project activity and the applicable PLF. During the crediting period, records of actual net electricity supply to the grid will be used.
PLFSolar 17.5% Third party assessment report PLFWTG,MH 25% Third party assessment report PLFWTG,MP,Gamesa 21% Third party assessment report PLFWTG,MP,Regen 25% Third party assessment report PLFWTG,MP, Inox 23% Third party assessment report This data is published by Central Electricity Authority (CEA) (a statutory body constituted under Electricity Act and having its office attached to Ministry of Power, Government of India) on their website (www.cea.nic.in). “Baseline Carbon Dioxide Emission Database Version 9.0” is the latest available data and is, therefore, being used in calculation of the baseline emissions.
B.5. Demonstration of additionality >> In accordance with “Guideline on the demonstration of additionality of small scale project activity” Version-09.0, PP shall provide an explanation to show that the project activity would not have occurred due to at least one of the following barrier
• Investment barrier: • Technological barrier: • Barrier due to prevailing practice: • Other barriers
The project proponent identified “investment barrier” as the most relevant barrier faced by the project activity. The investment barrier faced by the project activity consists of barrier due to high capital cost and consequent impact on return. Investment analysis: The purpose of investment analysis is to determine whether the project activity is economically or financially less attractive than other alternatives without additional funding that may be derived from the CDM project activity. The investment analysis was conducted in accordance with guidelines on investment analysis.
As per paragraph 19 of Annex 5, EB 62, " If the proposed baseline scenario leaves the project participant no other choice than to make an investment to supply the same (or substitute) products or services, a benchmark analysis is not appropriate and an investment comparison analysis shall be used. If the alternative to the project activity is the supply of electricity from a grid this is not to be considered an investment and a benchmark approach is considered appropriate."
Also the guideline says that "The purpose of an investment analysis in the context of the CDM is to determine whether the project is less financially attractive than at least one alternative in which the
10 http://cea.nic.in/reports/planning/cdm_co2/cdm_co2.htm

CDM-PDD-SCC-FORM
Version 05.0 Page 15 of 44
project participants could have invested. In cases where the alternative requires investment anyhow and baseline emissions are based on that alternative, the only means of determining that the project activity is less financially attractive than at least one alternative is to conduct an investment comparison analysis. The benchmark approach is therefore suited to circumstances where the baseline does not require investment or is outside the direct control of the project developer, i.e. cases where the choice of the developer is to invest or not to invest".
In the proposed project activity, the baseline scenario is the generation of equivalent amount of electricity from the grid-connected power plants, owing to which, it is outside the direct control of the project proponent. Hence, the benchmark analysis approach has been adopted. The project proponent proposes to use benchmark analysis approach to prove additionality. IRR is the most suitable and commonly used financial indicator. Hence, PP has used post tax-equity IRR as financial indicator. Selection of financial indicator: In order to analyse the financial viability of the project activity, the prime financial indicator that has been used is the equity IRR of the project activity. The equity IRR is one of the most commonly used tools to assess the feasibility and viability of the projects. Since the project developer is demonstrating the financial unattractiveness of the project, equity IRR is appropriate as it is often used by the project developers to make a decision on investing in the project. Hence, post tax-equity IRR is considered the financial indicator for demonstrating the additionality of the project. Selection of benchmark: As per para 15 of Guidance on investment analysis, If the benchmark is based on parameters that are standard in the market, the cost of equity should be determined either by: (a) selecting the values provided in Appendix A of the guidelines; or by (b) calculating the cost of equity using best financial practices, based on data sources which can be clearly validated by the DOE, while properly justifying all underlying factors. PP has considered the value of 11.75% provided as the default Return on Equity (ROE) value in Appendix A of the guideline. As per the guidance on the Assessment of Investment Analysis, Version 05, EB 62, Annex 5, para 12, “Local commercial lending rate or weighted average costs of capital (WACC) are appropriate benchmarks for a project IRR. It is also mentioned in Para 13 of Annex 5, EB 62 that “in the cases of projects which could be developed by an entity other than the project participant the benchmark should be based on parameters that are standard in the market, which can be validated by DOE”. Further as per para 15, of the guidance PP has chosen option a) selecting the values provided in Appendix A of EB 62 Annex 5; Project participant has considered the benchmark based on equity indices. Cost of equity has been estimated based on the values provided in Appendix A of EB 62 Annex 5. As per the values, Cost of Equity can be estimated as below –
Return on equityNominal = (1+ Return on equityReal)*(1+Inflation rateHost country) – 1 Apart from the default values of ROE provided in para 8 of the Appendix, the guidance in para 7 is also used to finally arrive at the value of the benchmark. As per the same, “in situations where an investment analysis is carried out in nominal terms, project participants can convert the real term values provided in the table below to nominal values by adding the inflation rate. The inflation rate shall be obtained from the inflation forecast of the central bank of the host country for the duration of the crediting period. If this information is not available, the target inflation rate of the central bank shall be used.”
The Reserve bank of India (RBI) provides the quarterly forecast (for the next five years and 10 years) for the inflation. RBI forecasted values for the next ten years for WPI inflation has been used to adjust the default value of ROE, which is given in real terms as per below for respective WTGs.

CDM-PDD-SCC-FORM
Version 05.0 Page 16 of 44
Long term WPI for 10 years forecast applicable to respective WTGs and Solar PV project under project activities are as in table below applicable under proposed project activity as the same was available to PP at thet time of investment decision dates.
Therefore, Return on equityNominal = (1+ 11.75%)*(1+5.5%) – 1=17.89% Return on equityNominal = (1+ 11.75%)*(1+5.0%) – 1=17.34% Hence, the return on equity 17.89% and 17.34% for the respective WTGs and Solar project activity has been considered as benchmark value. Post Tax Equity Calculation: As per the guidance on assessment of Investment Analysis version 05, “Both project IRR and equity IRR calculations shall as a preference reflect the period of expected operation of the underlying project activity (technical lifetime), or – if a shorter period is chosen – include the fair value of the project activity assets at the end of the assessment period. In general a minimum period of 10 years and a maximum of 20 years will be appropriate.” The period considered for Post Tax Equity IRR calculations is for 25 years, which corresponds to the operational lifetime of the project activity. Depreciation, and other non-cash items related to the project activity, which have been deducted in estimating gross profits on which tax is calculated, is added back to net profits for the purpose of calculating the financial indicator. The following table illustrates the assumptions used for the calculation of the financial indicator i.e. Post Tax Equity IRR for the given project activity. The use of these parameters indicating if they are assumed or based on actual figures is explained in the table. All the relevant costs and revenues for the project activity have been considered for calculation of Post Tax Equity IRR. Key Assumption for Financial Analysis In line with investment analysis guideline of EB, the assumptions used for the determination of post-tax Equity IRR for the proposed project activity at the time of project decision are given below
3.0MW Solar Karnataka Assumptions Value Source Project Capacity in MW 4 Offer letter by Mahindra EPC dated
28/05/2014
WTGs Investment Decision Date
WPI value (10 years forecast)
Benchmark
Source
1*0.85MW WTG
25/02/2014 5.5% 17.89% http://rbi.org.in/scripts/PublicationsView.aspx?id=15703
3MW Solar PV by ISIPL
02/06/2014 5.5% 17.89% http://rbi.org.in/scripts/PublicationsView.aspx?id=15729
1.5MW WTG (Regen)
07/08/2014 5.0% 17.34% http://rbi.org.in/scripts/PublicationsView.aspx?id=15774
1*2.0MW WTGs (Gamesa)
06/10/2014 5.0% 17.34% http://rbi.org.in/scripts/PublicationsView.aspx?id=16049
1*2.0MW WTG (Inox)
06/10/2014 5.0% 17.34% http://rbi.org.in/scripts/PublicationsView.aspx?id=16049
1*2.0MW WTG (Gamesa)
13/10/2014 5.0% 17.34% http://rbi.org.in/scripts/PublicationsView.aspx?id=16049
CDM-PDD-SCC-FORM
Version 05.0 Page 17 of 44
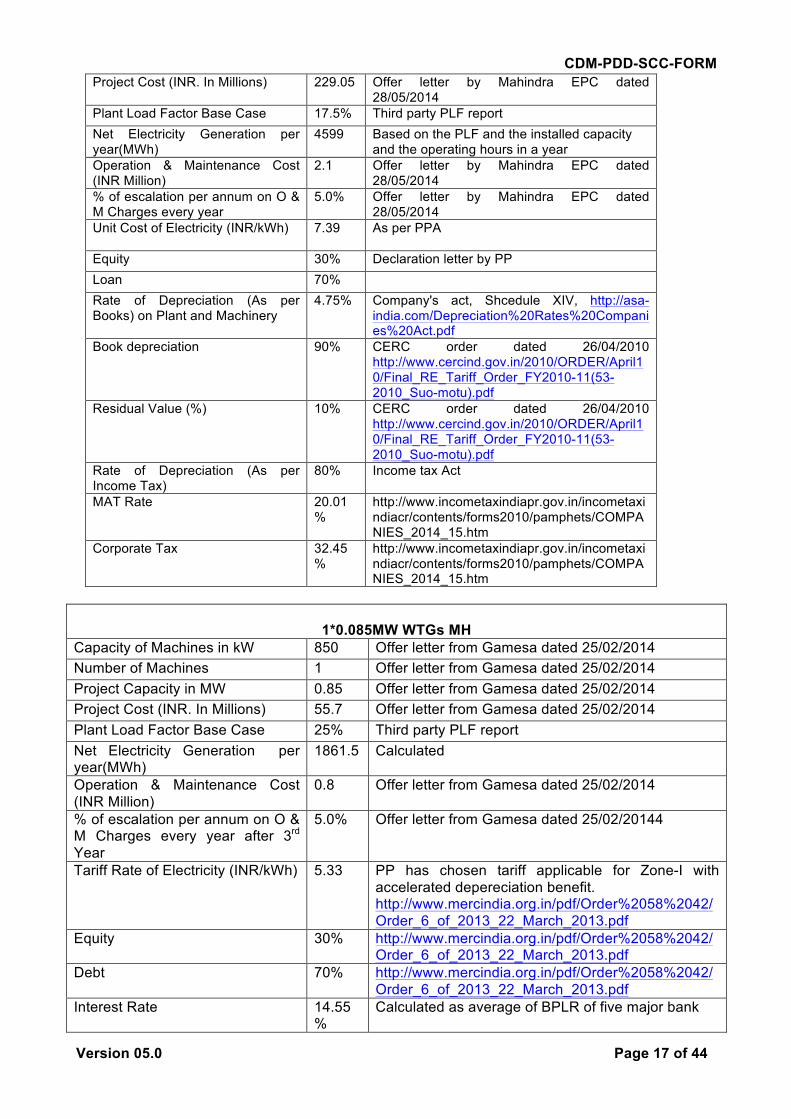
Project Cost (INR. In Millions) 229.05 Offer letter by Mahindra EPC dated 28/05/2014
Plant Load Factor Base Case 17.5% Third party PLF report Net Electricity Generation per year(MWh)
4599 Based on the PLF and the installed capacity and the operating hours in a year
Operation & Maintenance Cost (INR Million)
2.1 Offer letter by Mahindra EPC dated 28/05/2014
% of escalation per annum on O & M Charges every year
5.0% Offer letter by Mahindra EPC dated 28/05/2014
Unit Cost of Electricity (INR/kWh) 7.39 As per PPA
Equity 30% Declaration letter by PP Loan 70% Rate of Depreciation (As per Books) on Plant and Machinery
4.75% Company's act, Shcedule XIV, http://asa-india.com/Depreciation%20Rates%20Companies%20Act.pdf
Book depreciation 90% CERC order dated 26/04/2010 http://www.cercind.gov.in/2010/ORDER/April10/Final_RE_Tariff_Order_FY2010-11(53-2010_Suo-motu).pdf
Residual Value (%) 10% CERC order dated 26/04/2010 http://www.cercind.gov.in/2010/ORDER/April10/Final_RE_Tariff_Order_FY2010-11(53-2010_Suo-motu).pdf
Rate of Depreciation (As per Income Tax)
80% Income tax Act
MAT Rate 20.01%
http://www.incometaxindiapr.gov.in/incometaxindiacr/contents/forms2010/pamphets/COMPANIES_2014_15.htm
Corporate Tax 32.45%
http://www.incometaxindiapr.gov.in/incometaxindiacr/contents/forms2010/pamphets/COMPANIES_2014_15.htm
1*0.085MW WTGs MH Capacity of Machines in kW 850 Offer letter from Gamesa dated 25/02/2014 Number of Machines 1 Offer letter from Gamesa dated 25/02/2014 Project Capacity in MW 0.85 Offer letter from Gamesa dated 25/02/2014 Project Cost (INR. In Millions) 55.7 Offer letter from Gamesa dated 25/02/2014 Plant Load Factor Base Case 25% Third party PLF report Net Electricity Generation per year(MWh)
1861.5 Calculated
Operation & Maintenance Cost (INR Million)
0.8 Offer letter from Gamesa dated 25/02/2014
% of escalation per annum on O & M Charges every year after 3rd Year
5.0% Offer letter from Gamesa dated 25/02/20144
Tariff Rate of Electricity (INR/kWh) 5.33 PP has chosen tariff applicable for Zone-I with accelerated depereciation benefit. http://www.mercindia.org.in/pdf/Order%2058%2042/Order_6_of_2013_22_March_2013.pdf
Equity 30% http://www.mercindia.org.in/pdf/Order%2058%2042/Order_6_of_2013_22_March_2013.pdf
Debt 70% http://www.mercindia.org.in/pdf/Order%2058%2042/Order_6_of_2013_22_March_2013.pdf
Interest Rate 14.55%
Calculated as average of BPLR of five major bank

CDM-PDD-SCC-FORM
Version 05.0 Page 18 of 44
Loan Tenure (years) 8 http://www.mercindia.org.in/pdf/Order%2058%2042/Order_6_of_2013_22_March_2013.pdf
Rate of Depreciation (As per Books) on Plant and Machinery
4.75% Company’s act, Shcedule XIV, http://asa-india.com/Depreciation%20Rates%20Companies%20Act.pdf
Book depreciation 90% CERC order dated 26/04/2010 http://www.cercind.gov.in/2010/ORDER/April10/Final_RE_Tariff_Order_FY2010-11(53-2010_Suo-motu).pdf
Residual Value (%) 10% CERC order dated 26/04/2010 http://www.cercind.gov.in/2010/ORDER/April10/Final_RE_Tariff_Order_FY2010-11(53-2010_Suo-motu).pdf
Rate of Depreciation (As per Income Tax) (15%+ 20% additional)
35% Income tax Act http://law.incometaxindia.gov.in/DITTaxmann/Notifications/IncomeTaxAct/2010/Notification15_2012.htm
MAT Rate 20.01%
http://www.incometaxindiapr.gov.in/incometaxindiacr/contents/forms2010/pamphets/COMPANIES_2014_15.htm
Corporate Tax 32.45%
http://www.incometaxindiapr.gov.in/incometaxindiacr/contents/forms2010/pamphets/COMPANIES_2014_15.htm
Lifetime of the project activity (years)
25 http://www.mercindia.org.in/pdf/Order%2058%2042/Order_6_of_2013_22_March_2013.pdf
2*2MW WTG MP (Gamesa)
Capacity of Machines in kW 2000 Offer Letter from Gamesa dated 13/08/2014 Number of Machines 2 Offer Letter from Gamesa dated 13/08/2014 Project Capacity in MW 4 Offer Letter from Gamesa dated 13/08/2014 Project Cost (INR. In Millions) 300 Offer Letter from Gamesa dated 13/08/2014 Plant Load Factor Base Case 21% Third party PLF report Net Electricity Generation per year(MWh)
7358 Calculated
Operation & Maintenance Cost (INR Million)
4.91 Offer Letter from Gamesa dated 13/08/2014
% of escalation per annum on O & M Charges every year after 2nd Year
5.0% Offer Letter from Gamesa dated 13/08/2014
Tariff Rate of Electricity(INR/kWh) 5.92 http://www.mperc.nic.in/26032013-Wind-tariff-order.pdf
Equity 30% http://www.mperc.nic.in/26032013-Wind-tariff-order.pdf
Debt 70% http://www.mperc.nic.in/26032013-Wind-tariff-order.pdf
Interest Rate 14.55%
Calculated as average of BPLR of five major bank
Loan Tenure (years) 8 Offer letter from Gamesa dated 13/08/2014 Rate of Depreciation (As per Books) on Plant and Machinery
4.75% Company’s act, Shcedule XIV, http://asa-india.com/Depreciation%20Rates%20Companies%20Act.pdf
Book depreciation 90% CERC order dated 26/04/2010 http://www.cercind.gov.in/2010/ORDER/April10/Final_RE_Tariff_Order_FY2010-11(53-2010_Suo-

CDM-PDD-SCC-FORM
Version 05.0 Page 19 of 44
motu).pdf Residual Value (%) 10% CERC order dated 26/04/2010
http://www.cercind.gov.in/2010/ORDER/April10/Final_RE_Tariff_Order_FY2010-11(53-2010_Suo-motu).pdf
Rate of Depreciation (As per Income Tax)
80% Income tax Act
MAT Rate 20.01%
http://www.incometaxindiapr.gov.in/incometaxindiacr/contents/forms2010/pamphets/COMPANIES_2014_15.htm
Corporate Tax 32.45%
http://www.incometaxindiapr.gov.in/incometaxindiacr/contents/forms2010/pamphets/COMPANIES_2014_15.htm
Lifetime of the project activity (years)
25 http://www.mperc.nic.in/26032013-Wind-tariff-order.pdf
1*2MW WTG MP (Inox)
Capacity of Machines in kW 2000 Offer letter from Inox dated 02/09/2014 Number of Machines 1 Offer letter from Inox dated 02/09/2014 Project Capacity in MW 2 Offer letter from Inox dated 02/09/2014 Project Cost (INR. In Millions) 127 Offer letter from Inox dated 02/09/2014 Plant Load Factor Base Case 23% Third party PLF report Net Electricity Generation per year(MWh)
4029.6 Calculated
Operation & Maintenance Cost (INR Million)
2
Offer letter from Inox dated 02/09/2014
% of escalation per annum on O & M Charges every year after 2nd Year
5.0% Offer letter from Inox dated 02/09/2014
Tariff Rate of Electricity(INR/kWh)
5.92 http://www.mperc.nic.in/26032013-Wind-tariff-order.pdf
Equity 30% http://www.mperc.nic.in/26032013-Wind-tariff-order.pdf
Debt 70% http://www.mperc.nic.in/26032013-Wind-tariff-order.pdf
Interest Rate 14.55%
Calculated as average of BPLR of five major bank
Loan Tenure (years) 8 Offer letter from Inox dated 02/09/2014 Rate of Depreciation (As per Books) on Plant and Machinery
4.75% Company’s act, Shcedule XIV, http://asa-india.com/Depreciation%20Rates%20Companies%20Act.pdf
Book depreciation 90% CERC order dated 26/04/2010 http://www.cercind.gov.in/2010/ORDER/April10/Final_RE_Tariff_Order_FY2010-11(53-2010_Suo-motu).pdf
Residual Value (%) 10% CERC order dated 26/04/2010 http://www.cercind.gov.in/2010/ORDER/April10/Final_RE_Tariff_Order_FY2010-11(53-2010_Suo-motu).pdf
Rate of Depreciation (As per Income Tax)
80% Income tax Act
MAT Rate 20.01%
http://www.incometaxindiapr.gov.in/incometaxindiacr/contents/forms2010/pamphets/COMPANIES_2014_

CDM-PDD-SCC-FORM
Version 05.0 Page 20 of 44
15.htm
Corporate Tax 32.45%
http://www.incometaxindiapr.gov.in/incometaxindiacr/contents/forms2010/pamphets/COMPANIES_2014_15.htm
Lifetime of the project activity (years)
25 http://www.mperc.nic.in/26032013-Wind-tariff-order.pdf
1*1.5MW WTG MP (Regen)
Capacity of Machines in kW 1500 Offer letter from Regen dated 02/08/2014 Number of Machines 1 Offer letter from Regen dated 02/08/2014 Project Capacity in MW 1.5 Offer letter from Regen dated 02/08/2014 Project Cost (INR. In Millions) 105 Offer letter from Regen dated 02/08/2014 Plant Load Factor Base Case 25% Third party PLF report Net Electricity Generation per year(MWh)
3285 Calculated
Operation & Maintenance Cost (INR Million)
1.7
Offer letter from Regen dated 02/08/2014
% of escalation per annum on O & M Charges every year after 2nd Year
5.0% Offer letter from Regen dated 02/08/2014
Tariff Rate of Electricity(INR/kWh)
5.92 http://www.mperc.nic.in/26032013-Wind-tariff-order.pdf
Equity 30% http://www.mperc.nic.in/26032013-Wind-tariff-order.pdf
Debt 70% http://www.mperc.nic.in/26032013-Wind-tariff-order.pdf
Interest Rate 14.55%
Calculated as average of BPLR of five major bank
Loan Tenure (years) 8 Offer letter from Regen dated 02/08/2014 Rate of Depreciation (As per Books) on Plant and Machinery
4.75% Company’s act, Shcedule XIV, http://asa-india.com/Depreciation%20Rates%20Companies%20Act.pdf
Book depreciation 90% CERC order dated 26/04/2010 http://www.cercind.gov.in/2010/ORDER/April10/Final_RE_Tariff_Order_FY2010-11(53-2010_Suo-motu).pdf
Residual Value (%) 10% CERC order dated 26/04/2010 http://www.cercind.gov.in/2010/ORDER/April10/Final_RE_Tariff_Order_FY2010-11(53-2010_Suo-motu).pdf
Rate of Depreciation (As per Income Tax)
80% Income tax Act
MAT Rate 20.01%
http://www.incometaxindiapr.gov.in/incometaxindiacr/contents/forms2010/pamphets/COMPANIES_2014_15.htm
Corporate Tax 32.45%
http://www.incometaxindiapr.gov.in/incometaxindiacr/contents/forms2010/pamphets/COMPANIES_2014_15.htm
Lifetime of the project activity (years)
25 http://www.mperc.nic.in/26032013-Wind-tariff-order.pdf

CDM-PDD-SCC-FORM
Version 05.0 Page 21 of 44
Post Tax Equity IRR for the WTGs and Solar PV based power project under proposed project activity is given in table below against the benchmark values. Thus, it is evident that the project is not financially attractive.
Sensitivity Analysis To check the robustness of the project’s financial return calculation it has been tested by subjecting critical parameters to reasonable variations as required by Annex 5 EB 62. The robustness of the conclusion drawn above, namely that the project is not financially attractive, has been tested by subjecting critical assumptions to reasonable variation. As required by Annex 05 of EB 62, only variables, including the initial investment cost, that constitute more than 20% of either total project costs or total project revenues should be subjected to reasonable variation. PPs have identified the total revenue from the project activity is dependent on the Plant Load Factor and Project Cost, O&M Costs constitute more than 20% of the project costs. These factors have been subjected to a 10% variation on either side and the results of the sensitivity analysis so conducted are given in the following tables.
2*2MW (Gamesa) FACTOR VARIATION Breaching value
-10% 0% +10% Project Cost 16.5% 14.29% 12.46% -13.3% O&M Cost 14.59% 14.29% 13.99% -111.2% PLF 11.4% 14.29% 17.2% 10.5% Tariff 11.4% 14.29% 17.2% 10.5% Benchmark 17.34%
1*2MW (Inox)
FACTOR VARIATION Breaching value -10% 0% +10%
Project Cost 16.6% 14.79% 13.25% -13.62% O&M Cost 15.02% 14.79% 14.56% -118.4% PLF 11.78% 14.79% 17.86% 8.3% Tariff 11.78% 14.79% 17.86% 8.3% Benchmark 17.34%
1*1.5MW (Regen)
FACTOR VARIATION Breaching value -10% 0% +10%
Project Cost 12.68% 11.32% 10.13% -35.22% O&M Cost 11.63% 11.32% 11.0% -208% PLF 8.62% 11.32% 14.05% 21.78% Tariff 8.62% 11.32% 14.05% 21.78% Benchmark 17.34%
1*0.85MW (Gamesa)
FACTOR VARIATION Breaching value -10% 0% +10%
Project Cost 3.71% 3.17% 2.65% -119.85%
WTGs Investment Decision Date
IRR Benchmark
1*0.85MW WTG 25/02/2014 4.99% 17.89% 3MW Solar PV by ISIPL 02/06/2014 13.19% 17.89% 1.5MW WTG (Regen) 07/08/2014 11.32% 17.34% 1*2.0MW WTGs (Gamesa) 06/10/2014 14.29% 17.34% 1*2.0MW WTG (Inox) 06/10/2014 14.79% 17.34% 1*2.0MW WTG (Gamesa) 13/10/2014 14.29% 17.34%

CDM-PDD-SCC-FORM
Version 05.0 Page 22 of 44
O&M Cost 3.23% 3.17% 2.94% -892% PLF 1.07% 3.17% 5.23% 69.24% Tariff 1.07% 3.17% 5.23% 69.24% Benchmark 17.89%
3MW Solar PV
FACTOR VARIATION Breaching value -10% 0% +10%
Project Cost 14.97% 13.19% 11.67% -23.29% O&M Cost 13.36% 13.19% 13.01% -258.4% PLF 10.71% 13.19% 15.65% 19.13% Tariff 10.71% 13.19% 15.65% 19.13% Benchmark 17.89%
An analysis has been done to identify the percentage variation at which the financial indicators will equal/breach the benchmark and the probability of its occurrence. Based on sensitivity analysis it can be consluded that the proposed project activity is additional with reasonable variation in values and is not likely to reach the benchmark value. An analysis has been done to identify the percentage variation at which the financial indicator wills equal/breach the benchmark and the probability of its occurrence. The occurrence of these events is unlikely for the following reasons:
a) PLF: The PLF value considered is based on Third Party PLF report i.e. 21%, 23%, 25% and 17.5% for 2*2MW Gamesa, 2MW Inox, 1.5MW Regen, 0.85MW Gamesa and 3MW solar, the PLF will breach the benchmark value at PLF value of 23.2%, 24.9%, 30.44%, 42.31% and 20.84% respectively. The increase in PLF value to breach the benchmark is highly unlikely as the normative PLF for the state of Madhya Pradesh, Maharashtra and Karnataka is published by state electricity regulatory commission as 20%, 25% (Zone-I) and 19% (Solar PV), given the analysis above its highly unlikely that PLF will increase above breaching value.
b) Project Cost: The project cost considered for investment analysis for respective WTGs
and Solar are sourced from offer letter, the actual project cost incurred by the PP is well within 10% sensitivity range of the investment cost considered at the time of investment analysis. As the project cost has already been incurred by the PP, further reduction in the same is not possible.
c) O&M Costs: The sensitivity analysis reveals that O&M will breach the benchmark at
negative values and is hypotheical case. Since the O&M cost is subject to escalation (as evidence by the O&M agreement) and also subject to inflationary pressure, any reduction in the O&M costs is highly unlikely. Hence, the reduction in the O&M cost is highly unlikely.
d) Tariff: The Tariff rate of electricity used for investment analysis i.e. 5.92 INR/kWh
(Madhya Pradesh), 5.33 INR/kWh (Maharashtra) and 7.39 INR/kWh (Karnataka solar) are sourced from the offer letters, the same has been also confirmed from tariff orders of respective states applicable to project activity at the time of investment decision. Furthermore, these tariffs will be fixed for lifetime of the project activity, hence this is not a likely scenario.
The above analysis proves that varying the parameters does not lead to a Post Tax Equity IRR without CDM revenue, which will cross the benchmark value. The carbon revenue from the project activity would provide significant amount of returns from the sale of the Emission Reductions accrued from the project activity and in turn increase the financial attractiveness of the project activity and hence make the project activity more financially viable.

CDM-PDD-SCC-FORM
Version 05.0 Page 23 of 44
Prior CDM consideration: As per the “Guidelines on the demonstration and assessment of prior consideration of the CDM”, Version 04, EB 62, “for project activities with a starting date on or after 02 August 2008, the project participant must inform a Host Party DNA and the UNFCCC secretariat in writing of the commencement of the project activity and of their intention to seek CDM status. Such notification must be made within six months of the project activity start date” The start date for the project activity is 26/09/2014 (Date of Purchase Order of first WTG). The project proponent intimated the UNFCCC and NCDMA of their intention to seek CDM status on 19/12/2014, which is within six months of the project start date. This is in line with the guidance quoted above.
B.6. Emission reductions
B.6.1. Explanation of methodological choices >> As per para 22 of AMS-I.D. (Version 18), baseline emission are calculated as follows: BEy = EGPJ,y × EFgrid,y Where: Where, BEy = Baseline Emissions in year y; t CO2 EG PJ,y = Quantity of net electricity generation that is produced and fed into the grid as a
result of the implementation of the CDM project activity in year y (MWh) EFgrid,.y = Combined margin CO2 emission factor for grid connected power generation
in year y calculated using the latest version of the “Tool to calculate the emission factor for an electricity system” (t CO2/MWh)
Calculation of EGPJ,y As proposed project activity is a greenfield project, in accordance with para 26 of applied methodology EG PJ,y = EGPJ, facility,y
Where, EGPJ, facility,y Quantity of net electricity generation supplied by the project plant/unit to the
grid in year y (MWh)
Calculation of BEy Calculation of baseline emissions i.e. BEy, requires calculation of grid emission factor (EFgrid,y), which is being presented below.
As per para 23 of the applied methodology, the emission factor can be calculated in a transparent and conservative manner as follows:
(a) A combined margin (CM), consisting of the combination of operating margin (OM) and build margin (BM) according to the procedures prescribed in the Tool to calculate the Emission Factor for an electricity systemî; OR (b) The weighted average emissions (in t CO2/MWh) of the current generation mix. The data of the year in which project generation occurs must be used.
The PP has chosen option a i.e. combined margin (CM) consisting of combination OM and BM. Tool to calculate the emission factor for an electricity system (Version 04.0.0), has been used to determine the CO2 emission factor for displacement of electricity generated by power plants in an

CDM-PDD-SCC-FORM
Version 05.0 Page 24 of 44
electricity system, by calculating the combined margin emission factor (CM) of that electricity system. As per the tool, PP has applied the following six steps:
Step 1: Identify the relevant electricity systems. Indian electricity system comprises of two regional electricity grids i.e. NEWNE regional grid and Southern regional grid.
NEWNE Grid Southern Grid
Northern Eastern Western North-Eastern
Southern
Chandigarh Delhi Haryana Himachal Pradesh Jammu & Kashmir Punjab Rajasthan Uttar Pradesh Uttarakhand
Bihar Jharkhand Orissa West Bengal Sikkim Andaman- Nicobar
Chhattisgarh Gujarat Daman & Diu Dadar & Nagar Haveli Madhya Pradesh Maharashtra Goa
Arunachal Pradesh Assam Manipur Meghalaya Mizoram Nagaland Tripura
Andhra Pradesh Karnataka Kerala Tamil Nadu Pondicherry Lakshadweep
Notably, regional grid represents the largest electricity system where power plants can be dispatched without significant constraints and, thus, forms the project electricity system for a project activity delivering electricity into it. The proposed project activity is located in Madhya Pradesh, Maharashtra and Karnataka states of India, which are connected to the Southern regional grid and NEWNE regional grid of India, it, therefore, can be identified as the project electricity system.
Additionally, some amount of power exchange invariably takes place between these regional grids, while a small exchange also occurs with few neighbouring countries like Bhutan & Nepal. All these grids, therefore, form a connected electricity system.
Step 2: Choose whether to include off-grid power plants in the project electricity system (optional) Project participants may choose between the following two options to calculate the operating margin and build margin emission factor:
Option I: Only grid power plants are included in the calculation. Option II: Both grid power plants and off-grid power plants are included in the calculation. Project Participant has chosen Option I i.e. only including grid power plants in the calculation of operating margin and build margin emission factor, since data for the same is available from Central Electricity Authority which is an official source. No official data is available publicly for off grid power plants.
Step 3: Select a method to determine the operating margin (OM), EFgrid,OM,y
According to the tool the calculation of the operating margin emission factor is based on one of the following methods:
(a) Simple OM, or (b) Simple adjusted OM, or

CDM-PDD-SCC-FORM
Version 05.0 Page 25 of 44
(c) Dispatch data analysis OM, or (d) Average OM.
PP has chosen Option (a) i.e. simple OM, to determine the operating margin. Other available options in the tool were ruled out considering the fact that data required to calculate simple adjusted OM or dispatch data analysis is not available publically. As per the tool, low cost/must run resources typically include hydro, geothermal, wind, low-cost biomass, nuclear and solar generation. Data for the same, as published by Central Electricity Authority, has been presented below which illustrates that low cost/must run resources constitute less than 50% of total Southern regional grid generation, hence, the average OM method could not have been used.
Share of Must-Run (Hydro/Nuclear) (% of Net Generation)
2008-09 2009-10 2010-11 2011-12 2012-13
Southern 22.8% 20.6% 21.0% 21.0% 15.2% NEWNE 17.4% 15.9% 17.6% 19.2% 17.4%
The above data clearly shows that the percentage of total grid generation by low cost/must run plants (on the basis of average of five most recent years) for the Southern regional grid and NEWNE regional grid is less than 50 % of the total generation.
As per tool to calculate emission factor for an electricity system (Version 04.0.0), The simple OM method (option a) can only be used if low-cost/must-run resources constitute less than 50% of total grid generation in: 1) average of the five most recent years, or 2) based on long-term averages for hydroelectricity production. Since the low cost/must run resources constitute less than 50% of total grid generation as seen from the average of five most recent years, the Simple OM method can be used to calculate the Operating Margin Emission factor.
PP has chosen ex ante option, thus, no monitoring and recalculation of the emissions factor during the crediting period is required. PP has considered a data vintage of 3-year generation-weighted average, based on the most recent data available at the time of submission of the CDM-PDD to the DOE for validation.
Step 4: Calculate the operating margin emission factor according to the selected method The simple OM emission factor is calculated as the generation-weighted average CO2 emissions per unit net electricity generation (tCO2/MWh) of all generating power plants serving the system, not including low-cost / must-run power plants / units.
The simple OM may be calculated: Option A: Based on the net electricity generation and a CO2 emission factor of each power unit; or Option B: Based on the total net electricity generation of all power plants serving the system and the fuel types and total fuel consumption of the project electricity system.
The Central Electricity Authority, Ministry of Power, Government of India has published a database of Carbon Dioxide Emission from the power sector in India based on detailed authenticated information obtained from all operating power stations in the country. This database i.e. The CO2 Baseline Database provides information about the Combined Margin Emission Factors of all the regional electricity grids in India. The Combined Margin in the CEA database is calculated ex ante using the guidelines provided by the UNFCCC in the “Tool to calculate the emission factor for an electricity system, Version 04.0.0”. We have, therefore, used the Combined Margin data published in the CEA database, for calculating the Baseline Emission Factor.
CDM-PDD-SCC-FORM
Version 05.0 Page 26 of 44
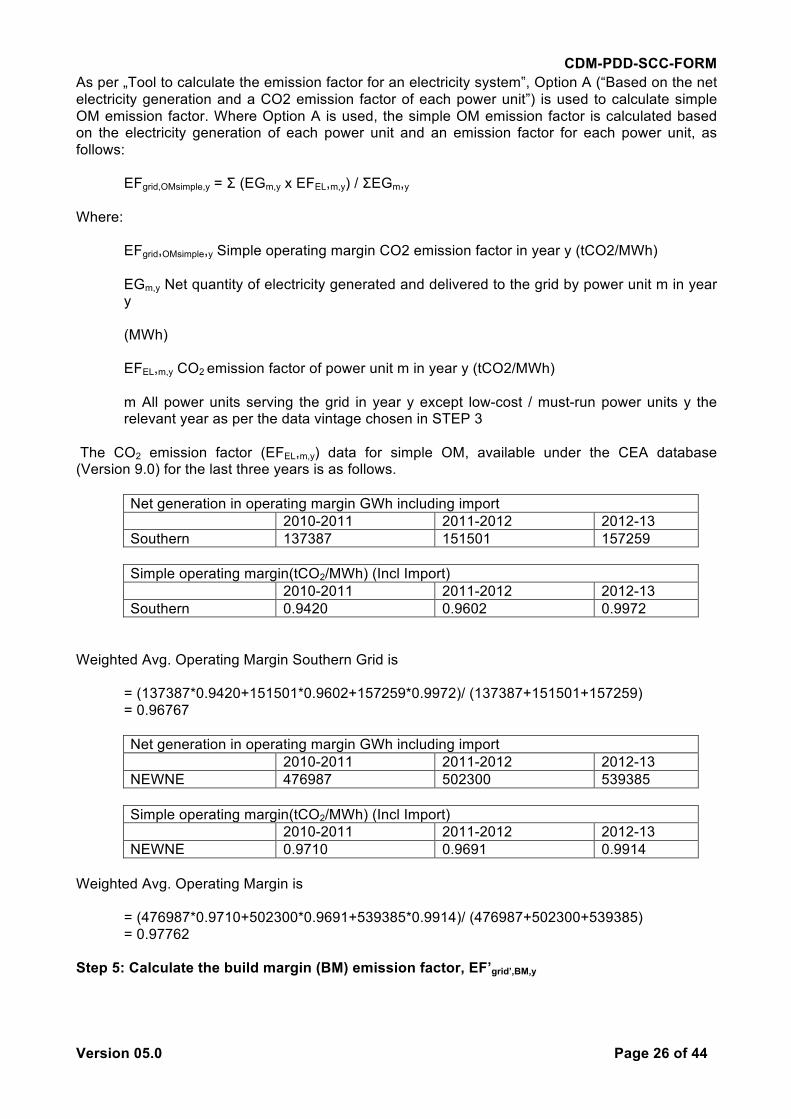
As per „Tool to calculate the emission factor for an electricity system‟, Option A (“Based on the net electricity generation and a CO2 emission factor of each power unit”) is used to calculate simple OM emission factor. Where Option A is used, the simple OM emission factor is calculated based on the electricity generation of each power unit and an emission factor for each power unit, as follows:
EFgrid,OMsimple,y = Σ (EGm,y x EFEL,m,y) / ΣEGm,y
Where: EFgrid,OMsimple,y Simple operating margin CO2 emission factor in year y (tCO2/MWh) EGm,y Net quantity of electricity generated and delivered to the grid by power unit m in year y (MWh) EFEL,m,y CO2 emission factor of power unit m in year y (tCO2/MWh) m All power units serving the grid in year y except low-cost / must-run power units y the relevant year as per the data vintage chosen in STEP 3
The CO2 emission factor (EFEL,m,y) data for simple OM, available under the CEA database (Version 9.0) for the last three years is as follows.
Net generation in operating margin GWh including import 2010-2011 2011-2012 2012-13 Southern 137387 151501 157259
Simple operating margin(tCO2/MWh) (Incl Import) 2010-2011 2011-2012 2012-13 Southern 0.9420 0.9602 0.9972
Weighted Avg. Operating Margin Southern Grid is
= (137387*0.9420+151501*0.9602+157259*0.9972)/ (137387+151501+157259) = 0.96767 Net generation in operating margin GWh including import 2010-2011 2011-2012 2012-13 NEWNE 476987 502300 539385
Simple operating margin(tCO2/MWh) (Incl Import) 2010-2011 2011-2012 2012-13 NEWNE 0.9710 0.9691 0.9914
Weighted Avg. Operating Margin is
= (476987*0.9710+502300*0.9691+539385*0.9914)/ (476987+502300+539385) = 0.97762
Step 5: Calculate the build margin (BM) emission factor, EF’grid’,BM,y

CDM-PDD-SCC-FORM
Version 05.0 Page 27 of 44
The project participants have chosen Option I, i.e. fixing build margin emission factor ex ante based on the most recent information available on units already built for sample group m at the time of CDM PDD submission to the DOE for validation.
The build margin emissions factor is the generation-weighted average emission factor of all power units m during the most recent year y for which power generation data is available, calculated as follows:
EFgrid, BM,y = Σ(EG m,y X EF EL,m,y) / Σ EG m,y Where: EFgrid,BM,y = Build margin CO2 emission factor in year y (t CO2 e/MWh) EGm,y = Net quantity of electricity generated and delivered to the grid by power unit m in year y (MWh) EFEL,m,y = CO2 emission factor of power unit m in year y (t CO2 e/MWh) m = Power units included in the build margin y = Most recent historical year for which power generation data is available
The CO2 emission factor of each power unit m (EFEL,m,y) is determined as per the procedures given in step 4 (a) for the simple OM, using options A1B1 using for y the most recent historical year for which power generation data is available, and using for m the power units included in the build margin.
The build margin emission factor (EFgrid,BM,y) for the year 2012-13 (most recent year) for Southern grid and NEWNE grid are 0.95086 tCO2/MWh and 0.96732 tCO2/MWh.
CEA’s “CO2 Baseline Database for the Indian Power Sector” Version 9.0,.
Build Margin (tCO2/MWh) (not adjusted for imports) 2012-2013 Southern 0.95086 NEWNE 0.96732
Step 6: Calculate the combined margin (CM) emissions factor The combined margin is the weighted average of the simple operating Margin and the build margin. In particular, for intermittent and non-dispatchable generation types such as wind and solar photovoltaic, the ‘Tool to calculate the emission factor for an electricity system (Version 04.0.0)’, allows to weigh the operating margin and Build margin at 75% and 25%, respectively
EFSouthern,grid,y = ( EF Southern,OM,y × w OM ) + ( EF Southern,BM,y × w BM )
= ( EF Southern,OM,y × 75% ) + ( EF Southern,BM,y × 25%)
Electronic spreadsheet showing calculation of all these parameters is being submitted separately and the final values are presented below:
Parameter Value Units
Operating Margin : EF Southern,OM,y 0.96767 tCO2e/MWh
Build Margin : EF Southern,BM,y 0.95086
Combined Margin : EF Southern,grid,y =0.96767*75%+0.95086*25%
Combined Margin : EF Southern,grid,y 0.96347

CDM-PDD-SCC-FORM
Version 05.0 Page 28 of 44
EFNEWNE,grid,y = ( EF NEWNE,OM,y × w OM ) + ( EF NEWNE,BM,y × w BM )
= ( EF NEWNE,OM,y × 75% ) + ( EF NEWNE,BM,y × 25%)
Electronic spreadsheet showing calculation of all these parameters is being submitted separately and the final values are presented below:
Parameter Value Units
Operating Margin : EF NEWNE,OM,y 0.97762 tCO2e/MWh
Build Margin : EF NEWNE,BM,y 0.96732
Combined Margin : EF NEWNE,grid,y =0.97762*75%+0.96732*25%
Combined Margin : EF NEWNE,grid,y 0.97505
B.6.2. Data and parameters fixed ex ante (Copy this table for each piece of data and parameter.) Data / Parameter EF NEWNE, OM, y Unit tCO2/MWh Description Operating Margin CO2 emission factor for the NEWNE Grid in year y Source of data CEA’s “Baseline Carbon Dioxide Emission Database Version 9.0 ” Value(s) applied 0.97762 Choice of data or Measurement methods and procedures
Calculated in line with “Tool to calculate the emission factor for an electricity system (Version 04.0.0)” using data from Central Electricity Authority of India’s (CEA) “Baseline Carbon Dioxide Emission Database Version 9.0”. The value used is calculated ex-ante as generation based weighted average of last three years of the operating margin provided in the CEA database. Weighted average = ∑i=1 to n (Net generation in operating margin in year i * Simple operating margin in year i)/∑i= 1 to n (Net generation in operating margin of year i)
Purpose of data Calculation of baseline emissions
Additional comment The value is fixed ex-ante

CDM-PDD-SCC-FORM
Version 05.0 Page 29 of 44
Data / Parameter EF NEWNE, BM, y Unit tCO2/MWh Description Build Margin CO2 emission factor for the NEWNE Grid in year y Source of data CEA’s “Baseline Carbon Dioxide Emission Database Version 9.0 ” Value(s) applied 0.96732 Choice of data or Measurement methods and procedures
Calculated in line with “Tool to calculate the emission factor for an electricity system (Version 04.0.0)” using data from Central Electricity Authority of India’s (CEA) “Baseline Carbon Dioxide Emission Database Version 9.0”. The value is calculated ex-ante as most recent build margin provided by the CEA.
Purpose of data Calculation of baseline emissions
Additional comment The value is fixed ex-ante
Data / Parameter EF NEWNE, grid, y Unit tCO2/MWh Description Combined Margin CO2 emission factor for the NEWNE Grid in year y Source of data Central Electricity Authority(CEA) of India Database Version 9.0 Value(s) applied 0.97505 Choice of data or Measurement methods and procedures
This has been calculated based on Operating Margin (OM) and Build Margin (BM) published by Central Electricity Authority (CEA) of India. Please refer section B.6.1 for details.
Purpose of data Calculation of baseline emissions
Additional comment The value is fixed ex-ante
Data / Parameter EF Southern, OM, y Unit tCO2/MWh Description Operating Margin CO2 emission factor for the Southern Grid in year y Source of data CEA’s “Baseline Carbon Dioxide Emission Database Version 9.0 ” Value(s) applied 0.96767 Choice of data or Measurement methods and procedures
Calculated in line with “Tool to calculate the emission factor for an electricity system (Version 04.0.0)” using data from Central Electricity Authority of India’s (CEA) “Baseline Carbon Dioxide Emission Database Version 9.0”. The value used is calculated ex-ante as generation based weighted average of last three years of the operating margin provided in the CEA database. Weighted average = ∑i=1 to n (Net generation in operating margin in year i * Simple operating margin in year i)/∑i= 1 to n (Net generation in operating margin of year i)
Purpose of data Calculation of baseline emissions
Additional comment The value is fixed ex-ante

CDM-PDD-SCC-FORM
Version 05.0 Page 30 of 44
Data / Parameter EF Southern, BM, y Unit tCO2/MWh Description Build Margin CO2 emission factor for the Southern Grid in year y Source of data CEA’s “Baseline Carbon Dioxide Emission Database Version 9.0 ” Value(s) applied 0.95086 Choice of data or Measurement methods and procedures
Calculated in line with “Tool to calculate the emission factor for an electricity system (Version 04.0.0)” using data from Central Electricity Authority of India’s (CEA) “Baseline Carbon Dioxide Emission Database Version 9.0”. The value is calculated ex-ante as most recent build margin provided by the CEA.
Purpose of data Calculation of baseline emissions
Additional comment The value is fixed ex-ante
Data / Parameter EF Southern, grid, y Unit tCO2/MWh Description Combined Margin CO2 emission factor for the Southern Grid in year y Source of data Central Electricity Authority(CEA) of India Database Version 9.0 Value(s) applied 0.96347 Choice of data or Measurement methods and procedures
This has been calculated based on Operating Margin (OM) and Build Margin (BM) published by Central Electricity Authority (CEA) of India.
Purpose of data Calculation of baseline emissions
Additional comment The value is fixed ex-ante
B.6.3. Ex ante calculation of emission reductions >> This is a renewable power generation project, the entire power generated from the project activity will be supplied to NEWNE and Southern grid. This form of energy generation has no associated GHG emissions. So, the emission reductions will just depend on the quantity of electricity being supplied to the regional grids, which would have been otherwise generated in grids. Baseline emissions: Baseline emission is calculated as per equation (1) in section B.6.1 BEy = EG PJ,facility,y × EFgrid, y BE y = EG PJ,y × EFgrid, y
EGPJ, y = EGPJ, Southern, y + EGPJ,NEWNE, y EGPJ, Southern, y =(3MW*17.5%* 365days * 24 hours = 4599 MWh (rounded down) EGPJ,NEWNE, y = (4MW*21%+2MW*23.58%+1.5MW*25%+.85MW*25%)* 365days * 24 hours = 16635 MWh (rounded down) PLF has been taken from the third party Report. Here,

CDM-PDD-SCC-FORM
Version 05.0 Page 31 of 44
EF Southern, grid, y =0.96347 tCO2/MWh EF NEWNE, grid, y =0.97505 tCO2/MWh
BEy = EGPJ, Southern, y * EF Southern, grid, y + EGPJ,NEWNE, y * EF NEWNE, grid, y BEy = 4599*0.96347 + 16635*0.97505 BEy =20648 tCO2/year (rounded down)
Project emissions: Not applicable as this is a wind energy based power generation project. PE y = 0 Leakage emissions: No leakage emissions occur due to this project activity. LE y = 0 Emission reductions: ER y = BE y – PE y – LE y or ERy = BEy as PEy = 0 and LEy = 0 ER y = 20648 tCO2/annum
B.6.4. Summary of ex ante estimates of emission reductions
Year Baseline emissions (t CO2e)
Project emissions (t CO2e)
Leakage (t CO2e)
Emission reductions (t CO2e)
2015-16 20648 0 0 20648 2016-17 20648 0 0 20648 2017-18 20648 0 0 20648 2018-19 20648 0 0 20648 2019-20 20648 0 0 20648 2020-21 20648 0 0 20648 2021-22 20648 0 0 20648 Total 144536 0 0 144536 Total number of crediting years
7
Annual average over the crediting period
20648 0 0 20648
B.7. Monitoring plan
B.7.1. Data and parameters to be monitored (Copy this table for each piece of data and parameter.) Data / Parameter EGPJ, y, MP Unit MWh / year Description Net electricity supplied to the NEWNE grid facility by the project activity Source of data Share certificate issued by Madhya Pradesh Paschim Kshetra Vidyut Vitaran
Company Ltd. (MPPKVVCL) Value(s) applied 14774

CDM-PDD-SCC-FORM
Version 05.0 Page 32 of 44
Measurement methods and procedures
The net electricity exported to the grid by project activity WTG will be ascertained by government agency Madhya Pradesh Paschim Kshetra Vidyut Vitaran Company Ltd. (MPPKVVCL) on the basis of ABT meter reading at substation (includes generation from project and non-project WTGs) and meter readings at various transformer yard meters (near WTGs). On the basis of these meters readings, apportioning is carried out in order to estimate the net electricity generated by the project activity. Apportioning is discussed in detail in the subsequent sections. The net electricity generated by the project activity will be calculated from net electricity supplied to grid from the share certificate issued by state utility (currently MPPKVVCL) on monthly basis for respective WTGs. The amount of energy supplied by the WTGs are continuously monitored and recorded once a month. Continuous monitoring, hourly measurement and monthly recording is carried out.
Monitoring frequency Continuous monitoring, hourly measurement monthly recording QA/QC procedures Trivector (TVM)/ABT energy meters with accuracy class 0.2s Purpose of data Calculation of baseline emissions Additional comment The energy meters at the substation is of 0.2S accuracy class Calibration of the
TVM/ABT meter will be done at least once in 1 year and 3 years respectively depending on type of meter. All the data will be archived till a period of two years from the end of the crediting period.
For Site in Karnataka Data / Parameter EGPJ, y, KTK Unit MWh / year Description Net quantity of electricity supplied to the southern grid by the project activity
during the year y. The net electricity generation would be a calculated value. Source of data Share certificate issued by Gulbarga Electricity Supply Company Limited
(GESCOM) Value(s) applied 4599 Measurement methods and procedures
The net electricity exported to the grid by solar plant will be ascertained by government agency Gulbarga Electricity Supply Company Limited (GESCOM) on the basis of Joint Meter Reading (JMR) sheet showing the energy generation including generation from project and other solar project). On the basis of these meters readings, apportioning is carried out in order to estimate the net electricity generated by the project activity. Apportioning is discussed in detail in the subsequent sections. The net electricity generated by the project activity will be calculated from net electricity supplied to grid from the share certificate issued by state utility (currently GESCOM) on monthly basis. The amount of energy supplied by the solar project are continuously monitored and recorded once a month. Continuous monitoring, hourly measurement and monthly recording is carried out.
Monitoring frequency Continuous monitoring, hourly measurement monthly recording QA/QC procedures Trivector (TVM)/ABT energy meters with accuracy class 0.2s Purpose of data Calculation of baseline emissions Additional comment The energy meters at the substation is of 0.2S accuracy class Calibration of the
TVM/ABT meter will be done at least once in 1 year and 3 years respectively depending on type of meter. All the data will be archived till a period of two years from the end of the crediting period.

CDM-PDD-SCC-FORM
Version 05.0 Page 33 of 44
For Site in Maharashtra Data / Parameter EGPJ, y, MH Unit MWh / year Description Net electricity supplied to the NEWNE grid facility by the project activity Source of data Share certificate issued by GETCO (Gujarat Energy Transmission Corporation
Limited) Value(s) applied 1861 Measurement methods and procedures
The net electricity exported to the grid by project activity WTG will be ascertained by government agency Maharashtra State Electricity Distribution Co. Ltd. (MSEDCL) on the basis of ABT meter reading at substation (includes generation from project and non-project WTGs) and meter readings at various transformer yard meters (near WTGs). On the basis of these meters readings, apportioning is carried out in order to estimate the net electricity generated by the project activity. Apportioning is discussed in detail in the subsequent sections. The net electricity generated by the project activity will be calculated from net electricity supplied to grid from the share certificate issued by state utility (currently MSEDCL) on monthly basis for respective WTGs. The amount of energy supplied by the WTGs are continuously monitored and recorded once a month. Continuous monitoring, hourly measurement and monthly recording is carried out.
Monitoring frequency Continuous monitoring, hourly measurement monthly recording QA/QC procedures Trivector (TVM)/ABT energy meters with accuracy class 0.2s Purpose of data Calculation of baseline emissions Additional comment The energy meters at the substation is of 0.2S accuracy class Calibration of the
TVM/ABT meter will be done at least once in 1 year and 3 years respectively depending on type of meter. All the data will be archived till a period of two years from the end of the crediting period.
B.7.2. Sampling plan >> This project includes 5 WTGs and 3MW Solar PV under proposed project activity, the energy generated will be monitored and recorded for all WTGs and Solar PV for the CDM Project activities without any sampling procedure.
B.7.3. Other elements of monitoring plan >>
The project activity is operated and managed by the project proponent with the help of site in charge (personal from the project proponent) and site O & M contractor (respective personal from the wind turbine manufacturer). The project proponent has entered into comprehensive Operation & Maintenance contract with each of his supplier of Wind Electric Generators (INOX, Regen Powertech and Gamesa). There are two meters installed at substation i.e. main meter and check meter of accuracy class 0.2s, where in case of failure of main meter reading from check meter shall be used for determination of net electricity exported to grid. The meters are tri-vector meters and are capable of recording export as well as import. The electricity exported and imported by all the WEG’s (project activity as well as non-project activity) are recorded on a monthly basis

CDM-PDD-SCC-FORM
Version 05.0 Page 34 of 44
by the representatives of the PP and state utility. Main meter and Check meters are calibrated every three years by state utility officials in the presence of PP. Net Electricity Exported to the Grid by the project activity as per apportioning procedure followed by state utility for each state is given below:
Madhya Pradesh
• A Joint Meter Reading shall be taken by the representatives of WTG operator and Madhya Pradesh Paschim Kshetra Vidyut Vitaran Company Ltd. (MPPKVVCL) at the high voltage side of the step up transformer installed at the substation at a particular date.
• In case the main metering system is not in service, then the check metering system shall be used until the main system is back to service.
• Meter reading would be jointly signed by both the representatives. • The main and the check metering systems shall be sealed in presence of representatives of
Power producers, WTG operator and MPPKVVCL. • When any of these metering systems is found to be outside acceptable limits of accuracy or
otherwise not functioning properly, it shall be repaired, recalibrated or replaced. • PP will raise a monthly energy bill/statement based on the JMR at the end of each calendar
month and the payment by State Electricity Board is done on this basis. The billing and payment records will be maintained by the PP.
• Calibration and Testing of Meters will be done annually. Calculation of data
EGexport = EGcontroller per WEG × EGgross export, SS
total ∑EG controller, windfarm
i=1
EGimport = EGcontroller per WEG × EGgross import, SS
total ∑EG controller, windfarm
i=1
Where:
Electricity generated by one WEG as per controller report EGcontroller per WEG
Sum of panel readings of all WEGs connected to the wind farm, as per controller report EG controller, windfarm Total energy exported to the substation by the project activity
EGgross export, SS Total energy imported from the substation by the project activity EG gross import, SS Electricity exported to the grid by the project activity
EGexport Electricity imported from the grid by the project activity
EGimport Net electricity supplied to the grid (EGexport – Egimport)
EGPJ, facility, y, MP
Procedure for apportioning for the WTG of the project activity located in Madhya Pradesh:
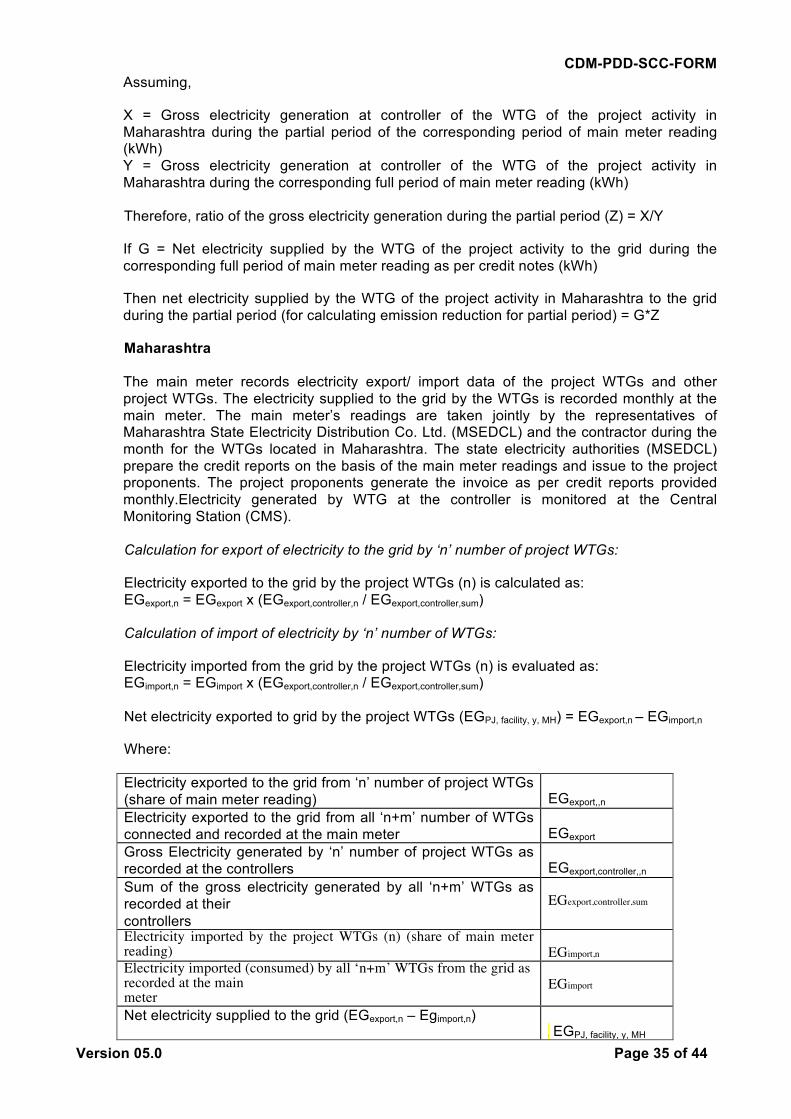
CDM-PDD-SCC-FORM
Version 05.0 Page 35 of 44
Assuming,
X = Gross electricity generation at controller of the WTG of the project activity in Maharashtra during the partial period of the corresponding period of main meter reading (kWh) Y = Gross electricity generation at controller of the WTG of the project activity in Maharashtra during the corresponding full period of main meter reading (kWh) Therefore, ratio of the gross electricity generation during the partial period (Z) = X/Y
If G = Net electricity supplied by the WTG of the project activity to the grid during the corresponding full period of main meter reading as per credit notes (kWh)
Then net electricity supplied by the WTG of the project activity in Maharashtra to the grid during the partial period (for calculating emission reduction for partial period) = G*Z
Maharashtra The main meter records electricity export/ import data of the project WTGs and other project WTGs. The electricity supplied to the grid by the WTGs is recorded monthly at the main meter. The main meter’s readings are taken jointly by the representatives of Maharashtra State Electricity Distribution Co. Ltd. (MSEDCL) and the contractor during the month for the WTGs located in Maharashtra. The state electricity authorities (MSEDCL) prepare the credit reports on the basis of the main meter readings and issue to the project proponents. The project proponents generate the invoice as per credit reports provided monthly.Electricity generated by WTG at the controller is monitored at the Central Monitoring Station (CMS). Calculation for export of electricity to the grid by ‘n’ number of project WTGs:
Electricity exported to the grid by the project WTGs (n) is calculated as: EGexport,n = EGexport x (EGexport,controller,n / EGexport,controller,sum) Calculation of import of electricity by ‘n’ number of WTGs:
Electricity imported from the grid by the project WTGs (n) is evaluated as: EGimport,n = EGimport x (EGexport,controller,n / EGexport,controller,sum) Net electricity exported to grid by the project WTGs (EGPJ, facility, y, MH) = EGexport,n – EGimport,n
Where:
Electricity exported to the grid from ‘n’ number of project WTGs (share of main meter reading) EGexport,,n Electricity exported to the grid from all ‘n+m’ number of WTGs connected and recorded at the main meter EGexport Gross Electricity generated by ‘n’ number of project WTGs as recorded at the controllers EGexport,controller,,n Sum of the gross electricity generated by all ‘n+m’ WTGs as recorded at their controllers
EGexport,controller,sum
Electricity imported by the project WTGs (n) (share of main meter reading) EGimport,n Electricity imported (consumed) by all ‘n+m’ WTGs from the grid as recorded at the main meter
EGimport
Net electricity supplied to the grid (EGexport,n – Egimport,n) EGPJ, facility, y, MH
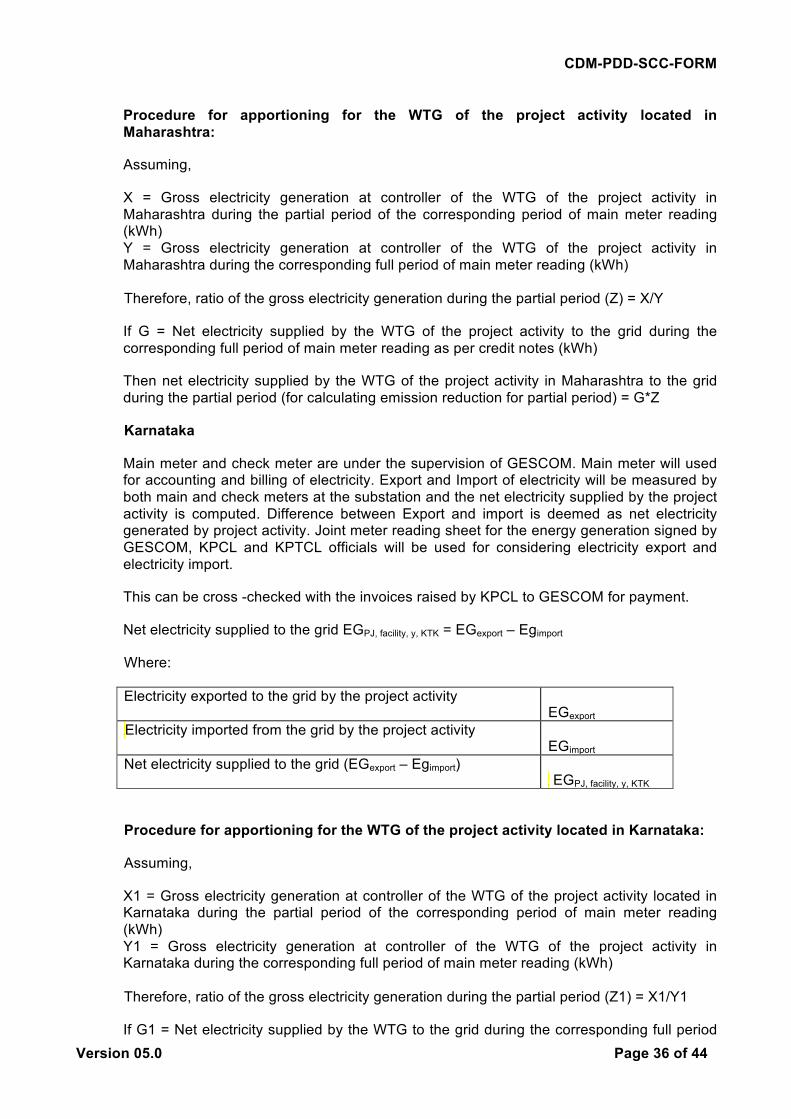
CDM-PDD-SCC-FORM
Version 05.0 Page 36 of 44
Procedure for apportioning for the WTG of the project activity located in Maharashtra:
Assuming,
X = Gross electricity generation at controller of the WTG of the project activity in Maharashtra during the partial period of the corresponding period of main meter reading (kWh) Y = Gross electricity generation at controller of the WTG of the project activity in Maharashtra during the corresponding full period of main meter reading (kWh) Therefore, ratio of the gross electricity generation during the partial period (Z) = X/Y
If G = Net electricity supplied by the WTG of the project activity to the grid during the corresponding full period of main meter reading as per credit notes (kWh)
Then net electricity supplied by the WTG of the project activity in Maharashtra to the grid during the partial period (for calculating emission reduction for partial period) = G*Z
Karnataka
Main meter and check meter are under the supervision of GESCOM. Main meter will used for accounting and billing of electricity. Export and Import of electricity will be measured by both main and check meters at the substation and the net electricity supplied by the project activity is computed. Difference between Export and import is deemed as net electricity generated by project activity. Joint meter reading sheet for the energy generation signed by GESCOM, KPCL and KPTCL officials will be used for considering electricity export and electricity import.
This can be cross -checked with the invoices raised by KPCL to GESCOM for payment.
Net electricity supplied to the grid EGPJ, facility, y, KTK = EGexport – Egimport
Where:
Electricity exported to the grid by the project activity EGexport
Electricity imported from the grid by the project activity EGimport
Net electricity supplied to the grid (EGexport – Egimport) EGPJ, facility, y, KTK
Procedure for apportioning for the WTG of the project activity located in Karnataka:
Assuming,
X1 = Gross electricity generation at controller of the WTG of the project activity located in Karnataka during the partial period of the corresponding period of main meter reading (kWh) Y1 = Gross electricity generation at controller of the WTG of the project activity in Karnataka during the corresponding full period of main meter reading (kWh) Therefore, ratio of the gross electricity generation during the partial period (Z1) = X1/Y1
If G1 = Net electricity supplied by the WTG to the grid during the corresponding full period

CDM-PDD-SCC-FORM
Version 05.0 Page 37 of 44
of main meter reading as per credit note (kWh)
Then net electricity supplied by the WTG to the Southern grid in Karnataka during the partial period (for calculating emission reduction for partial period) = G1*Z1
QA/QC Procedures
There are one ABT meter and two trivector meters (one main meter and one check meter) of 0.2s accuracy class at substation. If some defect occurs to ABT meters, these trivector meters can be used to obtain the reading. All meters (ABT, main and check) and yard meters are calibrated at least once in a three year by utility officials or its representatives.
The measurement results will be cross checked with records of sole electricity such as invoices.
Data Management and Data Archiving
Copies of the break-up sheet, invoices raised on discom and sales receipts will be retained and archived for the entire crediting period plus two years by the project proponent.
Emergency preparedness plan
Operation and Maintenance team is trained for emergency situations.
Training
Operation and maintenance team will train the staff on operation and maintenance aspects of the plant. The training will ensure preventive maintenance and better operational control for the plant.
Data adjustments/uncertainties
• In case Main meter is found to be faulty/ damaged, during the monthly recording then the reading for that month would be taken from the back up meter for the purpose of billing. The defective main meter would be replaced and the subsequent readings would be taken from the new main meter.
• In case Backup meter is found to be faulty/ damaged, the defective backup meter would be replaced.
• During annual calibration / accuracy testing of the main and backup meter if an error is observed to be outside the permissible limits of accuracy then both the Main & backup meter will be replaced immediately and the measured error from the recording meter would be applied to all the recorded readings conservatively since the date of last calibration/ accuracy test of that meter. For the accurate execution of the Project activity a project team has been constructed.The project team is delegated with the responsibility of monitor and document the electricity generated and also safe keeping of the recorded data. The project team is also responsible for calculation of actual creditable emission reduction in the most transparent and relevant manner.The CDM monitoring team will composed the following staff:
Position Report to:
Operators (WTG Operator) Site Engineer Site Engineer (WTG Operator) Site Incharge Site Incharge (WTG Operator) Project Owner CDM monitoring project manager Project Owner

CDM-PDD-SCC-FORM
Version 05.0 Page 38 of 44
B.7.4. Date of completion of application of methodology and standardized baseline and contact information of responsible persons/ entities
>> 04/02/2015 Phool Chand Director, PA Research & Consultants Pvt. Ltd. 317, Vardhman Star Mall, Sector-19, Faridabad-121002, Haryana, India Cell: +91 9971003064 T: +91 129 4013677 E: [email protected] W: www.pars-consultants.com
SECTION C. Duration and crediting period
C.1. Duration of project activity
C.1.1. Start date of project activity >> 26/09/2014 (i.e. purchase order of first WTG)
C.1.2. Expected operational lifetime of project activity >> 25 years
C.2. Crediting period of project activity
C.2.1. Type of crediting period >> 7X3 Renewable crediting period
C.2.2. Start date of crediting period >> The start date of the crediting period is 31/05/2015 or a date not earlier than the date of registration of the small scale project activity
C.2.3. Length of crediting period >> 7 years 00months
SECTION D. Environmental impacts
D.1. Analysis of environmental impacts >> As per the of Ministry of Environment and Forests (MoEF), Government of India, under the Environment Impact Assessment Notification vide S.O. 1533 dated 14/09/2006 has listed a set of activities in Schedule I of the notification which for setting up new projects or modernization/expansion will require environmental clearance & will have to conduct an Environmental Impact Assessment (EIA) studies. As per the notification EIA need not to be conducted for the projects of capacity less than 25 MW. Since the capacity of the project is 8.4 MW, the project activity doesn’t falls under preview to conduct EIA study.

CDM-PDD-SCC-FORM
Version 05.0 Page 39 of 44
No significant environmental impacts considered due to implementation of project activity by the host party.
SECTION E. Local stakeholder consultation
E.1. Solicitation of comments from local stakeholders >> The local stakeholder consultation meeting for the WTGs under project activity has been conducted as detailed below
The Stakeholders were informed by sending personal invitation letters dated 20/01/2015 and local stakeholder notice was also published in Daily Patrika dated 25/01/2015. The stakeholder meeting process is followed in the following sequence
• Welcome Speech by the organizers. • Introduction to ‘Clean Development Mechanism’ • Interactive Sessions with the stakeholders. • Vote of Thanks
E.2. Summary of comments received >>
Will these projects enable the village to get an increased supply of power? (query by Mr. Sumer Singh Balai)
We cannot guarantee the same. Once the electricity is generated, it is fed in to the state grid and then it becomes the decision of the state government as to where they have to give supply with respect to the amount of power at their disposal. But yes we do expect the same. (answer by Mr. M Rajni)
Is there any problem for any other activity that the villagers were carrying out in past at the site? (Query by Mr. Ajay Singh)
No there is no such problem faced by the villagers. (answer by Mr. Dhanasekar)
Why the power generated from the project isn’t being supplied directly to the village? (Query by Mr. Toofan Singh)
It was explained to Mr. Toofan Singh, the power generated from the project activity is evacuated to the nearby substation and developer is not authorized to supply electricity directly to the villagers.
What are the other employment opportunities apart from Security personnel staff? (query by Mr. Balu Singh)
The consultant explained to Mr. Balu Singh, trained persons can be employed in skilled manpower jobs.
We have heard that apart from wind, power can be generated from other sources of nature – such as water, sun, etc. Why does the government not invest entirely in renewable energy projects to source all the power that it needs? (query by Mr. Rajram Gurakhe)
The government has invested in renewable energy projects in technologies apart from wind. The Bhakra Nangal Dam, the Hirakud Dam over the Mahanadi River – these are all prime examples of government investment to harness power from renewable energy (hydro power). The government has also made a made a long term plan to use renewable sources of sources of energy for generating power, wherein the wherein the Prime Minister himself is involved
2*2MW 27/01/2015 Changarh Dewas Madhya Pradesh 1*1.5MW & 1*2MW
27/01/2015 Hatuniya & Nipaniya
Mandsaur Madhya Pradesh
1*0.85MW 28/01/2015 Bhendewade Kolhapur Maharashtra 3MW Solar 29/01/2015 Chelur Hobli Chikkaballapur Karnataka

CDM-PDD-SCC-FORM
Version 05.0 Page 40 of 44
involved (National Action Plan on Climate Change). Change). This has a lot of focus on solar energy energy (energy generated from the sun).
But these technologies also have a few areas of concern. These have to be harnessed only from the source where these gifts of nature are available. This brings up certain logistical and regulatory problems. This is apart from the problems of wheeling and storage of energy over long distances and long periods of time
The amount of investment required for these technologies too is very high. Also, as against the power generated from fossil fuels, the reliability in these renewable energy technologies is a little uncertain as this depends entirely on the forces of nature. This can be in the case of hydro power where the input depends upon the amount of rainfall in the monsoons – most of you being farmers understand this much better than others. There is a similar case while generating energy by wind and solar.
Could you please elaborate in what manner have these projects been useful to the villagers? (query by Mr.Krushna Hari Patil)
The Projects have brought employment opportunity at the village level. Lot of villagers have got employment - either as security guards, drivers, etc. This has made ii possible for them to earn a living at a place closer to their home rather than going far away into the cities. Apart from this, contracts for civil work have also been given to local villagers. Other work pertaining to these projects have helped the local villagers also such as hiring of transport services, civil contracts, couriers, office automation facilities such as photocopying/printing/fax services etc. (answer by Mr. Nishant Mudhale)
The project will use solar light for energy generation, would there be pollution from the plant? (Query by Mr. Sridhara)
For the project, the solar energy is renewable source of energy for pollution free electricity generation. Without the use of solar energy for electricity generation, that equal amount of electricity would have been generated by the fossil fuel based power plants in the regional grid. (Answer by Mr. Suraj)
I know for power plants, water is required. Is there water requirement for this project? (Query by Mr. Prabhu M)
No, water is not required in this technology based power projects. This shows the water saving opportunity for the region, which would be used during electricity generation by conventional power plants. (answer by Mr. Suraj)
I‟m not sure whether the project will have noise problem. Would you please have some introduction of the problem? (Query by Mr. Harshvardhan)
There are no such moving parts in this type of technology based power plants, thus there is no noise problem from this power project, at all. (answer by Mr. Suraj)
Will this project fetch the employment opportunities to the local residents? (Query by Mr. Raghunandan)
Yes, this project would generate employment opportunities in the region. Moreover this may attract more companies, to invest in such kind of clean energy generation projects, in this region along with employment opportunities. (answer by Mr. Suraj)

CDM-PDD-SCC-FORM
Version 05.0 Page 41 of 44
E.3. Report on consideration of comments received >> There were no negative comments raised by stakeholders in local stakeholder consultation meetings and due to the associated benefits stakeholders have appreciated the proposed project activity.
SECTION F. Approval and authorization >> Letter of approval from the Host Party involved in the project activity is not available at the time of submitting the PDD to the validating DOE.

CDM-PDD-SCC-FORM
Version 05.0 Page 42 of 44
Appendix 1. Contact information of project participants and responsible persons/ entities
Project participant and/or responsible person/ entity
Project participant Responsible person/ entity for completing the CDM-MR-FORM
Organization name Interocean Shipping India Private Limited Street/P.O. Box 75 Link Road Building Lajpat Nagar-III City New Delhi State/Region Delhi Postcode 110024 Country India Telephone +91 – 11 – 41551166 Fax +91 – 11- 41551177 E-mail [email protected] Website www.interocean.in Contact person Mr Gurjot S Sethi Title Senior Executive Salutation Mr Last name Sethi Middle name S First name Gurjot Department Power Mobile -- Direct fax -- Direct tel. -- Personal e-mail [email protected]

CDM-PDD-SCC-FORM
Version 05.0 Page 43 of 44
Appendix 2. Affirmation regarding public funding
No public funding involved in the project activity.
Appendix 3. Applicability of methodology and standardized baseline
Please refer section B.4
Appendix 4. Further background information on ex ante calculation of emission reductions
Please refer section B.6.3
Appendix 5. Further background information on monitoring plan
Please refer section B.7.2
Appendix 6. Summary of post registration changes
Not applicable

CDM-PDD-SCC-FORM
Version 05.0 Page 44 of 44
Document information
Version Date Description
05.0 25 June 2014 Revisions to: • Include the Attachment: Instructions for filling out the project
design document form for small-scale CDM project activities (these instructions supersede the "Guidelines for completing the project design document form for small-scale CDM project activities" (Version 01.1));
• Include provisions related to standardized baselines; • Add contact information on a responsible person(s)/
entity(ies) for the application of the methodology (ies) to the project activity in B.7.4 and Error! Reference source not found.;
• Change the reference number from F-CDM-SSC-PDD to CDM-PDD-SSC-FORM;
• Editorial improvement.
04.1 11 April 2012 Editorial revision to change history box by adding EB meeting and annex numbers in the Date column.
04.0 13 March 2012 EB 66, Annex 9 Revision required to ensure consistency with the “Guidelines for completing the project design document form for small-scale CDM project activities”
03.0 15 December 2006 EB 28, Annex 34 • The Board agreed to revise the CDM project design
document for small-scale activities (CDM-SSC-PDD), taking into account CDM-PDD and CDM-NM.
02.0 08 July 2005 EB 20, Annex 14 • The Board agreed to revise the CDM SSC PDD to reflect
guidance and clarifications provided by the Board since version 01 of this document.
• As a consequence, the guidelines for completing CDM SSC PDD have been revised accordingly to version 2. The latest version can be found at <http://cdm.unfccc.int/Reference/Documents>.
01.0 21 January 2003 EB 07, Annex 05 Initial adoption.
Decision Class: Regulatory Document Type: Form Business Function: Registration Keywords: project design document, SSC project activities