Project Cost Management - Parkland College
112
Project Cost Management Richard Boser
Transcript of Project Cost Management - Parkland College

Project Cost Management
Richard Boser

Project Cost Management
Introduction

Project Management Training Group -- Illinois State University
3
Course Objectives
Upon completing today’s activities you will be knowledgeable of tools and techniques to:
Allocate overall costs to WBS work packages
Develop a project estimate and budget
Use Earned Value Analysis to control budget
Immediately apply PM principles on the job

Project Management Training Group -- Illinois State University
4
Your Objectives
What do you want to get out of the course?
1
2
3
4
5
6

Project Management Training Group -- Illinois State University
5
Tentative Agenda
Hour Topic/Activity Slide #
1 Introduction
2 Estimating
3 Budgets & Cost Control
4 Earned Value Analysis
5 Accounting Issues

Project Management Training Group -- Illinois State University
6
Worried About Budget Cuts?
Source: http://californiamondioring.org/images/budgetcut.jpg

Project Management Training Group -- Illinois State University
7
Controlling Project Costs
What is the most difficult aspect of controlling project costs?
Predicting labor costs
Cost accounting process
Establishing overhead costs
Scope creep
August 2004 PM Network Magazine
member survey
8
8
6
78
Labor Cost
Accounting
Overhead
Scope Creep

Project Management Training Group -- Illinois State University
8
Which Project Control Functions Need the Most Improvement?
Source: Project Control Functions: Cited in PM Network January 2005.

Project Management Training Group -- Illinois State University
9
Cost Management Components(PMBOK)
Cost Estimating Costs for each resource
Cost Budget Allocating overall cost estimates to individual
work activities to establish cost baseline
Cost Control Controlling changes to project budget
Earned Value and variance analysis

Project Management Training Group -- Illinois State University
10
Estimating Basics – 1 (PMBOK)
Time treated separately by PMBOK, obvious inter-connection between time and cost.
On small projects resource planning, estimating, and budgeting may be same activity!
If project cost performance linked to incentives/rewards, then separate controllable and uncontrollable costs.
Project Management Training Group -- Illinois State University
11
Estimating Basics - 2
To improve accuracy: Base cost on WBS
Estimate developed by the person doing the work
Baseline estimate should only be updated for “approved” changes.
PM needs to determine costs, even if budget is set by senior mgmt AND reconcile any differences.

Project Management Training Group -- Illinois State University
12
Budget Estimates– Is their Common Ground?
Assuming that ALL parties are reasonably honest:
Jobs looks easier, faster, & cheaper to mgmt than to person doing the work.
Mgmt is optimistic and not prone to admitting errors or omissions.
Subordinates are naturally pessimistic & want to build in cost/time protection.
Mantel et al. (2001). Core Concepts in PM

Project Management Training Group -- Illinois State University
13
Estimate Politics - Construction
Vast majority of construction mega-projects over past 70 yrs had significant cost overruns. Sydney Opera House – 1,400% Boston – Big Dig/CAT – Can’t count that high!
Formula deciding which projects get built:
Project approval equals underestimated cost, plus overestimated revenue, plus undervalued environmental impact, plus overvalued economic development effect.”
Source - Viewpoint: Misrepresentation Drives Projects, p. 87 ENR, 1/5/04.

Project Management Training Group -- Illinois State University
14
Major PM Outputs To Date
Project Charter
Scope Statement
WBS
Activity List
Network Diagram
Activity Duration Estimates
Schedule

Project Management Training Group -- Illinois State University
15
Questions/Notes

Project Cost Management
Estimating
Project Management Training Group Illinois State University
Richard Boser

Project Management Training Group -- Illinois State University
17
Resource Planning
Inputs Tools & Techniques Outputs
Enterprise Environ
Factors
Org Process Assets
Activity List
Activity Attributes
Resources
Availability
PM Plan
Expert
Judgment
Alternative Analysis
Published Est
Data
PM Software
Bottom-up Estimate
Resource Req
Activity Attrib UP
Resource
Breakdown Struct
Resource Calendar
UP
Requested Changes
ResourcePlanning
CostEstimating
CostBudgeting
Cost Control
Project Management Training Group -- Illinois State University
18
Resource Planning Concerns 1
Organizations internal & external resource pool, capacity, & demand?
Where can necessary availability of knowledge and skills be found?
Type and capacity needed for project?
Are most knowledgeable and skilled resources working on most strategic initiatives?
Project Management Training Group -- Illinois State University
19
Resource Planning Concerns 2
What is the availability of a given resource for a specific period of time?
How are resources performing on a given project, program, or business area?
What are resource utilizations, realization, and profitability?
Project Management Training Group -- Illinois State University
20
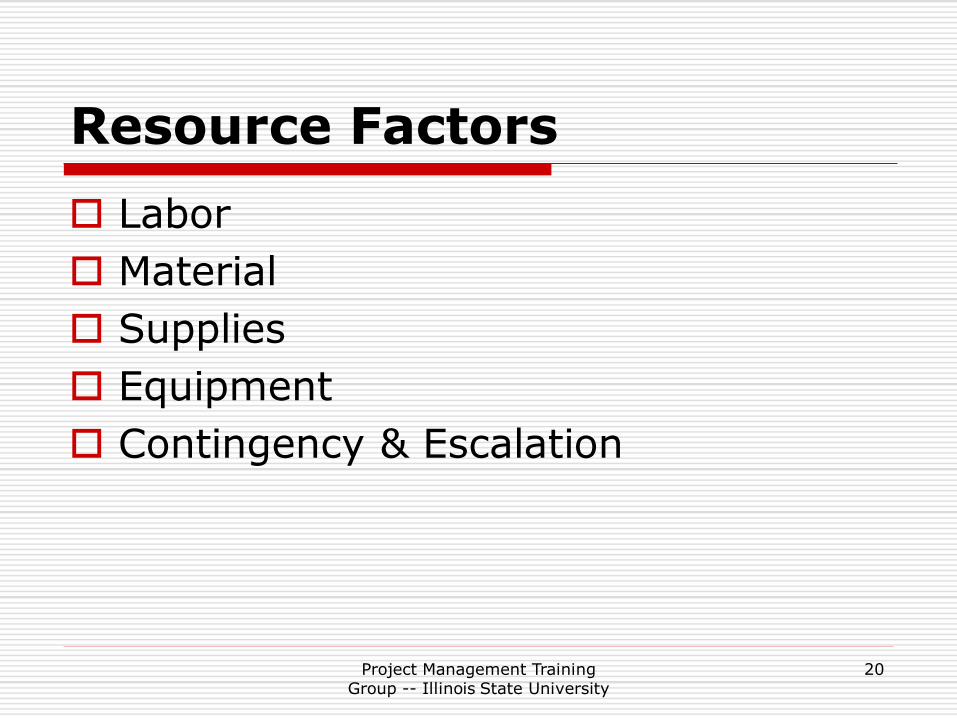
Resource Factors
Labor
Material
Supplies
Equipment
Contingency & Escalation
Project Management Training Group -- Illinois State University
21
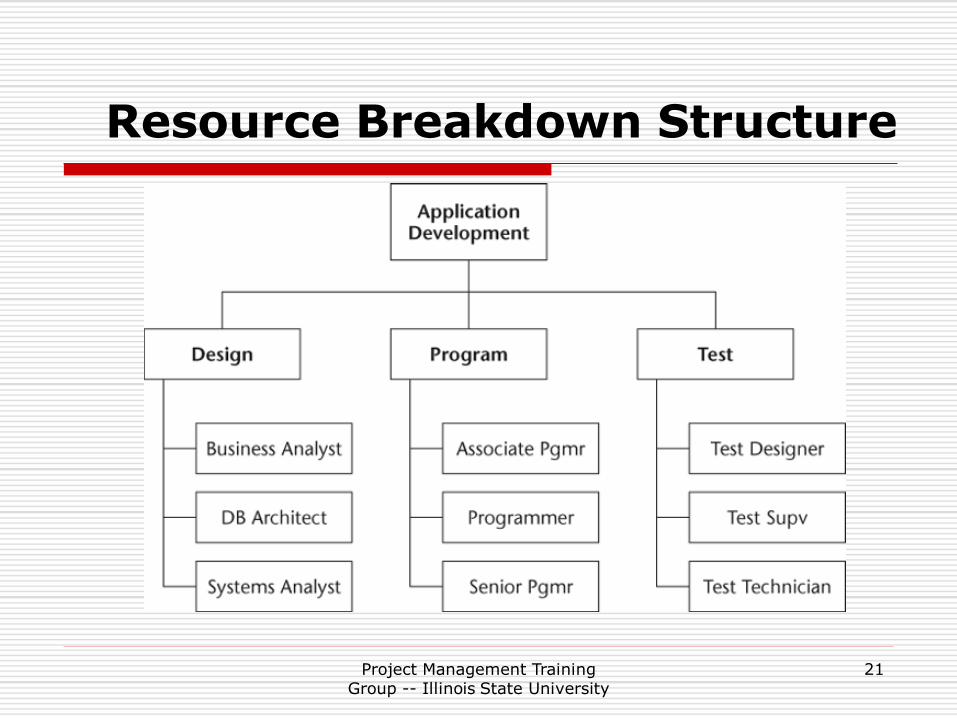
Resource Breakdown Structure

Project Management Training Group -- Illinois State University
22
Resource Leveling
Any form of network analysis in which scheduling decisions are driven by resource management concerns.
Limited resource availability
Difficult to manage changes in resource levels
Rescheduling activities so the requirement for resources on the project does not exceed resource limits.
(Source: Max Wideman’s PM Glossary)

Project Management Training Group -- Illinois State University
23
Resource Leveling Example
Red = Critical PathGreen = Activities with floatBlue = Available float
Would it be useful to level the resources?

Project Management Training Group -- Illinois State University
24
Time Scaled Dependencies
Source: Robert Wysocki (2003). Effective Project Management.

Project Management Training Group -- Illinois State University
25
Resource Leveling Activity
See hand out
Enter critical resources first
How can float be applied to balance worker loading?

Project Management Training Group -- Illinois State University
26
7.1 Cost EstimatingInputs Tools &
TechniquesOutputs
Enterprise Envir
Factors
Org Proc Assets
Scope Statement
WBS & Dictionary
PM Plan
- Schedule plan
- Staff plan
- Risk register
Analogous Est
Resource costs
Parametric Est.
Bottom-up Est.
PM Software
Vendor bids
Reserve analysis
Cost of quality
Activity cost
estimate
Supporting detail
Requested
changes
Cost mgmt plan
UP
ResourcePlanning
CostEstimating
CostBudgeting
Cost Control

Project Management Training Group -- Illinois State University
27
Cost Estimating Process
WBS
ResourceRequirements
ResourceRates
EstimateMethod
Estimate
•Historical•Analogous•Parametric•Weighted•Bottom-Up•Vendor Bid

Project Management Training Group -- Illinois State University
28
Estimate
Estimate vs. Pricing
Estimate is an “Approximation” of resources needed to complete the project (quantification)
Pricing is a business decision with estimate just one input. Other factors:
Supply & Demand, Risk, etc.
Budget – Planned allocation of resources, based on estimate.

Project Management Training Group -- Illinois State University
29
Methods of Estimating
Top-Down (Analogous) Collective judgment based on previous similar
projects: Used when limited detail exists, Less costly, but less accurate
Parametric Mathematical models (linear regression,
learning curves) to predict project costs – e.g. cost per line of code, cost per linear foot, and cost per installation.
Bottom-Up Based on WBS – Resource requirements
estimated by those responsible for execution

Project Management Training Group -- Illinois State University
30
Analogous Estimate - NASA
RFQ And Historical Data
PDQ Inc., has received an RFQ for 84 XYZ Systems to be built and delivered in 2005. A 120-lot of this same system was delivered in 2001.
How will the proposed 84-lot be different from the historical (baseline) of 120-lot?
Plant now at full capacity
Shortage of skilled workers
New manufacturing processes reduced cycle time to 100 hours.
Inflation adjustment, etc.Source: http://www.jsc.nasa.gov/bu2/PCEHHTML/pceh.htm
Project Management Training Group -- Illinois State University
31
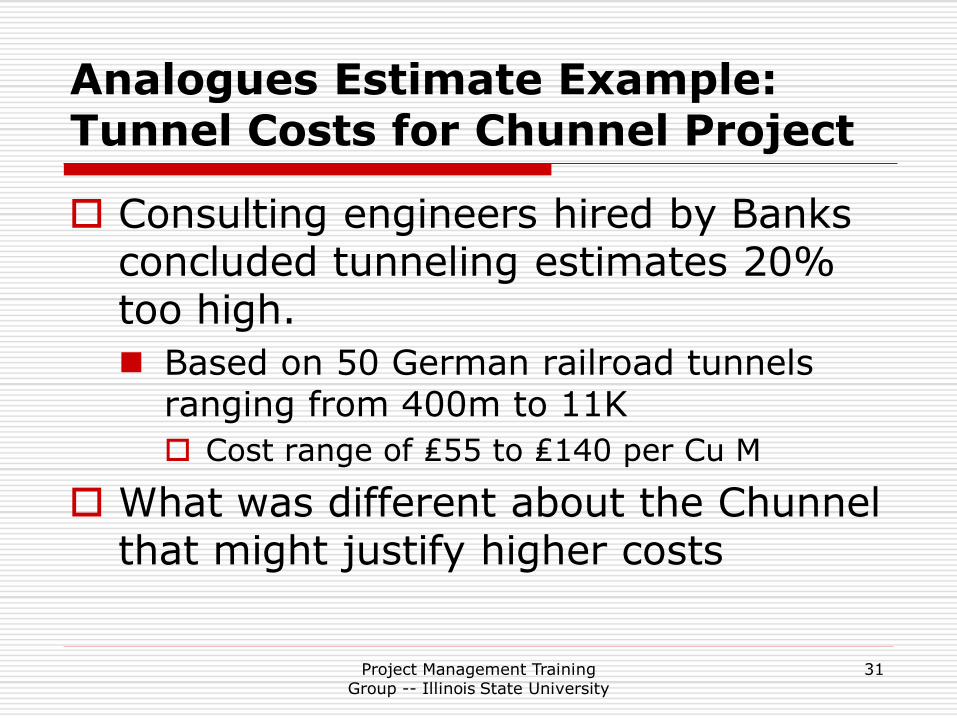
Analogues Estimate Example:Tunnel Costs for Chunnel Project
Consulting engineers hired by Banks concluded tunneling estimates 20% too high.
Based on 50 German railroad tunnels ranging from 400m to 11K
Cost range of ₤55 to ₤140 per Cu M
What was different about the Chunnel that might justify higher costs

Project Management Training Group -- Illinois State University
32
PERT or Weighted Average $
E = (O + 4m + P) / 6 = Expected Cost
O = Optimistic time
Expected duration in only 1 of 20 repetitions
m = Most likely
P = Pessimistic time
Expected duration in only 1 of 20 repetitions
Note: Assumes “Normal” distribution

Project Management Training Group -- Illinois State University
33
Support Details for Estimate
WBS Dictionary/Description
How estimate was developed?
Assumptions
Cost range, e.g. $20,000 +/- $2,000
Level of confidence
Audit trail of estimate development

Project Management Training Group -- Illinois State University
34
Direct Costs
Costs that are specifically attributable to an activity or group of activities without apportionment.
Costs such as labor, material, equipment, travel that can be consistently related to work performed on a particular project.
Direct costs are best contrasted with indirect costs that cannot be identified to a specific project.
Source: Max Wideman’s PM Glossary

Project Management Training Group -- Illinois State University
35
Indirect Costs
Also known as Overhead, General & Administrative (G&A), or Burden.
Resources expended which are not directly identified to a specific contract, project, product, service, or activity. e.g. taxes, accounting, HR
Costs may be allocated to projects on a prorated basis.
Source: Max Wideman’s PM Glossary

Project Management Training Group -- Illinois State University
36
Fixed Costs
Costs that do not vary with the volume of work such as set-up, rental fees, accommodation, insurance, depreciation, security and utilities.

Project Management Training Group -- Illinois State University
37
Variable Cost
Cost that changes with the production quantity or the performance of services.
Cost that changes over time, such as an hourly rate for resources that rises as the resource continues to work.
Materials, supplies, wages

Estimating Activity
For one activity or work package, identify and estimate the cost of:
Project Management Training Group -- Illinois State University
38
DirectCosts
1. Labor2. Material3. Equip4.5.6.
Indirect Costs
1. Overhead2. G&A3. Utilities4.5.6.
Fixed Costs
1. Set-up2. Rentals 3. Insurance4. Utilities5.6.
Variable Costs
1. Materials2. Supplies3. Wages 4.5.6.

Project Management Training Group -- Illinois State University
39
Accuracy of Estimates
Rough Order of Magnitude Estimate Guestimate range at project initiation -50% to +100% from actual
Budget Estimate Developed during planning phase -10% to +25% from actual
Definitive Estimate Developed during planning -5% to +10% from actual
Project Management Training Group -- Illinois State University
40
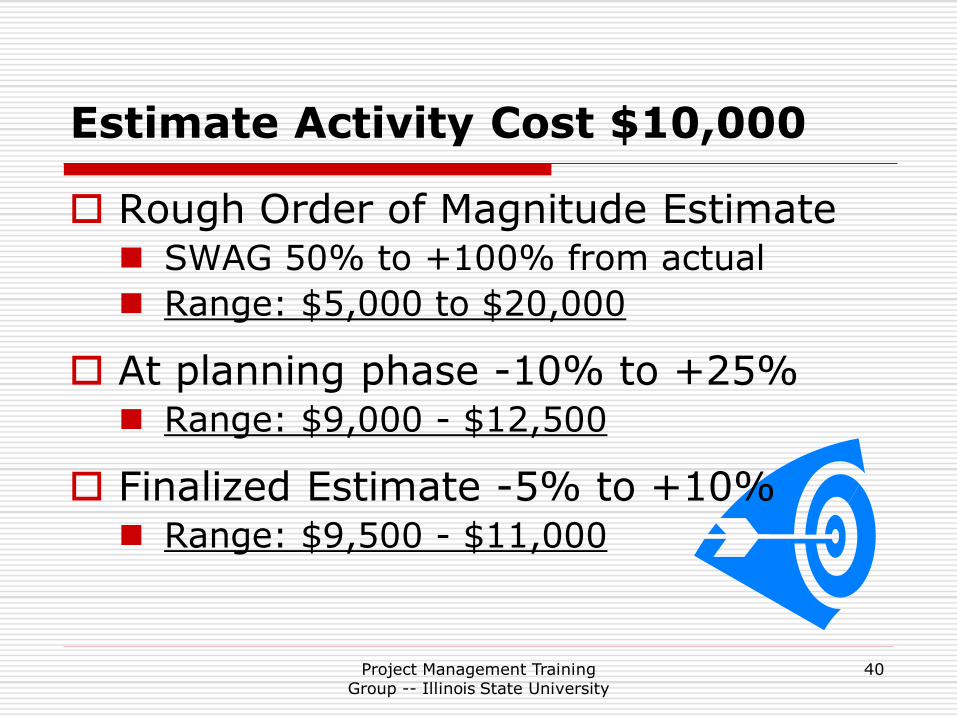
Estimate Activity Cost $10,000
Rough Order of Magnitude Estimate SWAG 50% to +100% from actual
Range: $5,000 to $20,000
At planning phase -10% to +25% Range: $9,000 - $12,500
Finalized Estimate -5% to +10% Range: $9,500 - $11,000

Project Management Training Group -- Illinois State University
41
Variation in Cost & Schedule Estimates by Phase
Effort and Size Schedule
Phase Optimistic Pessimistic Optimistic Pessimistic
Initial concept
0.25 4.0 0.60 1.60
Approved concept
0.50 2.0 0.80 1.25
Req. Specs 0.67 1.5 0.85 1.15
Product specs.
0.80 1.25 0.90 1.10
Detailed specs.
0.90 1.10 0.95 1.05
Source: Barry Boehm, www.learningsolutions.com
Project Management Training Group -- Illinois State University
42
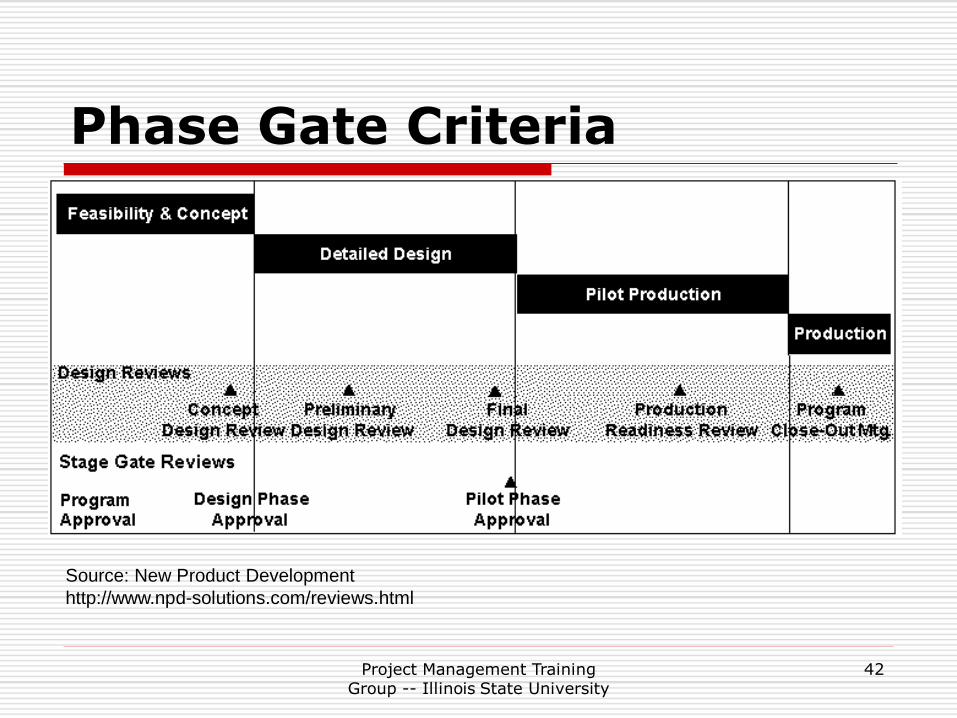
Phase Gate Criteria
Source: New Product Development
http://www.npd-solutions.com/reviews.html
Project Management Training Group -- Illinois State University
43
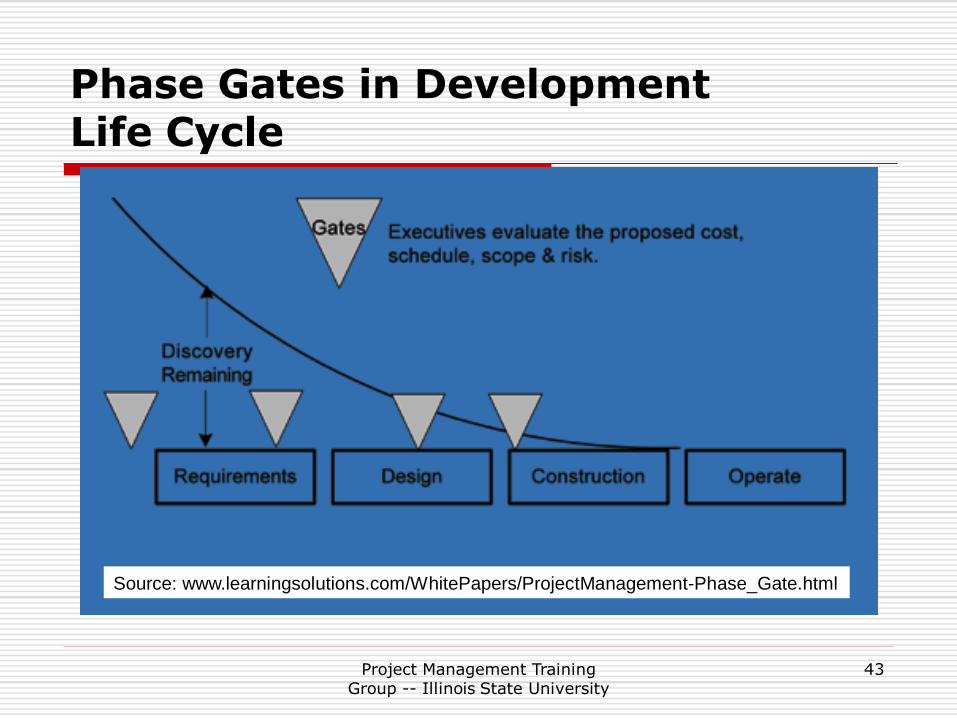
Phase Gates in Development Life Cycle
Source: www.learningsolutions.com/WhitePapers/ProjectManagement-Phase_Gate.html

Project Management Training Group -- Illinois State University
44
Issues in Budget Types
Top-Down
Accurate overall
Variance in details
Most common
Bottoms-Up
More accurate
Creates buy-in
Rare in true form
• Upper-level managers reluctant to let workers set budget
• Fear natural tendency to overstate costs
• Budget is mgmt’s primary tool for project control
• Reluctant to let other set control limits
Mantel et al. (2001). Core Concepts in PM

Project Management Training Group -- Illinois State University
45
Types of Estimating Errors
Random errors cancel out – often called compensating error
Bias – consistent high or low costing

Project Management Training Group -- Illinois State University
46
Potential Estimating Problems
Misinterpretation of scope - poorly defined requirements.
Inaccurate WBS
Failure to account for risks
Poorly defined or overly optimistic schedule
Shortage of qualified resources
Failure to account for cost escalation and inflation
Failure to use the correct estimating techniques
Inaccurate pricing rates for overhead, general and administrative, and indirect costs
Inexperienced project managers

Project Management Training Group -- Illinois State University
47
Costing Alternatives
Life Cycle Costing Project cost alternatives include acquisition,
operating, and disposal.
Total costs to organization for ownership and acquisition of the product over its full life.

Project Management Training Group -- Illinois State University
48
Costing Alternatives
Value Engineering
Organized effort to analyze the functions of systems, equipment, facilities, services, and supplies for the purpose of achieving the essential functions at the lowest life cycle cost consistent with required performance, reliability, quality, and safety. (Max
Wideman’s PM Glossary)

Project Management Training Group -- Illinois State University
49
Lifecycle Cost Elements R & D Costs: The cost of feasibility studies; cost-benefit analysis;
system analysis; design detail and development; fabrication, assembly; testing of engineering models; and associated documentation.
Production Costs: The cost of fabrication, assembly and testing of production models; operation and maintenance of the production capability; and associated logistical support requirements.
Construction Costs: The cost of new manufacturing facilities or upgrading of existing structures to accommodate production and operation of support requirements.
Operation and Maintenance Costs: The cost of sustaining operational personnel and maintenance support. Examples include: spare/repair parts, test and support equipment, transportation and handling, facilities modifications, and technical data changes.
Product retirement and phase-out costs: The cost of phasing the product out of inventory due to obsolescence or wear out, and subsequent equipment item recycling and reclamation as appropriate.

Project Management Training Group -- Illinois State University
50
Learning Curve Impact on Estimate

Project Management Training Group -- Illinois State University
51
Learning Curve Steps
Unconscious incompetence
Conscious incompetence
Conscious competence
Unconscious competence
Atherton, J. S. (2003) Learning and Teaching: Learning Curve [On-line] UK:Available: http://www.dmu.ac.uk/~jamesa/learning/lerncrv.htm
Typically, unit performance improves by a fixed %
each time total production quantity doubles.

Project Management Training Group -- Illinois State University
52
Learning Curve Example
A firm wins a contract to supply 30 units of a complex
electronic device. The firm is competent to produce
the device, but has never produced one this complex.
Learning Curve in Action
Typical manufacturing learning curve = 80%
• First unit estimated to take 10 hours to produce.
• Second unit would require: 0.80 x 10 = 8 hours
• Fourth unit: 0.80 x 8 = 6.4 hours
• Eighth unit: 0.80 x 6.4 = 5.12 hours
Eventually time levels out and no further gains accrued.

Project Management Training Group -- Illinois State University
53
Review Questions
1. What are the pros & cons of top-down and bottoms-up budgeting?
2. How can the learning curve be applied to the time/cost estimate?
3. What is the expected range of accuracy of Definitive estimates?
4. Provide an example of fixed costs? Variable costs?
5. Explain the difference between and analogous and parametric estimate?
6. What is the purpose of value engineering?

Project Management Training Group -- Illinois State University
54
Questions/Notes

Project Cost Management
Budgeting
Project Management Training Group Illinois State University
Richard Boser
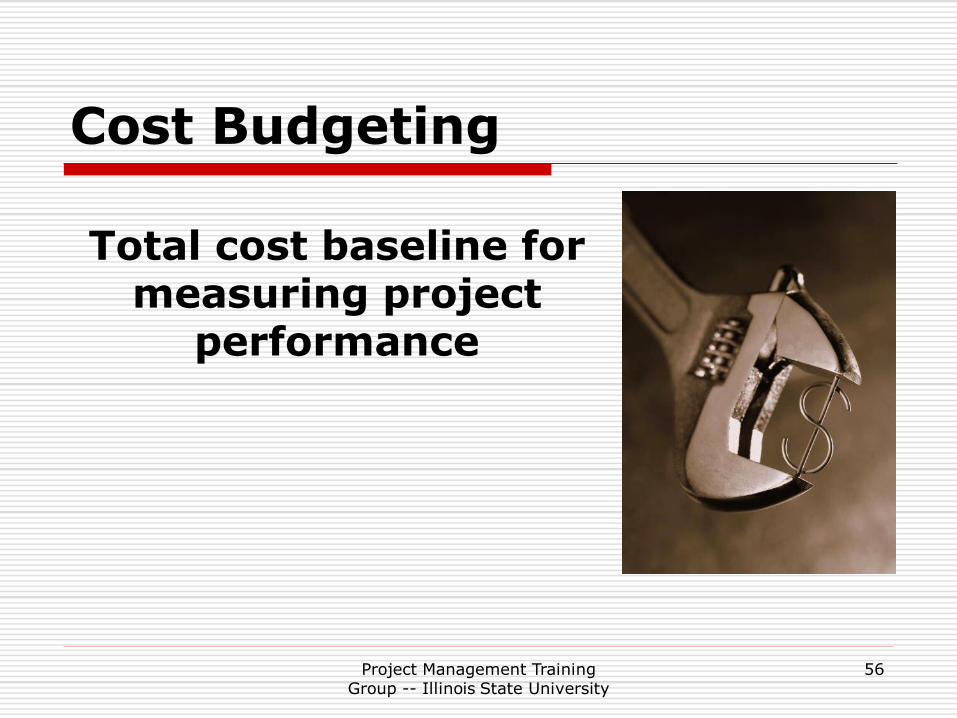
Cost Budgeting
Total cost baseline for measuring project
performance
Project Management Training Group -- Illinois State University
56

Project Management Training Group -- Illinois State University
57
Traffic Enforcement Budget?
Source: http://www.lacp.org/Graphics/PoliceBike.jpg

Project Management Training Group -- Illinois State University
58
7.2 Cost Budgeting
Inputs Tools & Techniques
Outputs
Scope
WBS
WBS Dictionary
Cost Estimate &
Supporting detail
Schedule
Res. Calendars
Contracts
Cost Mgmt Plan
Cost aggregates
Reserve analysis
Parametric Est.
Fund limiting
reconciliation
(Cost leveling)
Cost baseline
Funding req.
(Progress Pay)
Cost Mgmt Plan
UP
Req. changes
ResourcePlanning
CostEstimating
CostBudgeting
Cost Control
Project Management Training Group -- Illinois State University
59
What Elements Do Estimate & Budget Have in Common?
Direct Costs of Resources
Indirect Costs
Project Overhead
General & Administrative
Contingency and Escalation
Profit (Market factors)
Above sums into baseline budget

Project Management Training Group -- Illinois State University
60
Contingency & Escalation
Contingency:
Specific provision(s) to mitigate random or unknown project risks from causing project failure or frequent baseline changes.
Reserves (2 Types): Provision in project plan to mitigate cost and/or schedule risk.
Escalation (Inflation)
Anticipated rise in uncommitted costs of resources (labor, material, equipment) over duration of project.
Adapted from Max Wideman’s PM Glossary
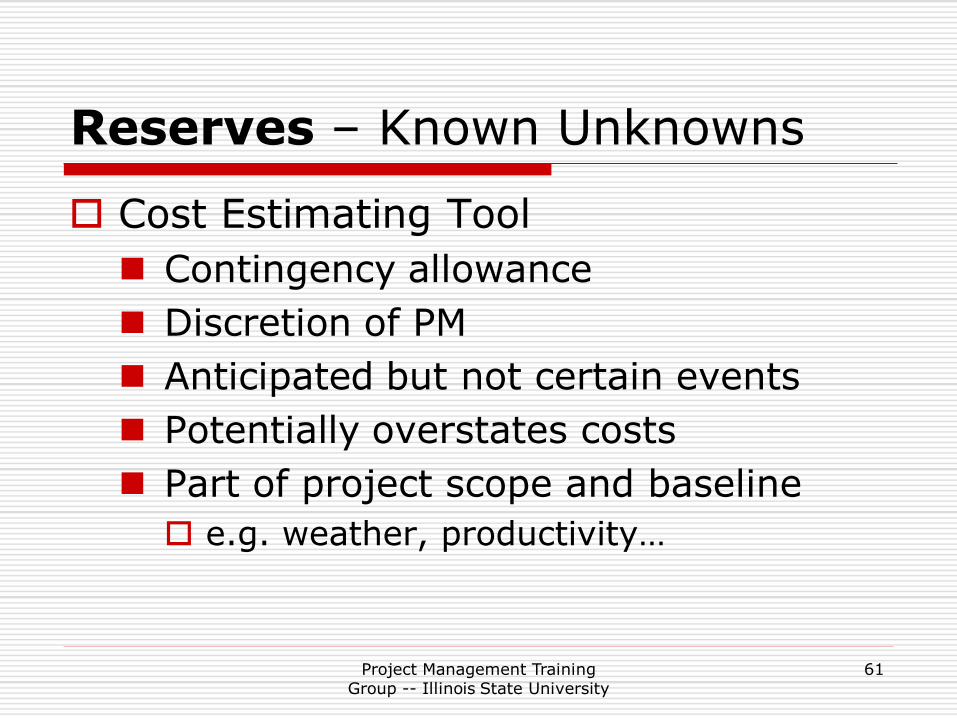
Reserves – Known Unknowns
Cost Estimating Tool
Contingency allowance
Discretion of PM
Anticipated but not certain events
Potentially overstates costs
Part of project scope and baseline
e.g. weather, productivity…
Project Management Training Group -- Illinois State University
61

Reserves – Unknown Unknowns
Budgeting Tool - Mgmt Contingency
Unplanned but potentially required changes to scope & baseline
Approval needed for PM to spend
May result from risk register
NOT part of project baseline
NOT part of EVA
e.g. risks, approved changes…
Project Management Training Group -- Illinois State University
62

Project Management Training Group -- Illinois State University
63
Cumulative Cost, Time & Uncertainty
Cumulative
Project
Cost
Time
Estimate
Contingency
Project Initiation
Analysis Complete
Design Complete
Actual Cost/Time
Source: J. M. Nicholas (2004)

Project Management Training Group -- Illinois State University
64

Project Management Training Group -- Illinois State University
65
Budget Output - Cost Baseline
Cumulative
Project
Cost
Time
Expected
Cash Flow
Cost
Baseline
PMBOK Fig. 7.2
• Time-phased, used to measure & monitor cost performance.• Cumulative costs typically result in S-curve.

Budget Aggregation
Cost Budget $2,150
Mgmt Reserve $ 280 (e.g. 15%)
Cost Baseline $1,870
Contingency Reserve $ 170 (e.g. 10%)
Project $1,700
Control Account $1,000
Work Packages $ 300 $700
Activities $100 + $100 + $100
$350 + $250 + $100
Project Management Training Group -- Illinois State University
66

Questions & Notes
Project Management Training Group -- Illinois State University
67

Project Management Training Group -- Illinois State University
68
7.3 Cost Control
Inputs Tools & Techniques
Outputs
Cost baseline
Funding require
Performance
reports
Work perform
info
Change requests
PM plan
Cost change
control system
Performance
measurements
Forecasting
Proj perform
review
PM software
Variance mgmt
Cost estimate UP
Baseline UP
Perform measure
Forecast complete
Req changes
Corrective action
Org Proc Asset UP
(Lessons learned)
PM plan UP
ResourcePlanning
CostEstimating
CostBudgeting
Cost Control

Project Management Training Group -- Illinois State University
69
Cost Control (PMBOK)
Monitor and document cost performance to detect and understand variance
Ensure appropriate changes are recorded accurately on the cost baseline
Prevent incorrect/unauthorized changes from being included on the cost baseline
Inform stakeholders of authorized changes
Acting to bring expected costs within acceptable limits

Project Management Training Group -- Illinois State University
70
Change Requests

Project Management Training Group -- Illinois State University
71

Project Management Training Group -- Illinois State University
72
Types of Progress Reporting
Physical progress - % Complete
50/50 Rule -- A task is 50% complete once it isstarted and 100% complete only when finished
20/80 Rule -- A task is 20% complete once it isstarted and 100% complete only when finished
0/100 Rule -- A task does not get credit for partialcompletion it is 100% complete only whenfinished

Project Management Training Group -- Illinois State University
73
Earned Value Management
Is the project ahead/behind schedule?
Is the project over/under budget?
How efficiently is the project team using resources (time/money)?
When is the project likely to be completed?
What is the likely cost at completion?

Project Management Training Group -- Illinois State University
74
Earned Value: PurposeManagement team can readily compare how much work has
actually been completed against the amount of work planned
to be accomplished. Planned work constitutes a cost and
schedule measurement baseline.
Source: http://evm.nasa.gov/definition1b.html

Project Management Training Group -- Illinois State University
75
EVA – 3 Key Values
Planned Value (PV)
Physical work scheduled to be performed and the estimated value of work (old – BCWS - Budgeted Cost of Work Scheduled)
Earned Value (EV) – Measured Progress
Physical work actually accomplished including value of work (old – BCWP - Budgeted Cost of Work Performed)
Actual Cost (AC)
Cost incurred to accomplish the Earned Value (old – ACWP – Actual Cost of Work Performed)
Note: Values can be cost or time!

Project Management Training Group -- Illinois State University
76
EVA – Key Values Examples
Planned Value: Total planned budget for a 5-day task is $1000 and it starts on Monday. If status date is the following Wednesday (end of day 3), the PV is $600.
Actual Cost: If task actually incurs a total cost of $150 during each of the first 3 days, then AC is $450.
Earned Value: If after 3 days 50% percent of the work on a task has been completed, then EV is $500.

Earned Value Ex. #1
Source: http://www.stsc.hill.af.mil/crosstalk/frames.asp?uri=1999/04/smith.asp
AC
EV
PV

Project Management Training Group -- Illinois State University
78
Earned Value Graphic Report
Time
Cumulative
Values
Date Date
Planned
Value
Earned Value
Actual
Costs
Source: Adapted from PMBOK 2000 Fig. 10-2

Schedule VarianceWork performed is "earned" on the same basis it was planned,
i.e. dollars, work hours, or other quantifiable units. Planned
value (PV) compared with earned value (EV) measures work
planned vs. work accomplished. Any difference is called
schedule variance.
$50,000
Source: Earned Value Mgmt @ http://evm.nasa.gov/definition1b.html
SV = EV - PV

Cost VarianceEarned Value for work performed compared with actual
cost incurred for work performed (from accounting
systems), provides objective measure of cost efficiency. Any
difference is cost variance.
PV
AC
EV
Source: Earned Value Mgmt @ http://evm.nasa.gov/definition1b.html
CV = EV - AC

Variance Calculations
PV
AC
EV
Source: Earned Value Mgmt @ http://evm.nasa.gov/definition1b.html
$50,000
$100,000
$80,000
CV = EV – AC = 50K – 80K = -30K = Cost Overrun
SV = EV – PV = 50K – 100K = -50K = Behind Schedule
SPI = EV / PV = 50K / 100K = .50 - Progress at 50% planned rate.
CPI = EV / AC = 50K / 80K = .625 – Earning 62 cents on the $.

Project Management Training Group -- Illinois State University
82
Earned Value Ex. #2
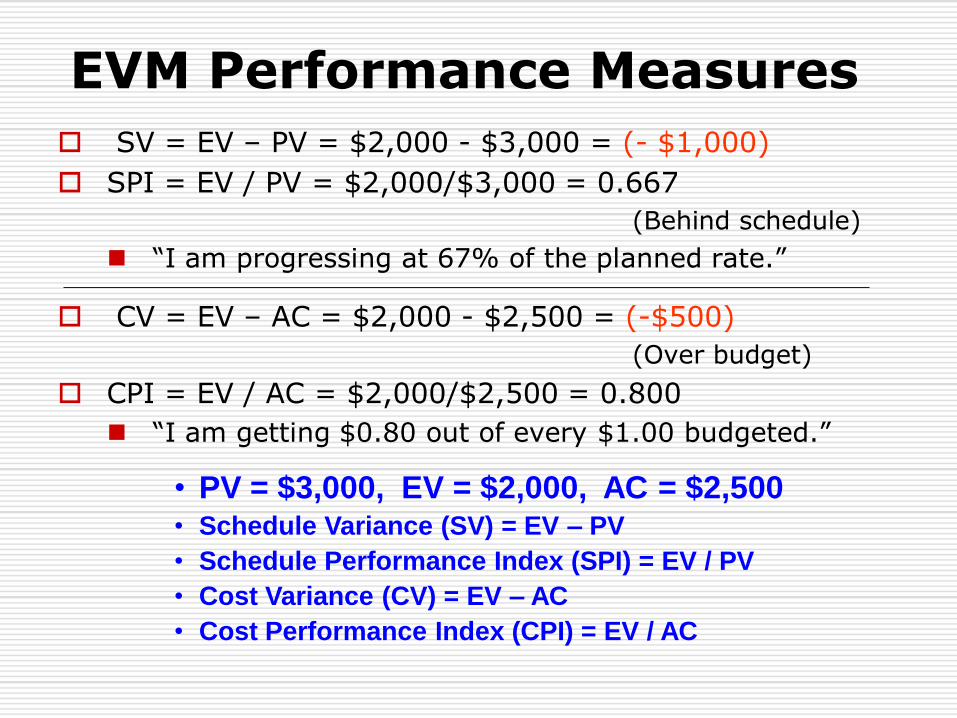
A contractor agrees to build a 4 sided fence. The work is scheduled for ONE day per side (four consecutive days) at a cost of $1,000 per side (total $4,000). At the end of Three days work, the contractor has completed two sides of the fence and spent $2,500.
Perform an EVM analysis at this point in the project.
PV = $3,000
EV = $2,000
AC = $2,500
Planned Value (PV) – Value of work scheduled to date
Earned Value (EV) – Value of work actually accomplished
Actual Cost (AC) - Cost incurred to accomplish work
Source: Rita Malcahy PMP Exam Prep
Project Management Training Group -- Illinois State University
83
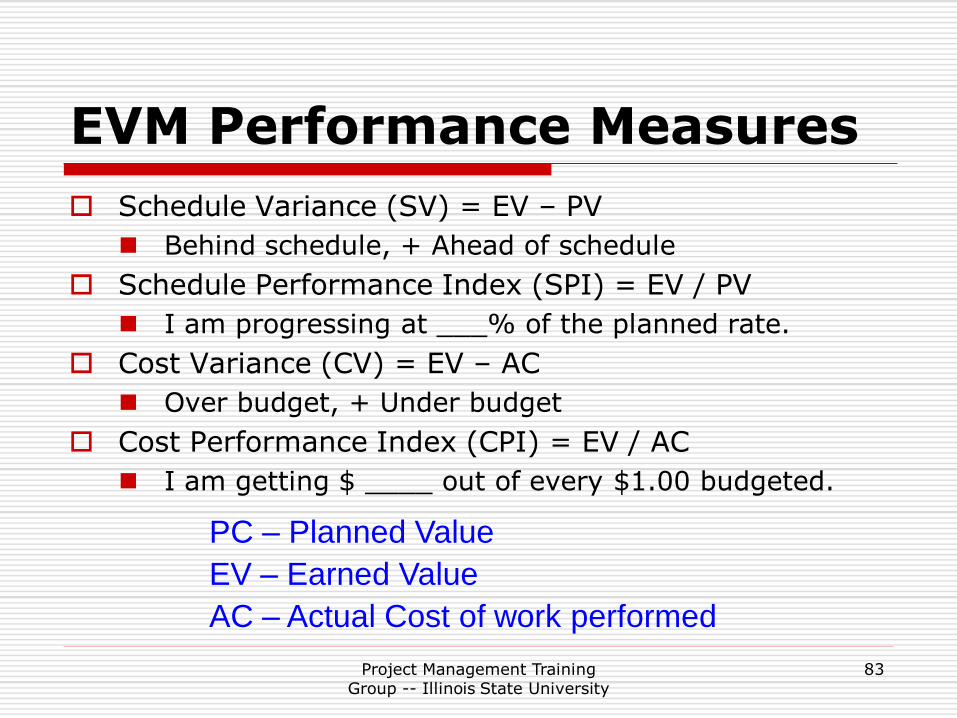
EVM Performance Measures
Schedule Variance (SV) = EV – PV
Behind schedule, + Ahead of schedule
Schedule Performance Index (SPI) = EV / PV
I am progressing at ___% of the planned rate.
Cost Variance (CV) = EV – AC
Over budget, + Under budget
Cost Performance Index (CPI) = EV / AC
I am getting $ ____ out of every $1.00 budgeted.
PC – Planned Value
EV – Earned Value
AC – Actual Cost of work performed
EVM Performance Measures
SV = EV – PV = $2,000 - $3,000 = (- $1,000)
SPI = EV / PV = $2,000/$3,000 = 0.667
(Behind schedule)
“I am progressing at 67% of the planned rate.”
CV = EV – AC = $2,000 - $2,500 = (-$500)
(Over budget)
CPI = EV / AC = $2,000/$2,500 = 0.800
“I am getting $0.80 out of every $1.00 budgeted.”
• PV = $3,000, EV = $2,000, AC = $2,500• Schedule Variance (SV) = EV – PV
• Schedule Performance Index (SPI) = EV / PV
• Cost Variance (CV) = EV – AC
• Cost Performance Index (CPI) = EV / AC

Project Management Training Group -- Illinois State University
85
Costs at Completion
BAC = Budget at Completion
How much was the total project budget?
ETC = Estimate To Completion
From this point forward, how much MORE will it cost to finish the project?
ETC = (BAC – EV) / CPI -- or = EAC - AC
VAC = Variance at Completion
How much over or under budget do we expect to be a completion of the project?
VAC = BAC - EAC

Project Management Training Group -- Illinois State University
86
Estimate at Completion (EAC)
EAC is the forecast of the most likely project costs based on performance reports and risk quantification (PMBOK).
EAC = BAC / CPI
May be in a cost range of high to low.
Start Data
Date
EAC
AC ETC
PV BAC

Project Management Training Group -- Illinois State University
87
EAC - Ways to Calculate1. EAC = BAC / CPI (Most common method)
Assumes current variance will continue
2. EAC = AC + ETC
Original estimate flawed or changing conditions make it irrelevant.
3. EAC = AC + (BAC – EV)
Use if project experienced atypical variance that is not expected to continue.
4. EAC = AC + (BAC – EV) / CPI
Similar to #2 only modified by Cost Performance Index
• BAC = Budget at Completion
• ETC = Estimate at Completion
• VAC = Variance at Completion
• PC – Planned Value
• EV – Earned Value
• AC – Actual Cost of work

Project Management Training Group -- Illinois State University
88
EAC – Calculation Example
Which is most likely to yield realistic answer?
1. EAC = BAC / CPI = $4,000 / 0.80 = $5,000
2. EAC = AC + ETC
3. EAC = AC + (BAC – EV)
= $2,500 + ($4,000 - $2,000) = $4,500
4. EAC = AC + (BAC – EV) / CPI
= $2,500 + ($4,000 - $2,000) / 0.80 = $5,000
•BAC = Budget at Completion = $4,000
•ETC = Estimate at Completion
•VAC = Variance at Completion
•PC – Planned Value
•EV – Earned Value
•AC – Actual Cost of work
•PV = $3,000, EV = $2,000, AC = $2,500, CPI = 0.80

Project Management Training Group -- Illinois State University
89
Summary of EVA Formulas
PV
AC
EV
CV = EV – AC
CPI = EV / AC
SV = EV – PV
SPI = EV / PV
BAC = Baseline $
EAC= BAC / CPI
= AC + ETC
= AC + BAC – EV
= AC + (BAC – EV)/CPI
ETC = EAC – AC
= (BAC – EV) / CPI
VAC = BAC - EAC

Project Management Training Group -- Illinois State University
90
Earned Value Activity
The Pentagon agrees to build a 5 sided fence. The work is scheduled for ONE month per side at a cost of $1,000 per side (total $5,000). At the end of 3 months work, the contractor has completed 2 sides of the fence and spent $4,000 (and seeking change orders to recoup costs).
Perform an EVM analysis at this point in the project.
PV = ______ AC =_____ EV = _______
CV = ______ CPI = ____ BAC = _______
SV = ______ SPI = ____ EAC = _______
ETC = _____ VAC = ___
Adapted From Rita Malcahy PMP Exam Prep

Project Management Training Group -- Illinois State University
91
EVA Ex. #3 Worksheet
EVA Item Value Interpretation
PV
EV
AC
BAC
CV
CPI
SV
SPI
EAC
ETC
VAC

Project Management Training Group -- Illinois State University
92
Cost Management Plan
How will you handle cost variance?
EVA indicates cost and schedule overruns! What now?
Identify 4-6 corrective actions you would take.

Project Management Training Group -- Illinois State University
93
EVA Performance Report (PMBOK)
Budget Earned Cost
# WBS Element
Planned
Value $
Earned
Value $
Actual
Cost $ $ % $ % Cost CPI
Schedule
SPI
(PV) (EV) (AC) (CV=EV-AC) (CV / EV) (SV=EV-PV) (SV / PV) (EV / AC) (EV / PV)
1.0 Pre-Pilot Plan 63,000 58,000 62,500 (4,500) -7.8% (5,000) -7.9% 0.93 0.92
2.0 Checklists 64,000 48,000 46,800 1,200 2.5% (16,000) -25.0% 1.03 0.75
3.0 Curriculum 23,000 20,000 23,500 (3,500) -17.5% (3,000) -13.0% 0.85 0.87
4.0 Midterm Eval 68,000 68,000 72,500 (4,500) -6.6% - 0.0% 0.94 1.00
5.0 Implementation Support 12,000 10,000 10,000 - 0.0% (2,000) -16.7% 1.00 0.83
6.0 Manual of Practice 7,000 6,200 6,000 200 3.2% (800) -11.4% 1.03 0.89
7.0 Roll-Out Plan 20,000 13,500 18,100 (4,600) -34.1% (6,500) -32.5% 0.75 0.68
Totals 257,000 223,700 239,400 (15,700) -7.0% (33,300) -13.0% 0.93 0.87
Source: PMBOK 2000 Fig 10-3
Cost Variance Schedule Variance Performance Index

Project Management Training Group -- Illinois State University
94
Earned Value Ex. #4
Project Management Training Group -- Illinois State University
95
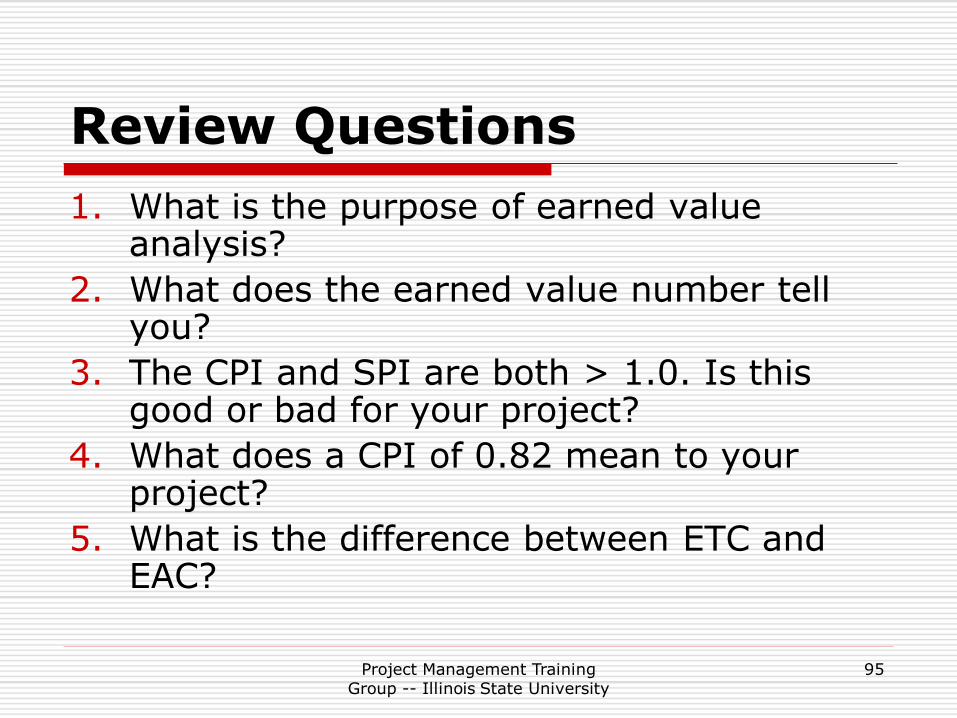
Review Questions
1. What is the purpose of earned value analysis?
2. What does the earned value number tell you?
3. The CPI and SPI are both > 1.0. Is this good or bad for your project?
4. What does a CPI of 0.82 mean to your project?
5. What is the difference between ETC and EAC?
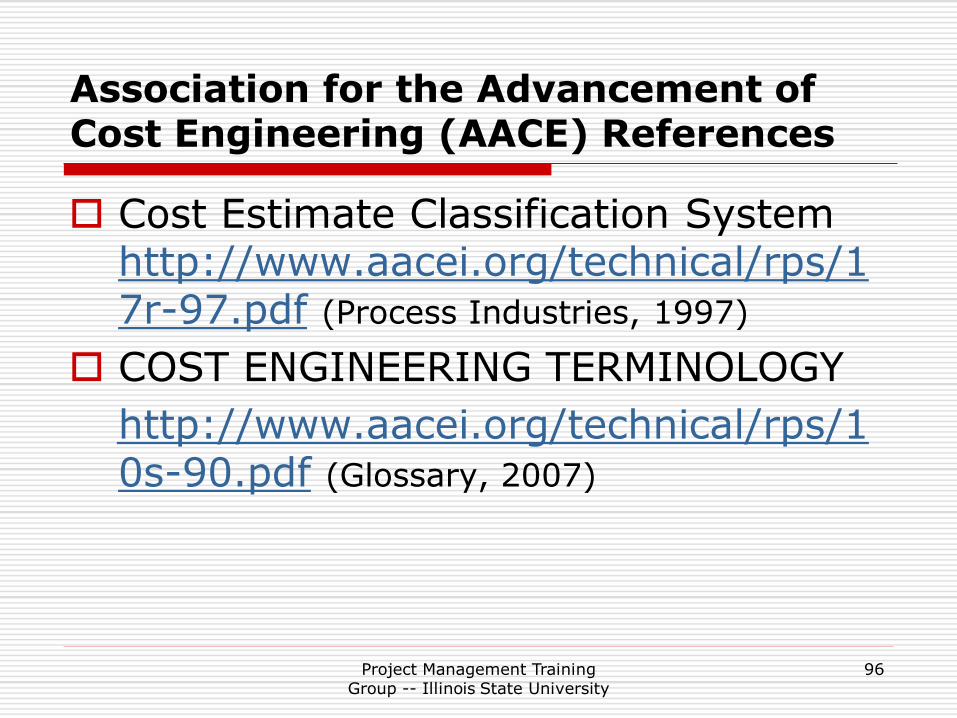
Association for the Advancement of Cost Engineering (AACE) References
Cost Estimate Classification System http://www.aacei.org/technical/rps/17r-97.pdf (Process Industries, 1997)
COST ENGINEERING TERMINOLOGY
http://www.aacei.org/technical/rps/10s-90.pdf (Glossary, 2007)
Project Management Training Group -- Illinois State University
96

Questions/Notes
Project Management Training Group -- Illinois State University
97

Project Management Training Group -- Illinois State University
98
Answers to EVA Activity
EVA Item Value
PV 3,000
EV 2,000
AC 4,000
BAC 5,000
CV (2,000)
CPI 50%
SV (1,000)
SPI 67%
EAC 10,000
ETC 6,000
VAC (5,000)
The Pentagon agrees to build a 5 sided fence. The work is scheduled for ONE month per side at a cost of $1,000 per side (total $5,000). At the end of 3 months work, the contractor has completed 2 sides of the fence and spent $4,000 (and seeking change orders to recoup costs).

Project Cost Management
Accounting Issues
Project Management Training Group Illinois State University
Richard Boser

Project Management Training Group -- Illinois State University
100
Depreciation
Large assets (such as equipment, buildings) have a loss of value over their useful life. Funds must be set aside to replace obsolete and worn out equipment.
Types: Straight-Line Depreciation
Accelerated Depreciation
Double Declining Balance
Sum of the Year Digits
Ask your account for appropriate recovery costs as overhead charges.

Straight-Line Example
A $5,000 computer with a $200 salvage value and an estimated useful life of three years would be depreciated by $1,600 annually.
$5,000 - $200 = $4,800/3 = $1,600
Project Management Training Group -- Illinois State University
101

Sum of the Years Digits
Take expected life of an asset (in years) count back to one and add the figures together.
Example: 10 years useful life = 10 + 9 + 8 + 7 + 6 +5 + 4 + 3 + 2 + 1 - Sum of years = 55
First year asset depreciated 10/55 in value [the fraction 10/55 is equal to 18.18%], second year 9/55 [16.36%], etc.
Project Management Training Group -- Illinois State University
102

Opportunity Cost
The opportunity given up by selecting one project over another. No calculations required. Example: Project D has an NPV of $100,000 and Project H has an NPV of $180,000. What is the opportunity cost of selecting Project H?
Answer: $100,000 – you gave up Project D
Project Management Training Group -- Illinois State University
103

Sunk Cost
Expended costs.
According to accounting standards, sunk costs most considered when decided to continue with a troubled project.
Would you throw good money after bad?
Project Management Training Group -- Illinois State University
104

Project Management Training Group -- Illinois State University
105
Methods of Project Selection
Payback Period
Present Value
Net Present Value
Internal Rate of Return
Benefit Cost Ratio

Project Management Training Group -- Illinois State University
106
Pay-Back Period
Period over which the total cash flow receipts from a project equal the original investment, without discounting.
Project cost $10,000 and is expected to save company $5,000/yr. Payback = ____?
Your firm has 2 project alternatives to choose from. Which is most favorable? Project A has payback = 10 months
Project B has payback = 18 months
Answer: Project A – Investment recovered faster

Project Management Training Group -- Illinois State University
107
Present Value (Not for Cash Flows)
PV = FV/(1+r)n
FV = future value
r = interest rate
n = # of time periods
Present value of $700,000 received 4-years from now if expect interest rate is 6% is:
ANSWER = $700,000/(1 +.06)^4
= $700,000/ 1.262477
= $554,465.50

Project Management Training Group -- Illinois State University
108
Net Present Value (NPV)Discounted Cash Flows
You have two projects to choose from. Project A will take 3 years to complete and has a NPV of US $ 1,200,000. Project B will take 4 years to complete and has a NPV of US $ 1,500.000. Which Project would you prefer? Answer: Project B – the number of years
was already taken into account when calculating the NPV

Project Management Training Group -- Illinois State University
109
Internal Rate of Return (IRR)
Interest rate at which inflows = outflows
Return earned on the capital invested in the project
Discount rate which gives an NPV of zero.
Equivalent to the yield on the investment.
You have two Projects to choose from. Project A with an IRR of 23% or Project B with an IRR of 45%. Which one would you prefer?
Answer: Project B (Bigger is better!)

Project Management Training Group -- Illinois State University
110
Benefit Cost Ratio (BCR)
If BCR > 1 then benefits greater then cost
If BCR < 1 then benefits are less then cost
A BCR of 1.5 means that
A. Costs are greater than benefits
B. Payback is 1.5 times cost
C. Profit is 1.5 times cost
D. Costs are 1.5 times profit
Answer: B - BCR focuses on revenue

Project Management Training Group -- Illinois State University
111
Review Questions
1. What financial tools can be used to aid in project selection?
2. What do you need to know about depreciation?
3. Project cost $10,000 and is expected to save company $10,000/yr. Payback = ____?
4. How do sunk costs differ from opportunity costs?

Project Cost Management
The End!
Project Management Training Group
Illinois State University
Richard Boser