Project Background - Colorado State University
61
i Project Background This document is one of four separate reports created under a grant from the Walton Family Foundation to investigate ways to minimize harm to agriculture as water scarcity in the Colorado River Basin forces growing municipal and environmental water users to look at existing uses as potential sources of supply. Agriculture, the largest water user in the basin, is a frequent target in these efforts. The project, “Agricultural Water Conservation in the Colorado River Basin: Alternatives to Permanent Fallowing Research Synthesis and Outreach Workshops” was undertaken to create detailed reports of the four common methods used to temporarily transfer water from agriculture to other purposes. The four reports consider the following methods: • Deficit Irrigation of Alfalfa and other Forages • Rotational Fallowing • Crop Switching • Irrigation Efficiency and Water Conservation After the reports were drafted, three workshops were held, one in the Upper Basin in Grand Junction on November 4, 2016, one in the Lower Basin in Tucson on March 29, 2017, and one in Washington, DC on May 16, 2017. All of the reports are available from the Colorado Water Institute website. Acknowledgements First, Greg Peterson and I thank the Walton Family Foundation for making this project possible. Without their funding and support, the project would not have happened. Many people assisted with this project by reading and providing comments on drafts. We want to especially thank Perri Benemelis, Mike Bernardo, Perry Cabot, Aaron Citron, Michael Cohen, Bonnie Colby, Terry Fulp, Robert Glennon, Bill Hasencamp, Chuck Howe, Carly Jerla, Dave Kanzer, Doug Kenney, Kelsea MacIlroy, Jan Matusak, Sharon Megdal, Peter Nichols, Wade Noble, Michael Ottman, Ron Raynor, Adam Schempp, Tina Shields, MaryLou Smith, Pete Taylor, Reagan Waskom, John Wiener, and Scott Wilbor. Paul Kehmeier contributed a lovely photograph and important story. The work product was much improved by these insightful comments. It must be noted that any mistakes are solely mine. Nancy Grice at the Colorado Water Institute provided critical support with financial reporting, travel assistance and working with Colorado State University. MaryLou Smith was instrumental in organizing and chairing the outreach workshops. Reagan Waskom provided much needed intellectual support throughout the project. Beth Lipscomb assisted with overall editing at the end. Finally, a very special thanks goes to my co-author, Greg Peterson, who did much of the early, difficult research and writing. Much of the value of this project is in the extensive bibliographies that Greg created by painstakingly acquiring, reading and summarizing hundreds of documents. We thank Senator Michael Bennet and his staff for acquiring a room at the Capitol Visitor Center for the DC event. Finally, we extend our sincere appreciation to the approximately 100 participants who shared their precious time to join us for our outreach workshops. Thank you, all. Brad Udall
Transcript of Project Background - Colorado State University

i
Project Background
This document is one of four separate reports created under a grant from the Walton Family Foundation to investigate ways to minimize harm to agriculture as water scarcity in the Colorado River Basin forces growing municipal and environmental water users to look at existing uses as potential sources of supply. Agriculture, the largest water user in the basin, is a frequent target in these efforts. The project, “Agricultural Water Conservation in the Colorado River Basin: Alternatives to Permanent Fallowing Research Synthesis and Outreach Workshops” was undertaken to create detailed reports of the four common methods used to temporarily transfer water from agriculture to other purposes. The four reports consider the following methods:
• Deficit Irrigation of Alfalfa and other Forages • Rotational Fallowing • Crop Switching • Irrigation Efficiency and Water Conservation
After the reports were drafted, three workshops were held, one in the Upper Basin in Grand Junction on November 4, 2016, one in the Lower Basin in Tucson on March 29, 2017, and one in Washington, DC on May 16, 2017. All of the reports are available from the Colorado Water Institute website.
Acknowledgements
First, Greg Peterson and I thank the Walton Family Foundation for making this project possible. Without their funding and support, the project would not have happened.
Many people assisted with this project by reading and providing comments on drafts. We want to especially thank Perri Benemelis, Mike Bernardo, Perry Cabot, Aaron Citron, Michael Cohen, Bonnie Colby, Terry Fulp, Robert Glennon, Bill Hasencamp, Chuck Howe, Carly Jerla, Dave Kanzer, Doug Kenney, Kelsea MacIlroy, Jan Matusak, Sharon Megdal, Peter Nichols, Wade Noble, Michael Ottman, Ron Raynor, Adam Schempp, Tina Shields, MaryLou Smith, Pete Taylor, Reagan Waskom, John Wiener, and Scott Wilbor. Paul Kehmeier contributed a lovely photograph and important story. The work product was much improved by these insightful comments. It must be noted that any mistakes are solely mine.
Nancy Grice at the Colorado Water Institute provided critical support with financial reporting, travel assistance and working with Colorado State University. MaryLou Smith was instrumental in organizing and chairing the outreach workshops. Reagan Waskom provided much needed intellectual support throughout the project. Beth Lipscomb assisted with overall editing at the end. Finally, a very special thanks goes to my co-author, Greg Peterson, who did much of the early, difficult research and writing. Much of the value of this project is in the extensive bibliographies that Greg created by painstakingly acquiring, reading and summarizing hundreds of documents.
We thank Senator Michael Bennet and his staff for acquiring a room at the Capitol Visitor Center for the DC event. Finally, we extend our sincere appreciation to the approximately 100 participants who shared their precious time to join us for our outreach workshops. Thank you, all.
Brad Udall

ii
Table of Contents 1 Summary 1 1.1 Key Definitions 1 1.2 Understanding Irrigation Efficiency 1 1.3 Critical Nature of Return Flows 2 1.4 On-Farm vs. District-Wide Efforts to Improve Efficiency 2 1.5 Co-Benefits of Increasing Irrigation Efficiency 3 1.6 Increased Consumptive Use from Improved Irrigation Efficiency 3 1.7 Water Conservation Opportunities 3 1.8 Case Studies 4 2 Introduction 4 3 Water Balances, Return Flows, On-Farm vs. Basin Efficiency 6 4 Irrigation Efficiency and Water Conservation Terminology 8 5 Irrigation Efficiency Improvements: Good or Bad? 11 6 Irrigation Efficiency Improvement Measures 12 6.1 On-Farm Efficiency Improvement Measures 12 6.1.1 Increase the Delivery Efficiency from Headgate to Field 12 6.1.2 Increase the Field Application Efficiency 13 6.1.3 Irrigation Scheduling 13 6.2 District-Wide Efficiency Measures 13 7 Co-Benefits of Increased Irrigation Efficiency 14 8 Improved Efficiency Can Increase Consumption 15 9 Uniform Water Application, Removal of Labor, and Timing Constraints 15 9.1 Water Spreading, Shifting Crops, Area Increases, Evaporation Decreases 17 9.2 Modeling and Case Studies on Increased Consumptive Use 18 10 Water Conservation Measures 18 10.1 Reducing Non-Beneficial Evaporation 19 10.2 Reducing Crop and Non-Crop Transpiration 19 10.3 Reducing Runoff into Saline Water 20 10.4 More Effective Rainfall Utilization 21 11 Non-Colorado River Cases 21 11.1 California 21 11.2 High Plains Aquifer 21 11.3 Salt River, Wyoming 22 11.4 Yellowstone River, Wyoming, and Montana 22 11.5 Snake River Plain, Idaho 23 11.6 Rio Grande 23 12 Colorado River Basin-Wide Cases 24 12.1 Colorado River Basin Salinity Control Project 24 13 Colorado Cases 25 13.1 Grand Valley Water Users Project 25 13.2 Orchard mesa Irrigation District Canal System Improvement Project 27 13.3 No Chico Brush 28 14 New Mexico Cases 28 14.1 Drip Irrigation Investigation in New Mexico 28
iii
15 Utah Cases 29 15.1 Ferron Salinity Control Project 29 16 Arizona Cases 29 16.1 Diamond Ditch Improvement Project 29 16.2 The 1980 Groundwater Management Act 30 16.2.1 Original Irrigation Efficiency Goals 30 16.2.2 2002 Best Management Practices Amendments 31 16.2.3 Analysis 32 16.3 Wellton-Mohawk Irrigation and Drainage District 33 17 California Cases 34 17.1 1988 Imperial Irrigation District—MWD Municipal Transfer 35 17.2 1998 Imperial Irrigation District—SDCWA Transfer 36 17.3 All-American Canal Lining Project 37 17.4 Coachella Valley Canal Lining 38 17.5 Brock Reservoir 38 17.6 Salton Sea Efficiency and Transfer Impacts 39 17.7 Coachella Valley Water District Efficiency Improvements 40 18 Appendix: Selected Literature 42 19 Bibliography 45

iv
List of Figures Figure 1 Water balance showing inflows, outflows, and change in storage 7 Figure 2 Interaction of uniformity and efficiency in irrigation 16 Figure 3 Crop production functions of two irrigation systems 17

v
List of Tables Table 1 Arizona Best Management Practices (BMP) 32
vi
Abbreviations ADWR Arizona Department of Water Resources af Acre-feet BMP Arizona Best Management Practices CAWA Colorado Agricultural Water Alliance CRBSCP Colorado River Basin Salinity Control Program CVWD Coachella Valley Water District CWCB Colorado Water Conservation Board EPA Environmental Protection Administration ET Evapotranspiration GMA Arizona Groundwater Management Act GVWUA Grand Valley Water Users Association IGFR Irrigation Grandfathered Rights IID Imperial Irrigation District kaf Thousand Acre-feet maf Million Acre-feet MOD Main Outlet Drain MODE Main Outlet Drain Extension MWD Metropolitan Water District of Southern California NDVI Normalized Difference Vegetation Index NEPA National Environmental Policy Act NRCS Natural Resources Conservation Service OMID Orchard Mesa Irrigation District PAM Polyacrylamide PVID Palo Verde Irrigation District QSA Quantification Settlement Agreement RICD Recreational In-channel Diversion SCADA Supervisory Control and Data Acquisition SDCWA San Diego County Water Authority SWP State Water Project SWRCB State Water Resources Control Board TNC The Nature Conservancy USBR U.S. Bureau of Reclamation USDA U.S. Department of Agriculture WMIDD Wellton-Mohawk Irrigation and Drainage District

1
1 Summary
Two related ideas, irrigation efficiency and water conservation, can be used to obtain water from agriculture for other purposes. These concepts are related, because improving irrigation efficiency and improving water conservation can both lead to reductions in water use. The two terms as defined herein, however, deal with distinctly different kinds of reductions in water use. Each concept has different physical and legal ramifications, especially in terms of how they affect other uses and users. Both concepts can potentially provide water for municipal or environmental purposes from agriculture.
1.1 Key Definitions
Consumptive use is defined as liquid water that has been converted to water vapor, by either evaporation or plant transpiration. It is therefore no longer available for use. In some limited cases, water can also be considered “consumed” if liquid fresh water flows to a salty water body. This also makes it unavailable for crop and most human uses. It is still available for environmental purposes, however. Water that is diverted but not consumptively used becomes return flows, liquid water that returns either immediately to the stream as surface runoff, or as delayed groundwater. Return flows are heavily relied upon by downstream diverters in the West. In many basins in the West, the total diversions vastly exceed the total flows in the river, which provides strong evidence for how important return flows are.
Improving irrigation efficiency refers to the act of saving non-consumptive-use water, sometimes called “saved water.” This might typically occur by reducing ditch conveyance losses, which would allow for smaller headgate diversions for the same volume of water reaching the field at the end of the ditch.
Water conservation, by contrast, is the act of saving consumptive-use water. Water conservation is further broken into two types. Savings from reducing non-productive consumptive use such as occurs by phreatophytes is called ‘salvage water’ under Colorado law. It might have different names in other states. This water in most states is not legally transferrable and thus there is little incentive to reduce this use. In addition, the generation of salvage water can impact amenity values including mature trees on ditches. By contrast, conserved consumptive use water comes from reductions from crop consumptive use or ancillary consumptive use necessary to get water to crops such as evaporation from canals. This water is generally legally transferrable.
In general, greater quantities of saved water can be created than water saved from reducing consumptive use, in large part because in flood irrigation, the most common form, 50% of the diverted water is not consumed and becomes return flows. A farmer can generate significant saved water without affecting consumptive use, a key driver of crop yields. On the other hand, reducing conserved consumptive use leads to crop yield reductions and therefore has economic impacts. Reducing consumptive use affects fewer water users because this water was already used, and not available for reallocation via return flows.
1.2 Understanding Irrigation Efficiency
The term “irrigation efficiency” is most commonly defined as a percentage:
𝐼𝐼𝐼𝐼𝐼𝐼𝐼𝐼𝐼𝐼𝐼𝐼𝐼𝐼𝐼𝐼𝐼𝐼𝐼𝐼 𝐸𝐸𝐸𝐸𝐸𝐸𝐼𝐼𝐸𝐸𝐼𝐼𝐸𝐸𝐼𝐼𝐸𝐸𝐸𝐸 = 𝐶𝐶𝐼𝐼𝐼𝐼𝐶𝐶 𝐶𝐶𝐼𝐼𝐼𝐼𝐶𝐶𝐶𝐶𝐶𝐶𝐶𝐶𝐼𝐼𝐼𝐼𝐶𝐶𝐸𝐸 𝑈𝑈𝐶𝐶𝐸𝐸𝑇𝑇𝐼𝐼𝐼𝐼𝐼𝐼𝑇𝑇 𝑆𝑆𝐼𝐼𝐼𝐼𝐸𝐸𝐼𝐼𝐶𝐶 𝐷𝐷𝐼𝐼𝐶𝐶𝐸𝐸𝐼𝐼𝐶𝐶𝐼𝐼𝐼𝐼𝐼𝐼𝐶𝐶

2
This definition leads to misunderstandings because in most engineering fields, efficiencies of less than 100% imply a loss or waste, such as wasted heat in energy applications. In water, however, the loss or “waste” is still liquid water that will ultimately be recycled as a return flow at some point in space and time. Return flows are highly valuable, and should not be considered “waste.”
1.3 Critical Nature of Return Flows
Return flows provide water supplies for many downstream users and thus are important in many river basins in the West. Farms using flood irrigation are often only 50% efficient, meaning that 50% of their diversions return to the river for recycling. Because of recycling, “stacked” farms that rely on irrigation return flows can obtain high collective efficiencies, a feature sometimes known as the “basin approach.” Sprinklers and drip can reach 80 to 90% efficiency with commensurate reductions in return flows.
A water mass balance, which is merely the application of the law of conservation of mass1 to a suitably large geography and time period to account for all the consumed and non-consumed flows of water (both liquid and vapor), can help to understand how water is being used. Mass balances can indicate the importance of return flows, among other purposes.
There is a vigorous debate over whether return flows are good or bad — and implicitly, whether efficiency improvements (which almost always change return flows) are good or bad. The answer depends on the soil, runoff contaminants, if any, water temperatures, changes to the natural hydrograph, local geography, the location, and priorities of other diverters, and even the values of the observer. When return flows change, there are often winners and losers, including nature, which also influences the answers to this question.
1.4 On-Farm vs. District-Wide Efforts to Improve Efficiency
Irrigation efficiency improvements can be broken into on-farm and district-wide efforts. On-farm efforts include increasing the delivery efficiency from headgate to the field by lining or piping canals and increasing the field application efficiency, defined as the amount of water consumed by crops divided by the total amount applied to the field. Field application efficiencies can be increased by laser leveling, tailwater recovery (capturing water at the end of the field and reusing it), installing sprinklers or drip, and other methods. Irrigation scheduling can increase efficiency by only applying water when it is needed, which can reduce unnecessary soil evaporation.
District-wide efficiency measures include similar actions to on-farm measures but done on a larger scale, such as canal lining. With large systems involving tens of miles of canals and many hours of water travel times, keeping canals full, especially near the end of the canal after many laterals have withdrawn water has historically been challenging. Operators would often rather spill water from the tail end of the canal than run short, which has meant that the river segment between the headgate and the tail end of the canal has had less water than it might. Computerized canal check structures – small movable, vertical dam-like structures within a canal can keep canals full when they have less water, while reducing spills at the end of the canal. Small operational reservoirs, often near the end of a lengthy canal, can capture and allow reuse in the difficult-to-serve lower canal reaches.
1 The law of conservation of mass says that matter can neither be created nor destroyed. It is a fundamental tool used in almost all engineering and physics studies.

3
1.5 Co-Benefits of Increasing Irrigation Efficiency
Co-benefits of irrigation efficiency improvements that reduce diversions are important. These benefits include increased water quality due to reductions in saline or chemical-laden farm runoff, less groundwater pumping in groundwater dependent systems, and higher reliability of diversions due to the need for less carriage water. Increased efficiencies can increase productivity, yields, and economic gain. In the 21st century these improvements can be as important as considerations of total water quantity, which has heretofore dominated water supply conversations.
Many irrigation systems are decades old, and in need of infrastructure maintenance and improvements. Efficiency improvements generally provide modern automated management, which reduces labor and increases flexibility. This is another co-benefit.
1.6 Increased Consumptive Use from Improved Irrigation Efficiency
Improving irrigation efficiency often has the paradoxical effect of increasing consumptive use. This has been known for many years and proven in many field-level and modeling studies, yet it is frequently misunderstood by the public. Technologies that improve field application efficiency apply water more uniformly in space, and often remove a time and labor constraint associated with flood irrigation. By flipping a switch, crops on sprinklers or drip can receive water whenever needed, not just on a set schedule dictated by canal capacity and/or labor. Many farm operations are constrained by delivery capacities (i.e., are “water-short”); improvements allow more diverted water to be applied to the crop rather than lost as a return flow. In these water short systems, yields and consumptive use can go up because more of the diverted water makes it to the crops that were previously unintentionally deficit irrigated. Increased consumptive use thus means fewer return flows for use by downstream diverters.
Improved irrigation efficiency is often portrayed as leaving more water in the stream, downstream of the headgate of the improver. While this is one outcome, others are possible. The efficiency improvement can lead to the same diversions, more consumptive use, and less return flow as described above. Under another scenario, if the saved water is not diverted, under prior appropriation the next-in-line diverter may be upstream, not downstream. In this case, there will be a reduction in flow from the next-in-line diverter’s headgate down to the headgate of the diverter installing the efficiency improvement. This is a paradoxical outcome that is rarely mentioned, and one that is not often envisioned by the promoters of irrigation efficiency.
1.7 Water Conservation Opportunities
Water conservation measures include reducing non-beneficial consumptive use, reducing crop and non-crop transpiration, reducing runoff into saline water bodies, and utilizing rainfall more effectively. Several studies suggest that savings from reducing non-beneficial evaporation from soil can be from 20 to 40%. Reducing other forms of non-beneficial evaporation such as phreatophyte removal may harm amenity values associated with trees and other vegetation. Reducing crop transpiration will reduce yields. Reducing weeds can provide additional water.
Reducing runoff to saline water bodies is a different kind of consumptive use reduction. Most consumptive use occurs when liquid water is evaporated or transpired to water vapor. This method, however, involves stopping fresh liquid water from being converted to unusable saline water. In arid areas throughout the world, saline water bodies can support important biological activities and thus this

4
kind of consumptive use reduction impairs the environmental values of the saline body. Mono Lake, Owens Lake, and the Salton Sea are three examples in the Western United States and there are many elsewhere around the world. There is little opportunity for more effective rainfall utilization in the West as rainfall provides only a small portion of crop water needs in many of the most important irrigation areas.
Some projects that have focused on salinity control such as canal lining efforts are also irrigation efficiency projects. While these improvements can lead to higher consumptive use, they also improve the quality of agricultural runoff and hence enhance stream water quality for downstream users.
If changes in return flows are a concern, one solution is to make efficiency improvements at the end of a river first, and then work up-river. This approach minimizes return flow impacts to downstream diverters, while potentially improving instream flows and water quality downstream of the improvements, provided that saved flows can be “shepherded” downstream rather than being taken by upstream next-in-line diverters.
1.8 Case Studies
There are many cases of irrigation efficiency improvement projects in the West. The Metropolitan Water District of Southern California has an on-going program at the Imperial Irrigation District to save approximately 100,000 acre-feet of water every year. The Yuma area in Arizona has used about 250,000 less acre-feet per year, in part due to different crops and in part due to sprinklers, high flow turnouts, laser leveling and other efficiency methods. In Colorado, one large irrigation district near Grand Junction saved nearly 40,000 acre-feet per year in some years by lining canals, automating gates, installing check structures, and using a reservoir near the end of a long canal with no loss of agricultural output.
2 Introduction
This chapter describes two related concepts, irrigation efficiency and water conservation. These concepts are related because improving irrigation efficiency and improving water conservation both lead to reductions in water use. The two terms as defined herein, however, deal with distinctly different kinds of reductions in water use. Each concept has different physical and legal ramifications, especially how they affect other uses and users. Both concepts can potentially provide water for municipal or environmental purposes from agriculture.
For the purposes of this chapter, improving irrigation efficiency refers to the act of saving non-consumptive use water, sometimes called “saved water.” Conversely, water conservation is the act of saving consumptive use water. Consumptive use is defined as liquid water that has been converted to water vapor by evaporation or plant transpiration and hence is no longer available for use. In some limited cases water can also be “consumed” if liquid water flows to a salty water body which also makes it unavailable for crop use. In general, greater quantities of “saved water” can be created than water saved from reducing consumptive use.

5
The term irrigation efficiency itself is most commonly defined as a percentage with total crop water use in the numerator2, and total stream diversions in the denominator:
𝐼𝐼𝐼𝐼𝐼𝐼𝐼𝐼𝐼𝐼𝐼𝐼𝐼𝐼𝐼𝐼𝐼𝐼𝐼𝐼𝐼𝐼 𝐸𝐸𝐸𝐸𝐸𝐸𝐼𝐼𝐸𝐸𝐼𝐼𝐸𝐸𝐼𝐼𝐸𝐸𝐸𝐸 = 𝐶𝐶𝐶𝐶𝐶𝐶𝐶𝐶 𝐶𝐶𝐶𝐶𝐶𝐶𝐶𝐶𝐶𝐶𝐶𝐶𝐶𝐶𝐶𝐶𝐶𝐶𝐶𝐶𝐶𝐶 𝑈𝑈𝐶𝐶𝐶𝐶𝑇𝑇𝐶𝐶𝐶𝐶𝑇𝑇𝑇𝑇 𝐷𝐷𝐶𝐶𝐶𝐶𝐶𝐶𝐶𝐶𝐶𝐶𝐶𝐶𝐶𝐶𝐶𝐶𝐶𝐶
Irrigation efficiency is thus a typical engineering efficiency where an output (crop water use) is divided by an input (total water diversions). In most engineering fields, a higher efficiency is considered uniformly good. In water use, however, higher irrigation efficiencies can have both beneficial and non-beneficial outcomes. This is because diverted but not consumed water is still available for use and is often recycled, unlike other engineering disciplines such as energy where inefficiency generally results in an unusable waste output (e.g., heat). These recycled flows are commonly known as return flows. In this chapter, we are specifically interested in cases where irrigation efficiency increases because the total diversions (the denominator) are decreased. This will result in the creation of “saved water” because less water is diverted from the stream.
When irrigation efficiencies improve through either decreases in total diversions or increases in crop consumptive use, the water recycling that formerly occurred will shift to different places and times, often benefiting one user at the expense of another. In the legal sphere, saved water is generally not legally transferable, although a water user would be free to use the savings so long as acreage is not increased or the historical uses are not changed. For example, the installation of sprinklers is a common irrigation efficiency improvement that could result in reduced stream diversions. A water user is free to use this saved water on his existing acreage and current uses, but not to transfer it to another use or user.
In this chapter, water conservation is defined as reducing consumptive use. These water savings might come from reductions not directly related to the original purpose of the diversion (soil evaporation, phreatophyte reduction, lake or canal evaporation), or by reducing the consumption of the desired output (e.g., less crop yield or a change in crop). These two different types of consumptive use savings have two different names: “salvage water” is the Colorado term for the savings from non-productive consumptive use of water which is not transferable, and “conserved consumptive use water” for the savings which is transferable in some states. Water conservation, like irrigation efficiency, can have many effects that ripple to other water users and the public. The creation of salvage water, for example, can harm wetlands or trees along canals.
It should be noted that these two concepts as presented herein are not always separate and distinct. Reducing runoff to a saline water body is considered a water conservation measure because it provides additional consumable water. It can also be an irrigation efficiency measure when this runoff does not need to be diverted in the first case (see Salton Sea, below). Irrigation scheduling is an efficiency measure because it can reduce the overall water delivered to the plant by delivering water timely. It is also a water conservation measure because it can reduce soil evaporation, a consumptive use. Nevertheless, the key distinction between these two concepts — saving consumptive vs. non-consumptive water — is critically important.
2 This includes any legally allowable water use in delivering the water the crop such as canal evaporation necessary for the water delivery and soil evaporation that results from the application of water in the field.

6
Given the importance of water and its increasing scarcity, there are numerous papers on these topics, many in the last twenty years. This chapter surveys and synthesizes this literature. Some of the literature is contentious, including the idea of whether on-farm irrigation efficiency improvements are good or bad (See: Irrigation Efficiency Improvements: Good or Bad?). This literature almost always discusses how improving the efficiency of water delivery systems has many ripple effects for downstream water users in the location, quantity, quality, and timing of return flows. Some writers have called for new terminology to replace the term irrigation efficiency because they view it as a loaded term with its implicit and often wrong sense of “waste” or “loss.” They argue that many areas with low on-farm efficiencies can have high basin-wide efficiency due to the reuse of return flows. Others have argued that the terminology and concept is still important including its good connotation of doing more with less on an individual farm. These writers point out that the concept of irrigation efficiency forces us to understand how individual water use affects water quantity and quality within the basin. In their view, it is not enough just to consider the system as a whole.
This chapter proceeds as follows. It first discusses basic hydrology issues including return flows. It then discusses general concepts and methods to improve irrigation efficiency. The co-benefits of improved irrigation efficiency are presented. It explains how and why irrigation efficiency measures can paradoxically lead to increased consumptive use. Water conservation measures are discussed next. The chapter then provides several case studies on these concepts, both outside and inside the Colorado River Basin. Two sections present important topics, one on whether efficiency improvements are good or bad, and another on basic terminology. An appendix highlights key papers on these topics.
3 Water Balances, Return Flows, On-Farm vs. Basin Efficiency
The popular perception is that irrigation water use is wasteful; many recoverable losses exist, and if we could only capture these losses, we would have plenty of water for other purposes (Getches, 1987; Postel, 2013a). Unfortunately, this view is simplistic; there are far fewer recoverable losses than supposed. The only true losses in water use are evapotranspiration by crops, weeds, and soil, and the relatively rare flows of liquid water into an unusable saline sink3. Everything else is not a loss or waste, but a reusable return flow, albeit usable at some time and place distant from the original use.
The proper tool to help us account for and understand water use is a water balance based on the law of conservation of mass (See Terminology Section). The law of conservation of mass tells us that mass is neither created nor destroyed, and thus provides a theoretical way to account for all movement of water, be it liquid or vapor. The water balance must encompass enough time and space to account for all water flows. It is a powerful conceptual tool because it serves to remind us that even invisible mass must be accounted for, even if it is sometimes difficult to implement because we cannot see flows of aboveground water vapor and underground liquid water. In many cases, though, we have reasonably accurate ways to estimate hidden evapotranspiration and subsurface flows, thus reducing the water balance uncertainties.
3 A saline sink can be groundwater that is too salty to use, an aboveground salty lake, or the ocean. Note that a loss to the ocean is not generally “waste” – it serves important biological and geological functions. This is similarly true with saline above groundwater bodies. The Salton Sea and many other saline lakes, for example, are important resources for many bird species.

7
Figure 1: Water balance showing inflows, outflows, and change in storage. Source: Clemmens et al. (2008).
Return flows are a critical part of the water balance and are highly prevalent in river systems in the American West. Their presence was acknowledged as early as 1896 in the South Platte (Carpenter, 1896) and investigations in the 1920s further quantified their importance (Parshall, 1922). Additional work in the 1960s by engineers and attorneys acknowledged the interconnectedness of individual farms and water users downstream, through surface and sub-surface return flows (Bagley, 1965; Hartman & Seastone, 1970, 1965; Jensen, 1967; Wright, 1964). In 1978, the newly created EPA investigated the importance of return flows (Radosevich, 1978).
In many engineering studies, return flows are assumed to make up 50% of all water diverted for irrigation. In some porous areas, like the Snake River Basin in Idaho, the number can exceed 60% (Huffaker, 2008). In a water balance of the Lower Colorado River Basin, return flows from various districts make up a significant part of the river flow (Owen-Joyce & Raymond, 1996). In the Upper Green River near Pinedale, Wyoming, a study put return flow portion at 70%, with 90% of the flows returning during the irrigation season and the remainder during the winter (Blevins, 2015; Wetstein, Hasfurther, & Kerr, 1989).
Return flows have a number of benefits: recharge to unconfined aquifers; dampening of flood flows or redistribution of flows over time; cooling of stream flows during droughts to benefit plants and wildlife; reduction of salt-water intrusion; and the creation of wetlands (Allen, Clemmens, & Willardson, 2005; CAWA, 2008; Interagency Task Force, 1979; C. J. Perry, 1999; Willardson, Allen, & Frederiksen, 1994).
Return flows also have several negatives. In general, return flows are lower quality than water left in the stream because they pick up salt, nutrients, pesticides, and sediment. Return flows can increase stream water temperatures by reducing the volume of water below the point of diversion, and, at least for surface returns, and by providing warmer water back into the stream. Return flows also distort the natural hydrograph, and can eliminate the hydrologic cues some species use to trigger reproduction or migration or other behaviors.

8
There can be significant differences between measured on-farm and basin-wide irrigation efficiencies because of return flow recycling. Even when relying on flood irrigation, basin-wide efficiency can be relatively high compared to on-farm efficiency due to reuse of surface and subsurface runoff (C. Burt, Canessa, Schwankl, & Zoldoske, 2008; C. M. Burt, 1999a). A thorough water balance can reveal that the potential water savings is often less than projected. In California, for example, one paper indicates that the potential of “new” water from agricultural water use efficiency is only 1.3 percent of the current amount used by the state’s farms, much less than what is possible on a single farm (CIT, 2011). The concept of considering water efficiency on a basin-wide basis rather than a single farm basis is known as the “Basin Perspective” or “Basin Approach.”
Two cases illustrate how on-farm and basin efficiencies can be very different. Allen and Brockway (1983) document an irrigation district in Idaho where on-farm irrigation efficiency is relatively low, but the overall district irrigation is high. On the Little Willow Irrigation District, on-farm efficiency was only 30 percent, but the total district efficiency was 60 percent. The district is in a long, narrow mountain valley that allows rapid reentry and reuse of return flows.
The Westland Water District in California is a similar case but has completely different characteristics. The district has a piped distribution system, so seepage and deep percolation from the conveyance system are not important factors for the water balance. All surface water runoff is captured and reused. High water tables also supply a large portion of the crop ET on downslope fields. In this system, there is thus no loss of water through conveyance systems or runoff across the boundaries of the district. Deep percolation contributes to on-farm “inefficiencies” but the ET supplied by the high water table makes the overall district far more efficient than individual farms (C. M. Burt, 1999a).
4 Irrigation Efficiency and Water Conservation Terminology
The terminology around efficiency and water conservation is often confusing. This section describes terminology used in this paper.
Irrigation Efficiency: This term usually is defined as the amount of water consumed by crops divided by the amount of water diverted from a stream (Jensen, 2007). In general, this would include consumptive use that is necessary for the crops to transpire, such as evaporation from canals. This is the traditional engineering view of efficiency where an output is divided by an input, and the result is expressed as a percent. In many engineering disciplines, the difference between 100% and the measured efficiency is considered “waste” or” loss” such as heat energy that is no longer useful. In water systems, the “waste” term is mostly liquid water that becomes a reusable return flow.
Delivery Efficiency: This is the efficiency of the carriage system used to transport diversions from the river to the location of the water application to the field. Canals are subject to evaporation, seepage, and transpiration of plants along the canal.
Field Efficiency: This is the amount of water used by the crops divided by the amount of water applied, generally shown as a percentage. Large amounts of on-field runoff (“tailwater”) reduce the field efficiency.

9
On-Farm Efficiency: This is the overall “irrigation efficiency” of an individual farm. With flood irrigation, this number is typically 50% or less, although there are highly efficient laser-leveled flood irrigation techniques. It is the product of the delivery efficiency times the field efficiency.
Basin-Approach: This is the overall “irrigation efficiency” of a number of stacked farms in a basin or a district that recycles diversions4. In general, because return flows are recycled the basin efficiency is much higher than individual farm efficiency.
Fractions: The fractions approach to water accounting was first put forth in the early 1990s as a way of removing the connotation that efficiency measures are always good and that inefficiencies result in ‘waste’ (Willardson et al., 1994). The fractions approach parcels out the different components of water use in an irrigation system into three different categories, or fractions, of use. The fractions all sum to 1 thus implicitly applying the law of conservation of mass to water use. The three fractions are: (1) changes in storage, both positive or negative, (e.g., reservoirs, aquifers); (2) a consumed fraction consisting of beneficial consumptive use for an intended purpose (e.g., transpiration from a crop) and non-beneficial consumptive use for purposes other than the intended use (e.g., weeds, soil surface evaporation); (3) a non-consumed fraction consisting of a recoverable fraction (e.g., surface and subsurface return flows) and a non-recoverable fraction (flows to saline sinks, the ocean). “Losses” in this terminology are consumptive uses and non-consumed non-recoverable flows. Importantly, the terminology avoids using the term “inefficiencies” which is often but wrongly equated with “losses”. Among many water lawyers and engineers throughout the West, this terminology has been simplified to ‘consumptive’ and ‘non-consumptive’ use with the implicit understanding that these two components sum to 1.
Water Conservation: For the purposes of this paper, water conservation is defined as techniques that reduce consumptive use of water. These techniques include reducing evaporation from soil and canals, reducing crop and non-crop transpiration, and reducing runoff into saline water bodies. Water conservation potentially makes previously consumed water available for new uses, as opposed to irrigation efficiency improvements which frequently just moves return flows from one water user to another. Water conservation is sometimes said to create new supplies but it only does so by moving consumptive use from one water use to another; technically, water is never created.
Consumed Water: Also known as consumptive use, this is water that is either evaporated from soils or transpired from plants. In both cases, liquid water has been converted to water vapor and the vapor has moved to another part of the hydrologic cycle. This is often broken into two sub-components, beneficial and non-beneficial consumptive use. In water law “beneficial use” is a term of art meaning an allowed use. In non-legal terms, however, one person’s non-beneficial use, e.g., wetlands, might be another person’s “beneficial use.” Water can also be considered consumed if it flows to a saline sink.
4 Calculating the irrigation efficiency of a basin or district is perhaps best conceptualized as having a single large diversion canal serving multiple farms where the return flows are accessible for use within the district. The output (numerator) is the total crop consumptive use from all farms and the input (denominator) are the total diversions from the single canal. If the basin is actually lots of small stacked diversions, the total diversions (denominator) is conceptually the sum of the diversions that are not from return flows. This number is generally not knowable, hence the first conceptualization above as a single large diversion ditch with reusable return flows.

10
Non-Consumed Water: Also known as non-consumptive use, this water was diverted for use but not consumed and thus returned to the system as either a surface or subsurface return flow. This water is still in liquid form and is generally available for use, even if degraded in quality, by another downstream diverter. That use will be later in time, perhaps much later if a subsurface return flow. Collectively, consumed and non-consumed water comprise two fractions that must total to one. In the fractions terminology, non-consumed water can be recoverable as discussed above, or non-recoverable. Non-recoverable, non-consumed water typically flows to a saline sink of some sort. Non-recoverable water thus looks like consumed water in that it is no longer available for use.
Water Balance: A water balance is an accounting of water that uses the law of conservation of mass as its fundamental principle (C. M. Burt, 1999b). All mass must be accounted for as mass is neither created nor destroyed. A water balance defines a spatial and temporal extent and then includes all inflows, outflows, and changes in storage within the defined space and time. The financial analog to a water balance is an income statement showing income and expenses, and a balance sheet showing how these financial transactions impact bank account balances.
Salvaged Water: In Colorado, salvaged water is consumptive use water that was formerly used by phreatophytes or other non-productive consumptive use of water5 (CAWA, 2008). In a famous Colorado Supreme Court case, a salvager wanted a new water right free from call after eradicating water-stealing plants on his property (Castle & Caile, 2007). The requested water right would have been the same as a “developed” transbasin water right, which is also free from call by other diverters. The Court ruled that this “salvaged” water was part of the overall river system rather than belonging to the salvager. While salvaged water might be potentially beneficial, according to the court, to allow the salvager use of this water would be to encourage several destructive practices including destruction of riparian habitat, and planting and then later eradication of phreatophytes. The Court termed the phreatophytes “water thieves” and said the salvager had no right to step into the shoes of the thieves. The court encouraged the legislature to address this topic but to date no such legislation has been passed. Several unsuccessful attempts were made in the legislature to fix this problem in the 1980s and early 1990s. In 1992, the Colorado Water Conservation Board wrote an excellent memo on the issues (CWCB, 1992).
Saved Water: In Colorado, this term is often used to mean water that was once diverted from a stream but was not consumed and was hence a return flow (CAWA, 2008). An irrigation efficiency improvement usually creates saved water by reducing on-farm delivery or application losses. Saved water, for example, might arise from a more efficient canal system or from a more efficient field application method (e.g., sprinklers). Saved water can be consumed by the crops or left in the stream. Because the saved water was not consumed historically, it is not available for transfer by the saver. It is, however, available for use on the property where it is saved, as long as it does not go to new uses or new acreage. Saved water can potentially be used to supply water to crops that were previously under-irrigated thus ultimately increasing consumptive use. If saved water is left in the stream, the next-in-line diverter, whether upstream or downstream, will have rights to that water, as with other natural flows. (When
5 in Montana, “salvage” “means to make water available for beneficial use from an existing valid appropriation through application of water-saving methods.” (Mont. Code Ann. § 85-2-102(21))
11
saved water is described, it is often erroneously described as flowing downstream from the location of the savings).
Conserved Consumptive Use Water: In Colorado, this is water that was formerly associated with crop water consumption (CAWA, 2008). This water might be made available by reducing acreage, changing crops, or reducing a consumptive use that is allowable in the calculation of historical consumptive use such as evaporation from soil necessary for crop growth. This water is technically available for use or transfer by the saver. This term was popularized by the Colorado Agricultural Water Alliance in 2008, to distinguish between this kind of water and salvage water. The distinction is important because this water is potentially transferable while the latter is not.
5 Irrigation Efficiency Improvements: Good or Bad?
Increasing the efficiency of irrigation almost without fail affects reusable return flows, water quality, and instream flows. The local geography (e.g., mountains or deserts), the soils (alluvium or clay), the distance to the river (floodplain or uplands) and water rights geography (are controlling senior diverters and next-in-line diverters upstream or downstream?) may help provide answers to the question of whether improving irrigation efficiency is good or bad. Sometimes the answer to the question lies in the eye of the beholder. Here is a brief sampling of cases regarding how irrigation efficiency actions can affect other uses and users. Burt et al., ( 2008) and Gleick et al., (2011a) provide two contrasting views on this polarizing issue.
All-American Canal Lining. Reducing seepage out of the All-American Canal reduced losses by almost 70,000 acre-feet per year. This benefited the United States and specifically the San Diego County Water Authority but hurt Mexico which relied on the seepage for groundwater dependent farms in the Mexicali Valley. Lining the canal also eliminated the source water for the Andrade wetlands, desiccating an important habitat in the desert (Hinojosa-Huerta, Nagler, Carrillo-Guerrero, & Zamora-Hernández, 2002).
Colorado Hay Meadows. Colorado ranches sometimes divert in excess of 10 acre-feet per acre for their hay meadows but the hay crops typically only use one to two acre-feet of the diverted water. The remainder returns to the streams later in the year, perhaps at what would otherwise be low flow and possibly high temperature times. Peak runoff is, however, reduced by these diversions.
Grand Valley Water Users Association –Between 20,000 acre-feet and 40,000 acre-feet is now left in the main stem Colorado for the benefit of the endangered fish in the 15-mile reach due to modernization of the Highline Canal, the main canal of the Grand Valley Water Users Association (GVWUA). Consumptive use in the GVWUA is unchanged and end of canal spills are now negligible. The Orchard Mesa Irrigation District completed a similar effort in 2015. This is a case where there were few Colorado diverters below the infrastructure – the canal sits close to the state line – and in any case consumptive use did not go up.
IID Efficiency Transfers (Salton Sea) – Irrigation Efficiency improvements in the IID funded by Metropolitan Water District of Southern California and the San Diego County Water Authority have reduced return flows into the Salton Sea. These missing return flows now benefit MWD and SDCWA and provide IID with a more modern system. On the other hand, the state of California estimates that to

12
mitigate the economic and public health damages from the loss of return flows into the Salton Sea may cost $10B.
6 Irrigation Efficiency Improvement Measures
Using our definition of irrigation efficiency as the amount of water used by the crop divided by the total amount of water delivered, irrigation efficiency can be increased by decreasing total diversions (making the denominator smaller), by applying more of the delivered water to crops (increasing the numerator) or by a combination of the two. As efficiency increases, surface and lagged return flows will generally decrease — and in many cases, flows immediately downstream of the diversion will increase6. The timing and quality of water availability below the location of the efficiency improvements will thus change. Some consider these impacts to be negative (e.g., CAWA (2008)), especially if downstream diverters are reliant on the return flows generated by the inefficiencies. Efficiency improvements may or may not affect consumptive use (See Section 8 below, Improved Efficiency Can Increase Consumption) which in turn means that efficiency measures may increase, decrease or not change overall water availability in the stream.
There are both on-farm and basin-wide (or district-wide) efficiency measures and these are discussed below. Efficiency measures often go hand-in-hand with irrigation modernization and automation, and thus provide new operational flexibility at the farm and/or district level. A key farm input, labor, is often reduced with efficiency measures. Finally, other co-benefits are associated with efficiency improvements, and these are discussed in Section 7, Co-Benefits of Increased Irrigation Efficiency.
6.1 On-Farm Efficiency Improvement Measures
6.1.1 Increase the Delivery Efficiency from Headgate to Field
Earthen canals can leak substantial amounts of water, especially ones built from coarse soils. Canals can be lined with concrete or with exposed or unexposed membranes to reduce seepage losses. Polyacrylamide (PAM), can be applied to help seal earthen canals. Alternatively, formerly open canals can be piped, which reduces both seepage and evaporation. By cleverly using elevation, piping in some places in the West can also generate pressure for sprinklers or drip irrigation without the need for pumping. Canal lining is sometimes done primarily to reduce salinity and selenium, and in these cases efficiency improvements from seepage reductions are a co-benefit.
6.1.2 Increase the Field Application Efficiency
Farmers can use a variety of techniques to maximize the efficiency of water applied to crops once the water is at the field. The presence of tailwater – water that runs off the low end of the field – is, by definition, inefficient. In flood irrigation, farmers can laser level fields to get uniform application of water across the entire field. In the absence of leveled fields, water can pool in low spots, percolate
6 Note that under prior appropriation, the next-in-line diverter might be upstream. In this case, the not-diverted flow would be taken by the upstream diverter. Thus, paradoxically, there would be less flow in the river from the point of that diverter’s headgate downstream to the improver’s headgate. This is generally not the outcome expected from an efficiency improvement as they have been classically presented. The Orchard Mesa efficiency improvements, discussed below, may result in this unusual outcome in some limited cases, according to the Environmental Impact Statement.

13
beyond the root depth at the upper end of the field, and not have enough time to fully sink in at the low end of the field. This leads to non-uniform water application, a known limitation to maximizing crop yields. Surge irrigation in furrows to optimize percolation depths has been used successfully. High flow turnouts have been used to apply water to fields quickly and evenly in combination with “bola” wheels that create smooth furrows that allow for rapid water movement. (See Noble (2015) for a description and photo of these wheels).
Many forms of sprinklers can be used for uniform water application. Subsurface drip irrigation can avoid or reduce evaporation of water at the soil surface, which according to CAWA (2008) can be 20 to 30percent of the consumptive use. Examples of laser leveling and furrow improvements can be found in Yuma AZ (Noble, 2015) and the installation of sprinklers has been widespread in the West due to NRCS financial assistance. Tail water recovery is another method to increase efficiency and has been used in the Imperial Irrigation District (IID, 2000). In this case, water that runs off the field is recovered for use, either on a downstream field or pumped to an uphill location for reapplication to the original field. IID’s efficiency program for SDCWA features tailwater recovery among many methods (IID, 2015a).
6.1.3 Irrigation Scheduling
Buchleiter et al. (1996) presents the economic benefits of computerized irrigation scheduling which has increased yields by preventing yield reducing plant stress and limiting over-irrigation. They report an average water savings of 20 percent. Dockter (1996) describes the AgriMet system: a cooperative meteorological collection system for agricultural consumptive use modeling. It obtains crop consumptive use in regions near stations and then provides the data to farmers to help with irrigation scheduling. In the Umatilla Basin in Oregon, this system has been used over an area of 150,000 acres, achieving 15 percent in water savings. In Montana, one project has saved 16 inches of applied water where this is used. In Washington, some farmers have seen reductions of 50 percent in their water use. Irrigation scheduling can reduce non-beneficial evaporation from soil surfaces by wetting them less frequently. Colorado State University runs a number of weather stations in Colorado (“COAgMet”) that provide farmers with a real-time crop consumptive use calculations. In addition, the University provides a free irrigation scheduling application.
Irrigation scheduling is one of the rare methods that improves irrigation efficiency -- by reducing diversions – while also being a water conservation method. It is a water conservation method because it reduces soil evaporation, and thus reduces consumptive use.
6.2 District-Wide Efficiency Measures
Canal systems of major irrigation districts can extend for miles with travel times in some systems that exceed 24 days. In order to reliably supply water when it is needed so that crops do not suffer, canal operators traditionally kept canals completely full, spilling the excess back into the river system at the tail end of the canal system. This practice ensured reliability at the expense of river flows in the reach between the diversion structure and the end of canal return flow. Many efficiency techniques based on canal automation, order scheduling, and small operational reservoirs can be used to reduce canal diversions and keep more water in the river reach, between the diversion structure and the end of canal return flows, without harming delivery reliability. The Grand Valley Water Users Association and more recently the nearby Orchard Mesa Irrigation District have employed several these measures. In the Lower Colorado, the Imperial Irrigation District also implemented several these techniques. All three are discussed below in the Case Studies.

14
7 Co-Benefits of Increased Irrigation Efficiency
There are several co-benefits of increased irrigation efficiency. These improvements occur even if efficiency improvements do not provide any new water, or if the benefits shift water from one user to another due to changes in return flows. According to Gleick et al. (2011b), water management in the 21st century should not just consider the total volume of water used as in the “basin approach,” but also should evaluate how irrigation efficiency affects other factors. Efficiency improvements can: (1) enhance equity among users by reducing the need for excess carriage water, (2) increase yields (but see Section 8Improved Efficiency Can Increase Consumption), (3) reduce maintenance of aging delivery systems, (4) reduce pumping costs, (4) reduce leaching of fertilizers and other chemicals from excess water application, (5) reduce soil erosion, and (6) sustain flows in stream segments that are threatened by low flows7 (Allen et al., 2005; Allen & Willardson, 1997; Christian-Smith et al., 2010). Irrigation efficiency can also be a valuable tool to address waterlogging and saline conditions in groundwater (Allen & Willardson, 1997; A. J. Clemmens, Allen, & Burt, 2008; C. Perry, 2011; Wolthers, 1992).
Higher irrigation efficiency can increase the productivity of water in agriculture, often measured as the dollar value of the item produced per unit of water. Society should have an interest in seeing that water is put to higher economic uses and thus be concerned with water productivity. The basin perspective considers only the total volume of water used without considering the value produced from that water. Almost invariably, increased efficiency leads to higher value crops, in part because the expense requires higher economic returns. Gleick et al. (2011a) asserts that “the real purpose of water is to not be measured in total volume, but to measure the goods and services it provides by that water use.” Others argue similarly that the productivity of water is actually more important than valuing the volumes of water use (Lankford, 2012; MacDonnell, 2011a).
Increasingly, NGOs are suggesting that irrigation systems must be modernized – which almost always means more efficient – as a first step before pursuing any other methods to conserve water. Many irrigation systems in the West have infrastructure that is between 50 and 100 years old. This infrastructure is leaky, labor intensive, inflexible and is often data poor. Efficiency measures and modernization go hand in hand and are fundamental to most other water saving measures and ideas (Evans & Sadler, 2008a). Efficiency measures ensure that water use can be monitored, and that the basic tools are in place to support crop switching, deficit irrigation, temporary fallowing, or any other technique to save water.
8 Improved Efficiency Can Increase Consumption
The idea that higher efficiency of water use can lead to increased consumptive use may seem like a paradox. After all, in many cases of increased efficiency, diversions from the stream decline as efficiency increases and it thus appears that the crops are getting less water. Several factors, however, can lead to increased consumptive use from efficiency improvements. Even though total diversions decrease, in many cases efficiency measures actually increase the amount of water delivered to, and consumed by the crop. Delivery capacity limits can be removed with more efficient delivery and application methods
7 As discussed previously, the intersection of the doctrine of prior appropriation and increased efficiency through reduced diversions means that in some cases the stream reach between the improver and an upstream next-in-line diverter will see less water rather the expected result of additional flows below the improver’s headgate.

15
such as canal linings, sprinklers, and drip. Efficiency improvements on these ditches, often termed “water-short”, can increase consumption. Sprinklers and drip irrigation can be automatically turned on when crops need water rather than having to wait for a labor-intensive scheduled flood irrigation delivery. Sprinklers, drip, and laser leveled fields ensure that all crops in a field receive the optimum amount of water rather than having some plants receive too much and some too little. Thus, ditches with poor delivery “uniformity” can increase consumptive use after efficiency improvements. Farmers may shift to crops with more consumptive use with a new system that can deliver more water to crops during high need times. And in some cases irrigated acreage or ”effective irrigated acreage8” may increase (CAWA, 2008; Albert J. Clemmens & Allen, 2005; Evans & Sadler, 2008b; Huffaker, 2008; Schaible & Aillery, 2012).
Apart from increasing acreage, these practices are generally legal under most water law systems that focus on headgate diversions, not consumptive use, so long as the water right is not being changed. In most of these examples, headgate diversions decrease, water applied at the field increases, crop consumptive use increases, and return flows decline. In the absence of an upstream next-in-line diverter, the immediate result is that below the headgate river flows increase at the time of the diversion and downstream river flows dependent on lagged subsurface return flows decline.
9 Uniform Water Application, Removal of Labor, and Timing Constraints
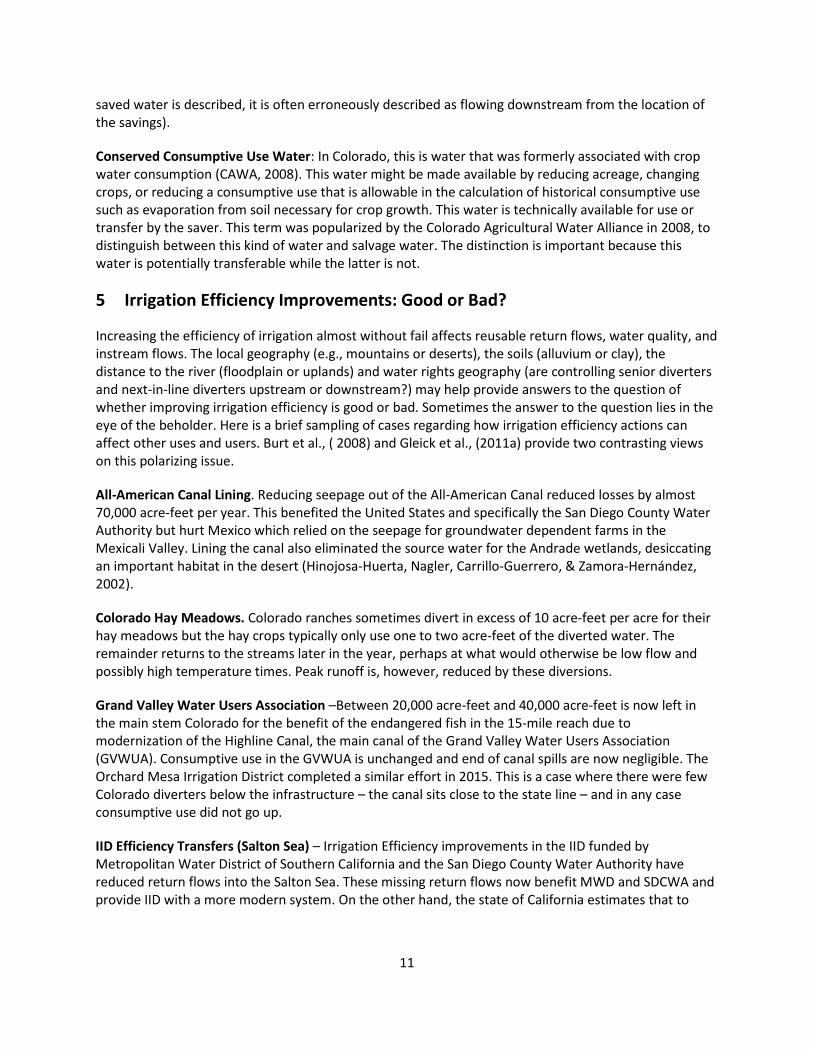
Increased irrigation efficiency may result in more water applied and consumed, even when acreage or crops are unchanged. Traditionally, irrigation water is not spread uniformly over a field. Flood irrigation typically over-irrigates the top of the field and under-irrigates the lower portions of the field. Plants are either over-watered or under-watered, both of which can reduce yields. Efficient irrigation spreads water more uniformly, reducing both over-irrigation and under-irrigation. Figure 2 illustrates this issue. The dashed horizontal line represents the ideal level of irrigation as infiltrated depth of water in the soil. The downward sloping curve is the irrigation adequacy: the percentage of area receiving a given infiltration depth of water. Increasing efficiency will “flatten” the slope of cumulative frequency distribution and increase the amount of applied water consumed by crops (Huffaker, 2008).
8 For example, growing crops in what were previously furrows.
16
Figure 2: Interaction of uniformity and efficiency in irrigation. Source: Huffaker, 2008.
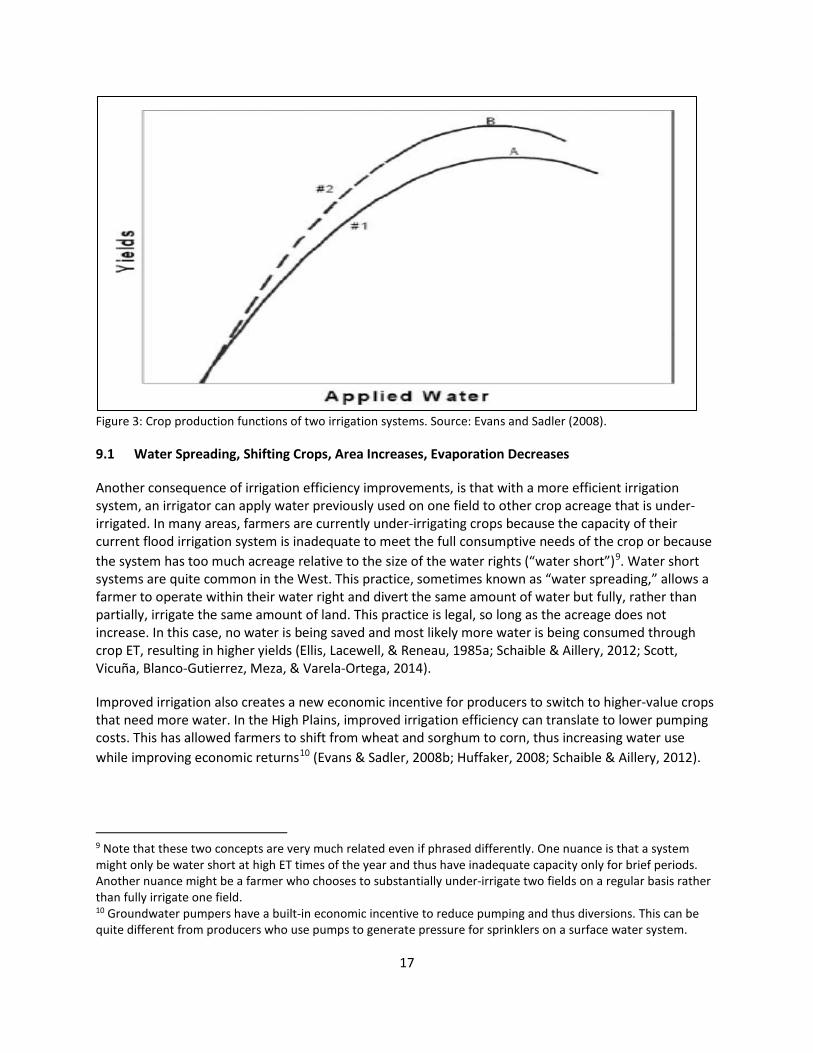
Irrigation efficiency improvements, such as sprinklers that supply water more frequently than flood irrigation, allow the plant to transpire more water over a longer period of time. With irrigation scheduling and automated water delivery possible with sprinklers or drip, a plant can be supplied with water whenever the plant needs it, not just on a set delivery schedule. This increased transpiration results in higher consumptive use (Albert J. Clemmens & Allen, 2005). Increasing irrigation efficiency also shifts the production function curve, encouraging an irrigator to apply as much water as possible to achieve higher yields. Figure 3 shows the benefits of improved irrigation efficiencies due to better scheduling and increased uniformity in space of water application. Curve 1 represents an “old” irrigation system and curve 2 is an improved system. These curves represent the average yield vs. water applied for the two different irrigation systems. As efficiency increases, the curve shifts upward thereby increasing yield for the same amount of applied water. The maximum potential yield (indicated by points A and B), is where growers like to operate because it has the lowest risk if water is not limiting. This results in higher yields and likely higher crop consumptive use.
17
Figure 3: Crop production functions of two irrigation systems. Source: Evans and Sadler (2008).
9.1 Water Spreading, Shifting Crops, Area Increases, Evaporation Decreases
Another consequence of irrigation efficiency improvements, is that with a more efficient irrigation system, an irrigator can apply water previously used on one field to other crop acreage that is under-irrigated. In many areas, farmers are currently under-irrigating crops because the capacity of their current flood irrigation system is inadequate to meet the full consumptive needs of the crop or because the system has too much acreage relative to the size of the water rights (“water short”)9. Water short systems are quite common in the West. This practice, sometimes known as “water spreading,” allows a farmer to operate within their water right and divert the same amount of water but fully, rather than partially, irrigate the same amount of land. This practice is legal, so long as the acreage does not increase. In this case, no water is being saved and most likely more water is being consumed through crop ET, resulting in higher yields (Ellis, Lacewell, & Reneau, 1985a; Schaible & Aillery, 2012; Scott, Vicuña, Blanco-Gutierrez, Meza, & Varela-Ortega, 2014).
Improved irrigation also creates a new economic incentive for producers to switch to higher-value crops that need more water. In the High Plains, improved irrigation efficiency can translate to lower pumping costs. This has allowed farmers to shift from wheat and sorghum to corn, thus increasing water use while improving economic returns10 (Evans & Sadler, 2008b; Huffaker, 2008; Schaible & Aillery, 2012).
9 Note that these two concepts are very much related even if phrased differently. One nuance is that a system might only be water short at high ET times of the year and thus have inadequate capacity only for brief periods. Another nuance might be a farmer who chooses to substantially under-irrigate two fields on a regular basis rather than fully irrigate one field. 10 Groundwater pumpers have a built-in economic incentive to reduce pumping and thus diversions. This can be quite different from producers who use pumps to generate pressure for sprinklers on a surface water system.

18
Drip and sprinkler irrigation can also increase consumptive use for simple physical reasons. Drip and sprinkler irrigation removes the need for furrows, and the furrow space can be occupied by plants, thereby increasing the “effective irrigated acreage”. Depending on the crop and root depth, drip tape can sometimes be placed well below the surface, thus reducing evaporation from the soil surface. (It should be noted that soil water evaporation, by keeping the area near the surface cool, does reduce the need for a nearby plant to transpire water for cooling. Hence, water evaporation from the soil surface is not entirely a non-beneficial use of water).
9.2 Modeling and Case Studies on Increased Consumptive Use
Significant research backs up claims of increased consumptive use when efficiency measures are implemented. Modeling studies of efficiency improvements like sprinklers have shown that such improvements do increase irrigation efficiency, but also can lead to increased consumptive use (Cai, Rosegrant, & Ringler, 2003; Contor & Taylor, 2013; Ellis, Lacewell, & Reneau, 1985b; Scheierling, Young, & Cardon, 2006; Ward & Pulido-Velazquez, 2008a). The Colorado Department of Water Resources State Engineer carefully administers flood to sprinkler irrigation conversions in the Arkansas Valley to minimize the potential for increased consumptive use and hence violations of the Arkansas Compact (Wolfe, 2009).
Studies on actual irrigation efficiency projects also support these findings (Johnson, Sullivan, Cosgrove, & Schmidt, 1999; Kendy, Molden, Steenhuis, Liu, & Wang, 2003; MacDonnell, 2011b; Pfeifer & Lin, 2010; Scott et al., 2014; Venn, Johnson, & Pochop, 2004). These studies point out that on-farm efficiency improvements increase on-farm consumptive use, decrease return flows, limit aquifer recharge, and increase overall basin consumptive use, contrary to the conventional wisdom that efficiency improvements increase water supplies. These studies are discussed below in the section on Case Studies.
One study on the USDA Environmental Quality Incentives Program (EQIP), which provides subsidies for on-farm efficiency improvements, also shows similar results. These studies all cite increased on-farm production, yields, and profits for irrigators. But such subsidy programs also increase consumptive use, and generally do not conserve water. A study of the New Cache La Poudre Irrigation Company in Weld County, Colorado assessed the effects of conservation subsidies. They determined that such policies are unlikely to provide real water conservation savings. Increased irrigation efficiency leads to less leaching of fertilizers and pesticides, and controls soil erosion. Yields and gross revenues would slightly increase with more irrigation improvements, but the operation and maintenance costs increase at a faster rate. They also include a table that shows for all scenarios that consumptive use is unlikely to decrease and will most likely increase. Such a subsidy policy would not bring about any “new water” downstream (Scheierling et al., 2006).
10 Water Conservation Measures
Water conservation measures that reduce crop and non-crop consumptive use are another way to reduce water use. Reductions in consumptive use can occur by reducing evaporation from canals, by reducing crop and non-crop ET (which can affect yields in the case of crop ET if the crop is not changed), by reclaiming water that would otherwise flow into saline bodies of water, and by more effectively utilizing rainfall (CAWA, 2008; A. J. Clemmens et al., 2008; Schaible & Aillery, 2012). These options reflect the fact that the only real “losses” from an irrigation system are evaporation from open water

19
surfaces and moist soil, transpiration from vegetation, and flows into saline sinks (Allen et al., 2005; Allen & Willardson, 1997). These options are more limited, however, than ways to increase efficiency, and some methods will reduce yields and thus profits. Note that the efficiency improvement methods discussed above may increase, decrease, or not change consumptive use, unlike the methods discussed in this section which are strictly focused on reducing consumptive use. A subset of water conservation methods are sometimes called “water salvage” methods. In Colorado, this term has come to mean methods that reduce evapotranspiration from phreatophytes, or the reduction of non-productive consumptive use. Water obtained in this fashion is not available for a separate water right or for transfer.
10.1 Reducing Non-Beneficial Evaporation
In any irrigation system, some fraction of the applied water goes to evaporative losses from canals, ditches, reservoirs, and wet soil in fields. Drip or trickle irrigation, cover crops, mulching, and conservation tillage are all ways to reduce evaporation (Allen et al., 2005; Allen & Willardson, 1997; Blum, 2009; CAWA, 2008; Molden et al., 2010; C. Perry, 2011; Schaible & Aillery, 2012; Seckler, 1996; Shock, 2006). Two studies in Australia with wheat indicate that between 33% and 40% of water loss is by evaporation from soil (French & Schultz, 1984; Siddique, Tennant, Perry, & Belford, 1990). CAWA (2008) suggests that evaporation from soil is 20 to 30% of consumptive use. Targeting reductions in water loss by soil evaporation could present the best opportunity to conserve water (Blum, 2009). Gleick et al (2011) claim that we do not know much about pure evaporative losses associated with consumptive use.
This is one area where water conservation measures may actually create water for new uses, rather than move it between uses. In deep subsurface drip, these surface losses can be largely eliminated. Note, however, that germinating seeds and small plants with shallow roots must be watered at the soil surface with sprinklers or flood irrigation. Evaporative soil losses are larger when the plants are small and the soil is exposed to direct sunlight. Later when the soil is shaded by plant growth, these losses go down. It should be noted that evaporation from wet soil affects the microclimate around the crop by increasing humidity, and reducing the rate of transpiration required to achieve a specific yield (C. Perry, 2011). Compared to crop transpiration, evaporation of moisture in fields can be easier to control with techniques like mulching. Most evaporative losses occur in the planting season before crop cover is established when the sun can directly strike the soil (Seckler, 1996). Computerized irrigation scheduling has the potential to reduce evaporative losses by only watering when necessary. This topic is covered in Section 6.1.3 above Irrigation Scheduling.
10.2 Reducing Crop and Non-Crop Transpiration
Reducing the consumptive use of crops can also be achieved by limiting the amount of transpiration. However, decreasing transpiration in almost all circumstances will result in decreased biomass and yields. There is a linear relationship between plant biomass and transpiration, and there is a limit to how much improvement is possible in increasing the water productivity of crops when it comes to transpiration (Molden et al., 2010). Less than 1 percent of water is used for fluids in the plant, but the rest is transpired to control the heat of the plant, similar to perspiration in humans (Seckler, 1996).
Reducing transpiration can be accomplished by decreasing irrigated acreage, i.e., fallowing, changing to a cool season crop, changing to a cultivar that matures faster, or applying less water to crops when they can tolerate the stress through deficit irrigation (CAWA, 2008; Schaible & Aillery, 2012). Decreasing

20
acreage and deficit irrigation will likely reduce yields. Shifting to a cool season crop or a crop with a shorter growing season may also affect a farmer’s income through reduced marketable yield. Reducing weeds or other non-cropped plants in waterlogged parts of a field will reduce non-beneficial transpiration. There are also often plants along canals and ditches. Removing these kinds of plants can reduce transpiration, but they also serve other beneficial purposes such as wetlands habitat or provide desirable esthetics (Allen et al., 2005; Schaible & Aillery, 2012).
10.3 Reducing Runoff into Saline Water
If surface or subsurface return flows into a body of water that cannot be reused, capturing and reusing this water can increase water supplies (Allen et al., 2005; Allen & Willardson, 1997; CAWA, 2008; A. J. Clemmens et al., 2008; Gleick et al., 2011b; Schaible & Aillery, 2012). Saline water bodies can include subsurface salty groundwater, the ocean, and above ground salty lakes like the Great Salt Lake.
Perhaps the best-known example of reductions in flows to a saline water body are actions that the Imperial Irrigation District have undertaken to reduce flows into the Salton Sea. These actions were originally forced on IID by a 1984 California State Water Resources Control Board decision to reduce waste. The ruling was instigated by an IID farmer and landowner whose land was being submerged by a rising Salton Sea fed by IID runoff. Since that time, IID has undertaken many measures to reduce inflows into the Salton Sea with the perverse outcome that the Salton Sea is now threatened (Cohen, 2014). One such action is a large water transfer to the San Diego County Water Authority (see cases below). Without additional inflows, the Salton Sea will become hypersaline, and the main fish upon which millions of birds depend will die. In addition, exposed shorelines will allow for airborne dust. This is discussed further below in the case study on the Salton Sea.
The Salton Sea example provides a complicated case that has elements of both water conservation and improved irrigation efficiency. Reducing runoff into saline water is considered a water conservation method because it “increases” water supplies in a basin, albeit in an unusual manner. Most water conservation methods somehow decrease the consumed (i.e. vaporized) fraction of water, thus freeing up liquid water for other purposes. This method effectively converts a previously non-consumed but non-recoverable fraction of water into a non-consumed and recoverable fraction. It thus provides usable water where they did not previously exist.
The example also has elements of increased irrigation efficiency because headgate diversions in some cases can be reduced by the amount of the non-recoverable return flows. For example, return flows into the Salton Sea are being decreased to provide additional water for the San Diego County Water Authority and the Coachella Valley Water District. These reductions in return flows are taken by SDCWA without the need for IID to even divert these flows. The reductions thus increase the overall irrigation efficiency of IID by reducing diversions.
One could argue, however, that the flows into the Salton Sea were already being “consumed” by the fish and birds. In this case, this sort of transfer looks less like a water conservation measure that creates more water and more like an irrigation efficiency measure that moves return flows from one user (birds and fish) to another user (humans). It needs to be noted that environmental issues with reductions in inflows into saline above ground lakes are quite common. Severe environmental problems from inflow reductions in the last fifty years have occurred at California’s Mono and Owens Lakes (Blumm &
21
Schwartz, 1995; Nagourney, 2015), Iran’s Lake Urmia (Stone, 2015), Bolivia’s Lake Poopó (Casey, 2016) and Asia’s Aral Sea (Micklin, 2007).
10.4 More Effective Utilization
Another option is to better utilize rainfall to irrigate crops. Rain-fed agriculture relies on using and directing rainfall in a way that will irrigate entire fields of crops. Planting crops more densely where rainfall is higher and utilizing precipitation capture and moisture retention techniques can improve rainfall utilization (A. J. Clemmens et al., 2008; C. Perry, 2011; Schaible & Aillery, 2012). In most parts of the Colorado River Basin, this technique would have little applicability because of the arid nature of the basin. Rainfall in the Imperial Irrigation District historically has perversely led to spills of irrigation water due to a lack of operational storage of previously ordered and impossible to stop irrigation water. In recent years, IID has added operational storage, including the Drop 2 (“Brock”) reservoir on the All-American Canal to handle such events. It is not known if better rainfall capture in the Upper Basin is possible.
11 Non-Colorado River Cases
11.1 California
Christian-Smith et al. (2010) identifies, describes, and analyzes successful examples of sustainable water policies and practices in California. They note that many different practices and technologies can improve on-farm water-use efficiency, but focus on smart watering systems, in-field monitoring, irrigation scheduling systems, and drip irrigation. One of the cases discussed is smart irrigation scheduling on an almond ranch. There were significant water reductions on water applied to fields (20 percent) and higher yields due to a system that measures soil moisture and informs the farmers when and how much to irrigate. It is not clear how reductions in applied water decreased and yield increased without increased consumptive use. Some studies have shown that irrigation scheduling can drastically reduce non-beneficial consumptive use evaporation from bare soils and this may explain at least some of the paradox (French & Schultz, 1984; Siddique et al., 1990).
11.2 High Plains Aquifer
Pfeiffer and Lin (2010) examined the effect of widespread conversion from center pivot irrigation to higher efficiency dropped-nozzle center pivot irrigation in western Kansas. They used panel data from over 20,000 groundwater-irrigated fields in western Kansas from 1996 to 2005. They concluded that the shift in irrigation systems increased consumptive use and groundwater extraction. Applied water per acre increased on average by 0.03 to 0.05 acre-feet per acre with dropped nozzles, a 2.5 percent increase. Farmers used more water per acre on irrigated fields, irrigated slightly larger proportions of their fields, and were less likely to leave fields fallow or plant non-irrigated crops. After the irrigation improvement, farmers were more likely to plant water intensive crops like alfalfa, corn, and soybeans.
A study on the economic impact of new irrigation systems and limited tillage practices on the Texas High Plains concluded that new irrigation technology will not lengthen the life of groundwater resources. Water use will increase because producers will have an economic incentive to apply more water per acre on the same crop for greater yield (Ellis et al., 1985a).

22
11.3 Salt River, Wyoming
Venn et al. (2004) conducted a hydrologic analysis of improved irrigation efficiencies in the Salt River Basin in Wyoming, along the Idaho Border. The Salt River, a tributary to the Snake, supports intensive agricultural activity; it provides 95 percent of the water used for irrigation in the area. The nearby Greys River has a similar flow but it has not been impacted by changes in irrigation like the Salt River. The Greys River was thus used as a control to determine impacts associated with the change in irrigation11. Along the Salt River, irrigation systems have been converted from flood to sprinklers.
The two rivers were examined from 1954 through 2000. After the installation of sprinklers, stream flows were considerably altered in the Salt River Basin. Flows increased 34 percent in May and 50 percent in June, but decreased 14 percent in August and 15 percent in September. These changes reflect the fact that deep percolation, seepage, and groundwater recharge from flood irrigation were eliminated when sprinklers are used. The late season river flow reductions occurred when irrigation water is under its greatest demand. Yields increased from 1.6 tons/acre to 2.1 tons/acre. The overall efficiency of the area increased from an assumed 50 percent for flood irrigation to 70 percent for sprinkler irrigation. There was an increase in average annual flow of 53,200 acre-feet, 9 percent of the average.
The study does not mention changes in consumptive use, but it is likely there was an increase in consumptive use since yields increased. The increase in annual flow is likely due to decreased diversion amounts. Since the increased consumptive use is not coming from the flow of the river, there may be impacts to the groundwater in the area. It is also possible that there are reductions in non-beneficial consumptive use.
11.4 Yellowstone River, Wyoming, and Montana
In the early 2000s, there were critical water shortages in Montana and Wyoming along the Tongue and Powder Rivers, tributaries of the Yellowstone River. Montana claimed that Wyoming violated the Yellowstone River Compact and should have regulated water post-1950 rights that were appropriated after the compact. Wyoming responded that post-1950 diverters were in fact curtailed. In 2007, Montana filed its complaint with the U.S. Supreme Court. According to Montana, the change from flood to sprinkler irrigation in the basin led to an increase of consumption from 65 percent of water diverted to 90 percent, reducing return flows from 35 percent to 10 percent. A Special Master determined that these improvements did lead to increased consumptive use, but declared that these actions did not violate the Compact. The Supreme Court found that changes in irrigation methods due to efficiency are within the scope of the Compact (MacDonnell, 2011b).
The Compact is somewhat unusual in that it does not refer to consumptive uses, only diversion amounts. It also never anticipated cross-state application of priority. The movement to sprinklers did not involve a change in place of use, time of use, purpose of use or point or diversion, the typical factors under prior appropriation that are not allowed to change without a legal review of the water right. State courts have found that on-farm efficiency improvements such as ditch lining, pipeline installation and other methods are within the scope of water rights and do not constitute injury to downstream users.
11 It should be noted that the Salt River has a wide valley suitable for agriculture while the Greys River is in a narrow confined canyon. Although they join the Snake at about the same location, they do have very different basins.

23
MacDonnell notes that often, in the West, irrigators are “water short”, meaning they are unintentionally deficit irrigating. With more efficient infrastructure, an irrigator may be able to deliver a full supply of water to a crop that will lead to increased consumption. It is also not clear that efficiency improvements lead to overall economic losses in the basin although there are individual winners and losers.
MacDonnell (2011b) argues that the rigidity of the basin approach to water management doesn’t allow farmers to adapt to contemporary problems by installing better technologies such as sprinklers. To completely protect downstream users from harm is to prevent needed and necessary changes for the 21st century. In his view, it doesn’t make economic sense to prevent potential economic gains to prevent harm to inefficient, low technology users. Sprinklers have a host of benefits including reduced stream diversions and higher crops yields. In addition, reduced return flows mean less fertilizer and pesticides coming into streams, as well as less salinity and selenium. Such improvements may reduce return flows, but downstream users will be inclined to also adjust and install sprinklers as well.
11.5 Snake River Plain, Idaho
The Snake River Plain aquifer in southern Idaho has experienced declining aquifer levels due to diminished recharge from reduced surface irrigation and increased irrigation pumping. From 1975 to 1995, about 350,000 AF was depleted from the aquifer every year. The State of Idaho has been implementing a program of intentional recharge with little beneficial result. Reductions of flows from springs have impacted commercial fish production, irrigation, and hydropower generation (Johnson et al., 1999).
Originally, the aquifers in the area were recharged from canal seepage and surface irrigation application more than ET. This system elevated the water table and increased the flows of springs discharging into the Snake River at Idaho Falls. Water users became dependent on the recharge from surface water irrigation. In the late 1800s and early 1900s, 900,000 acres of irrigated land contributed to the recharge of the aquifer and increased the elevation of groundwater levels. The volume of the water stored in the aquifer increased by 15 maf from 1915 to 1955. Annually, 340,000 af were being added to the aquifer. In the mid-1950s, irrigation technology began to change with the gradual conversion from flood, furrow, and sub-irrigation practices to sprinklers, and the lining of canals. Surface water recharge declined significantly. Since the 1950s, 800,000 acres of groundwater irrigated land have been brought into production. The State has placed a moratorium on new irrigation pumping and created groundwater districts to measure pumping to mitigate the issue with mixed results (Johnson et al., 1999).
11.6 Rio Grande
An analysis of possible water conservation policies in the Elephant Butte Irrigation District in the Rio Grande Basin, found that as subsidies for irrigation improvements increased, so did ET, crop yields, and farm incomes. There was also a decrease in return flows, aquifer levels, and total water conserved (Ward & Pulido-Velazquez, 2008b). The findings “suggest that some programs subsidizing irrigation efficiency are likely to reduce water supplies available for downstream, environmental and future uses.” In addition, “where reduced return flows and lost aquifer seepage block another’s water use, conservation poses a serious question for water rights administration because those effects are often hard to measure and often occur with considerable delay”.
24
12 Colorado River Basin-wide Cases
12.1 Colorado River Basin Salinity Control Project
The 1944 U.S.-Mexico treaty covering the Colorado River provided a minimum annual delivery of 1.5 maf of water to Mexico. The treaty did not, however, explicitly mention water quality. Irrigation and municipal water projects built in the early and mid-20th century contributed to salinity increases through high salinity return flows originating from naturally saline ground and reductions in the water for dilution from out-of-basin diversions.
Nearly half of the salinity in the Colorado River is from natural sources: saline springs like Glenwood Springs and Blue Springs on the Little Colorado River in the Grand Canyon, and erosion of saline geologic formations. Human activities increase salt by two separate effects: (1) salt loading, and (2) salt concentration. Salt loading is the process by which water picks up salts from contact with soil and then return flows carry these salts to the river. Salt concentration occurs when plants evaporate pure water, leaving the salts behind. Reservoir evaporation also concentrate salts. Out-of-basin diversions create an additional salt concentration problem. These diversions generally occur high in the basin where salt loads are low. Thus, there is less water left to dilute salts from downstream salt loading and salt concentrating processes. Irrigation contributes 3.4 million tons of salt per year by dissolving salts found in the underlying saline soil, mainly Mancos shale. Contrary to common thought, much of the salt originates in the Upper Basin.
Salinity levels began to increase considerably in the Lower Basin and even near Grand Junction, Colorado in the 1950s and 1960s. In addition, the Wellton-Mohawk Irrigation and Drainage District (WMIDD) began pumping excess saline groundwater (6000 ppm total dissolved solids) into a drain, the Main Outlet Drain (MOD), which emptied into the Gila River just above Mexico’s main diversion. The WMIDD’s groundwater problem arose after the district began receiving Colorado River water beginning in the 1950s. Shortly after the pumping began, Mexican farmers began to have problems with crop yields and the Mexican government formally protested to the U.S. in November of 1961.
There were several temporary attempts to solve the problem beginning when Mexico first protested. In 1965, Minute 218 was signed, requiring the U.S. to construct a 12-mile extension (the MODE) from the existing MOD terminus on the Gila River to below Mexico’s main diversion at Morelos Dam, thus bypassing the saline flows. A permanent solution was not reached until 1973 with Minute No. 242 (Bickell, 1999).
Under the 1973 agreement, the U.S. must deliver water of approximately similar quality to Mexico that was delivered to major diverters at Imperial Dam. No longer could the U.S. meet its delivery requirement by using highly saline return flows. The Colorado River Basin Salinity Control Act, authorizing government entities to control the salinity of water delivered along the Colorado, was enacted shortly after the Minute in 1974. The act established the Colorado River Basin Salinity Control Program (CRBSCP), authorized the construction of the Yuma Desalting Plant, provided funding for Mexico to build a 53-mile extension to the MODE to deliver approximately 100 kaf/yr of WMIDD highly saline flow and/or reject water from the Yuma Plant to the Santa Clara Slough (now known as the Cienega de Santa Clara), and enacted the Wellton-Mohawk Irrigation Efficiency Improvement Program and a companion program to reduce acreage in WMIDD by up to 10,000 acres (Bickell, 1999).

25
At first, the CRBSCP only applied to the Lower Basin with a focus on the WMIDD. However, because much of the salt originates in the Upper Basin, the program was expanded. A multi-agency effort including Reclamation and USDA NRCS has significantly reduced salt loading in the Colorado River and its tributaries. In the past 30 years, the CRBSCP has found that salinity projects to reduce irrigation water contact with saline soils is the most effective control measure (Quality of Water, 2013). The program identifies salt source areas, develops conservation plans to reduce salt loads, installs conservation practices, and then monitors and evaluates those projects (Bickell, 1999). Projects are also “owned” by the proponent like an irrigation district or ditch company, not the Bureau of Reclamation as were the first projects (Quality of Water, 2013).
Annually, 7.7 million tons of salt accumulate in the Colorado River. As of 2012, the CRBSCP is removing over 1.295 million tons of salt per year. The 2020 target is 1.85 million tons. Meeting this and future goals would require a significant increase in funding for the Bureau of Reclamation, NRCS, and the Bureau of Land Management (Quality of Water, 2013). Many of the cheaper projects have been completed and the cost per ton of measures has increased from an average of about $50 in 2005 to $125 in 2011 (USDA, 2011).
These projects are designed, first and foremost, to control salinity. The techniques used in many of the projects — conversion to either lined canals or pipes, and the installation of sprinklers — are also typical irrigation efficiency projects. Hence, these projects have an important co-benefit of improving irrigation efficiency in many locations along the river.
13 Colorado Cases
13.1 Grand Valley Water Users Project
Just upstream of Grand Junction, Colorado, large amounts of water are diverted out of the Colorado River by five different entities to irrigate 69,000 acres in the Grand Valley (Uilenberg & Norman, 1999)12. The Grand Valley is about 12 miles wide and 35 miles long. Irrigation feeds apple, peach, and pear orchards, but most acreage is devoted to forage crops like corn, alfalfa, wheat, and other crops like beans and seed crops. In 1910, the Grand Valley Irrigation Project received federal funding to divert water from the Colorado River through a dam and four canals over 90 miles long including the 55-mile Government Highline Canal. This diversion is the single largest diversion on the Colorado River in the state of Colorado with annual average diversions of 770 kaf (USBR, 2013b). The project also included a power plant associated with the project, the Grand Valley Power Plant (Simonds, 1994). In recent years, the Grand Valley Project has provided 60 percent of the water delivered to the five irrigation districts in the area (Uilenberg & Norman, 1999).
The Upper Colorado Endangered Fish Recovery Program, an interagency partnership to recover the endangered Colorado pikeminnow, razorback sucker, humpback chub, and bonytail chub, was created in 1988 (MacDonnell, 1999a; USBR, 2013a). The Program quickly sought to improve the fish habitat in the Colorado River, especially in an area known as the “15-mile reach” because it is a critical spawning area for endangered fish. The 15-mile reach extends from just below a major diversion structure for the
12 There is an additional diversion on the Gunnison River – Redlands Water and Power -- which also serves land in the Grand Valley on the west side of the Colorado River.

26
Grand Valley Irrigation Company near Palisade, Colorado to the confluence of the Gunnison and Colorado rivers in Grand Junction. In Colorado, this stretch is affected more by depletions than any other section of the river (USBR, 2013a). In dry years and later in the summer, so much water was diverted historically that the river would sometimes dry up in the 15-mile reach until return flows rejoined the river downstream. The construction of ten major upriver dams in 80 years also significantly altered the hydrology and habitat of this section of the Colorado River. Many native fish relied on the historical temperatures, floodplains, spring floods, and turbidity in the water.
The Grand Valley Project supplies 60% of the diversions in the Grand Valley to four of the six diverters13 including the Grand Valley Water Users Association and the Orchard Mesa Irrigation District. The GVWUA operates a gravity system that runs a continuous flow in the Government Highline Canal through the season to ensure that water is available to meet farmer needs. There had been on-farm improvements over the years like lining ditches with concrete, and installing siphon tubes and gated pipe — but no effort had been made to improve the main conveyance system (MacDonnell, 1999a). Other on-farm improvements had decreased the impact of salinity on downstream users by decreasing deep percolation through the underlying salty shale soil (A. J. Clemmens et al., 2008). These improvements, however, did not save water. There was little incentive to change this system because it was simple and relatively inexpensive (MacDonnell, 1999a).
In 1992, the Bureau of Reclamation analyzed a multitude of possibilities to address low flows in the 15-mile reach. The most cost-effective method was to reduce diversions from the Grand Valley Water Users’ Association (GVWUA) part of the Grand Valley Project. With automation and new facilities, studies indicated that nearly 28,500 af/year of excess carriage water could be rerouted to the 15-mile reach (MacDonnell, 1999a; Styles, Burt, Khalsa, & Norman, 1999).
A total of $8.2 million of improvements were completed by 2002 to automate the delivery system (Khalsa, Styles, Burt, & Norman, 2002). Travel time along the 55-mile length of the 1600 cfs14 Government Highline Canal was approximately 72 hours which challenged operators to balance supply and demand. Historically, the operators kept the canal as full as possible so that the canal always had the water necessary to meet demand anywhere along its length. This meant, however, that sometimes the canal had too much water in it, which was returned to the river below the 15-mile reach. By adding automated check structures in the main canal, diversions could be reduced. The check structures allowed subsections of the canal to maintain the necessary height for diversions to laterals. In addition, expanded use of a small existing Colorado Parks and Wildlife recreation reservoir at the end of the canal allowed for the temporary storage of excess water, and met end-of-canal needs at times when the canal did not have enough water. New main office control facilities allowed for centralized control of all the automated equipment.
Legally protecting (“shepherding”) the water in the 15-mile reach created by the improvements from other diverters required legal creativity. Environmental use was not compatible with the uses of the
13 The diverters are Grand Valley Irrigation Company (north side), Grand Valley Water Users Association (north side), Palisade Irrigation District (north side), Mesa County Irrigation District (north side), Orchard Mesa Irrigation District (south side), and Redlands Water and Power District (south side, west of the Gunnison River.) 14 The canal splits at the mouth of Debeque Canyon with about 800 cfs going to GVWUA and the other half to the Orchard Mesa Irrigation District via a siphon under the river and I-70.
27
existing water right for the GVWUA. Under Colorado water law, another user downstream or upstream could legally appropriate the newly created excess water. It would difficult and even cost-prohibitive to obtain a decreed change of use for the water right (Uilenberg & Norman, 1999).
Through litigation known as the Orchard Mesa Check Case, the U.S. government, GVWUA, and the Orchard Mesa Irrigation District obtained a Colorado water court-sanctioned settlement agreement that provided the legal foundation for protecting conserved water from other diverters. The GVWUA receives stored water from Green Mountain Reservoir when natural flows are insufficient to satisfy irrigation demand. If the volume of reservoir water available exceeds the amount required to provide a full water supply to all eligible users, a special surplus condition is declared. Reducing diversions for the Grand Valley Project increases the occurrence of a surplus condition.
The Grand Valley Power Plant ultimately provided one of the legal mechanisms to protect deliveries of surplus storage water to benefit the fish habitat. The plant has a relatively junior right and unused capacity in the late summer months when the streamflow is lowest. Under a new contract with Reclamation, surplus water from Green Mountain Reservoir is used to fill the unused capacity at the power plant and the plant conveniently discharges water immediately above the 15 Mile Reach. The other legal mechanism was another new contract between Reclamation and the cities of Grand Junction, Fruita, and Palisade to deliver surplus Green Mountain water for instream recreational flows in the 15-mile reach (Uilenberg & Norman, 1999). The improvement of the canal system has exceeded expectations with water diversion savings exceeding 28,500 acre-feet per year (C. M. Burt, 2003). Recent estimates are that in some years nearly 40,000 af/year remains in the Colorado River.
13.2 Orchard Mesa Irrigation District Canal System Improvement Project
The Orchard Mesa Irrigation District (OMID) was organized in 1904 and became a part of the federal Grand Valley Project in 1922. The OMID main canal splits from the Government Highline Canal about 4.6 miles downstream of the GVIP dam (“the Roller Dam”), and goes under the Colorado River and I-70 in an inverted siphon at the mouth of Debeque Canyon, just upstream of Palisade, Colorado. The district provides water for 6,700 landowners irrigating 9,200 acres (USBR, 2013b). The customers are a mix of residential and agricultural water users, and support a diverse agricultural economy: orchards, vineyards, vegetables, alfalfa, and small grains. Through funding from the Bureau of Reclamation and the National Resource Conservation Service, the district had been able to make some improvements like alkalinity and salinity mitigation, and some on-farm improvements. However, like the GVWUA prior to modernization around 2000 (see above), the main canal for the OMID had not been upgraded and required a significant amount of carriage water that led to spills (Widener, 2015).
Initial studies were performed in 2007 and 2012 (ITRC, 2007, 2012). Beginning in 2014, the Orchard Mesa Irrigation District (OMID) undertook a similar project as the GVWUA modernization to benefit the Upper Colorado River Endangered Fish Recovery Program. The project involves improving and automating the OMID canal system. A $16.5 million budget included a regulating reservoir, check structures on the canals, remote monitoring system and electronic flow meters (SCADA), increased pump capacity, interties and upgrades to canal end spills, lining and piping, and improved operational procedures (Moving Forward, 2015; USBR, 2013b).
In most cases, the saved water will be used to augment flows in the 15-mile reach (Moving Forward, 2015). This will be accomplished by diverting flows as normal, and then running them through the OMID

28
power plant at the head of the 15-mile reach rather than pumping the saved water up into the OMID delivery canals as done previously. In a few low flow cases, the water savings may go to other water rights. The existing Orchard Mesa Check Case provides the legal technique to protect the saved water from diversion in most cases (MacDonnell, 1999b).
Canal structures were completed in 2014, and regulating the reservoir was planned to be completed in 2015. The project is expected to result in 17,000 acre feet/yr in savings from reduced canal spills, and spills in urban areas. The project should be fully operational for 2016 (Moving Forward, 2015).
13.3 No Chico Brush
No Chico Brush is a farmer-led group in the Gunnison River Basin in western Colorado that pushes a “farmer-first” approach to dealing with agricultural water issues. The name refers to the group’s goal of preserving irrigated agriculture and not allowing agricultural lands to be covered in native desert plants like greasewood, or “Chico brush.” The goal of the group is to pursue irrigation efficiency improvements to assist both farmers and the environment (Denison, 2015; Harold, 2014).
By modernizing irrigation systems, improving wildlife habitat, and limiting downstream impacts of salinity and selenium though soil and water conservation, No Chico Brush wants to ensure that the agricultural sector will not be a target in the future for potential water supplies (Denison & Harold, 2015).
The group pushed to have the USDA designate the Colorado River Basin as a Critical Conservation Area to enhance their ability to participate in the Regional Conservation Partnership Program (RCPP) funded by the 2014 Federal Farm Bill (Harold 2014). Several entities including NCB, the Nature Conservancy, and the Colorado River Water Conservation District were successful in obtaining a $16 million RCPP award in 2015. The RCPP project targets improving irrigation efficiency and diverting less water to improve river and fisheries health (Trout Unlimited, 2015). The project also includes research on comparing furrow irrigation to overhead sprinkler, drip, and “big gun” irrigation systems to assess the consumptive use of certain crops, application efficiency, and how much water returns to the system (WRSA Grant Application, 2014). No Chico Brush has yet to report significant progress, in part due to landowner reluctance to participate.
14 New Mexico Cases
14.1 Drip Irrigation Investigation in New Mexico
The New Mexico Interstate Stream Commission funded a series of conversion projects in Southern New Mexico from flood to drip irrigation to promote water conservation (Moving Forward, 2015). A follow-up study examined the water consumption of drip- and sprinkler-irrigated fields versus flood-irrigated fields. A total of 103 fields were identified. Crops included alfalfa, chiles, corn, cotton, milo, and pecans. There were 63 fields with drip irrigation, and 40 fields were irrigated with flood or center-pivot (INTERA, 2013).
Remote-sensing-based techniques were combined with ground data collection to find consumptive use (Martinez, Jordan, Whittaker, & Allen, 2013). Surface temperature of crops showed that lower temperatures were present for drip-irrigated fields. This usually shows a correlation with more water
29
consumption. The normalized difference vegetation index (NDVI), an indicator of “greenness” using remote sensing, also determined that drip-irrigated fields had more biomass and hence higher yields. For 2012, fields that were drip irrigated had 8 to 16 percent higher consumptive use, more robust crop growth, and higher yields (INTERA, 2013).
Since water rights were based on diversion rates and not consumption rates, farmers were able to operate within their water decree and increase their consumptive use. A larger percentage of pumped groundwater was converted into ET, reducing percolation into the groundwater system that recharges the aquifer (INTERA, 2013; Martinez et al., 2013).
15 Utah Cases
15.1 Ferron Salinity Control Project
In Emery County, Utah, farmers have used flood irrigation for decades. The county includes the Price and San Rafael River Basins which contribute a large amount of salt to the Colorado River, nearly 430,000 tons a year. Almost 60 percent of that amount comes from irrigation runoff and canal seepage (Carroll, 2006).
The Ferron Salinity Control Project was a partnership effort under the Colorado River Basin Salinity Control Program to reduce salinity runoff near Ferron, Utah though improved agricultural practices on the lands of a local irrigation district (Carroll, 2006). The project began in 1998 and took eight years until completion (Stoddard, 2006). The project included new pipelines and laterals of pressurized pipe, and regulating ponds. There were 175 miles of pipe installed and 10,000 acres of agricultural land were converted to pressurized sprinklers (Moving Forward, 2015).
The Bureau of Reclamation and NRCS funded the $20 million project, which has reduced salt loading by 40,000 tons per year (Moving Forward, 2015). In the past, it has cost the Bureau $100 for every ton of salt reduced, but the Ferron project worked out to be $30 per acre ton, a financial success (Stoddard, 2006). Irrigation efficiency of the system has also increased significantly, from around 30 percent to 67 percent (Carroll, 2006).
Water savings were not quantified, but anecdotal accounts say that there is greater water availability (Moving Forward, 2015). In the past, water sources would be depleted by late summer, but now there is a continued supply into the fall (Carroll, 2006). Crop yields have increased by one-third, fourth cuttings of hay are more common, deep percolation was eliminated, furrow reduction means more farming ground, and runoff has been reduced (Stoddard, 2006).
16 Arizona Cases
16.1 Diamond Ditch Improvement Project
The Verde River, Arizona’s only Wild and Scenic River, runs 195 miles south from its headwaters located in the middle of a triangle bound by Prescott, Williams, and Flagstaff into the Salt River near Phoenix. The 42 diversions along the river and its tributaries were mostly built in the late 19th and early 20th centuries, and have not changed substantially to this day. The river supports many different animal species including listed endangered species and is valued as an ecological hotspot. A several-mile-long
30
stretch in lower Verde used to become severely depleted or dry late in the irrigation season (Hutchinson, 2015; Postel, 2013b).
The most downstream ditch is the Diamond S, a five-mile-long ditch that brings water to 80 users irrigating approximately 400 acres near the town of Camp Verde. Working alongside The Nature Conservancy (TNC), the Diamond S Ditch has recently automated the ditch to reduce diversions and increase flows in the Verde by 5 cfs during the dry summer periods, approximately doubling the existing flows. Computer and radio-controlled systems were added to the ditch gates to keep a constant flow of water in the ditch, automatically lowering and raising the gates so that the ditch delivers a volume of water closer to what the users actually need (Postel, 2013b). Prior to the upgrade, the extra carriage water was returned to the river at the end of the ditch.
TNC signed a “diversion reduction agreement” with the ditch company, stating that TNC will cover the costs of the ditch improvements if the irrigators reduce their diversions by an agreed-upon amount. The agreement even included bonuses if the irrigators reduce diversions beyond the target. Overall, the project returns water to the river for less than $10 per acre-foot (Postel, 2013b). It appears that the water left in the river might be subject to use by another diverter, possibly located upstream, but for now it remains in the river.
16.2 The 1980 Groundwater Management Act
16.2.1 Original Irrigation Efficiency Goals
Under a serious threat from the federal government to cut off funding for the Central Arizona Project unless statewide groundwater management was enacted into law, in 1980 Arizona passed its landmark Groundwater Management Act with the intention of bringing groundwater pumping into ”safe yield” by 2025 (Connall Jr., 1982). The legislation was and probably still is the most far reaching groundwater legislation in the U.S. (Megdal, 2012). The act created four Active Management Areas, one of which was later split into two areas. At the time, Arizona was experiencing severe groundwater overdrafts of up to 100 meters and also in some cases 6 meters of land subsidence (Tillman & Leake, 2010). The act dealt with all groundwater uses including municipal, mining, and agricultural use. Under the act, each Active Management Area creates and enforces new plans to achieve the goals of the act every 10 years.
Expansion of irrigated agriculture was prohibited. Henceforth, irrigation would only be allowed on farms that had been producing for the five years prior to the enactment of the act, and those farms would be assigned Irrigation Grandfathered Rights (IGFRs) based on that historical production record (Maguire, 2007). A mandatory conservation program was established with initial water allotments based on the maximum historical annual groundwater use during the five-year base period. The key conservation part of the act was to require increasing irrigation efficiency through time, thus slowly reducing farming water allotments. Initial irrigation efficiency values were 50 percent to 70 percent and were projected to reach 85 percent by 2010. These efficiency goals were manifested under a per acre “duty of water” set by the Director of the Arizona Department of Water Resources. The act established a system of annual credits and debits for farms based on use relative to the IGFR historical allotment, thus allowing farmers flexibility to store unused water and temporarily overdraw if necessary.
For a number of reasons, the agricultural conservation program has been only marginally effective (Jacobs & Holway, 2004). It allocated too much water per farm, with farmers by 2000 accruing large credits that were either partially transferable or usable in future years (Maguire, 2007). As of 2001, it

31
appeared that both the Tucson and Phoenix AMAs would not hit their safe yield goals by 2025 (GWMC, 2001). A 2008 review of the Management Plans concluded that the effectiveness of the conservation plans could not be determined from the data available in the plans (Megdal, Smith, & Lien, 2008). This review indicated that water use data reported annually in a consistent format for all sectors was a prerequisite for future management efforts.
16.2.2 2002 Best Management Practices Amendments
By the early 2000s, there were several concerns and problems with the existing conservation program. Reporting requirements were complex. In order to pass the act, several carve-outs were made for existing users. By 2000, so many credits (~15 maf) had been established that the conservation program was viewed as ineffective (Maguire, 2007). In addition, some farmers thought their IGFRs were unfairly low; for example, fallowed lands in the historical base period were not counted. In response, in 2002, the Arizona Legislature passed a significant modification to the act that established an alternative conservation program, the Best Management Practices (BMP) Program, and it also reduced the Irrigation Efficiency goal to 80 percent from 85 percent for the next management period. The BMP program was initially a temporary program and was later made permanent.
The voluntary BMP program established many conservation practices under 4 different categories: Agronomic Management, Water Conveyance Systems, Farm Irrigation Systems, and Irrigation Water Management (Table 1). Each category has numerous practices with points assigned to each subcategory ranging from 1 to 3 points. Farmers need a total of 10 points to enroll, with a minimum of 1 point and a maximum of 3 points from each category. Farmers who enrolled in the program were freed from the allotment restrictions of their historical IGFR allotment, but in exchange they had to give up any accrued credits.
Only 6 percent of eligible lands were enrolled in the program and 70 percent of the enrollees had to make no changes to quality for the program. Farmers joining indicated that they wanted lower transaction costs and future water use flexibility by escaping their IGFRs. The BMP Program has also afforded some farmers the opportunity to increase their water use if they can demonstrate higher efficiency. Farmers can also increase their consumptive use substantially if they change their cropping patterns or shift to a crop like alfalfa.

32
Table 1: Arizona Best Management Practices (BMP). Source: Arizona Department of Water Resources.
Category Practice Points Notes Water Conveyance System
Improvements Max 3 Points
1.2 Concrete-lined ditch 1.0 to 3.0 % of total acreage determines points
1.2 Pipelines 1.0 to 3.0 50-54% = 1, increases by
.2 every 4% 1.3 Drain back System 1.0 to 3.0
Farm Irrigation Systems Min 2 Points, Max 3
Points
2.1 Slope Systems without uniform grades with tailwater reuse 1
2.2 Uniform slope systems without tailwater reuse 1 2.3 Uniform slope systems with tailwater reuse 2
2.4 Uniform slope that captures and redistributes return flows 2
2.5 Modified Slope Systems 2 2.6 High Pressure sprinkler systems 2 2.7 Near level systems 2.5 2.8 Level systems 3 2.9 Low Pressure Sprinkler systems 3 2.10 Trickle irrigation systems 3
Irrigation Water Management Max 3 Points
3.1 Laser touch-up 1 3.2 Alternate row irrigation 1 3.3 Furrow checks 1 3.4 Angled rows/contour farming 1 3.5 Surge irrigation 1 3.6 Temporary sprinklers 1
3.7 Participation in education irrigation water management program 1
3.8 Participant in consultant or district sponsored irrigation scheduling service 1
3.9 Increase Flexibility of water deliveries 1 3.10 Measure flow rates to determine amount applied 1 3.11 Soil moisture monitoring 1 3.12 Computerized irrigation scheduling 1 3.13 New, substitute practice 1
Agronomic Management Max 3 Points 4.1 Crop Rotation 1 4.2 Crop Residue Management 1 4.3 Soil and Water Quality Testing 1 4.4 Pre-irrigation surface conditioning 1 4.5 Transplants 1 4.6 Mulching 1 4.7 Shaping furrow or bed 1 4.8 Planting in Bottom of Furrow 1 4.9 New, substitute practice 1

33
16.2.3 Analysis
The results on actual water conservation with the BMP Program are inconclusive. (Bautista & Waller, 2010a; Bilby & Wilson, 2013). However, one study found that farms participating in the new BMP Program have water use that consistently exceeds their base program allotment from the IGFRs. (Bautista & Waller, 2010b).
University of Arizona economists conducted several interviews to determine if the Arizona Groundwater Management Act (GMA) incentivized growers to conserve water. In interviews with irrigation district managers, Arizona Department of Water Resources (ADWR) staff members, water experts, and growers, interviewees indicated that the while farmers did make efficiency improvements in the 1970s and 1980s such as ditch lining, laser leveling, and improved management, most of these improvements were not caused by the GMA. In addition, the interviewees indicated that the act did not establish an effective water constraint for many reasons. Acreage was set too high in many cases, ADWR set a high (5.05) acre-feet/acre water duty, and land set aside for USDA commodity programs received a water allowance thus providing windfall credit water. Thus, the authors found that the GMA did not create incentives for on-farm water conservation and practices, contrary to its intent (Wilson & Needham, 2006). The study indicates water use in the agricultural sector has remained constant from 1980 to 2000, and any variability in water use during this time was due to changes in crop prices and rainfall, not conservation. Some farmers use the same amount of water today that they did in 1980, even though their irrigation efficiency has increased substantially (Costa, 2014).
16.3 Wellton-Mohawk Irrigation and Drainage District
Upstream of Yuma, Arizona on the Gila River, the Wellton-Mohawk Irrigation and Drainage District (WMIDD) sits east on an elevated plateau, slightly higher than the rest of the area. Water is conveyed to the district up the Gila River valley by a large canal from Imperial Dam with three lift stations, irrigating 59,000 acres of alfalfa, cotton, wheat, lettuce, and citrus as part of Reclamation’s Gila Project authorized in 1937 and 1947. The overall project water use efficiency is higher than most places in the U.S. A fully lined concrete canal system and on-farm irrigation improvements contributed to the district efficiency exceeding 60 percent in the early 1990s (Palmer, Clemmens, Dedrick, Replogle, & Clyma, 1991). A more recent analysis of WMIDD indicates that efficiency district-wide has increased and is closer to 75 percent (Noble, 2015).
Many of the efficiency measures in WMIDD were in response to a series of salinity issues in the district (Blackman Jr, Rouse, Schillinger, & Shafer Jr, 1973; Getches, 1993). Before the Colorado River water was available, farmers used and reused water pumped from wells, and the return flows seeped back into the groundwater, making it even more saline. The WMIDD portion of the Gila Project was substantially completed by 1952 and brought in less saline Colorado River water, some of which could be used for leaching. However, the land was over a closed groundwater basin and the salty groundwater rose into the root zone of the crops since it had nowhere to infiltrate horizontally. In response, the district constructed the Main Outlet Drain (MOD) to a location on the Gila just below the district. This drain contained water more than 6,000 ppm of total dissolved solids, and this pushed the salinity in the Colorado River main stem river to 1,500 ppm.

34
The saline water led to complaints from Mexico in November of 196115. After a series of short-term measures, in 1965, Minute 218 was signed, providing for an extension to the MOD canal (the “MODE”) to deliver water to just below Morelos Dam, the main Mexican diversion point. In 1973, Minute 242 was signed, effectively imposing a requirement on the U.S. to deliver water only slightly more saline that that used in the Yuma area. In 1974, Congress passed the federal Salinity Control Act to assist with solving the Colorado River salinity problem. The Yuma Desalting Plant was constructed in 1992 to process WMIDD’s saline return flows. The plant only operated for a short period of time before a Gila River flood knocked out the headgate. There was also significant buying and retiring of high water use land in WMIDD to reduce saline return flows (wmidd.org, n.d.). The Mexicans, using U.S. funds from the 1974 act, built a 50+ mile extension to the MODE envisioned by Minute 242, the “Bypass Drain”, to what is now the Cienega de Santa Clara.
From 1975 to 1986, the Wellton-Mohawk One-Farm Irrigation Improvement Program was carried out to reduce saline return flows from the district. Besides the retirement of 10,000 acres of citrus on sandy and highly saline soils, there were significant on-farm improvements throughout the district. The Soil Conservation Service assisted farmers to plan, apply, and evaluate efficacy measures like irrigation scheduling, laser-leveling of fields, and lining ditches (Bathurst, 1988; wmidd.org, n.d.).
The improvements cost about $29 million, around $600 per acre. After the improvements, water was applied faster and more uniformly. There was less need for irrigation labor, yields increased, the amount of irrigation water used was reduced, and there was less deep percolation and runoff. The average water applied per acre decreased after the program (Bathurst, 1988).
Comparing the water use of the major crops in WMIDD before and after the improvements, there was an increase in crop consumptive use per acre. Diversion rates and return flow volumes were both reduced. The overall district consumptive use declined because of the reduction of 10,000 acres of irrigated cropland. The return flows from WMIDD are still too salty to be useful for downstream agriculture and are routed into the Cienega de Santa Clara not far from the Sea of Cortez. The U.S. thus does not receive credit under its Mexico delivery obligation for these flows (A. J. Clemmens et al., 2008).
17 California Cases
The following cases involve efficiency projects undertaken in the Imperial Irrigation District on behalf of both the MWD and SDCWA, and to a lesser extent, CVWD over the past nearly thirty years. IID is the largest diverter in the nation, with Colorado River water rights of approximately 3 maf/year. With its very large water supply, it has always been seen as a potential source of water for growing California municipal Colorado River users.
The initial MWD-IID efficiency agreement was made in 1988 when IID had outdated infrastructure from the early 1900s. The agreement was at least partially facilitated by a 1984 California State Water Resources Control Board (SWRCB) ruling that IID was wasting water in the form of large return flows into the Salton Sea. Although the SWRCB acknowledged that inefficient irrigation systems can contribute positively to groundwater recharge and enhance fish and wildlife resources, it considered the amount
15 The town of Yuma also had to move its drinking water intake from the Colorado River to one of the canals carrying water from Imperial Dam.

35
flowing into the sea to be waste. The ruling stemmed from a complaint brought by an IID landowner, John Elmore, whose land was slowly being inundated by the rising sea. The board ordered IID to take actions to improve its water conservation program (SWRCB, 1984).
Because of explosive growth in Los Angeles and San Diego over the last 30 years, IID has been an important potential source of water. Several efficiency-oriented transactions have occurred with MWD and SDCWA. At least some of these efforts to promote efficiency have reduced flows into the Salton Sea. These efficiency transactions have thus created another set of environmental and public health problems, also discussed below.
17.1 1988 Imperial Irrigation District – MWD Municipal Transfer
On the heels of the 1984 SWRCB ruling, in 1988, the IID and MWD came to a 35-year agreement to transfer approximately 100 kaf/year from IID to MWD (“Agreement for the Implementation of a Water Conservation Program and Use of Conserved Water,” 1988; Haddad, 1999). The 1988 agreement foresaw the need for California to ultimately live within its agreed 4.4 maf/year limitation once the Central Arizona Project became fully operational in the early 1990s. The agreement acknowledged that MWD would need to cut back from the 1.2 maf/year it had been taking from the Colorado River via its Colorado River Aqueduct to the 550 kaf/year that it would be allowed under a 4.4 maf/year limitation. IID agreed to take conservation measures to free up a targeted 100 kaf/year for MWD’s use with the entire effort to be financed by MWD.
IID agreed to pursue structural and non-structural measures including canal lining, operational reservoir and interceptor construction, gate installation and automation, and monitoring and management measures. The agreement set forth 24 separate projects. A Program Coordinating Committee consisting of three members, one appointed by each party and a third mutually agreed to by the original two members, was created to oversee the agreement. The committee was designed to coordinate, exchange information, and review and approve actions. IID agreed to construct all projects of the program within 5 years of the date of the agreement. MWD agreed to pay all capital costs, a one-time payment of $23m to cover indirect costs, annual costs of the non-structural components of the program, operation, maintenance, and replacement costs of the structural components during the term of the program. The 1988 agreement set the term at 35 years after the date of the final construction, which occurred in 1997, five years after the anticipated completion date. Prior to the 2003 amendments, which extended the program, the agreement would thus have ended in 2028.
The conserved water is taken by MWD at its upstream Lake Havasu pumping plant for the Colorado River Aqueduct and a commensurate reduction in deliveries are made to IID. Because PVID and CVWD sit between IID and MWD in California’s priority system, a “forbearance agreement” in which the intervening parties agreed to not call for the conserved water was needed. This additional agreement was signed in 1989, a year after the original agreement (IID, MWD, PVID, & CVWD, 1989; MWD & CVWD, 1989). That agreement also modified two of the original anticipated construction projects.
The 1988 agreement was amended in 2003 as part of the QSA documents, and again in 2007 and 2014. The 2003 amendments, among other changes, extended the agreement to December 31, 2041 the date for the termination of the Quantification Settlement Agreement. The 2007 amendments created a temporary Measurement Committee to advise IID on devices and techniques to measure the water

36
savings under the program. The 2014 agreement adjusted some efficiency projects and 107,820 af of savings in 2015 and 105,000 af/yr in the following years.
In 2000, IID released a lengthy report detailing all the construction efforts undertaken in accordance with the agreement. By 1999, these projects conserved over 100,000 acre feet per year (IID, 2000, 2015b). Under the agreement, five small operational reservoirs were constructed saving 7,000 af/year, 270 miles of laterals were lined saving 26,000 af/year, 34 lateral interceptors were built saving 30,000 af/year, 12-hour deliveries saved 30,000 af/year, and system automation saved 12,000 af/year for a total annual savings of 105,000 af. In 2015, MWD paid $11.7m to IID for costs associated with this effort.
17.2 1998 Imperial Irrigation District – SDCWA Transfer
From 1992-94 California experienced a severe drought and MWD imposed substantial water cutbacks on its participating members. After enduring these impacts, The San Diego Country Water Authority (SDCWA) decided to pursue its own more secure Colorado River supplies to avoid future cutbacks and thus began negotiations with IID. In 1998, IID and SDCWA signed an agreement to transfer conserved water from IID to SDCWA. The agreement set forth an annual transfer of between 130 kaf and 200 kaf to SDCWA to be delivered via MWD’s Colorado River Aqueduct, the only way to physically move the water. Initially, the conserved water was to be obtained by fallowing, but over time an on-farm efficiency program would provide 100% of the savings. SDCWA will provide $7 billion over 75 years for the needed efficiency improvements. The agreement was for a 45-year term with a potential 30-year renewal. The agreement anticipated the need for both California Environmental Quality Act (CEQA) and National Environmental Policy Act (NEPA) studies.
Multiple issues arose after the signing of the 1998 agreement, which lead to a complicated process to resolve long-standing water rights issues involving all of California’s Colorado River diverters. This process led to what is now known as the Quantification Settlement Agreement (QSA). The QSA, signed in 2003, consisted of over 40 documents dealing with the various rights of California’s Colorado River diverters. The signing was not without drama. Initially, the IID Board of Directors voted against the QSA16. To encourage reconsideration, the Department of the Interior then limited the amount of water IID could receive from the Colorado River. The IID finally agreed to the settlement, which authorized the transfer of more than 30 maf over many years to several entities.
In the QSA, SDCWA obtained a commitment from IID based on its 1998 agreement to obtain 200 kaf/year in water ramping up from approximately 20 kaf/year to the full amount in 2020. (In separate agreements, SDCWA also obtained the right to 77 kaf/year from the All-American Canal and Coachella Canal lining projects for a total amount of 277 kaf/year). From 2003 to 2018, the water savings will come from a combination of on-farm efficiency measures and fallowing. Starting in 2018, SDCWA will receive the entire 200 kaf/year from on-farm efficiency measures paid for by SDCWA through a program administered by IID.
A wide range of conservation measures are available for growers that result in reductions of water use. These measures include irrigation scheduling and event management, group deliveries, tailwater
16 The local community was alarmed that taking land out of production would negatively impact local businesses and jobs. Since every registered voter can vote for IID board members, the board was concerned with impacts to the entire community, not just farmers and landowners as is the case with the farmer-controlled PVID board.
37
recovery systems with extended delivery, pressurized irrigation, drip irrigation, sprinkler irrigation, level basin irrigation and surface irrigation optimization. Growers can also submit new measures. Participants must submit a proposal which is evaluated and then any improvements are overseen and verified for amount of water conserved and changes in deliveries. Efficiency conservation payments are made based on the amount of water conserved (IID, 2015b).
From 2003 to 2014, a total of 1,242,283 acre-feet of Colorado River water was conserved, and there have been 143,306 acre-feet of efficiency-based conservation and 125,213 acre-feet from system conservation measures. Over that same period, over $90.7 million has been paid out to farmers. A $50 million community fund was also established to mitigate negative socioeconomic effects of the transfers. (This fund dwarfs the $5m fund established for the 2004 MWD-PVID fallowing agreement, although the Imperial Valley is substantially larger in both population and area). The money has been used to compensate local businesses and organizations that are farm services providers. Funds are also distributed for job training and programs that provide economic stimulus for Imperial County (Moving Forward, 2015).
In additional to the SDCWA transfers, the environmental impact analysis for the QSA required 15 years of environmental flows to the Salton Sea, to be obtained by fallowing in the IID. These fallowing flows were to be ramped up from 5,000 af/year in 2003, peaking at 150,000 af/year in 2017, and dropping to 0 in 2018. A total of 800 kaf for the Salton Sea was to be provided.
The original agreement set forth a complicated per acre-foot water cost to be paid by SDCWA involving a base rate. In the 2007 amendment, the parties changed this computation to a simple escalating figure. In 2015 the payment was $624 per acre-foot (SDWCA, 2015). The QSA parties agreed to supply $133m to a Salton Sea mitigation fund, with the state agreeing to assume costs beyond that amount.
17.3 All-American Canal Lining Project
The All-American Canal runs 80 miles from Imperial Dam at the Colorado River, near the California-Mexico border, to Calexico, California in the Imperial Valley. The canal annually moves approximately 3 maf of water from the Colorado River for the Imperial Irrigation District (IID) and the Coachella Valley Water District (CVWD) (Stene, 1995; USBR, 2006).
Even before water delivery began in 1940, there were problems with seepage during construction, and the Bureau of Reclamation had to make modifications (i.e. intercepting drains, compacted lining, etc.) to mitigate the seepage issues (Stene, 1995). A lengthy section of the canal traverses porous sand dunes near I-5 and the U.S. – Mexico border (USBR, 2006). Leakage was so significant that it caused high groundwater along the canal, damaging nearby crops and property (Stene, 1995).
In the late 1990s, it was estimated that almost 68,000 acre-feet of water per year could be saved by reducing seepage in the middle section of the canal which flows through the dunes. Lining the canal became an important piece of the 2003 Quantification Settlement Agreement, which provided that “recovered water” be counted for municipal use. The State of California and San Diego County Water Authority covered the $300 million-dollar cost. A 23-mile section of the canal was ultimately lined to prevent seepage. Since 2009, when the project was completed, the annual water savings have been stipulated to be 67,700 acre-feet. This water is delivered to San Diego via MWD’s Colorado River Aqueduct (Moving Forward, 2015; USBR, 2006).

38
Although the lining provided new water for the US, it negatively impacted groundwater levels in Mexico. For decades, seepage from the canal provided groundwater supply for the Mexicali Valley in Mexico (A. J. Clemmens et al., 2008). In the Mexicali Valley, 67 percent of users received their total supply of irrigation water from wells (Cortez-Lara & Garcia-Acevedo, 2000). According to Calleros (1991), 60 percent of the annual recharge of the aquifer of the Mexicali Valley is due to subsurface flows. Groundwater in the valley irrigated over 33,000 acres and serviced over a hundred wells. Prior to the project, economic damages from the canal lining were assumed to be $80 million per year.
The Environmental Impact Statement commissioned by the Bureau of Reclamation noted that there would be impacts to groundwater and deterioration of groundwater quality in the northeastern Mexicali Valley. Seepage from the canal was estimated to provide 10 to 12 percent of the aquifer’s recharge. After construction, groundwater would ultimately decline to pre-canal levels. A lawsuit determined that the National Environmental Protection Act (NEPA) does not require mitigation within the territory of a foreign country (USBR, 2006) 17.
17.4 Coachella Valley Canal Lining
In the QSA, the San Diego County Water Authority obtained the rights to the conserved water from lining the Coachella Canal. The 123-mile Coachella Canal is a branch of the All-American Canal. Thirty-five miles of parallel, concrete-lined canal were constructed next to the original canal. It was projected that annual savings would be 26,000 acre-feet due to reduced seepage (SDCWA, 2015). Actual savings have been 30,850 acre feet per year (Moving Forward, 2015). The entire project cost $71 million and was funded by the San Diego County Water Authority and the State of California (CVWD, 2012).
There has also been extensive environmental mitigation. Fish were relocated from the canal system, and a sports fishery pond was constructed. Also, 17 acres of marsh were constructed, providing new habitat for wildlife. There are ongoing costs of monitoring habitats in Dos Palmas Oasis and restoring 352 acres of desert riparian habitat from the new canal construction (SDCWA, 2015).
17.5 Brock Reservoir
Brock Reservoir (formerly Drop 2 Reservoir) is an 8,400 acre-feet operational reservoir located near Drop 2 on the All-American Canal. Completed in 2010 after two years of construction, the reservoir is designed to capture at least 70,000 af/year of Colorado River flow that would otherwise be inadvertently delivered to Mexico due to rain events or other operational issues in the Imperial Irrigation District. The $172 million in funding was provided by the Southern Nevada Water Authority ($115 million), the Central Arizona Project ($28.6 million), and the Metropolitan Water District of Southern California ($28.6 million). On a pro-rata basis, these entities will receive 600,000 af of
17 Even though NEPA did not require mitigation of the effects of the project in Mexico, critics have argued that the project itself was a violation of Resolution six of Minute 242 of the International Boundaries and Water Commission. Minute 242 stipulates that Mexico and the United States must consult each other before starting any project related to groundwater that could affect the other party (Calleros, 1991; Cortez-Lara & Garcia-Acevedo, 2000).

39
Intentionally Created Surplus Credits in Lake Mead at a cost of $287/af. These credits can be taken between 2016 and 2036 at a maximum rate of 65,000 af/year. In its first 4 years of operation, IID estimates that flows to Mexico were reduced annually by an average of approximately 70,000 af/year, and the reservoir also provided an additional 50,000 af/year of conservation benefits to IID (IID, 2015c).
The reservoir was not without controversy. Environmental NGOs provided a lengthy letter (Gillon et al., n.d.) detailing perceived shortcomings in the 2007 Environmental Assessment (Reclamation, 2007). In particular, the groups were concerned about impacts to the 23-mile “Limitrophe” section of the Colorado River where the Mexico-U.S. border is defined by the river. Operation of the reservoir would curtail occasional but important environmental flows past Mexico’s Morelos Dam. These flows were said to be important for native and resident bird populations in the lowest reaches of the Colorado River, the section that is often completely dewatered. The NGOs were not against efficiency improvements in general but noted that the efficiency improvement in this case would curtail valuable and scarce environmental flows.
17.6 Salton Sea Efficiency and Transfer Impacts
The Salton Sea is a large saline sink created in the early 1900s after the early Imperial Irrigation delivery canal (known as the Alamo Canal) was completely taken over by the Colorado River during a flood. For a period of 2 years from 1905 to 1907 the entire Colorado River flowed into the Sea until heroic efforts by the Southern Pacific Railroad forced the Colorado River back into its normal channel running to the Sea of Cortez (Hundley, 2009). Initially, the Salton Sea was about 500 square miles with the surface 200 feet below sea level. Due to high evaporation in the area, by 1920 it shrank to about 260 square miles and dropped 50 feet (IID, 2016). As IID return flows increased throughout the 20th century, it slowly increased to its present size of about 350 square miles.
The Salton Sea is the largest water body in California by surface area (approximately 35 miles by 15 miles), but not by volume (Lake Tahoe is the largest), and is a shallow body, approximately 50 feet deep at its deepest locations but with many parts between 1 and 5 feet deep. The Sea sits in a bowl that is about 250 feet below sea level. Over 650,000 people live in the area surrounding the Sea. Since its inadvertent creation, it has become a key stopover on the Pacific Flyway with over 400 bird species partaking of its extensive fish and invertebrate resources. There are also permanent bird populations at the lake and several federal and state listed endangered species. The Sea is actually not new: In geologic time, the Sea would come and go as the Colorado River shifted its channel to fill the sea and then shifted again to flow to the Sea of Cortez.
By 2020, return flows will drop to 700-800 kaf/year from 1.2-1.3 maf/year in the 1980s and 1990s due to efficiencies and transfers, a 40 percent decline (IID, 2016). The surface will drop by 20 feet, and its volume will drop by 60 percent with over 100 square miles of the lake bed exposed. (Cohen, 2014). The water will get 3 times as salty (“hypersaline”) and it is already very salty. In 2010, the Salton Sea had a total dissolved solids concentration 47 percent greater than the ocean (IID, 2010). The increasingly hypersaline conditions will kill most of the fish within five to seven years which will then seriously compromise the lake’s wildlife values. These changes are expected to also decrease local property values, and as the water level declines, dust from the exposed shorelines will pose a significant health problem in the future. The area already does not meet state and federal air quality standards.

40
As part of the 2003 QSA, IID, SDCWA, and CVWD agreed to be responsible for the first $133 million in Salton Sea environmental mitigation. The State of California agreed to be responsible for the remaining funding. In 2007, the California Natural Resources Agency released a $9 billion plan to restore the Salton Sea ecosystem, but to date the California legislature has declined to allocate funding. The Pacific Institute estimates that the cost of inaction ranges from $30 to $70 billion. IID has already made some mitigation efforts on behalf of the Salton Sea by constructing some managed marsh complexes for aquatic wildlife. As part of the QSA, IID was required to provide freshwater inflow totaling 1.5 maf from 2003 to 2017 to mitigate the rising salinity and declining lake levels in the Sea (IID, 2010). IID has utilized temporary fallowing to provide these inflows (See Temporary Fallowing Chapter).
As should be evident, this is a very complex issue tying together irrigation efficiency, water conservation, water transfers to cities, human health, and environmental issues. Preventing water from flowing into a saline sink is considered a classic method to conserve water. However, in this case, as in many others, the Salton Sea is a valuable resource with significant human and wildlife benefits. Reducing inflows to the sink creates several serious problems that have yet to be dealt with.
17.7 Coachella Valley Water District Efficiency Improvements
Formed in 1918, the Coachella Valley Water District (CVWD) delivers irrigation and domestic water to over 1,000 square miles in southern California and over 300,000 residents. The district receives some supplies from local groundwater and recycled water, but most is imported from the Colorado River via the Coachella Canal, a branch of the All-American Canal finished in 1948 (CVWD, n.d.). In the Coachella Valley, temperatures exceed 100 degrees Fahrenheit more than one-hundred days a year, and the frost-free season is over 300 days. ET rates exceed 74 inches of water per year and annual precipitation is only 3 inches (NRCS, 2006).
In CVWD, there are approximately 50,000 irrigable acres,18 consisting of mainly niche crops like table grapes, citrus, dates, peppers, and lettuce (NRCS, 2006). In 2010, water supplies in the Coachella canal included both CVWD’s 330 kaf/year Colorado River right and an additional 38 kaf/year of water from several IID and MWD transfers. (One of the transfers from MWD is an interesting exchange of State Water Project (SWP) supplies. Because CVWD cannot physically receive SWP water, CVWD takes delivery of MWD’s Colorado River water via the Coachella Canal, and MWD takes a like amount of SWP water in the Los Angeles area).
From early on, a highly efficient irrigation infrastructure was established in CVWD, including a pipeline distribution system with metered deliveries. Subsurface drains almost eliminated surface runoff. There are no downstream diversions, only runoff to the Salton Sea (Christian-Smith et al., 2010). The district has funded many improvements to deal with decreasing groundwater, which was falling as early as 1915, including large aquifer recharge facilities. Despite 3.3 maf of artificial recharge since 1973, demand for groundwater exceeds natural recharge and thus there has been a significant decline in the aquifer (CVWD, 2012).
Over the last 30 years, CVWD water deliveries for agriculture have decreased, but the amount of cropped areas has increased due to double cropping. CVWD water used for irrigation per acre per crop
18 Some of these acres are double cropped, leading to acreage totals of near 70,000 acres (NRCS, 2006).

41
has also decreased and stabilized around 4 AF per acre annually. For agriculture, Coachella Valley Irrigation District provides approximately 240 kaf/yr and groundwater pumping adds another 60 kaf/yr to the local agricultural supply. A wide variety of irrigation methods are practiced throughout the valley including furrow irrigation, border strip irrigation, micro-sprinkler irrigation, drip irrigation, and sprinkler irrigation. Many producers use some form of irrigation scheduling, sometimes with site-specific data, to determine when and how much water to use on the crop (NRCS, 2006).
In 2003, the Secretary of the Interior signed the Colorado River Water Delivery Agreement with California’s Colorado River contractors as part of the Quantification Settlement Agreement. The contractors had to reduce their use of river water in certain years to pay back the use of excess water in 2001 and 2002. To pay back their water, the CVWD instituted the Extraordinary Water Conservation Program (ECP), which documented more than 75,500 acre-feet of water savings over five years at a cost of $40 per acre-foot (Christian-Smith et al., 2010). Participating farmers saved an average of about 17% compared to a historic baseline (Cohen, n.d.).
The program included irrigation scheduling, salinity management, and conversion to micro-irrigation. CVWD paid for the programs and farmers could participate for free. These conservation methods had to be in excess of the normal conservation improvements. They also enrolled some people using groundwater even though that water source was not counted for payback purposes. Irrigation scheduling involved determining the optimal timing and volumes of water to apply to each crop based on soil type, irrigation method, soil moisture, irrigation uniformity, crop cover, fertilizer application, and root depth. The salinity program enabled growers to refine their application of water for leaching, targeting areas of fields identified as high in salinity (Christian-Smith et al., 2010).
In the summer of 2015, CVWD launched a program to convert an estimated 667 acres of dates and other trees from flood irrigation to drip. The program hopes to save an estimated 2,000 af/yr. Rebates of $1,500/acre will be made available for each acre converted, approximately 75 percent of the cost of the conversion. For five years, half of the conserved water will stay in Lake Mead, and the other half will be used for groundwater replenishment in the CVWD. After 5,000 acre-feet, has been stored in Lake Mead, all additional water savings will be used to reduce aquifer overdraft. Through 2045, an estimated 60,000 af of water will be available for use in the Coachella Valley through the program (CVWD Launching Agricultural Conservation Rebates 2015).

42
18 Appendix: Selected Literature Irrigation efficiency is a confusing topic and much has been written over the years about it. The following are especially informative articles sorted by date. An Analysis of Water Salvage Issues in Colorado Colorado Water Conservation Board 1992 This paper provides a very thoughtful look at the issues of water salvage, water savings, and irrigation efficiency. It covers federal programs, legal standards, resource impacts, policy issues, and provides conclusions. It also contains copies of failed bills that attempted to modify Colorado law to address salvage and saved water. This paper was ahead of its time. Elimination of Irrigation Efficiencies Willardson, Allen and Frederiksen, 1994 This is an oft-cited paper that began the move to discuss water use in fractions rather than in efficiencies. Irrigation Performance Measures: Efficiency and Uniformity Burt 1997 The author is a professor at California Polytechnic State University and Director of the Irrigation and Research Training Center. He has been involved in multiple efficiency improvements efforts in the West, including the Grand Valley Water Users improvements. This lengthy and very detailed article covers many of the technical details surrounding efficiency improvements. The paper has a nice 11-point summary that is useful for the reader with less time and energy. Irrigation Water Balance Fundamentals Burt, 1999 This relatively short and mostly simple article provides some fundamental considerations on how to construct a water balance for an irrigation system. Beyond Irrigation Efficiency Jensen 2007 Jensen was a USDA Agricultural Research Service scientist. This paper provides a history of the publications on irrigation efficiency and contains a good section on terminology. Efficient Irrigation, Inefficient Communication: Flawed Recommendations Perry 2007 This Netherlands based researcher provides a history of the discussion around irrigation efficiency terminology. He proposes a fraction based terminology to improve water management. Memorandum, South Platte Task Force Castle and Caile, 2007 Castle and Caile provide a short, informative summary of a famous Colorado Supreme Court Case on Salvage Water.

43
Agricultural Water Conservation and Efficiency in California – A Commentary Burt, Canessa, Schwankl, Zoldoske, 2008 This is a spirited critique of “More with Less: Agricultural Water Conservation and Efficiency in California” by Cooley et al., 2008. Water Conservation in Irrigation Can Increase Water Use Ward and Pulido-Velazquez, 2008 The authors are academics in the U.S. and Spain. This paper is another oft-cited source of information on how efficiency improvements can lead to increased consumption. Conservation Potential of Agricultural Water Conservation Subsidies Huffaker, 2008 The author is an economist who has written multiple papers on the irrigation efficiencies. He shows how conservation subsidies for improved efficiencies can lead to increased water use. While the middle part of the part involves many equations, the text portions provide ample material for thought. Methods and Technologies to Improve Efficiency of Water Use Evans and Sadler (2008) This paper provides a through and readable overview of most topics normally covered under efficiency. The two authors are USDA Agricultural Research Service employees, one from Montana and one from Missouri. It provides a balanced view of the topic covering both pros and cons of the various techniques to save and conserve water. Accounting for Water Use: Terminology and Implications for Saving Water and Increasing Productivity Perry, 2010 Chris Perry is the co-editor in chief of a key journal in the field, Agricultural Water Management. In this short piece, he summarizes the attempt to redefine water use terminology in “fractions” terminology. Water-Use Efficiency and Productivity: Rethinking the Basin Approach Gleick, Christian-Smith and Cooley, 2011 Peter Gleick and co-authors provided a spirited defense of the need to pursue irrigation efficiency, even if no consumptive use is saved. Agricultural Water Use in California: A 2011 Update, Center for Irrigation Technology California State University, Fresno This is a through and lengthy review of how agriculture uses water in California and what opportunities exist for improved operations. Fictions, Fractions, Factorials and Fractures: on the Framing of Irrigation Efficiency Lankford 2012 This UK researcher provides a complex look at the issues surrounding the use of” irrigation efficiency,” especially how it can be misused.

44
Water Conservation in Irrigation Agriculture: Trends and Challenges in the Face of Emerging Demands Schaible and Aillery, 2012 This is a key USDA Economic Research Service summary of water use by agriculture. It contains an excellent section on irrigation efficiency.

45
19 Bibliography Agreement for the Implementation of a Water Conservation Program and Use of Conserved Water. (1988). Retrieved from http://www.iid.com/home/showdocument?id=10187 Allen, R. G., & Brockway, C. E. (1983). Operation and Maintenance Costs and Water Use by Idaho Irrigation Projects. In Proceedings of the Specialty Conference on Advances in Irrigation and Drainage. Jackson, Wyoming. Allen, R. G., Clemmens, A. J., & Willardson, L. S. (2005). Agro-Hydrology and Irrigation Efficiency -White paper submitted to the ICID Working Group on Sustainable Crops and Water Use (2005). ASCE. Allen, R. G., & Willardson, L. S. (1997). Water Use Definitions for Defining Hydrologic Impacts of Water Conservation. In Proceedings of ICID Workshop on Sustainable Irrigation in Areas of Water Scarcity and Drought (pp. 72–82). New Delhi: International Committee on Irrigation and Drainage. Retrieved from http://extension.uidaho.edu/kimberly/files/2014/06/Allen_Willardson_1997_ICID_Pro _Oxford__Water_use_def.pdf Bagley, J. M. (1965). Effects of Competition on Efficiency of Water Use. Journal of Irrigation and Drainage Division, American Society of Civil Engineers, 91(1), 69–77. Bathurst, V. M. (1988). Wellton-Mohawk On-Farm Irrigation Improvement Program: Post Evaluation Report. USDA. Bautista, E., & Waller, P. (2010a). Evaluation of the Best Management Practices Agricultural Water Conservation Program (Final Report). Arizona Department of Water Resources. Bautista, E., & Waller, P. (2010b). Evaluation of the Best Management Practices Agricultural Water Conservation Program (Final Report). Arizona Department of Water Resources. Bickell, L. (1999). Colorado River Basin Salinity Control Project. Bureau of Reclamation. Bilby, D. B., & Wilson, P. N. (2013). Regulatory Capture? Arizona’s BMP Water Conservation Program. Western Economics Forum, 12, 29–37. Blackman Jr, W. C., Rouse, J. V., Schillinger, G. R., & Shafer Jr, W. H. (1973). Mineral Pollution in the Colorado River Basin. Journal (Water Pollution Control Federation), 1517–1557. Blevins, S. (2015, November 19). Valuing the Non-Agricultural Benefits of Flood Irrigation in the Upper Green River Basin. University of Wyoming.
46
Blum, A. (2009). Effective Use of Water (EUW) and Not Water-Use Efficiency (WUE) is the Target of Crop Yield Improvement Under Drought Stress. Field Crops Research, 112, 119–123. Blumm, M. C., & Schwartz, T. (1995). Mono Lake and the Evolving Public Trust in Western Water. Ariz. L. Rev., 37, 701. Buchleiter, G. W., Heermann, D. F., & Wenstrom, R. J. (1996). Economic Analysis of On-Farm Irrigation Scheduling. In Evapotranspiration and Irrigation Scheduling (pp. 986–991). San Antonio, Texas: American Society of Agricultural Engineers. Burt, C., Canessa, P., Schwankl, L., & Zoldoske, D. (2008, October). Agricultural Water Conservation and Efficiency in California - A Commentary. Burt, C. M. (1999a). Agricultural Water Management. In Agricultural Water Management. San Luis Obispo, CA: ITRC. Burt, C. M. (1999b). Irrigation Water Balance Fundamentals. In Agricultural Water Management. San Luis Obispo, CA: ITRC. Burt, C. M. (2003). Government Highline Canal – A Win-Win Solution. Irrigation Training and Research Center. Cai, X., Rosegrant, M. W., & Ringler, C. (2003). Physical and Economic Efficiency of Water Use in the River Basin: Implications for Efficient Water Management. Water Resources Research, 39(1). Calleros, J. R. (1991). The Impact on Mexico of the Lining of the All-American Canal. Natural Resources Journal, 31(Fall). Carpenter, L. G. (1896). Seepage or Return Waters from Irrigation. Carroll, S. (2006, June 8). Bureau of Reclamation News Release: Sprinklers Benefit Rural Community and the Colorado River. Bureau of Reclamation. Retrieved from http://www.usbr.gov/newsroom/newsrelease/detail.cfm?RecordID=12301 Casey, T. B. N. (2016, July 7). Climate Change Claims a Lake, and an Identity. The New York Times. Retrieved from http://www.nytimes.com/interactive/2016/07/07/world/americas/bolivia-climate change-lake-poopo.html Castle, A., & Caile, B. (2007). Salvaged Water Report to South Platte Task Force. Holland and Hart.

47
CAWA. (2008). Meeting Colorado’s Future Water Supply Needs Opportunities and Challenges Associated with Potential Agricultural Water Conservation Measures. Colorado Agricultural Water Alliance. Christian-Smith, J., Allen, L., Cohen, M. J., Schulte, P., Smith, C., & Gleick, P. H. (2010). California Farm Water Success Stories. Pacific Institute. CIT. (2011). Agricultural Water Use in California: A 2011 Update. Center for Irrigation Technology. Clemmens, A. J., & Allen, R. G. (2005). Impact of Agricultural Water Conservation on Water Availability. Presented at the World Water and Environmental Resources Congress 2005, Anchorage, Alaska: ASCE. Clemmens, A. J., Allen, R. G., & Burt, C. M. (2008). Technical Concepts Related to Conservation of Irrigation and Rainwater in Agricultural Systems: Agricultural Irrigation Water Conservation. Water Resources Research, 44(7), n/a-n/a. https://doi.org/10.1029/2007WR006095 Cohen, M. J. (2014). Hazard’s Toll: the Costs of Inaction at the Salton Sea. Pacific Institute for Studies in Development, Environment and Security. Retrieved from http://bibpurl.oclc.org/web/74566 http://pacinst.org/publication/hazards-toll/ Cohen, M. J. (n.d.). Communication, Monitoring, and Measurement: Water Efficiency in the Coachella Valley. Pacific Institute. Connall Jr, D. D. (1982). History of the Arizona Groundwater Management Act, A. Ariz. St. LJ, 313. Contor, B. A., & Taylor, R. G. (2013). Why Improving Irrigation Efficiency Increases Total Volume of Consumptive Use: Irrigation Efficiency Increases Consumptive Use. Irrigation and Drainage, 62(3), 273–280. https://doi.org/10.1002/ird.1717 Cortez-Lara, A., & Garcia-Acevedo, M. R. (2000). The Lining of the All-American Canal: The Forgotten Voices. Natural Resources Journal, 40 (Spring), 261–279. CVWD. (2012). Coachella Valley Water Management Plan Update: Final Report. Coachella Valley Water District. CVWD. (n.d.). 2015-2016 Annual Review. Retrieved from http://www.cvwd.org/ArchiveCenter/ViewFile/Item/520

48
CVWD Launching Agricultural Conservation Rebates. (2015, Summer). Farm and Water Watch. Retrieved from http://www.cvwd.org/ArchiveCenter/ViewFile/Item/439 CWCB. (1992). An Analysis of Water Salvage Issues in Colorado. Colorado Water Conservation Board. Denison, C. (2015). No Chico Brush Promoting Sustainable Water Use in the Gunnison Basin. Trout Unlimited. Denison, C., & Harold, J. (2015, November 12). Trout Unlimited: Learn more about the “No Chico Brush” Program with Brian Allmer. Retrieved from https://brianallmerradionetwork.wordpress.com/2015/11/12/11-12-15-trout unlimited-learning-more-about-the-no-chico-brush-program/ Dockter, D. T. (1996). AgriMet – the Pacific Northwest Cooperative Agricultural Weather Station Network. In Evapotranspiration and irrigation scheduling (pp. 870–873). San Antonio, Texas: American Society of Agricultural Engineers. Ellis, J. R., Lacewell, R. D., & Reneau, D. R. (1985a). Estimated Economic Impact From Adoption of Water-Related Agricultural Technology. Western Journal of Agricultural Economics, 10(2), 307–321. Ellis, J. R., Lacewell, R. D., & Reneau, D. R. (1985b). Estimated Economic Impact From Adoption of Water-Related Agricultural Technology. Western Journal of Agricultural Economics, 10(2), 307–321. Evans, R. G., & Sadler, E. J. (2008a). Methods and Technologies to Improve Efficiency of Water Use. Water Resources Research, 44(7). French, R. J., & Schultz, J. E. (1984). Water Use Efficiency of Wheat in a Mediterranean-Type Environment: The Relation Between Yield, Water Use and Climate. Crop and Pasture Science, 35(6), 743–764. Getches, D. H. (1987). Water Use Efficiency: The Value of Water in the West. Pub. Land L. Rev., 8, 1. Getches, D. H. (1993). From Ashkabad, To Wellton-Mohawk, to Los Angeles: The Drought in Water Policy. University of Colorado Law Review, 64, 523–553. Gillon, K., Harrington, M., Weisheit, J., Vogesser, G., Cohen, M., Hyde, P., … Meister, C. (n.d.). Environmental Assessment for the Lower Colorado River Drop 2 Storage Reservoir Project. Retrieved from http://pacinst.org/app/uploads/2013/02/drop_2_comments3.pdf
49
Gleick, P. H., Christian-Smith, J., & Cooley, H. (2011a). Water-Use Efficiency and Productivity: Rethinking the Basin Approach. Water International, 36(7), 784–798. https://doi.org/10.1080/02508060.2011.631873 Gleick, P. H., Christian-Smith, J., & Cooley, H. (2011b). Water-Use Efficiency and Productivity: Rethinking the Basin Approach. Water International, 36(7), 784–798. https://doi.org/10.1080/02508060.2011.631873 GWMC. (2001). Governor’s Water Management Commission: Final Report. Retrieved from http://azmemory.azlibrary.gov/cdm/ref/collection/statepubs/id/2941 Haddad, B. M. (1999). Rivers of Gold: Designing Markets To Allocate Water In California (1st
trade pbk edition). Washington, D.C: Island Press. Harold, J. (2014, May 1). To the Honorable Tom Vilsack, Secretary of the U.S. Department of Agriculture, from John Harold, Chairman, NoChicoBrush. Hartman, L. M., & Seastone, D. (1970). Water Tranfers Economic Efficiency and Alternative Institutions. Baltimore and London: The Johns Hopkins Press. Hartman, L. M., & Seastone, D. A. (1965). Efficiency Criteria for Market Transfers of Water. Water Resources Research, 1(2), 165–171. Hinojosa-Huerta, O., Nagler, P. L., Carrillo-Guerrero, Y., & Zamora-Hernández, E. (2002). Andrade Mesa Wetlands of the All-American Canal. Natural Resources Journal 42, 899. Huffaker, R. (2008). Conservation Potential of Agricultural Water Conservation Subsidies: Agricultural Water Conservation Subsidies. Water Resources Research, 44(7), n/a-n/a. https://doi.org/10.1029/2007WR006183 Hundley, N. (2009). Water and the West: The Colorado River Compact and the Politics of Water in the American West (Second Edition edition). Berkeley: University of California Press. Hutchinson, J. (2015, March 22). Verde Valley Irrigation Ditches Represent the Old and New of Water Flow Technology - The Verde Independent. Retrieved January 13, 2016, from http://verdenews.com/main.asp?SectionID=1&SubSectionID=1&ArticleID=65008 IID. (2000). Imperial Irrigation District and Metropolitan Water District of Southern California Water Conservation Program (Final Program Construction Report). Imperial Irrigation District. Retrieved from http://www.iid.com/water/water-conservation/iid-mwd conservation IID. (2010). 2010 Annual Water Report. Imperial Irrigaiton District.

50
IID. (2015a). On-Farm Efficiency Conservation Program (Program Description). Imperial Irrigation District. Retrieved from http://www.iid.com/water/water-conservation/on farm-efficiency IID. (2015b). On-Farm Efficiency Conservation Program (Program Description). Imperial Irrigation District. Retrieved from http://www.iid.com/water/water-conservation/on farm-efficiency IID. (2015c, March). Brock Reservoir Summary Report. Retrieved from http://www.iid.com/home/showdocument?id=9615 IID. (2016). Salton Sea. Retrieved August 7, 2016, from http://www.iid.com/water/water transportation-system/salton-sea IID, MWD, PVID, & CVWD. (1989, December 19). Approval Agreement. INTERA. (2013). Remote-Sensing-Based Comparison of Water Consumption by Drip-Irrigated versus Flood-Irrigated Fields: Deming, New Mexico. INTERA Geosciences & Engineering. Interagency Task Force. (1979). Irrigation Water Use and Management; An Interagency Task Force Report. U.S. Department of the Interior, U.S. Departnment of Agriculture, and Environmental Protection Agency. ITRC. (2007, December). Water Resources Conservation Plan for Orchard Mesa Irrigation District. Irrigation Training and Research Center, California Polytechnic State University, San Luis, Obispo, CA. ITRC. (2012, October). Water Resources Conservation Plan for Orchard Mesa Irrigation District. Irrigation Training and Research Center, California Polytechnic State University, San Luis, Obispo, CA. Jacobs, K. L., & Holway, J. M. (2004). Managing for Sustainability in an Arid Climate: Lessons Learned from 20 years of Groundwater Management in Arizona, USA. Hydrogeology Journal, 12(1), 52–65. https://doi.org/10.1007/s10040-003-0308-y Jensen, M. E. (1967). Evaluating Irrigation Efficiency. Journal of Irrigation and Drainage Division, American Society of Civil Engineers, 93, 83–98. Jensen, M. E. (2007). Beyond Irrigation Efficiency. Irrigation Science, 25(3), 233–245.

51
Johnson, G. S., Sullivan, W. H., Cosgrove, D. M., & Schmidt, R. D. (1999). Recharge fo the Snake River Plain Aquifer: Transitioning form Incidental to Managed. Journal of American Water Resources Association, 35(1), 123–131. Kendy, E., Molden, D., Steenhuis, T. S., Liu, C., & Wang, J. (2003). Policies Drain the North China Plain Agricultural Policy and Groundwater Depletion in Luancheng County, 1949-2000. International Water Management Institute. Khalsa, R. D., Styles, S. W., Burt, C. M., & Norman, B. (2002). Case Study: Installation of Canal Control Structures on the Government Highline Canal. In Conference on Benchmarking Irrigation System Performance Using Water Measurement and Water Balances, San Luis Obispo, CA. Retrieved from https://works.bepress.com/sstyles/12/ Lankford, B. (2012). Fictions, Fractions, Factorials and Fractures: on the Framing of Irrigation Efficiency. Agricultural Water Management, 108, 27–38. https://doi.org/10.1016/j.agwat.2011.08.010 MacDonnell, L. J. (1999a). From Reclamation to Sustainability: Water, Agriculture, and the Environment in the American West (1 edition). Niwot: University Press of Colorado. MacDonnell, L. J. (1999b). From Reclamation to Sustainability: Water, Agriculture, and the Environment in the American West (1 edition). Niwot: University Press of Colorado. MacDonnell, L. J. (2011a). Montana v. Wyoming: Sprinklers, Irrigation Water Use Efficiency and the Doctrine of Recapture. Golden Gate University Environmental Law Journal, 5, 265 295. MacDonnell, L. J. (2011b). Montana v. Wyoming: Sprinklers, Irrigation Water Use Efficiency and the Doctrine of Recapture. Golden Gate University Environmental Law Journal, 5, 265 295. Maguire, R. P. (2007). Patching the Holes in the Bucket: Safe Yield and the Future of Water Management in Arizona. Arizona Law Review, 49, 361. Martinez, G. F., Jordan, D., Whittaker, A. T. H., & Allen, R. (2013). Remote-Sensing-Based Evaluation of Relative Consumptive Use Between Flood- and Drip-Irrigated Fields. Megdal. (2012). Arizona Groundwater Management. The Water Report, (104). Retrieved from http://www.cwi.colostate.edu/southplatte/files/twr_azgroundwatermanagement.pdf Megdal, S., Smith, A. A., & Lien, A. (2008). Evolution and Evaluation of the Active Management Area Management Plans. Water Resources Research Center, University of Arizona. Retrieved from http://wsp.arizona.edu/sites/wsp.arizona.edu/files/AWI729megdal.pdf

52
Micklin, P. (2007). The Aral sea disaster. Annual Review of Earth Planetary Sciences, 35, 47–72. Molden, D., Oweis, T., Steduto, P., Bindraban, P., Hanjra, M. A., & Kijne, J. (2010). Improving Agricultural Water Productivity: Between Optimism and Caution. Agricultural Water Management, 97(4), 528–535. https://doi.org/10.1016/j.agwat.2009.03.023 Moving Forward. (2015). Colorado River Basin Stakeholders Moving Forward to Address Challenges Identified in the Colorado River Basin Water Supply and Demand Study. U.S. Department of the Interior, Bureau of Reclamation, Technical Services Center, Denver, Colorado. MWD, & CVWD. (1989, December 19). Agreement to Supplement Approval Agreement. Nagourney, A. (2015, January 20). Century Later, the “Chinatown” Water Feud Ebbs. The New York Times. Retrieved from http://www.nytimes.com/2015/01/21/us/a-century-on-the chinatown-water-feud-ebbs.html Noble, W. (2015). A Case Study in Efficiency - Agriculture and Water Use in the Yuma, Arizona Area. Yuma County Agriculture Water Coalition. Retrieved from www.agwaterhuma.com NRCS. (2006). A Review of Agricultural Water Use in the Coachella Valley. NRCS. Owen-Joyce, S. J., & Raymond, L. H. (1996). An Accounting System for Water and Consumptive Use Along the Colorado River, Hoover Dam to Mexico. United States Geological Survey. Palmer, J. D., Clemmens, A. J., Dedrick, A. R., Replogle, J. A., & Clyma, W. (1991). Delivery System Performance Case Study: Wellton-Mohawk Irrigation and Drainage District, USA. Irrigation and Drainage Systems, 5(1), 89–109. Parshall, R. (1922). Return of Seepage Water to the Lower South Platte River in Colorado. Perry, C. (2011). Accounting for Water Use: Terminology and Implications for Saving Water and Increasing Production. Agricultural Water Management, 98(12), 1840–1846. https://doi.org/10.1016/j.agwat.2010.10.002 Perry, C. J. (1999). The IWMI Water Resources Paradigm – Definitions and Implications. Agricultural Water Management, 40(1), 45–50. https://doi.org/10.1016/S0378 3774(98)00102-4 Pfeifer, L., & Lin, C. (2010). Does Efficient Irrigation Technology Lead to Reduced Groundwater Extraction?: Empirical Evidence. Agricultural and Applied Economics Association, 25–27.

53
Postel, S. (2013a, September 3). Arizona Irrigators Share Water with Desert River. Retrieved January 13, 2016, from http://newswatch.nationalgeographic.com/2013/09/03/arizona irrigators-share-water-with-desert-river/ Postel, S. (2013b, September 3). Arizona Irrigators Share Water with Desert River. Retrieved January 13, 2016, from http://newswatch.nationalgeographic.com/2013/09/03/arizona irrigators-share-water-with-desert-river/ Quality of Water. (2013). Quality of Water Colorado River Basin Progress Report No. 24. Bureau of Reclamation. Radosevich, G. (1978, August). Western Water Laws and Irrigation Return Flow. EPA. Reclamation. (2007, June). Lower Colorado River Drop 2 Storage Reservoir Project: Final Environmental Assessment. Retrieved from http://www.usbr.gov/lc/yuma/environmental_docs/Drop_2/finalea/fea1.pdf Schaible, G. D., & Aillery, M. P. (2012). Water Conservation in Irrigated Agriculture: Trends and Challenges in the Face of Emerging Demands. U.S. Department of Agriculture, Economic Research Service. Retrieved from http://162.79.45.209/media/884158/eib99.pdf Scheierling, S., Young, R. A., & Cardon, G. E. (2006). Public Subsidies for Water-Conserving Irrigation Investments: Hydrologic, Agronomic, and Economic Assessment. Water Resources Research, 42. Scott, C. A., Vicuña, S., Blanco-Gutierrez, I., Meza, F., & Varela-Ortega, C. (2014). Irrigation Efficiency and Water-Policy Implications for River Basin Resilience. Hydrology and Earth System Sciences, 18, 1339–1348. SCWRCB. (1984). Imperial Irrigation District; Alleged Waste and Unreasonable Use of Water; Water Rights Decision 1600. State of California Water Resources Contorl Board. SDCWA. (2015). Canal Lining Projects. Retrieved from http://www.sdcwa.org/canal-lining projects SDWCA. (2015, December 4). Colorado River Water Transfer Agreements. Retrieved December 4, 2015, from http://www.sdcwa.org/sites/default/files/watertransfer-fs.pdf Seckler, D. W. (1996). The New Era of Water Resources Management: from “Dry” to “Wet” Water Savings. Colombo, Sri Lanka: International Irrigation Management Institute.
54
Shock, C. (2006). Drip Irrigation: an dIntroduction (Sustainable Agriculture Techniques). Oregon State University Extension Service. Retrieved from http://extension.oregonstate.edu/ umatilla/mf/sites/default/files/Drip_Irrigation_EM8782.pdf Siddique, K. H. M., Tennant, D., Perry, M. W., & Belford, R. K. (1990). Water Use and Water Use Efficiency of Old and Modern Wheat Cultivars in a Mediterranean-Type Environment. Crop and Pasture Science, 41(3), 431–447. Simonds, J. (1994). Grand Valley Project. Bureau of Reclamation. Stene, E. A. (1995). All-American Canal: Boulder Canyon Project. Bureau of Reclamation. Stoddard, P. (2006, June 20). Greener Pastures: Ferron Celebrates End of Salinity Project with Program and Dinner. Emery County Progress. Retrieved from http://www.ecprogress.com/index.php?tier=1&article_id=4169 Stone, R. (2015). Saving Iran’s Great Salt Lake. Science, 349(6252), 1044–1047. Styles, S. W., Burt, C. M., Khalsa, R. D., & Norman, R. (1999). Case Study: Modernization of the Government Highline Canal. Bioresource and Agricultural Engineering, 36. Tillman, F. D., & Leake, S. A. (2010). Trends in Groundwater Levels in Wells in the Active Management Areas of Arizona, USA. Hydrogeology Journal, 18(6), 1515–1524. Trout Unlimited. (2015, February 10). NRCS Funding Will Deliver Benefits for Ranch and Farm Operations, fisheries. Retrieved from http://coloradotu.org/2015/02/nrcs-funding-will deliver-benefits-for-ranch-and-farm-operations-fisheries/ Uilenberg, B. R., & Norman, R. E. (1999). Grand Valley Water Management Project. USBR. USBR. (2006). Supplemental Information Report; All-American Canal Lining Project. Bureau of Reclamation. USBR. (2013a). Endangered Fish Passage Project at the Grand Valley Project Diversion Dam And Fish Screen in the Government Highline Canal. U.S. Department of the Interior, Bureau of Reclamation, Technical Services Center, Denver, Colorado. USBR. (2013b). Final Environmental Assessment Orchard Mesa Irrigation District Canal System Improvement Project. U.S. Department of the Interior, Bureau of Reclamation, Technical Services Center, Denver, Colorado. USDA. (2011). Colorado River Basin Salinity Control Program Federal Accomplishments Report for Fiscal Year 2011. USDA.

55
Venn, B. J., Johnson, D. W., & Pochop, L. O. (2004). Hydrologic Impacts Due to Changes in Conveyance and Conversion from Flood to Sprinkler Irrigation Practices. Journal of Irrigation and Drainage Engineering, 130(3), 192–200. Ward, F. A., & Pulido-Velazquez, M. (2008a). Water Conservation in Irrigation can Increase Water Use. PNAS, 105(47), 18215–18220. Ward, F. A., & Pulido-Velazquez, M. (2008b). Water Conservation in Irrigation can Increase Water Use. Proceedings of the National Academy of Sciences, 105(47), 18215–18220. Wetstein, J. H., Hasfurther, V. R., & Kerr, G. L. (1989). Irrigation Diversions and Return Flows
Pinedale. Wyoming Water Research Center, University of Wyoming. Retrieved from http://citeseerx.ist.psu.edu/viewdoc/download?doi=10.1.1.650.4137&rep=rep1&type pdf Widener, J. M. (2015). Water-Conveyance Technology and the Preservation of Agriculture in Colorado’s Orchard Mesa Irrigation District. Material Culture, 47(1), 32–57. Willardson, L. S., Allen, R. G., & Frederiksen, H. D. (1994). Elimination of Irrigaiton Efficiencies. In Irrigation Planning and Management Measures in Harmony with the Environment. Denver, Colorado. Wilson, P. N., & Needham, R. (2006). Groundwater Conservation Policy in Agriculture. Presented at the 26th Conference of the International Association of Agricultural Economists, Queensland, Australia. Wmidd.org. (n.d.). WMIDD - Challenges. Retrieved January 13, 2016, from http://www.wmidd.org/challenges.html Wolfe, D. (2009). Wolfe 2009 Arkansas River Compact Rules Statement of Basis and Purpose.pdf. Wolthers, W. (1992). Influences on the Efficiency of Irrigation Water Use. Wageningen, the Netherlands: International Institute for Land Reclamation. Wright, K. R. (1964). Water Right Engineering under Appropriation System. Journal of Irrigation and Drainage Division, American Society of Civil Engineers, 90(1), 9–15. WRSA Grant Application. (2014). Water Supply Reserve Account – Grant and Loan Program Water Activity Summary Sheet; No Chico Brush Agricultural Water Research Project.