Proj Management
29
Executive summary Handstar Ltd is a company that was set up by two college mates to develop software applications for handheld computer devices. It has been operating for more than four years, and has grown to ten employees since it first started, with annual sales approaching £1.5million. Handstar's original product was an expense report application that allowed users to record expenses on their handheld computer and then import these expenses into a spreadsheet that then created an expense report in one of five standard formats. Based on the success of its first product, Handstar subsequently developed three additional software products: a program for tracking and measuring the performance of investment portfolios, a calendar program, and a program that allowed users to download their e-mail messages from their PC and read them on their handheld computer. The founders were worried and concerned about the lack of competitiveness of the firm’s offerings, as they have not been updated since there first lunch. Thus, a list of six potential projects were proposed by the directors of product development and marketing for updating Handstar’s current offerings and projects to implement additional offerings. In evaluating the projects, the founders believed it was reasonable to assume the following: Each product had a three- year life The cost of software developers is £52 per hour including salary and fringe benefits A discount rate of 12% fairly reflected the company's cost of capital There are currently four software developers on staff, each of
-
Upload
asdfasdf011 -
Category
Documents
-
view
146 -
download
13
Transcript of Proj Management
Executive summary
Handstar Ltd is a company that was set up by two college mates to develop software applications for
handheld computer devices. It has been operating for more than four years, and has grown to ten
employees since it first started, with annual sales approaching £1.5million.
Handstar's original product was an expense report application that allowed users to record expenses
on their handheld computer and then import these expenses into a spreadsheet that then created
an expense report in one of five standard formats. Based on the success of its first product, Handstar
subsequently developed three additional software products: a program for tracking and measuring
the performance of investment portfolios, a calendar program, and a program that allowed users to
download their e-mail messages from their PC and read them on their handheld computer.
The founders were worried and concerned about the lack of competitiveness of the firm’s offerings,
as they have not been updated since there first lunch. Thus, a list of six potential projects were
proposed by the directors of product development and marketing for updating Handstar’s current
offerings and projects to implement additional offerings.
In evaluating the projects, the founders believed it was reasonable to assume the following:
Each product had a three- year life
The cost of software developers is £52 per hour including salary and fringe benefits
A discount rate of 12% fairly reflected the company's cost of capital
There are currently four software developers on staff, each of whom works 2500 hours per
year.
A report will be prepared using the data provided in the Handstar Ltd case study. The report will
include:
1. The NPV ’s (Net Present Value’s) assessment for each project and a combination of projects
recommended on that basis.
2. The projects will be ranked using the weighted factor method, and a number of projects will be
recommended considering these rankings.
3. The benefits and drawbacks of hiring an additional software development engineer will be
discussed before a judgment is made on whether to recommend this or not.
4. The IRR (Internal Rate of Return) of the projects will be calculated and observations and analysis
will be made.
5. A brief article will be written on software development project life cycles and a number of
examples will be provided.

This report is aimed to aware the founders of what each project involves and what they can expect
in return. In return, this should provide them with more information and help them make better
decisions on the actions required.
There are a number of methods that can be applied to select and evaluate projects. These
include both financial and non-financial methods, and would enable the project proposals to be
compared and help in giving vital information to decide whether a project is feasible on not.
For instance, if, after analysis, the method found out that the returns of the project are higher
than the costs, this means that the project is likely to be accepted. But if the project was found
out to have higher costs than the returns, it implies that the project is not feasible and not worth
investing in.
These methods do not provide answers or solutions, but rather provide information that would
help us figure out the enhanced conclusions and best choices.
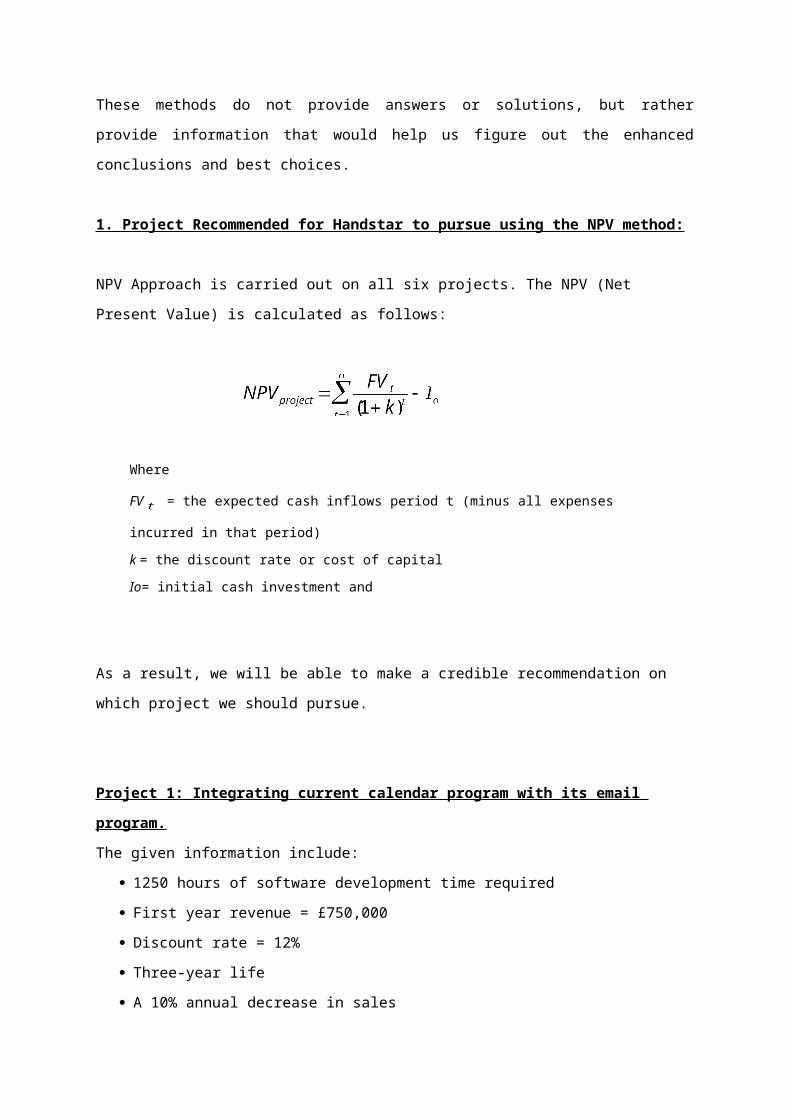
1. Project Recommended for Handstar to pursue using the NPV method:
NPV Approach is carried out on all six projects. The NPV (Net Present Value) is calculated as
follows:
As a result, we will be able to make a credible recommendation on which project we should
pursue.
Project 1: Integrating current calendar program with its email program.
The given information include:
Where
FV = the expected cash inflows period t (minus all expenses incurred in that period)
k = the discount rate or cost of capital
Io= initial cash investment and
n = numbers of years or life of project.
1250 hours of software development time required
First year revenue = £750,000
Discount rate = 12%
Three-year life
A 10% annual decrease in sales
The cost of software developers is £52 per hour including salary and fringe benefits
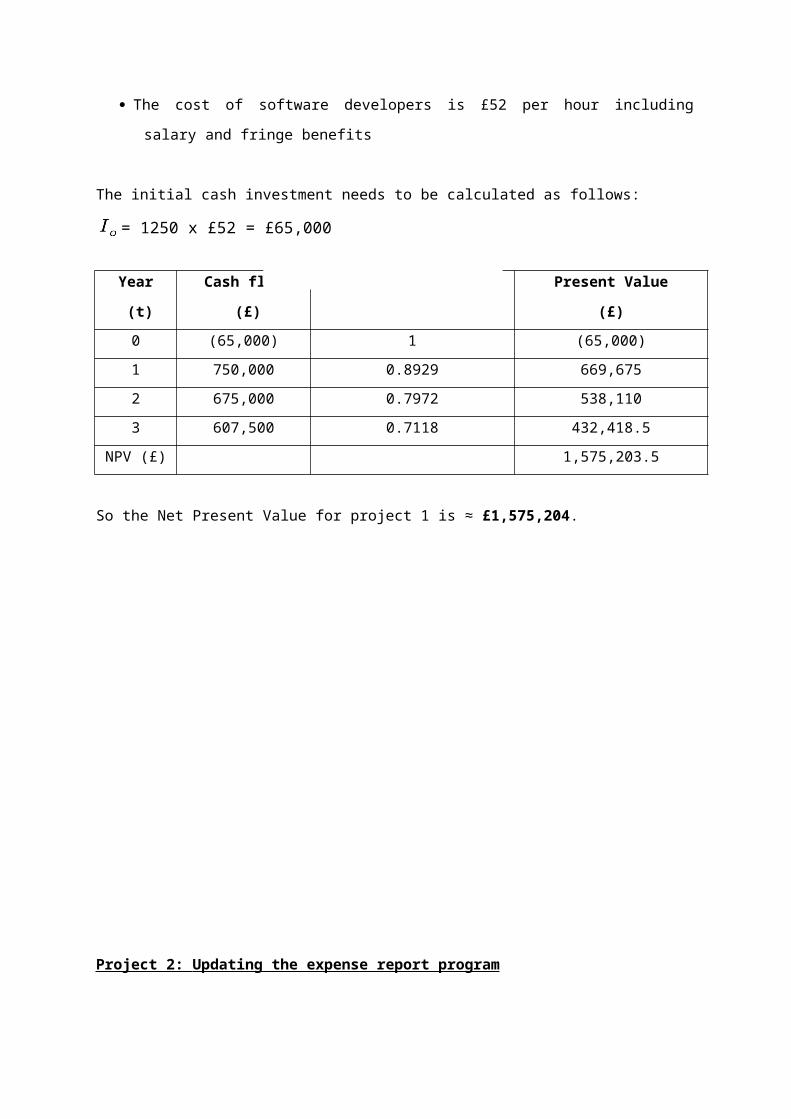
The initial cash investment needs to be calculated as follows:
= 1250 x £52 = £65,000
Year
(t)
Cash flow
(£)
Discount Factor Present Value
(£)
0 (65,000) 1 (65,000)
1 750,000 0.8929 669,675
2 675,000 0.7972 538,110
3 607,500 0.7118 432,418.5
NPV (£) 1,575,203.5
So the Net Present Value for project 1 is ≈ £1,575,204.
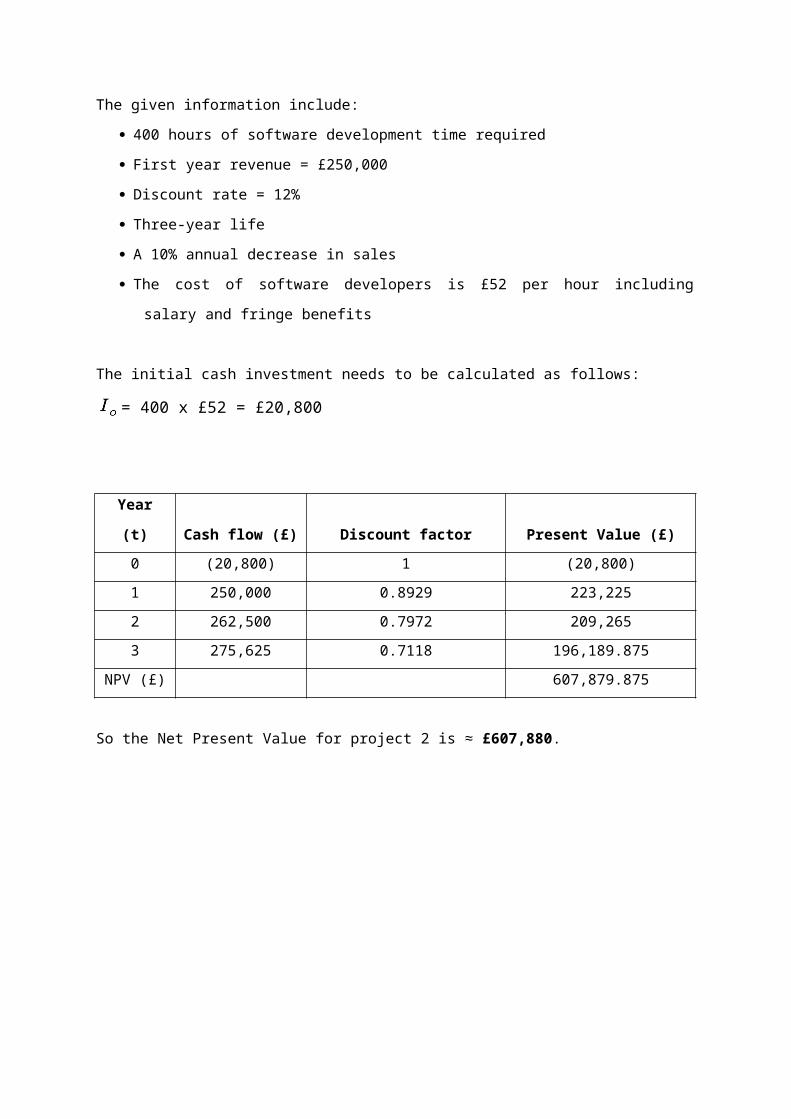
Project 2: Updating the expense report program
The given information include:
400 hours of software development time required
First year revenue = £250,000
Discount rate = 12%
Three-year life
A 10% annual decrease in sales
The cost of software developers is £52 per hour including salary and fringe benefits
The initial cash investment needs to be calculated as follows:
= 400 x £52 = £20,800
Year (t) Cash flow (£) Discount factor Present Value (£)
0 (20,800) 1 (20,800)
1 250,000 0.8929 223,225
2 262,500 0.7972 209,265
3 275,625 0.7118 196,189.875
NPV (£) 607,879.875
So the Net Present Value for project 2 is ≈ £607,880.
Project 3: Enhancing the existing portfolio tracking program
The given information include:
750 hours of software development time required
First year revenue = £500,000
Discount rate = 12%
Three-year life
A 10% annual decrease in sales
The cost of software developers is £52 per hour including salary and fringe benefits
The initial cash investment needs to be calculated as follows:
= 750 x £52 = £39,000
Year (t) Cash flow (£) Discount factor Present Value (£)
0 (39,000) 1 (39,000)
1 500,000 0.8929 446,450
2 525,000 0.7972 418,530
3 551,250 0.7118 392,379.75
NPV (£) 1,218,359.75
So the Net Present Value for project 3 is ≈ £1,218,360.
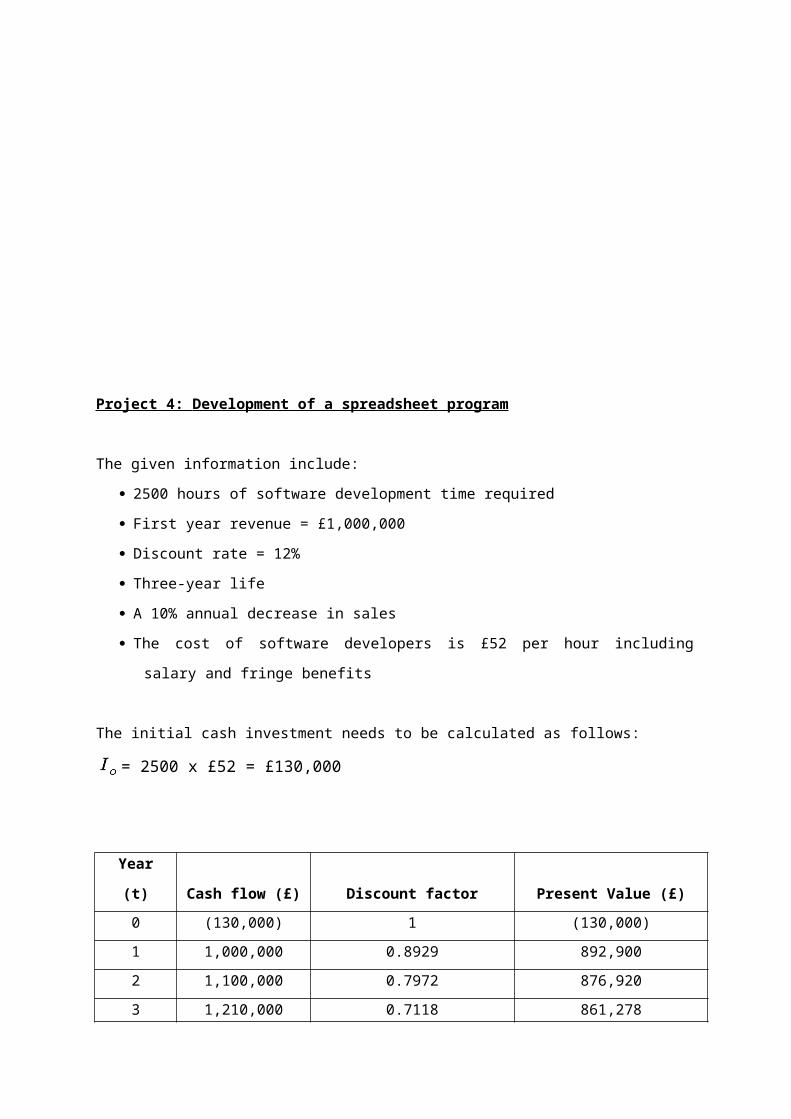
Project 4: Development of a spreadsheet program
The given information include:

2500 hours of software development time required
First year revenue = £1,000,000
Discount rate = 12%
Three-year life
A 10% annual decrease in sales
The cost of software developers is £52 per hour including salary and fringe benefits
The initial cash investment needs to be calculated as follows:
= 2500 x £52 = £130,000
Year (t) Cash flow (£) Discount factor Present Value (£)
0 (130,000) 1 (130,000)
1 1,000,000 0.8929 892,900
2 1,100,000 0.7972 876,920
3 1,210,000 0.7118 861,278
NPV (£) 2,501,098
So the Net Present Value for project 4 is ≈ £2,501,098.
Project 5: Development of a new web browser
The given information include:
1875 hours of software development time required
First year revenue = £2,500,000
Discount rate = 12%
Three-year life
A 10% annual decrease in sales
The cost of software developers is £52 per hour including salary and fringe benefits
The initial cash investment needs to be calculated as follows:
= 1875 x £52 = £97,500
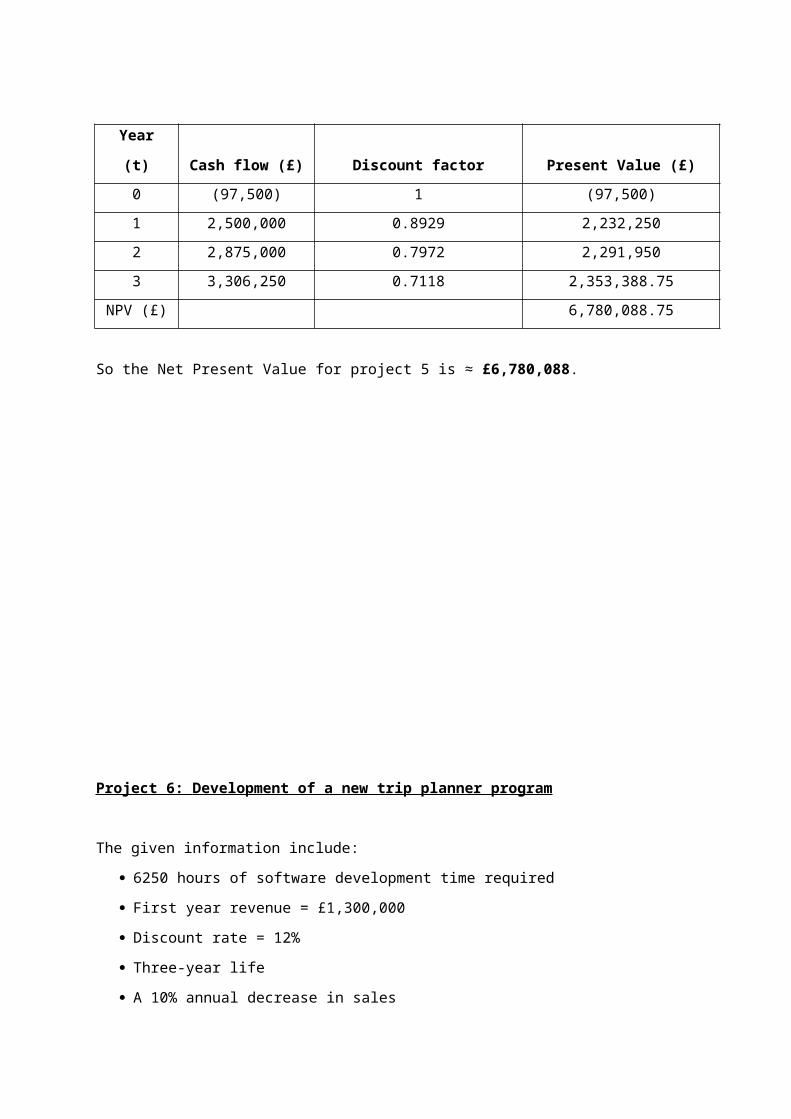
Year (t) Cash flow (£) Discount factor Present Value (£)
0 (97,500) 1 (97,500)
1 2,500,000 0.8929 2,232,250
2 2,875,000 0.7972 2,291,950
3 3,306,250 0.7118 2,353,388.75
NPV (£) 6,780,088.75
So the Net Present Value for project 5 is ≈ £6,780,088.
Project 6: Development of a new trip planner program
The given information include:

6250 hours of software development time required
First year revenue = £1,300,000
Discount rate = 12%
Three-year life
A 10% annual decrease in sales
The cost of software developers is £52 per hour including salary and fringe benefits
The initial cash investment needs to be calculated as follows:
= 6250 x £52 = £325,000
Year (t) Cash flow (£) Discount factor Present Value (£)
0 (325,000) 1 (325,000)
1 1,300,000 0.8929 1,160,770
2 1,365,000 0.7972 1,088,178
3 1,433,250 0.7118 1,020,187.35
NPV (£) 2,944,135.35
So the Net Present Value for project 6 is ≈ £2,944,135.
Proposed best solution using the NPV approach:
There are four software developers, each working 2500 hours per year. Thus:
Development time available between the six projects = 2500 x 4 = 10,000 hours
In order to select the best combination of projects using NPV approach, both of the efficient use
of developers and the maximum NPV must be considered. This means that we have to select the
solution with the maximum number of projects and use the minimum possible development
time, whilst consisting of the maximum NPV.
Project 6 can be neglected because it has a very high development time and relatively low NPV
with respect to other projects.
Project 5 needs to be selected because it relatively has a very high NPV and not so high
development time, with respect to other projects.
Looking at the possible combinations, we can select the following feasible options:
Projects Total NPV (£) Total Development time
1, 2, 3, 4, & 5 12,682,631 6775
1, 2, 5 & 6 11,907,308 9775
It can be seen from the table that project 5 should be chosen and project 6 should be neglected.
This matches what was mentioned earlier on, that project 5 should be selected and project 6
should be neglected. The set of projects 1,2,3,4,& 5 have a higher combined NPV and lower
development time than the other set of projects 1,2,5 & 6. Thus the set of projects 1,2,3,4,& 5
should be selected.
The NPV method has a number of benefits in the sense that it involves the time value of money,
and looks on the project from start to finish. It enables direct comparisons, and takes into
account factors such as inflation. However, it has a number of drawbacks, and these include the
limited accuracy due to the accuracy of estimated future cash flows and discount rates. It
doesn’t take into account non-financial data and is biased against short run projects.
Thus, although this method might be very quantitative and informing, it should not be solely
relied on, but instead used in conjunction with other methods.
2. Projects rankings and recommendation using weighted factor scoring method

The weighted factor score for each of the six projects must be calculated in order to be able to
make a credible recommendation on which projects to pursue.
The weighted factor scoring method of a project can be calculated as follows:
Taking into consideration that the founders weigh a project’s NPV as twice as much as
obtaining/retaining a leadership position and making use of the Internet, we can say:
Factor Weight
N P V 0.5
Leadership Position 0.25
Use of internet 0.25
A scoring system needs to be set up for the NPV, the likelihood of obtaining/retaining a
leadership position, and the making use of the internet. This is done as follows:
The scoring method for the NPV is as follows:
NPV (£) Rating Score
NPV 1, 000, 000 Poor 0
1,000, 000 NPV 2, 000, 000 Fair 10
2,000, 000 NPV 4, 000, 000 Good 20
NPV 4, 000, 000 Excellent 30
The scoring method for the likelihood of obtaining/retaining a leadership position is as
follows:
Likelihood Rating Score
Where
Si = total score of project i
sij= score of project i on jth criterion
wj = weight of jth criterion

Very Low Poor 0
Low Fair 10
Moderate Good 20
High Excellent 30
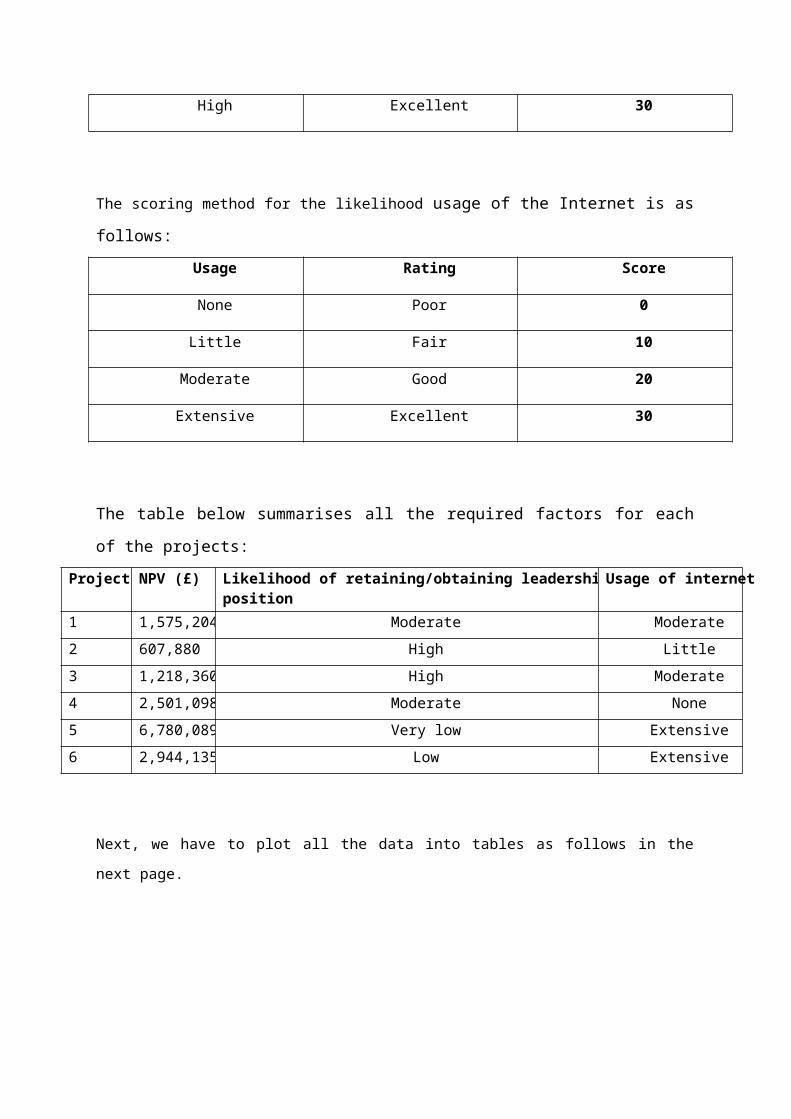
The scoring method for the likelihood usage of the Internet is as follows:
Usage Rating Score
None Poor 0
Little Fair 10
Moderate Good 20
Extensive Excellent 30
The table below summarises all the required factors for each of the projects:
Project NPV (£) Likelihood of retaining/obtaining leadership position Usage of internet
1 1,575,204 Moderate Moderate
2 607,880 High Little
3 1,218,360 High Moderate
4 2,501,098 Moderate None
5 6,780,089 Very low Extensive
6 2,944,135 Low Extensive
Next, we have to plot all the data into tables as follows in the next page.
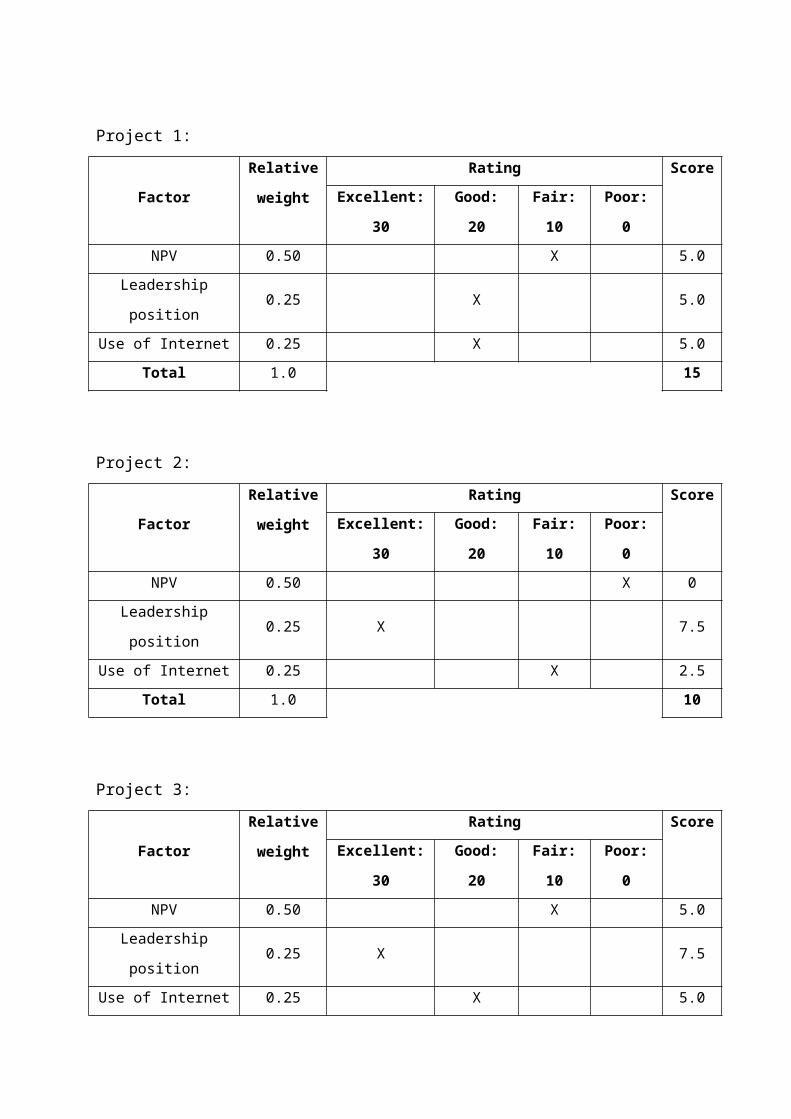
Project 1:

FactorRelative
weight
Rating Score
Excellent: 30 Good: 20 Fair: 10 Poor: 0
NPV 0.50 X 5.0
Leadership position 0.25 X 5.0
Use of Internet 0.25 X 5.0
Total 1.0 15
Project 2:
FactorRelative
weight
Rating Score
Excellent: 30 Good: 20 Fair: 10 Poor: 0
NPV 0.50 X 0
Leadership position 0.25 X 7.5
Use of Internet 0.25 X 2.5
Total 1.0 10
Project 3:
FactorRelative
weight
Rating Score
Excellent: 30 Good: 20 Fair: 10 Poor: 0
NPV 0.50 X 5.0
Leadership position 0.25 X 7.5
Use of Internet 0.25 X 5.0
Total 1.0 17.5
Project 4:
FactorRelative
weight
Rating Score
Excellent: 30 Good: 20 Fair: 10 Poor: 0
NPV 0.50 X 10.0
Leadership position 0.25 X 5.0
Use of Internet 0.25 X 0
Total 1.0 15
Project 5:
Factor Relative Rating Score

weight Excellent: 30 Good: 20 Fair: 10 Poor: 0
NPV 0.50 X 15.0
Leadership position 0.25 X 0
Use of Internet 0.25 X 7.5
Total 1.0 22.5
Project 6:
FactorRelative
weight
Rating Score
Excellent: 30 Good: 20 Fair: 10 Poor: 0
NPV 0.50 X 10.0
Leadership position 0.25 X 2.5
Use of Internet 0.25 X 7.5
Total 1.0 20
The results obtained using the weighted scoring method are summarised in the table below:
Project Total score
1 15
2 10
3 17.5
4 15
5 22.5
6 20
Analysis of results:
Projects 2,3,5,& 6 have the highest combined score. Projects 1 & 4 have a similar score, but
neither of them can be selected because they have limited resources of software developers.
The reason project 2 is selected even though it has a low score is because it has a very small
development time and could be implemented without any additional resources, which was
what would have been required if either project 1 or 4 were selected.
Thus, the projects recommended based on the weighting score method are projects 2,3,4,5 &6
with a total development time of 9275 hours.
3. Hiring an additional software development engineer
A software development engineer requires 2500 hours of development time per year, to be
added to the current annual development time. Thus, the total development time will increase
from 10000 to 12500 hours per year.
An additional development engineer will imply a change in the projects recommended in the
NPV approach because the development time is now different. With only 4 project developers,
projects 1,2,3,4,&5 were selected. Project 6 was neglected due to its high development. But with
an additional development engineer, the optimal solution would change because project 6 can
now be pursued , and the recommended projects would now become projects 1,2,4,5,& 6. This
gives a new total NPV of £14,408,406 and uses 12275 hours of development time. Project 3 has
to be dropped, as it has a fairly low NPV, considering the limited resources (development time)
available.
The NPV is observed to have been increased by £1,725,775 due to hiring salary costs of
£130,000 (2500 × 52).
It is difficult to decide on the best solution based on only one method. However, regarding the
information we have, pursue of an additional software developer engineer is recommended
because it is beneficial to the company as it gives opportunities for bigger projects.
Thus, based on NPV approach, I would recommend hiring an additional software developer
engineer.
4. The calculation of IRR (Internal Rate of Return) of each project
IRR (internal Rate of Return) is the discount rate at which the NPV of the cash flows generated
by the projects is equal to the present value of the capital invested so that the NPV of the project
is zero.
The IRR can be calculated using the following equation:
Project 1:
Using the data already obtained;
Project length=3 years
First year cash flow=£750,000
Second year cash flow=£675,000
Third year cash flow= £607,500
Initial investment=£65,000
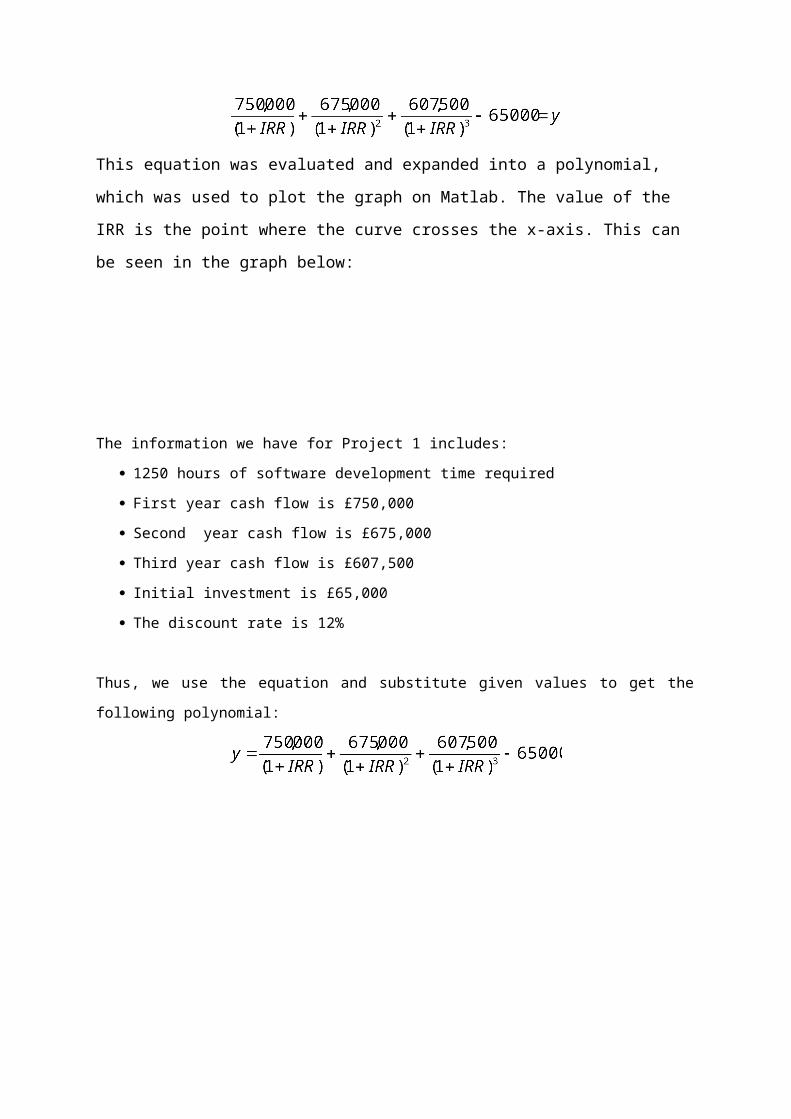
Substituting these values into the above formula gives:
This equation was evaluated and expanded into a polynomial, which was used to plot
the graph on Matlab. The value of the IRR is the point where the curve crosses the x-
axis. This can be seen in the graph below:
The information we have for Project 1 includes:
1250 hours of software development time required
Where
FVt = the expected cash inflows period t (minus all expenses incurred in that period)
IRR = the internal rate of return
Io= initial cash investment and
n = numbers of years or life of project.

0 5 10 15-5
0
5
10
15
20x 10
5 Project 1
K (%)
NP
V (£
) First year cash flow is £750,000
Second year cash flow is £675,000
Third year cash flow is £607,500
Initial investment is £65,000
The discount rate is 12%
Thus, we use the equation and substitute given values to get the following polynomial:
The polynomial is then evaluated into Matlab, and a graph of NPV against percentage discount
rate (K) is plotted. The IRR of project 1 occurs where the graph intersects with the x-axis. The
accurate value is retrieved from Matlab.
The process is repeated and values are substituted for all projects. The graph is plotted 6 times,
and each time the value of IRR is noted for its corresponding project. The results are as follows:

Project IRR Value (%)
1 1143.4079
2 1206.299
3 1286.495
4 777.7165
5 2578.9
6 401.3249
Comments:
Project 1 shows a similar value of IRR to the discount rate and thus indicates that it is
acceptable in meeting the rate of return although it gives no surplus to the owners. Projects
2,3,4, & 5 have a higher IRR than the discount rate, and thus should be selected. Project 6 should
be rejected because its IRR is the lowest, and would not meet the rate of return. These
conclusions were expected and agree with NPV method.
The use of the IRR has an advantage in that it eliminated the need to argue about an appropriate
discount rate; its choices cannot be manipulated by choice of discount rate. However, it limits
the use of the same discount rate throughout the project.
5. Software Development Project Life Cycles
Project life cycles are a logical sequence of activities to accomplish the project’s goals or

objectives regardless of its size or complexity. [1]
The software development life cycle model describes the different tasks and transitions
involved in carrying out a project. They define the order in which these tasks should be carried
out. Although there are many models and most of the time each model is unique to any
particular company or even project, they usually all have the same structure as shown below.
In order to transit from one stage to the next, all of the desired information from the previous stage needs to be fulfilled. The design stage can be in operation only after the requirements stage is finished. During the implementation stage, a code can be constructed and then debugged during the testing & maintenance stage.
1. Requirements:
This is the first stage of any project, where the project gets defined considering the initial
problems and the stakeholders’ (users, specialists, managers, etc.) views are. An appropriate
manager is then selected whom in turn selects a skilled and experienced team as required.
2. Design:
In this stage, each task is defined in more detail, along with a criterion definition for the
successful completion of each requirement. Agreements are made and the software system
design is produced. This stage basically defines how the system will work and puts the project
to be ready for implementation.
3. Implementation:
Testing & Maintenance
Requirements
Design
Implementation

This step is very important but is the most time consuming in the life cycle. It involves the
development of the software and the production of the code based on the design.
4. Testing & Maintenance:
In this step, the code produced during implementation is tested and the convergence is
measured using prototypes, testing, and feedback.
Once this has been executed, a number of tools could be used to ensure the product developed
is what was expected. Risk analysis and score cards are two popular methods used at this stage.
If maintenance is required by the firm then this will be done continuously at regular intervals.
Once the project is complete, a formal project review report is written. Each stage is distinct and
is specific, however, a lot of overlapping occurs between them to ensure change-over’s are
efficient.
The result of these applications is the development of a high quality software [2]. This implies
that there are no crashes, there is correspondence between the software and the users’
expectations, and it is going to perform the optimum specified requirements. However, quality
must be controlled because it may otherwise, have unpleasant effects on the business which are
unfavourable such as increased maintenance costs and decreased production speeds.
There are a number of software development project life cycle models, including:
1. Capability Maturity Model (CMM): five processes to measure the maturity of an
organisation’s software process.
2. Waterfall Model: sequential development process, whereby development is seen as
flowing progressively as observed in a ‘waterfall’.
3. V-shaped Model: an extension of the waterfall method which emphasises on ensuring
validity of the project.
4. Structured Evolutionary Prototyping: a prototype is built during the requirements stage
and is evaluated by the end users.
5. Rapid Application Model (RAD): prioritises four essential aspects: methodology, people,
management, and tools
6. Incremental Model : prioritises requirements of the system and then implements them
in groups.
7. Spiral Model: adds a Risk Analysis to the Waterfall Model.
8. Agile Model: speeds up one of the phases.
9. Adaptive Model: combines RAD with software engineering best practises.
10. Formal methods: a mathematical approach for solving software problems, some of
which include B-methods, RAISE and VDM.
Both the incremental model and the V-Shaped model are discussed and detailed below:
The Incremental Model:
http://www.stsc.hill.af.mil/crossTalk/2001/06/leishman3.gif
A partial implementation of the total system is carried out in the incremental model. Each subsequent release of the system adds function to the previous release, until all the design has been implemented
Advantages of the model include:
The high-risk or the major functions are developed first.
Initial product delivery is quicker thus minimising the delivery cost.
After every release, an operational product exists.
The risk of changing requirements is reduced.
The disadvantages include:
Good planning and good design are instrumental.

Fully functional system needs to be known early so as to allow for the definition of the
increments.
No reduction of the total cost of the system.
This model is useful when there is a need for early realisation (short term) of benefits and requirements are expected to develop over time. Practical for long development schedule projects.
The V-Shaped Model
This model is similar to the waterfall model in that it consists of a sequential path of tasks, each of which must be completed prior the next stage. A very important characteristic of this model is that it emphasises a lot on testing. Unlike many other models, testing is carried out continuously rather than it being a single phase.
http://softwareqatestings.com/images/stories/common/V-Shaped_Model.JPG
The model starts off with the Requirement analysis and testing plans begins even before the development stage is attained.
Initiation Requirements Analysis Requirements need to be known as an initial step for the project
High Level Design System Design Focuses on the architecture and system

Architecture Design design to define how the software functions fulfil the design.An integration test plan is created at this stage also.
Low Level Design Module Design Algorithms for each architectural component are developed.Tests are also produced here.
Implementation Coding Algorithms are transformed into the software.The completion of this stage will lunch and put all the tests that were developed previously into practice.
Advantages:
1. Emphasises on verification and validation of the product in the early stages of the life cycle.
2. Focuses on testing and progress can be tracked using milestones.3. Easy to use.
Disadvantages:1. Can not handle iterations or phases.2. Has an inflexible response to dynamic changes in requirements.3. Does not include risk analysis and does not show a clear path for problems found during
phases testing.
This model is excellent for systems where all of the requirements are known and when the solution technology are known in advance. However, could be expensive due to the requirement of constant changing.
References:


![DRAWING AND 3D MODEL MANAGEMENT AND …lhc-proj-qawg.web.cern.ch/lhc-proj-qawg/CD-ROM/Quality/QA305.pdf · Buildings and Civil Engineering Works" [ 9]. Drawing sequential numbers](https://static.fdocuments.net/doc/165x107/5aa4a01e7f8b9a1d728c1f4b/drawing-and-3d-model-management-and-lhc-proj-qawgwebcernchlhc-proj-qawgcd-romqualityqa305pdfbuildings.jpg)