
Progressive Wealth Taxation - Brookings Institution · 2019-09-05 · Progressive Wealth Taxation...
66
BPEA Conference Drafts, September 5–6, 2019 Progressive Wealth Taxation Emmanuel Saez, University of California, Berkeley Gabriel Zucman, University of California, Berkeley
Transcript of Progressive Wealth Taxation - Brookings Institution · 2019-09-05 · Progressive Wealth Taxation...

BPEA Conference Drafts, September 5–6, 2019
Progressive Wealth Taxation
Emmanuel Saez, University of California, BerkeleyGabriel Zucman, University of California, Berkeley

Conflict of Interest Disclosure: Emmanuel Saez holds the Chancellor’s Professorship of Tax Policy and Public Finance and directs the Center for Equitable Growth at the University of California, Berkeley; Gabriel Zucman is an assistant professor of economics at the University of California, Berkeley. Beyond these affiliations, the authors did not receive financial support from any firm or person for this paper or from any firm or person with a financial or political interest in this paper. They are currently not officers, directors, or board members of any organization with an interest in this paper. No outside partyhad the right to review this paper before circulation. The views expressed in this paper are thoseof the authors, and do not necessarily reflect those of the University of California, Berkeley. The authors have advised several presidential campaigns recently on the issue of a wealth tax.

Progressive Wealth Taxation∗
Emmanuel SaezUC Berkeley
Gabriel ZucmanUC Berkeley
Conference Draft: September 4, 2019
Abstract
This paper discusses the progressive taxation of household wealth. We first discuss whatwealth is, how it is distributed, and how much revenue a progressive wealth tax couldgenerate in the United States. We try to reconcile discrepancies across wealth data sources.Second, we discuss the role a wealth tax can play to increase the overall progressivity ofthe US tax system. Third, we discuss the empirical evidence on wealth tax avoidanceand evasion as well as tax enforcement policies. We summarize the key elements neededto make a US wealth tax work in light of the experience of other countries. Fourth, wediscuss the real economic effects of wealth taxation on inequality, the capital stock, andeconomic activity. Fifth, we present a simple tractable model of the taxation of billionaires’wealth that can be applied to the Forbes list of the 400 richest Americans since 1982. Themodel applied to the Forbes data illustrates the long-run effects of wealth taxation on topfortunes.
∗Emmanuel Saez, University of California, Department of Economics, 530 Evans Hall #3880, Berkeley, CA94720, [email protected]. Gabriel Zucman, University of California, Department of Economics, 530Evans Hall #3880, Berkeley, CA 94720, [email protected]. We thank Wojciech Kopczuk, Greg Leierson,Greg Mankiw, Thomas Piketty, David Seim and editors Jan Eberly and Jim Stock for helpful discussionsand comments. Funding from the Center for Equitable Growth at UC Berkeley, the Sandler foundation, andis thankfully acknowledged. This proposal solely reflects the authors’ views and not those who generouslycommented on it.

1 Introduction
Income and wealth inequality have increased dramatically in the United States over the last
decades (Piketty and Saez, 2003; Saez and Zucman, 2016; Piketty, Saez, and Zucman, 2018).
A long-standing concern with wealth concentration is its effect on democratic institutions and
policy-making.1 The view that excessive wealth concentration corrodes the social contract
has deep roots in America—a country founded in part in reaction against the highly unequal,
aristocratic Europe of the 18th century. Before 1776, the northern American colonies already
taxed wealth including financial assets and other personal property, instead of land only as in
England (Saez and Zucman, 2019, Chapter 2). Sharply progressive taxation in the 20th century
was an American invention: the United States was the first country in 1917—four years after
the creation of the income tax—to impose top marginal tax rates as high as 67 percent on the
highest incomes. It was also the first country, starting in the 1930s, to impose high top tax rates
(of 70% or more) on wealth at death. No European country ever imposed similarly high top
inheritance tax rates (Plagge, Scheve, and Stasavage, 2011, p. 14). To be sure, policies such as
antitrust, lobbying regulation, or campaign finance can also curb the power of extreme wealth;
but historically these policies have tended to come (and go) together with progressive taxation
(Piketty, 2019).
Despite the rise of inequality, the US tax system has become less progressive in recent
decades. The three traditional progressive taxes—the individual income tax, the corporate
income tax, and the estate tax—have weakened. The top marginal federal income tax rate has
fallen dramatically, from more than 70% between 1936 and 1980 to 37% since 2018. Corporate
taxes (which are progressive in the sense that they tax corporate profits, a highly concentrated
source of income) relative to corporate profits have declined from about 50% in the 1950s and
1960s to 16% in 2018. Estate taxes on large bequests now raise little revenue due to a high
exemption threshold, many deductions, and weak enforcement.2 As a result, when combining
all taxes at all levels of government, the US tax system now resembles a giant flat tax. All
groups of the population pay rates close to the macroeconomic tax rate of 28%, with a mild
progressivity up to the top 0.1% and a significant drop at the top-end, with effective tax rates
of 23% for the top 400 Americans (Saez and Zucman, 2019, Chapter 1).
1See, e.g., Mayer (2017), Page et al. (2018). Political contributions for example are extremely concentratedwith 0.01% of the population accounting for over a quarter of all contributions (Drutman, 2013).
2In 2017, estate taxes raised only $20 billion or about 0.13% of the wealth of top 0.1% richest households (inspite of a 40% tax rate above the $5 million exemption threshold, which increased to $10 million in 2018). In1976, the top 0.1% paid the equivalent of 0.7% of its wealth in estate taxes, primarily because of fewer deductions(especially no marital deduction), higher rates, and better enforcement.
1

There is a renewed political demand to use progressive taxation to curb the rise of inequality
and raise revenue. Piketty’s (2014) influential book proposed a global progressive wealth tax. In
January 2019, a major presidential candidate, Elizabeth Warren, proposed a progressive wealth
tax on families or individuals with net worth above $50 million with a 2% marginal tax rate (3%
above $1 billion).3 The United States has never implemented a progressive wealth tax before
but other countries have. What do economists have to say about the merits and demerits of
wealth taxation?
We first discuss what wealth is, how it is distributed, and how much revenue a progressive
wealth tax could generate in the United States. Wealth tax revenue depends on how much wealth
there is at the top (which in turn depends on the amount of aggregate household wealth and
the distribution of wealth) and on enforcement (the fraction of their wealth the rich could hide).
Aggregate household wealth has increased from 3 times annual national income around 1980 to
about 5 times national income in 2018. This increase has been driven by a rise in asset prices
rather than capital accumulation, as the replacement-cost value of the capital stock has remained
constant relative to national income. Meanwhile, wealth has become more concentrated. The
share of wealth owned by the top 0.1% has doubled, from less than 10% in 1980 to almost
20% today. According to Forbes, the share of wealth owned by the 400 richest Americans has
quadrupled from less than 1% in 1982 to 3.5% today (Zucman, 2019). We discuss the recent
estimates of US wealth inequality, why they differ, and how to reconcile them.4 We show that
the wealth tax base above the 99.9th percentile is large, about $12 trillion in 2019 (about 60%-
70% of national income). A 1% marginal tax on the top 0.1% would thus raise $120 billion
(0.6%–0.7% of national income). A well enforced wealth tax has significant revenue potential.
Second, we discuss the role a wealth tax can play in the overall progressivity of the US tax
system. A well-enforced wealth tax would be a powerful tool to restore progressivity at the top
of the US income and wealth distribution. It would increase the tax rate of wealthy families
who can currently escape progressive income taxation by realizing little income relative to their
true economic income.
Third, we discuss the empirical evidence on wealth tax avoidance and evasion, as well as
tax enforcement policies. Several recent and well-identified empirical studies cast light on these
issues. We discuss the lessons from the experience of other countries. The specific form of wealth
3The key difference relative to earlier proposals or existing wealth taxes in other countries is the high exemp-tion threshold. Less than 0.1% of US families would be liable for the Warren wealth tax.
4In particular, we show that taking into account the rising life expectancy differential between the very richand the rest of the population (Chetty et al., 2016) goes a long way towards reconciling wealth concentrationestimates obtained from estate tax data with other sources.
2

taxation applied in a number of European countries had three main weaknesses. First, European
countries were exposed to tax competition and tax evasion through offshore accounts, in a
context where until recently there was no cross-border information sharing. Second, European
wealth taxes had low exemption thresholds, creating liquidity problems for some moderately
wealthy taxpayers with few liquid assets and limited cash incomes. Third, European wealth
taxes, many of which had been designed in the early 20th century, had not been modernized,
perhaps reflecting ideological and political opposition to wealth taxation in recent decades.
These wealth taxes relied on self-assessments rather than systematic information reporting.
These three weaknesses led to reforms that gradually undermined the integrity of the wealth
tax: the exemption of some asset classes such as business assets, a preferential treatment of
others such as real estate, or a repeal of wealth taxation altogether.
A modern wealth tax can overcome these three weaknesses. First, offshore tax evasion can
be fought more effectively today than in the past, thanks to recent breakthrough in cross-border
information exchange, and wealth taxes could be applied to expatriates (for at least some years),
mitigating concerns about tax competition. The United States, moreoever, has a citizenship-
based tax system, making it much less vulnerable than other countries to mobility threats.
Second, a comprehensive wealth tax base with a high exemption threshold and no preferential
treatment for any asset classes can dramatically reduce avoidance possibilities. Third, leveraging
modern information technology, it is possible for tax authorities to collect data on the market-
value of most forms of household wealth and use this information to pre-populate wealth tax
returns, reducing evasion possibilities to a minimum. We also discuss how missing market values
could be obtained by creating markets. In brief, the specific way in which wealth was taxed in a
number of European countries is not the only possible way and it is possible to do much better
today.
Fourth, we discuss the real economic effects of wealth taxes on wealth inequality, the capital
stock, entrepreneurial innovation, top talent migration, family structure, and charitable giving.
For many of these aspects, there is relatively little empirical evidence.
Fifth, we present a new tractable model of wealth taxation of billionaires that can be applied
to the Forbes 400 data since 1982. The model illustrate the long-run effects of wealth taxation
on top fortunes.
3

2 Wealth Inequality and Tax Potential
A progressive wealth tax is an annual tax levied on the net wealth that a family (or an individual)
owns above an exemption threshold. Net wealth includes all assets (financial and non-financial)
net of all debts. The tax can be levied at progressive marginal tax rates above the exemption
threshold. For instance, the wealth tax proposed by Senator Elizabeth Warren in January 2019
would be levied on families (defined as a single person or a married couple with dependents if
any) with net wealth above $50 million. The marginal tax rate is 2% above $50 million and 3%
above $1 billion. A family with $50 million in net wealth would owe no tax, a family with $100
million would owe $1 million (2% of $50 million), and a family with $2 billion would owe $49
million (3% of $1 billion plus 2% of $950 million).
2.1 What is Wealth?
The standard and broadest measure of household wealth includes all financial and non-financial
assets valued at their prevailing market prices, net of debts. Assets include all property that
is marketable or, even if not directly marketable, whose underlying assets are marketable.5
Financial assets include fixed-claimed assets (checking and saving accounts, bonds, loans, and
other interest-generating assets), corporate equity (shares in corporations), and non-corporate
equity (shares in non-corporate businesses, for instance shares in a partnership). Financial
assets can be held either directly or indirectly through mutual funds, pension funds, insurance
companies, and trusts. Non-financial assets include real estate, i.e., land and buildings.6 Debts
primarily include mortgage housing debt, consumer credit (such as auto-loans and credit card
debt), and student debt. Assets owned by businesses, such as a headquarter building or a
patent, contribute to household wealth through their effect on share prices. Net wealth does
not include “human capital” such as future wages and pension rights that have not yet been
accrued.7 Wealth also excludes the present value of future government transfers (such as future
5For example, claims on a defined benefit plan may not be sold but the underlying assets in the defined benefitplan (typically corporate stock and bonds) can. A trust might not allow beneficiaries to sell the underlying assetsbut the underlying assets (again typically corporate stock and bonds) generally are marketable.
6We exclude consumer durable goods (such as cars, jewelry, collectibles) from our wealth statistics. Inaggregate, cars are the largest item and this item is evenly and widely distributed. Contrary to popular belief,jewelry, collectibles, and private planes and boats are very small at the top relative to other forms of wealth.A well-functioning wealth tax, however, would have to include these assets (at least above some threshold) toprevent tax avoidance. A wealth tax that does not tax art collectibles could produce an art collectible priceboom.
7It is only in slave societies that human capital can constitute marketable wealth. From the point of view ofslave-owners, the value of slaves was a large component of US wealth before the civil war (Piketty and Zucman,2014).
4

Social Security benefits or health benefits), which is not marketable.
Private wealth includes household wealth plus the wealth of non-profit institutions (univer-
sity and foundation endowments, church buildings, etc.). The frontier between household and
non-profit wealth is sometimes fuzzy, as in the case of private foundations controlled by wealthy
individual donors, such as the Bill and Melinda Gates foundation. Our statistics exclude non-
profit wealth.8 Private wealth is not the same as national wealth which also includes the assets
owned by the government such as public land and infrastructure (net of government debt). In
the United States, public wealth is about zero on net: public debt is about as large as public
assets (Alvaredo et al. 2018).9
Table 1 displays the value of total US household wealth and its composition by asset class in
2018. The data comes from the US financial accounts published by the Federal Reserve Board.
Total US household wealth reaches about $90 trillion, or about 5 times national income (or 4.5
times GDP). The wealth tax base is thus potentially large. A 1% wealth tax on all assets and
with no evasion would raise $900 billion a year, two-thirds of what the federal individual income
tax currently raises.
Wealth arises from capital accumulation and price effects (changes in asset prices absent any
net saving). Capital accumulation takes many forms: improved land, residences and buildings,
equipment and machinery, intangible capital such as software. Capital accumulation is made
possible by savings that are invested in growing the capital stock. The national accounts
provide a measure of the capital stock—the replacement cost of capital, what is sometimes
called wealth at book value—which only reflects past saving poured into the capital stock, net
of the depreciation of capital, adjusted for general price inflation. This measure does not take
into account changes in asset prices (such as increases in real estate prices or stock prices). By
contrast, the measure of household wealth at market value published in the financial accounts
captures such price effects.
The top panel of Figure 1 compares the evolution of household wealth at market value to
the evolution of the replacement cost of private capital, both expressed as a percent of national
income. Strikingly, the ratio of household wealth to national income has almost doubled from
8As we shall discuss below, to limit tax avoidance opportunities it might be desirable to include wealth thatis still controlled by the initial owner in the wealth tax base, even if this wealth has been pledged for charitablegiving.
9In official balance sheets, public assets only include assets that can be sold. Natural resources and theenvironment are not included but there are efforts to try to incorporate them. Note that a country with a largepublic debt held by residents can have high private wealth and negative public wealth, and may have to devotesignificant fiscal resources to service the debt. In recent decades, public debt has increased in the United States,but a large fraction of this extra debt is held by foreign central banks as reserves (US Treasury, 2018). Theinterest rate paid on public debt is currently low, limiting interest payments.
5
270% in the mid-1970s to more than 500% in 2018, the most recent year available. By contrast,
the replacement cost of the private capital stock has not increased since the mid-1970s and has
remained around 250% of national income over the last four decades. This means that the rise
in aggregate wealth relative to income is primarily due to price effects.10
While more capital is valuable (since capital makes workers more productive), a higher
market value for private wealth is not necessarily desirable. A higher market value for private
wealth is a positive economic development if the market value of wealth reflects expectations
about the future income (or utility) stream that assets will generate. For instance, if businesses
become more efficient, the value of corporate equity will rise even if the replacement cost of
capital does not. But a rise in the market-value of wealth can also reflect an increase in the
capacity of property-owners to extract economic resources at the expense of other groups of
the population. This extractive power is constrained by regulations and can increase when
regulations are removed. For example, a monopoly that can set its price freely is more valuable to
its owners than the same monopoly whose price setting is regulated. But the higher value of the
unregulated monopoly comes at the expense of consumers (with typically negative distributional
implications) and at the expense of overall efficiency (monopoly prices are too high). When
antitrust becomes laxer, private wealth can rise despite the fact that the economy becomes less
efficient and less equal. Similarly, a patent generates wealth for its owner at the expense of
the users of the technology. When a patent expires, the private wealth associated with the
ownership of the patent goes to zero, but production becomes cheaper. Like antitrust, patent
regulation affects the market value of wealth. More generally, the market-value of wealth reflects
the power of property owners and is affected by regulation. Businesses are more profitable (and
hence more valuable) when regulations are favorable to business owners.11
The value of businesses can also increase when owners more aggressively pursue profits by
cutting workers’ pay or increasing prices. The business of private equity firms is precisely to
increase shareholder value by any means: productive improvements but also squeezing existing
stakeholders such as workers, suppliers, or customers (Appelbaum and Bates, 2014).
The relative share of for-profit and not-for-profit organizations also affects the market-value
of wealth. For-profit businesses represent wealth for their shareholders while non-profits do not
have shareholders. A country with privatized for-profit education and health care will typically
10In principle, the discrepancy between the replacement cost of the private capital stock and the market valueof household wealth could also be due to non-profit capital and to net foreign private assets. Both, however, arerelatively small.
11Regulations affecting profitability includes labor laws and unions, corporate taxes, antitrust, and consumerprotection regulations.
6
have a higher market-value of private wealth than a country where education and health is
provided by the government or non-profit institutions.12 Yet there is no particular reason to
presume that this extra wealth is socially valuable. Whether private for-profit, private not-for-
profit, or government provision is best (even from a pure efficiency perspective) depends on
the situation. To give one example from the financial sector where profit motives are generally
thought to be crucial for incentives, consider the case of mutual funds. One of the largest for-
profit mutual fund, Fidelity, manages $1.4 trillion for its clients in 2018 (Morningstar, 2019).
Fidelity stock has a substantial value (over and above the funds it manages on behalf of its
clients). The founding Johnson family made a $40 billion fortune from Fidelity and still owns
half of the company. But there is an even larger not-for-profit mutual fund, Vanguard, which
manages $4.2 trillion but has no stock value (over and above the funds it manages on behalf
of its clients). Vanguard developed the model of low-cost index funds, perhaps one of the most
valuable inventions of the financial sector in recent decades. This invention created social value
but hardly any marketable wealth. Vanguard’s founder John Bogle had an estimated fortune
of less than $100 million, 400 times less than Fidelity founders. This example is particularly
relevant for the analysis of wealth taxes, since mutual funds and pension funds fees constitute
a significant “privatized wealth tax” for the middle class and upper-middle class. The average
tax rate is 0.48% on $17 trillion in assets, i.e., $90 billion (Morningstar, 2019).13
Ideally, one would like to know what part of the rise in the market value of private wealth
(relative to the replacement cost of private capital) owes to expected extra future income streams
due to real economic progress (expected new products or more efficient ways to produce), and
what fraction owes to rent extraction from property owners at the expense of other stakeholders
(workers, consumers, or governments). It can be tempting, as a first order approximation, to
treat the difference between the replacement cost of private capital and the market value of
private wealth as an estimate of rent extraction. But we stress that such a naive computation
is too simplistic and that more research is needed in this area.14
12One example economists are familiar with is the example of scientific journals. Some journals are not-for-profit and price low while others, most notably those published by Elsevier, are for-profit and price high.For-profit journals create wealth for shareholders but at the expense of university budgets.
13The tax rate is slowly going down (it was 0.94% in 2000) as the middle class slowly learns how to avoid this“tax.” Absent Vanguard, the strongest force driving down fees on index funds, it is likely that for-profit mutualfunds would charge more. See Malkiel (2013) for an overview of the industry. Without calling it a tax, he says:“the increase in fees is likely to represent a deadweight loss for investors”, “the major inefficiency in financialmarkets today involves the market for investment advice.”
14One difficulty involves the measurement of intangible capital. Estimates of the replacement cost of privatecapital include some intangibles (software; research and development assets; entertainment, literary, and artisticoriginals), but not others (e.g., brand name, organizational capital). Another difficulty involves the treatmentof privatization: part of the increase in household wealth reflects sales of public assets at potentially low prices
7

2.2 The Distribution of US Household Wealth
How is US household wealth distributed? There are four main sources to estimate the distribu-
tion of wealth in the United States: (1) the Survey of Consumer Finances (SCF), (2) named lists
of wealthy individuals such as the Forbes list of the 400 richest Americans, (3) estate tax data
using the estate multiplier technique, (4) income tax data using the capitalization technique.
The capitalization method infers wealth from capital income by assuming a constant rate of re-
turn by asset class and year (estimated from macro data). The estate multiplier method blows
up each estate by the inverse probability of death (estimated by age × gender cells) to recover
the distribution of wealth in the full population. Each source and method has limitations and
hence triangulating among sources is useful. The best source would be a well-enforced and
comprehensive wealth tax. Zucman (2019) discusses the methodologies and sources in detail.15
Because the SCF by design excludes the Forbes 400, it is natural to add the wealth of the
Forbes 400 to the wealth reported in the SCF when estimating top wealth shares. The Forbes
400 data are not perfect but they are the best estimates we have of wealth at the very top.16
The wealth of large shareholders of publicly traded companies (e.g., Amazon’s Jeff Bezos) is
probably well measured. In 2018, 12 of the 15 richest Americans were shareholders of large public
companies.17 Forbes might miss diversified wealth coming from inheritance (a point emphasized
by Piketty, 2014) and might not value private businesses accurately (Donald Trump famously
misrepresented his wealth to reporters to get into the Forbes list in the 1980s).18
The top panel of Figure 2 depicts the evolution of the top 0.1% wealth share according to
(1) SCF data (with the Forbes 400 added back), (2) the estate multiplier method from Kopczuk
and Saez (2004) updated in Saez and Zucman (2016), smoothed out after 2000, adjusted for
more accurate mortality differentials by wealth groups in recent decades (Chetty et al., 2016),
and using tax units (instead of individual adults) as units of observation,19 (3) the capitalization
(thus at the expense of government), but macroeconomic balance sheets do not reveal what the “right” pricewas (as government assets are typically valued at their current replacement cost).
15Kopczuk (2015), Bricker et al. (2016), and Kennickell (2017) also discuss discrepancies between the SCFand estimates based on tax data.
16Refusing to use the Forbes 400 amounts to saying “we should not make any empirical statement aboutbillionaires,” a nihilistic attitude we reject, although we recognize that the data is imperfect.
17The three exceptions were Charles and David Koch, and Michael Bloomberg.18Kopczuk (2015) further notes that debt or wealth held through charities are not well measured. But
private foundation wealth is public information and can be linked to founders. Except for Bill Gates, suchprivate foundation wealth is negligible relative to the Forbes 400 wealth. Estate tax data show that debt issmall among top wealth holders. According to Kopczuk and Saez (2004), debts represented 6.1% of wealth forthe top 0.01% on average in 1991-2000. For estates filed in 2017, the latest year available, debt is 6.25% ofgross estates for gross estates above $50 million (data vailable online at https://www.irs.gov/statistics/
soi-tax-stats-estate-tax-statistics-filing-year-table-1).19See Figure 3 below for a step by step decomposition of these adjustments.
8

method of Saez and Zucman (2016) updated to 2016 in Piketty, Saez, and Zucman (2018).20 All
three series are based on taking 0.1% of all tax units (not individual adults).21 Both the estate
multiplier and capitalization series shows that wealth concentration was high in the 1910s and
1920s, with a particularly fast increase in the second half of the 1920s. The top 0.1% wealth
share peaked at close to 25% in 1929. It then fell abruptly in the early 1930s (in the context of
the Great Depression) and continued to fall gradually from the late 1930s to the late 1940s (in
the context of the New Deal and the war economy). After a period of remarkable stability in
the 1950s and 1960s, the top 0.1% wealth share reached its low-water mark in the 1970s. Since
the 1980s, all series show a marked increase in wealth concentration, although there is some
variation across sources in the magnitude of the increase. The capitalization method suggests
an increase from 7% in the late 1970s up to 20% in recent years. The estate multiplier method
suggests an increase from 7.5% to 16% over the same period. In the shorter period from 1989
to 2016, the top 0.1% wealth share estimated using SCF data increases from 13% to 20%. In
2016, both the capitalization method and the SCF (plus Forbes 400) have the same 0.1% wealth
share of about 20%. The top 0.1% wealth share is around 16% in the estate tax data in 2011-2,
the latest years available.
Sensitivity of capitalization estimates. As noted in Saez and Zucman (2016) and the
subsequent literature, there are a number of potential limitations with the capitalization method.
Two issues are particularly worth noting.
First, interest rates may be heterogeneous across the distribution. If the rich own assets
generating higher interest rates (such as risky corporate bonds), the capitalization method over-
estimates fixed-income assets at the top. This could be particularly problematic in recent years,
in a context of low overall interest rates.22 Based on a thorough exploitation of linked estate and
20Three improvements were made relative to Saez and Zucman (2016). First, the series is updated to reflectthe latest version of the the macroeconomic household balance sheet published in the Financial Accounts of theUnited States. Second, the series includes a better treatment of wealth that does not generate taxable income,based on a more systematic use of the SCF. Third, it fixes an error in the computation of top wealth shares inthe early 1930s; the new estimates show that wealth concentration fell more rapidly in the early 1930s than wasoriginally reported. See Zucman (2019) for more complete details.
21In the SCF, we select not the top 0.1% of the 130 millions households present the survey but 0.1% of thetotal 175 million tax units in the US. So we select effectively the top 0.135% of SCF households. There arefewer households than tax units because households may include more than one tax unit (e.g., adult childrenliving with their parents). Typically, the SCF captures the wealth of the “economically dominant” tax unit inthe household and misses wealth (or debt) from secondary tax units. This explains for example why the SCFcaptures only 70% of total student loan debt (in 2016, the SCF has $0.96 trillion in student loans while thefinancial accounts have $1.37 trillion in Q2). The sampling at the top for the SCF is made using tax data andhence selecting the top 0.1% of tax units (rather than households) provides the most accurate comparison acrosssources for top groups.
22This issue is pointed out in Kopczuk (2015). More recently, Bricker et al. (2018) and Smith et al. (2019)
9

income tax return micro-data, Saez and Zucman (2016) find evidence of higher interest rates
for the rich since the mid-2000s, with a differential rising over time. They provide sensitivity
analysis and Appendix series that take this differential into account (see the discussion in Saez
and Zucman, 2016, Section IV.F, p. 547–551, and Appendix Tables B41, B41b, and B41c). A
second known issue is that the official Federal Reserve Financial Accounts provide a low value
for the value of private (i.e., unlisted) corporations.
In this paper, we present modified capitalized-income top 0.1% wealth shares that account
for these two issues. First, as in the Saez and Zucman (2016) Appendix B41c series, we apply
higher interest rates to the top 0.1% to match the interest rate differential observed in matched
estates-income tax returns for estates above $20 million. Concretely, this correction reduces
the fixed-income claims owned by the top 0.1% by a factor of 2 in recent years.23 Second, we
adjust the value of pass-through business wealth owned by the top 0.1% following Smith et al.
(2019). Smith et al. (2019) value the stock of S-corporations and other pass-through businesses
(partnerships, sole proprietorships) using a formula based on profits, book value of capital, and
sales that replicates what is done by financial analysts trying to value private equity. We follow
their adjustment and increase the value of the pass-through businesses owned by the top 0.1%
by a factor of 1.9 (adjusting the total wealth denominator accordingly). We apply the same 1.9
correction factor over time since 1962.
As shown by Figure 2, these two adjustments offset each other, except in recent years when
the interest-rate adjustment slightly dominates. The benchmark Saez and Zucman (2016) top
0.1% wealth share, updated in Zucman (2019), is 19.6% in 2016. In the modified capitalized-
income series presented in this paper, the top 0.1% share is 17.8%. In the SCF (with the Forbes
400 added back) it is 19.3%, closer to the original Saez and Zucman (2016) series (in all three
cases statistics are for tax units, similarly defined). The main difference is in terms of wealth
composition. The share of fixed-income assets in the top 0.1% in 2016 decreases from 42% in
the original Saez and Zucman (2016) series to 26% in the modified series. Meanwhile, the share
estimate top wealth shares using the capitalization method and assign higher interest rates to the rich.23Smith et al. (2019) assume an even higher interest rate for the rich. Namely, they assign Moody’s AAA
corporate bond yield to top 0.1% wealth holders. But this procedure overstates the interest rate at the topbecause most of the bonds held by mutual funds are Treasury, agency, and foreign sovereign bonds (about60%-70% vs. about 30%-40% for domestic and foreign corporate bonds in recent years, see Financial Accountsof the United State Table L.122) and the yield on sovereign and quasi-sovereign debt is lower than on privateAAA bonds (about twice lower in recent years). By contrast we rely on evidence from matched estates-incometax returns, the most comprehensive and direct evidence on yield differentials at the top of the US wealthdistribution. Smith et al. (2019) also implement 2 other changes: capitalizing equity using dividends and capitalgains but putting a lower weight on capital gains (Saez and Zucman, 2016 also conducted such a sensitivityanalysis); capitalizing property taxes using state specific multipliers (this has a minor effect on top wealth sharesbut is useful for creating state specific estimates).
10

of pass-through business wealth increases from 18% to 34%, which is more in line with what is
observed in the Survey of Consumer Finances.
Correcting estate multiplier estimates. The capitalized income estimates of Saez and
Zucman (2016) and the raw estate multiplier estimates of Kopczuk and Saez (2004) updated in
Saez and Zucman (2016) track each other well from 1916 to 1985 but diverge thereafter. The raw
estate multiplier estimates for recent decades are depicted in the bottom panel of Figure 3. They
show a modest increase in the top 0.1% wealth share from 7.5% in the early 1980s to around
10% in recent years. A top 0.1% wealth share around 10% is similar to Denmark (Figure 2B in
Jakobsen et al., 2019), one of the most equal country on earth. How could the United States
have the most unequal income distribution among advanced economies (Alvaredo et al. 2018)
along with the most equal wealth distribution? There is something wrong with the raw estate
multiplier estimates.
As discussed in detail in Saez and Zucman (2016, Section VII.B), there are two main potential
explanations for the diverging trends in recent decades. First, there might have been an increase
in estate tax evasion. Second, the estate multiplier estimates of Kopczuk and Saez (2004) fail
to incorporate the longevity gains of the rich (relative to average).
Longevity gains by the wealthy. The estate multiplier method blows up estates by the inverse
probability of death. Mortality rates by age, gender, and year for the full population exist but
the wealthy are likely to live longer. Kopczuk and Saez (2004) assume that the mortality rate
advantage of the wealthy is the same as the mortality rate advantage of college graduates in
the 1980s (Brown, Liebman, and Pollet, 2002). The correction factors of Kopczuk and Saez
(2004) are depicted in the top panel of Figure 3 (for males). Male college graduates in their
40s have mortality rates only 55% of the population average (for males of the same age). The
Kopczuk and Saez series use the same correction factors for all years, thereby ignoring the rising
life expectancy differential by income groups documented for recent decades by, e.g., Waldron
(2007) and Chetty et al. (2016).
Chetty et al. (2016) provide precise and granular mortality rates by income percentiles, age,
and year. The top panel of Figure 3 depicts the mortality rates of upper income groups relative
to average by age (for males) in 2012–2014.24 We depict three groups: the top 1%, the next
9%, and the next 10% (percentile 80 to 90). Two findings are worth noting. First there is a
strong mortality gradient within the top 20%. This suggests that it is not enough to consider
24Income is measured 2 years earlier or at age 61 whichever is less. Income is measured at age 61 at the latestbecause income falls substantially after that age due to retirement.
11
the relative mortality advantage of large groups such as college graduates when applying the
estate multiplier method. More granular corrections are required. Second, the mortality rate
for the top 1% is only about half of the mortality rate of college graduates used in Kopczuk and
Saez (2004).
The Chetty et al. (2016) data also provide a short time series, from 2001 to 2014. The time
series shows that the mortality rate of the top 1% (relative to average) decreased from 40.6% in
2001-3 to 30.7% in 2012-4 (for individuals aged 40 to 63). Using Social Security data, Waldron
(2007) shows that the life expectancy difference between males in the top half vs. bottom half
of the lifetime earnings distribution at age 60 was only 1.2 years for the 1912 cohort but 5.8
years for the 1941 cohort. Therefore, the mortality differential between the wealthy and the rest
was likely pretty small in 1980. Based on these data, it makes sense to use the Kopczuk and
Saez (2004) mortality advantage up to 1980 but then assume that the mortality rate advantage
increases (linearly) from 1980 to 2012 up to the level of the top 1% from Chetty et al. (2016).
The Chetty et al. (2016) data imply that Kopczuk and Saez (2004) overstate mortality at the
top by a factor 1.9 on average.25
As noted by Kopczuk (2015), using a mortality rate that is too high by a factor 1 +x lowers
the estimated top wealth share by a factor (1 + x)1/a where a is the Pareto coefficient of the
wealth distribution (equal to 1.5 based on the Kopczuk and Saez, 2004, estimates for recent
years).26 If we assume that the top 0.1% wealthiest Americans have the same mortality rate as
the top 1% income earners from Chetty et al. (2016), then the mortality rate in Kopczuk-Saez
is off by a factor 1 + x = 1.90. This implies that the Kopczuk-Saez wealth shares should be
inflated by a factor (1 + x)1/a = 1.92/3 = 1.53 in recent years. Concretely, instead of 10% in
recent years, the top 0.1% wealth share should be 15.3%.
The bottom panel of Figure 3 shows a step-by-step correction of estate multiplier series.
First, we start from the raw estimates from Kopczuk and Saez (2004), updated to 2012 in Saez
and Zucman (2016). Second, we smooth the series after 2000 to reduce noise.27 Third, we use
the mortality differential of the top 1% from Chetty et al. (2016) in 2012 and the Kopczuk-Saez
25To compute this average, we weight each age and gender by their weight in the top 1% distribution fromChetty et al. (2016). Chetty et al. (2016) do not provide data for ages below 40 (who hold 4.0% of the top.1% wealth according to SCF) and for ages above 76 (who hold 11.5% of the top .1% wealth). For those belowage 40, we assume the same ratio as for ages 40-41 namely 2.41 (as the small wealth there is in this group islikely concentrated among those close to age 40). For those above 76, we assume that the ratio is 1.27 which thestraight average of the age 75-76 ratio (1.54) and one (as the mortality advantage of the rich has to disappearfor the very old). In net we have: .040× 2.41 + (1− .04− .115)× .675/.343 + .115× 1.27 = 1.905.
26The reasoning is the same as for the effect of tax evasion that we spell out below.27As explained in Saez and Zucman (2016), Steve Jobs who died at age 56 in 2011 has a weight of 200 so
that his $7 billion wealth (from the Forbes 400) would weigh $1.4 trillion or 3% of aggregate wealth, enough toexplain the 2011 spike.
12
differential in 1980, with a linear adjustment between 1980 to 2012. Fourth, we convert the
individual adult estimates coming from estates into tax-unit based estimates (using the same
ratios of individual adult vs. tax unit top wealth as in Piketty, Saez, and Zucman, 2018). The
mortality adjustment (step 3) has a very large impact on the series.
In sum, improving the estate estimates with more accurate mortality rates has potential to
close about half of the gap between estate-based estimates and capitalized income estimates.
It is important to note that the mortality of the super wealthy might not be the same as the
mortality of high earners, as illness might reduce labor income (a flow) faster than wealth (a
stock). Future work using internal IRS data could directly estimate mortality rates by capital
income or capitalized income year by year. Since 2000, population-wide data would allow for
precise and granular estimates (as in Chetty et al. 2016). From 1979 to 1999, mortality rates
could be estimated more roughly as in Saez and Zucman (2016). Conditioning mortality rates
on marital status would also likely improve accuracy.
Estate tax evasion. One simple way to measure the growth in estate tax evasion is to assume
that this evasion is captured by the residual (growing) gap between the adjusted estate-based
top 0.1% wealth share and the other series depicted in the top panel of Figure 2. While some
forms of estate tax avoidance have always existed (see e.g., Cooper 1979), it is likely that tax
avoidance has increased substantially since the 1980s, as the political will to enforce the tax
declined (Saez and Zucman, 2019, Chapter 3). For example, in 1975, the IRS audited 65% of
the 29,000 largest estate tax returns filed in 1974. By 2018, only 8.6% of the 34,000 estate
tax returns filed in 2017 were audited.28 Researchers in the tax administration found that the
wealth reported by decedents from the Forbes 400 richest Americans on their estate tax returns
is only half the wealth estimated by Forbes magazine (Raub, Johnson, and Newcomb 2010).29
A wealth tax to measure wealth better. A well enforced wealth tax on a comprehensive
base would create the ideal administrative data to measure wealth. The situation is not unlike
before the start of the income tax in 1913. There were some estimates then of how much revenue
an income tax would bring but these estimates were imprecise. The development of the income
tax created a crucial tool to measure the concentration of income in the United States.
28These auditing statistics are published by the IRS annually and available online (US Treasury, InternalRevenue Service, 2019, Table 9a for year 2018 and US Treasury, Internal Revenue Service, 1976, Table 2, p. 89for year 1975).
29We discuss below potential issues with Forbes 400 estimates.
13

2.3 Revenue Projections
Revenue projections for a wealth tax depend on two key elements: how much wealth the rich
own, and what fraction of their wealth they could shelter from the tax. How much the rich own
depends on aggregate wealth and its distribution which we have discussed. We will discuss in
Section 4 the issue of tax evasion. Our main conclusion is that evasion depends on the design
of the wealth tax and the strength of enforcement. It is a policy choice.30 In this section, we
consider various scenarios for enforcement.
Pareto distribution and revenue. It is useful to estimate the tax base of the top 1%, top
0.1%, and top 0.01% richest Americans. We also consider the tax base above fixed nominal
cut-offs, $10 million and $50 million. The advantage of percentiles is that they are not tied to
a specific nominal value or currency.
As is well known since Pareto (1896), the top tail of the wealth distribution is well approxi-
mated by a Pareto distribution. Let p be a fractile (such as the top 1%) and wp the wealth at
threshold p. The fraction of people with wealth above w is given by a power law of the form
1 − H(w) = p · (wp/w)a where a > 1 is the Pareto parameter. The Pareto law relates two
fractiles p and q and their corresponding wealth thresholds wp, wq as follows p/q = (wq/wp)a or
log(p)− log(q) = a · [log(wq)− log(wp)].
A Pareto distribution has the property that the average wealth above a given threshold w
is given by b · w, where b = a/(a − 1) is a constant. Empirically the US wealth distribution
has a thick tail with a coefficient a ' 1.4 and hence b ' 3.5. Denoting by N the size of the
population, the tax base above wealth threshold wp (corresponding to percentile p) is Wp =
N · p · (b− 1) ·wp = (N · p · b ·wp)/a or 1/a times the total wealth of people with wealth above
wp. With a = 1.4, we have 1/a = .714 ' 70%. Concretely, if the wealth share of the top 0.1% is
20%, then the tax base above the top 0.1% wealth threshold is 70% of 20%, or 14% of aggregate
wealth, i.e., $13.1 trillion in 2019.
Evasion rate and revenue. How does tax evasion affect these computations? Suppose the
rich can hide a fraction h of their wealth. We consider two polar scenarios: (1) homogenous
evasion: everybody hides a fraction h of their wealth, (2) concentrated evasion: a fraction h of
taxpayers hide their entire wealth while a fraction 1− h reports truthfully. The real world is in
between these two polar cases.
30This is also the main conclusion from the analysis of tax evasion in the income tax context (see e.g., Slemrod1994, Slemrod and Kopczuk 2002).
14
For a wealth tax on the top fractile p, the tax base is scaled down by a factor 1 − h when
evasion is homogenous, as the share of reported wealth at the top relative to true total aggregate
wealth falls by a factor 1 − h. When evasion is concentrated, the tax base is scaled down by
less than 1− h.31
For a wealth tax above a fixed threshold w∗, the tax base is scaled down by a factor 1 − hwhen evasion is concentrated, as a fraction 1 − h of people with more than w∗ vanish. When
evasion is homogeneous, the tax base is scaled down by more than 1− h.32
Therefore, a rough rule of thumb is that hiding a fraction h of wealth reduces revenue by a
fraction h as well. If the exemption threshold is adjusted to always capture a given fractile, the
fraction of revenue lost will be somewhat less than h. If the exemption threshold is kept fixed,
the fraction of revenue lost will be somewhat higher than h.
Revenue projections. We project wealth tax revenue using the various wealth data sources
depicted in the top panel of Figure 2. The unit is always the family tax unit, not the individual
adult.33 Table 2 presents the results. The first three columns present estimates of the base
above specific percentiles (top 1%, top 0.1%, top 0.01%). The percentiles are defined relative to
the total number of family tax units in the economy (175 million in 2019). For example, the top
1% represents the top 1.75 million families. The statistics are reported assuming no tax evasion
(over and beyond tax evasion in the raw wealth data source). The last two columns display the
base above fixed nominal amounts (in 2019 dollars): $10 million and $50 million.
The latest capitalized incomes and SCF statistics are for the year 2016. We extrapolate them
to 2019 assuming no change in the distribution and using the Federal Reserve financial accounts
aggregates for 2019. Estates-based estimates are the average from years 2009-2012, corrected
for differential mortality (from Chetty et al., 2016), converted to tax units, and extrapolated to
2019 (assuming again no change in distribution).34
The bottom rows show by how much the tax base would shrink if taxpayers can hide a
fraction of their wealth (10% or 50%). We assume that tax evasion comes half and half from
intensive and extensive margins. We assume that the percentile thresholds would be adjusted to
always capture the same fraction of the population. In contrast, the nominal thresholds ($10m
31With a Pareto distribution, the factor is (1− h)1/a = (1− h)0.7. For example, with h = 0.2, the scale downfactor is 0.85 (instead of 0.80).
32With a the Pareto distribution, the factor is (1 − h)a = (1 − h)1.4. For example, with h = 0.2, the scaledown factor is 0.73 (instead of 0.8).
33Recall that we converted estate multiplier estimates into family based estimates.34For estates-based estimates, the wealth denominator is about 10% lower because it excludes annuitized
wealth (e.g., defined benefits pensions) that disappears at death. We conservatively assume that such annuitizedwealth is negligible among top wealth holders.
15

and $50m) are not adjusted, explaining why the revenue loss is larger. The last row shows the
implied estate tax evasion rate that would fully explain the gap between the tax base from the
capitalized incomes estimates and the tax base from the estate multiplier estimates.
The tax bases are quite close across the first three sources. For example, the tax base above
$50 million is $10.9 trillion according to the Saez and Zucman (2016) capitalized income series,
close to $10 trillion is the revised capitalized income series, and $9.5 trillion in the SCF. The
tax base is about 35% lower for the estate-based estimates ($6.8 trillion). Above the $10 million
cut-off, the SCF tax base estimate is larger than capitalized incomes ($25 trillion instead of
around $20 trillion). The SCF (after adding the Forbes 400) has slightly fewer super-rich than
the capitalized income estimates but it has more rich-but-not super-rich households in the $10
million to $50 million range.
With a top 0.1% wealth share of 20%, a wealth tax with an exemption threshold at percentile
99.9 has a base of 14% of aggregate wealth, which is $13 trillion in 2019 (assuming perfect
enforcement). Top 0.1% wealth share from estate tax statistics is only 15%, suggesting that the
evasion/avoidance rate for estate tax purposes is approximately 33% today. The estates-based
wealth tax base is approximately 35% lower as well.
Reconciliation with Summers and Sarin. Summers and Sarin (2019a,b) argue that the
wealth tax base above $50 million would only be $1.25 trillion (so that a 2% tax would raise
only $25 billion). All the estimates in Table 2, including the estates-based estimates, are much
larger. The SCF and the capitalized-income estimates deliver estimates about 8 times larger
than the Summers and Sarin estimates. Even the estates-based estimates deliver estimates 5.4
times larger than Summers and Sarin. The Forbes 400 alone represent (according to Forbes) a
tax base of $2.9 trillion in 2018, already more than twice the Summers and Sarin estimate. In
other words, based on capitalized-income or SCF (plus Forbes 400) data, Summers and Sarin’s
calculations amount to assuming an evasion rate of 85%.35
Why do Summers and Sarin (2019a,b) project such low revenue? They obtain their $25
billion revenue estimate by noting that the estate tax collected only $10 billion from estates
above $50 million in 2017 with a nominal tax rate of 40% (above $10 million). They assume
that 1 out of 50 rich people dies in a given year, so a wealth tax of 40% on the living population
(instead of decedents only) would collect 50 times what the estate tax does. Hence a wealth tax
at rate of 2% (1/20 of 40%) would collect 50/20 times what the estate tax does, i.e., $25 billion.
35Even if one takes the wealth estimates coming out of the raw estate multiplier method of Kopzcuk and Saez(2004) at face value, one would still find a tax base about 3.5 times larger than what Summers and Sarin find.
16
The Summers and Sarin methodology under-estimates the revenue potential of a wealth tax
for two main reasons. First, taxable estates are only one third of the net worth of decedents,
due to the full exemption of spousal and charitable bequests.36 But such deductions would not
apply for an annual wealth tax, which means that the Summers and Sarin estimate need to be
multiplied by a factor of three. Second, Summers and Sarin assume that 1 out of 50 rich people
dies in a given year. This multiplier of 50 approximately corresponds to the mortality rate used
in Kopczuk and Saez (2004). But we have seen that the mortality rate of the rich is lower than
this by a factor 1.9. Using the correct multiplier would further increase the Summers and Sarin
estimate by about 90%. Combining these two corrections increases the Summers-Sarin revenue
projection by a factor of 5.7 (3 × 1.9). This is enough to approximately reconcile the Summers
and Sarin revenue estimate with our estimate based on estates tax data in Table 2.37
3 Role in Overall Tax Progressivity
3.1 Tax Progressivity
Wealth taxes are very progressive, because net wealth is more concentrated than income. Wealth
taxes are more progressive than property taxes, because property taxes are only levied on real
estate, which is more equitably distributed than net wealth (Saez and Zucman, 2016). Wealth
taxes also more closely track ability to pay than property taxes because they allow people to
deduct debts. The progressivity of a wealth tax depends on how high the exemption threshold
is and on whether a graduated rate schedule is applied among taxpayers.
Saez and Zucman (2019) estimate effective tax rates (including all taxes at the federal, state,
and local levels) by income groups. We can use our data on the joint distribution of income and
wealth (Piketty, Saez, and Zucman 2018) to estimate the effect of the wealth tax on the overall
progressivity of the current US tax system.
Tax rate on the top 400. One justification for a wealth tax is to increase the effective tax
rate on the very wealthiest Americans who may not realize much income and hence may pay
low effective tax rates today. The top of the Forbes 400 list includes founders-owners of large
36For estate filed in 2017, total deductions are 67.9% of the net estate for gross estates above $50 millions. Outof the 67.9%, 40 points come from the spousal bequest deduction and 20 points from charitable bequests (onlineat https://www.irs.gov/statistics/soi-tax-stats-estate-tax-statistics-filing-year-table-1).
37There are other smaller differences. Summers and Sarin implicitly score a wealth tax on individual (notfamily) wealth above $50 million, which mechanically reduces the base by about a quarter according to SCFdata for 2016. Conversely, the estate tax applies starting at a lower threshold of $10 million so there is aninfra-marginal tax below $50 million that should not be counted.
17

companies (Jeff Bezos with Amazon, Bill Gates with Microsoft, Warren Buffett with Berkshire
Hathaway, Mark Zuckerberg with Facebook). Of these four companies, only one (Microsoft)
pays dividends. For as long as Bezos, Buffett, and Zuckerberg do not sell their stock, their
realized income is going to be minuscule relative to their wealth and true economic income.
For example, Buffett disclosed that his fiscal income–defined as adjusted gross income reported
on his individual income tax return–has been in the tens of millions while. Since his wealth
is in the tens of billions, the realized return on his wealth is of the order of 0.1%.38 Bezos’,
Buffett’s, Zuckerberg’s, and Gates’ companies are also multinational companies which can book
a substantial share of their profits in tax havens to reduce their corporate income tax (Zucman,
2014).
How much the top 400 wealthiest Americans report in fiscal income—and hence pay in
income taxes—is a central question for the desirability of a wealth tax. Absent direct evidence
on the income taxes paid by the Forbes 400, we need to triangulate using various sources.
We use three sources which turn out to provide consistent results. Table 3 summarizes the
computations.
First, the IRS provides statistics on linked estate and income tax data. Bourne et al. (2018)
study the link between wealth on the estate tax return for 2007 decedents and fiscal income
over the last 5 years preceding death (2002-2006). In the highest $100 million and above wealth
category they consider, reported capital income (averaged in 2002-2006 and expressed in 2007
dollars) is 3.0% of 2007 wealth (their Figure 4). In national and financial accounts, the ratio of
aggregate capital income in 2002-2006 to aggregate wealth in 2007 is 5.9%. This suggests that
reported capital income of the wealthiest decedents is only 51% of their true income (assuming
conservatively that the wealthy obtain a return on their wealth equal to the aggregate return).
One objection is that the wealthy may avoid realizing capital gains toward the end of their life,
since unrealized capital gains benefit from the step-up of basis at death but Bourne et al. (2018)
show that realized capital gains are very large in their sample, on average 45% of capital income
(their Figure 2).
Second, the SCF provides information on the joint distribution of wealth in year t and fiscal
income in t − 1. In 2016, the ratio of fiscal income to wealth was 3.21% for the top 0.001%
wealthiest Americans (wealth above $650 million, 86 records in the public SCF) and 3.20%
for the top 0.01% (wealth above $190 million, 465 records). This 3.2% rate of return is only
38Buffett’s fiscal income was $63 million in 2010 when his wealth was $45 billion and $12 million in 2015 whenhis wealth was $65 billion. Some billionaires do report substantial incomes (relative to wealth). In August 2019Tom Steyer disclosed that he reported $1.2 billion in income over nine years (2009-2017) when his Forbes 400wealth in 2018 is estimated at $1.6 billion.
18
50% of the 6.4% aggregate capital-income-to-wealth ratio in 2016. Earlier waves of the SCF
provide similar results, which is re-assuring given the small sample sizes. These SCF results are
very similar to the IRS linked-estate-and-income-tax results, and not subject to the issue that
realized capital income might be particularly low just before death.
Third, the IRS provides statistics on the top 400 highest earners, a group we call the IRS
top 400. In 2014, the latest year available, the IRS top 400 had an average fiscal income of $317
million. The Forbes 400 wealthiest have by definition less fiscal income than this on average.
How much less? To address this question, we relate the fiscal income of top income earners to
the fiscal income of top wealth holders in the SCF. In the 2016 SCF, the top 0.001% earners
(sample of 64) reported fiscal incomes that were 6.7% of the wealth of the top 0.001% wealth
holders. This is approximately twice the income of the top 0.001% wealth holders mentioned
above. Averaged across all SCF years from 1998 to 2016, this ratio is 2.3 on average.39 This
result shows that there is indeed substantial re-ranking in wealth vs. reported income. Based
on this finding, we estimate that the Forbes 400 wealthiest Americans have a reported income of
$158 million ($317 million divided by the ratio of 2). In 2014, the average wealth of the Forbes
400 was $5.725 billion. So the fiscal income of the Forbes 400 was 2.77% of their wealth, which
is only 41% of the 6.77% economy-wide return on wealth in 2014. If we make the conservative
assumption that the return on wealth for the Forbes 400 is the same as the economy-wide return,
fiscal income for the Forbes 400 is only 40% of their true economic income.40
In sum, using three different sources and methodologies, we find that top wealth holders
have a fiscal income that is slightly less than half of their true economic income (defined as
wealth times the average macroeconomic return to wealth). In what follows, we assume that
the Forbes 400 have a ratio of fiscal income to true economic income of 45% (population-wide,
this ratio is around 70%).41 The super wealthy do not realize as much income as the average
person, but on average they realize substantially more than what Warren Buffett disclosed.
Naturally, our 45% estimate based on triangulating the best available sources could be refined
in future work.42
39For the top 0.01% (instead of top 0.001%), this ratio is also 2.0 on average from 1998 to 2016.40Similar estimates would be obtained for other years using the same methodology.41In the Piketty, Saez and Zucman (2018) micro-files, the ratio is about 65% for the top 400 in recent years.
It is too high because wealth is imputed based on realized fiscal income. We plan to address this issue in futureresearch.
42For example, linking the Forbes 400 to income tax data would allow for a direct estimation of the fiscalincome of the 400 richest. Similar linking for research purposes has already been done in the context of estatetax data by Raub, Johnson, and Newcomb (2010). A well enforced wealth tax would be an even better sourceto study this question in depth.
19

Effects of wealth taxation on overall tax progressivity. Figure 4 depicts the average
tax rate by income groups in 2018, the year following the passage of the Tax Cuts and Jobs
Act. All federal, state, and local taxes are included. Taxes are expressed as a fraction of pre-tax
income, a comprehensive measure of income before governments taxes and transfers (other than
Social Security) that adds up to total national income (Piketty, Saez, and Zucman, 2018). P0-10
denotes the bottom 10% of adults, P10-20 the next 10%, etc. The economy-wide average tax
rate is 28%. Tax rates in the bottom seven deciles are slightly lower than average (25% instead
of 28%). Tax rates between percentiles 80 and 99.9 are very slightly higher than average (around
29%). The tax rate peaks at 33% for P99.9-99.99 (i.e., the bottom 90% of the top 0.1%). The
tax rate then falls above P99.99 and is lowest for the top 400 at 23%. Taking all taxes together,
the US tax system looks like a giant flat tax with similar tax rates across income groups but
with lower tax rates for billionaires.
A wealth tax such as the one proposed by Elizabeth Warren would have a large impact on
progressivity within the top 0.1%. To illustrate this point, we use the capitalized-income wealth
estimates and assume that the wealthy would hide 15% of their wealth. The tax rate on the
top 0.1% excluding the top 0.01% would increase modestly by 4 points. The tax rate in the
top 0.01% would rise by 14 points. Among the top 400, the tax rate would double from 23%
to 46%. A wealth tax with a high exemption threshold ($50 million) and a marginal tax rate
of 2% (3% above $1 billion) would have a major impact on progressivity. It would restore tax
progressivity at the top to levels last observed in 1980 (Saez and Zucman, 2019, Chapter 7).
3.2 Alternatives
Several alternatives to increase tax progressivity have been proposed (see, e.g., Batcheler and
Kamin, 2019 for a recent detailed discussion).
Taxing realized capital gains better. There is a widespread recognition that capital gains
are not taxed systematically. The step-up of basis at death is the largest and most inefficient
loophole (charitable giving of appreciated property is another one). Conversely, the fact that
price inflation is not taken into account when computing realized gains adds a “wealth tax” rate
layer (equal to the rate of inflation times the tax rate on realized gains). But it is a capricious
wealth tax that varies with the inflation rate and hits only gains eventually realized. Most
economists agree that closing the step-up of basis loophole and adjusting gains for inflation
would be a good idea. This would make the tax base less elastic (as everybody eventually
dies or disposes of assets) allowing to increase the tax rate on capital gains and possibly align
20

them to ordinary tax rates. The key remaining issue would be that the tax might come with
substantial delay for very wealthy individuals who are still fairly young and do not need to sell
their stocks (e.g. Mark Zuckerberg).
Taxing capital gains on accrual. One solution to remedy the delayed realization problem
is to tax capital gains on accrual (or mark-to-market taxation).43 The main difficulty is that
there is a lot of year-to-year fluctuation in assets prices.44 An appreciation of 20% (which is
not uncommon) taxed at 40% could amount of a very large wealth tax of 8%. The tax would
be particularly heavy on entrepreneurs. For example, Zuckerberg has had a 40% annual growth
in wealth since 2008, a mark-to-market tax at 40% would amount to a 16% annual wealth
tax. Taxing capital gains on accrual means a heavy tax on entrepreneurs growing a successful
business and building up wealth. In contrast, the wealthy rentier or heir who is invested in
bonds or mature stock might not be taxed much. This is in contrast with a wealth tax which
is based solely on wealth and not returns.45
Merging wealth taxation and capital gains taxation. Taxing realized capital gains only
means that the tax is delayed. Taxing capital gains on accrual means capricious taxation based
on the ups and downs of volatile financial markets. An intermediary solution would be to
keep track of unrealized capital gains and have a pre-paid withholding tax kick in whenever
such unrealized gains exceed some amount. For example, unrealized real capital gains above
$1 million, would face a recurring annual tax of 2% but the tax would be credited back when
capital gains are realized. The withholding tax could be made progressive with higher tax rates
on very large amounts of unrealized gains.46 Such a tax would ensure more timely payment
and as it is a withholding tax, the issue of imperfect or imprecise valuation is not as critical.
In practice, such a withholding tax on unrealized capital gains would look quite similar to a
wealth tax (except that the withholding tax is refundable upon realization and does not hit
43See Weisbach (1999) for a detailed proposal.44For hard to value assets, such as private equity, generally, the mark-to-market tax is applied only when
the asset is sold retrospectively. The tax can be computed as if a tax had been owed each year, what is called“retrospective taxation” an idea originally proposed by Auerbach (1991) (see Batcheler and Kamin, 2019 for arecent discussion).
45Some assets such as gold in a safe, or unused real estate or land for example do not generate economicreturns. A wealth tax could actually be an impetus for individuals to use their wealth more efficiently andobtain better returns. Gold can be put to use as jewelry, real estate can be rented, land can be farmed, etc.The economic advantage of the wealth tax (relative to the income tax) is that it does not tax the generationof income, and hence gives better incentives for people to use their wealth efficiently, a point made by MauriceAllais in the 1940s (see Allais, 1977). See Guvenen et al. 2017 for a recent economic model along these lines
46And the tax would apply only if cumulative tax paid is below the tax owed upon realization of all gains.
21

large wealth holdings with no unrealized gains).47
The wealth tax as a minimum tax on income. If the primary goal of the wealth tax is to
correct the regressivity at the very top (due to low income realization relative to true economic
income), the wealth tax could be set as a minimum income tax that kicks in only when the
wealth tax is larger than the income tax. Colombia has had such a system where the income
tax is based on the maximum of reported income and presumptive income defined as 3% of
wealth (Londono-Velez and Avila, 2019). The advantage of this system is that such a wealth
tax would clearly be constitutional.48
4 Tax Enforcement
4.1 Tax Avoidance and Evasion
A natural starting point to think about tax avoidance is the experience of the many countries
that implement or have implemented a wealth tax.
Overall responses. A number of studies estimate the response of reported wealth to a change
in the wealth tax rate. Note that such estimates do not directly tell us how much tax avoidance
or evasion there is overall but rather look at how changes in the tax rate affect the level of
wealth reported. Short run responses likely capture tax avoidance/evasion (as real responses
are expected to take longer).
Bunching studies. A wealth tax above a given threshold creates incentives to report (or reduce)
wealth to just below the threshold to avoid the tax. Hence, there should be bunching in the
distribution of wealth at the exemption threshold. The amount of bunching is proportional to
the size of the behavioral response and can be used to recover the elasticity of reported wealth
with respect to the tax rate (see Kleven 2016 for a survey of this bunching methodology). Seim
(2017) finds clear evidence of bunching at the exemption threshold for the Swedish wealth tax.
This implies that there is a behavioral response to the wealth tax but it is quantitatively small:
a 1% marginal wealth tax rate reduces reported wealth by .2% only. The response comes from
self-reported assets suggesting that it is driven by avoidance/evasion rather than real response.
Jakobsen et al. (2019) also use a bunching design in the case of the Danish wealth tax and find
47Such a tax could also be integrated with the estate tax by making it creditable for estate tax purposes aswell so that it also represents a pre-payment on the estate tax that comes late by definition.
48The constitutionality of a straight wealth tax is debated among legal scholars and hence would effectivelydepend on the make-up of supreme court (see e.g. Ackerman 1999).
22

even smaller elasticities. Londono-Velez and Avila (2017) using again bunching methods, find
a larger avoidance/evasion responses: a 1% marginal wealth tax rate reduces reported wealth
by about 2-3% in the context of Colombia where third party reporting is much less developed
than in Sweden. In both cases, the bunching methodology provides very compelling evidence of
behavioral responses but perhaps not its full magnitude. If many filers ignore the exact details
of the tax system but still respond to the overall tax, the total response could be much larger.49
Diff-in-diff studies. In Denmark where third-party reporting is extensive, Jakobsen et al. (2019)
use a difference-in-difference approach as well and find estimates substantially larger than their
bunching estimates. In particular, they find a growing effect of wealth taxes on reported wealth
(possibly through a combination of avoidance and real responses). In Switzerland, where there
is no third-party reporting of financial wealth (due to bank secrecy), Brulhart et al. (2016) find
very large responses to wealth taxation: a 1% wealth tax lowers reported wealth by 23-34%.
This extremely large estimate is extrapolated from very small variations in wealth tax rates
over time and across Swiss cantons and hence is possibly not as compellingly identified as the
other estimates based on larger variations in the wealth tax rate.
Let us now turn to responses along specific dimensions.
Exploiting asset exemptions. Wealthy taxpayers can take advantage of asset exemptions to
avoid the wealth tax. Alvaredo and Saez (2009) provide a striking illustration in the case of the
Spanish wealth tax which exempted closely held stock when the business owner is substantially
involved in the management and owns at least 15% of the company stock (but such exempted
stock remained reportable). In 1994, the first year the exemption was introduced, exempted
stock represented only about 15% of total closely held stock reported by the top 0.01% wealth
holders. By 2002, the fraction had grown to 77%. The 10 year long time series from 1993 to
2002 shows stability in the value of taxable plus tax exempt closely held stock among top wealth
holders implying that the behavioral response comes from shifting from taxable to non-taxable
closely held stock rather than a supply side effect of more business activity (Figure 10, p. 1159).
This example shows that exempting assets can seriously undermine the wealth tax.
Hiding assets abroad. Wealthy individuals can try to hide assets abroad to evade income
and wealth taxes. Zucman (2013, 2015) and Alstadsæter, Johannesen, and Zucman (2018)
provide evidence on the amount of wealth held in tax havens for each country in aggregate.
49This issue affects bunching studies in income tax contexts as well as discussed in Kleven 2016.
23

They estimate that US residents hold about 9% of US national income in offshore wealth or
about 2% of total US household wealth.
Recent evidence from customer lists leaked from offshore financial institutions matched to
administrative wealth tax records (in Scandinavia and Colombia) shows that offshore tax evasion
is highly concentrated among the rich. Alstadsæter, Johannesen, and Zucman (2019) show that
about 75% of wealth hidden offshore is owned the top .1%. This implies high rates of tax evasion
at the top: the 0.01 percent wealthiest households evade about 25 percent of their taxes through
offshore tax evasion. London-Velez and Avila (2019) shows a rise in the use of offshore entities
following the reintroduction of wealth taxation in Colombia. The use of offshore accounts is
also extremely concentrated in Colombia. Interestingly, the Panama papers leak generated a
800% surge in the use of voluntary disclosure Amnesty scheme. All in all, 40% of individuals in
the top .01% used the Amnesty scheme implying that offshore tax evasion is very high but also
very responsive to policy enforcement.
Extrapolating these findings to the US would imply that out of the 2% of total US household
wealth hidden in tax havens, about 1.5 points are owned the top .1% which would increase their
wealth share from 20% to 21.5%.
Wealth concealment is a serious enforcement concern. However, just like for legal avoidance,
illegal evasion depends on policies and can be reduced through proper enforcement. Key to
reducing evasion are (i) the collection of comprehensive data; (ii) sanctions for the suppliers of
tax evasion services (the countries and financial intermediaries that facilitate it); (iii) proper
resources for auditing. In terms of data collection, the United States has taken an ambitious
path forward with the 2010 Foreign Account Tax Compliance Act (FATCA) that requires all
foreign financial institutions to identify and report their U.S. customers to the IRS.
Expatriation. Another way to avoid taxes is to expatriate. There is some evidence that
residential decisions of the wealthy are sensitive to taxes on wealth. Moretti and Wilson (2019)
show that the Forbes 400 residential decisions are sensitive to state level inheritance taxes (using
as identification the repeal in 2004 of the federal estate tax credit for state inheritance taxes
that made state level taxes relevant after 2004). Martinez (2017) shows, in the Swiss context,
that a sharp decrease in the income tax progressivity in the canton of Obwalden in 2006 did
increase the share of rich taxpayers in the canton by 20-30% relative to neighboring countries.
There is a recent body of work showing that high earners, such as football players in the EU,
innovators, or highly skilled workers residential decisions are sensitive to taxes (see Kleven et
al. 2019 for a recent survey). However, in all cases where large responses are found, it is in
24

situations where three conditions are met: (1) mobility is easy (such as across Swiss cantons or
US states), (2) mobility is allowed (EU football players did not move much in response to tax
differentials before teams were freely allowed to hire foreign players, Kleven et al. 2013), (3)
mobility reduces taxes. These conditions may be affected by policy, especially the last one.
In particular, avoiding taxes through residential mobility is particularly difficult for U.S.
citizens because it requires renouncing U.S. citizenship, since U.S. citizens living abroad are
liable for U.S. taxes (with credits for foreign taxes paid). The United States also currently has
an exit tax to deter expatriation with over $2 million in net worth. Individuals renouncing their
citizenship are required to pay income tax on all their unrealized capital gains. Building on
the existing exit tax, Sen. Warren’s proposal would introduce an exit tax of 40% of net worth
which would greatly reduce incentives to expatriate for tax reasons. Therefore, the threat of
expatriation is primarily a policy variable.
4.2 Why Have Wealth Taxes Been Abandoned in a Number of Eu-ropean Countries?
As pointed out in the recent study of progressive wealth taxation by the OECD (2018), 12
OECD countries (all of them in Europe) had progressive wealth taxes in 1990, but only 4 still
had wealth taxes in 2017 (Switzerland, Spain, France, and Norway). As of 2019, four OECD
countries levy a progressive wealth tax on individuals.50 The decline of wealth taxation abroad
is one of main arguments used by skeptics in the US debate (see e.g., Summers and Sarin,
2019a, b). It is important to understand why wealth taxes have been repealed in a number of
European countries.
Mobility. In the European public debate, the concern that the rich or their wealth will flee
abroad is the most frequently used argument by opponents. For example, french President
Macron transformed the french wealth tax in a real estate property tax in 2018, with the main
argument being that real estate cannot move abroad while people or financial wealth can. The
rich can evade the wealth tax by putting their wealth in offshore tax havens (e.g., Switzerland)
which do not share information with foreign tax authorities. This is evasion as wealth taxes are
based on the global wealth of residents regardless of the location of the assets or the financial
institutions managing the assets. The rich can also avoid the wealth tax by moving their
residence to foreign countries as wealth taxes are generally based on residence. These two issues
50France has eliminated its progressive wealth tax (and replaced it by a real estate property tax) and Belgiumhas introduced a modest wealth tax.
25
are potentially serious in the European context. Alstadsæter, Johannesen, and Zucman (2019)
document substantial tax evasion of the rich in Norway through offshore accounts. There is less
evidence on the mobility of the wealthy but there is clear tax competition across EU countries
which try to attract high earners or high wealth residents from other countries with special tax
breaks. Most of these tax breaks are focused on high earners (see OECD 2011 for a description
of such tax breaks) but some are focused on high wealth individuals. For example, Switzerland
works out customized deals with wealthy individuals. Portugal and Italy provide income tax
breaks for retirees (which is most valuable for high pension retirees).51
In the public debate, mobility of the wealthy vs. mobility of their bank accounts vs. mobility
of the capital they ultimately own is often confused. Because progressive wealth taxes are based
on the worldwide wealth of individual residents, wealth taxes do not generate incentives to move
capital abroad. Hiding wealth abroad does reduce taxes but this is tax evasion and in general
the underlying assets (stocks and bonds) can be the same whether the wealth is held through
offshore vs. domestic bank accounts.
However, the central point is that this “European context” is not a law of nature but results
from policy choices (or non-choices). Other choices could lead to radically different outcomes
in terms of tax evasion and tax competition.
First, EU efforts at curbing offshore tax evasion have been weak. As shown for example by
Johannesen and Zucman (2014), half hearted tax enforcement efforts can be easily circumvented
and end up having minimal effects on tax evasion. In contrast, the US has taken a bold
step in the enforcement direction with FACTA in 2010 that imposes steep penalties on foreign
financial institutions that fail to report accounts of US residents to the US tax authorities (see
Zucman, 2015 for a detailed discussion). It is possible to curb offshore tax evasion because
such evasion is done through large and sophisticated financial institutions that keep records and
know the ultimate owners of the accounts (even if such accounts are held through offshore shell
corporations to make it more difficult for tax authorities to link the accounts to owners). As the
recent leaks from HSBC, UBS, and the Panama Papers, have shown, such financial institutions
maintain the names of their clients. Such data can easily be linked to tax data (indeed this is
what the recent research studies by Alstadsæter, Johannesen, and Zucman, 2019 and Londono-
Velez and Avila 2019 have done). The multiplicity of leaks also shows that clients are at risk of
seeing their accounts disclosed.
FATCA follows the route of policing directly foreign financial institutions but with the diffi-
51Since 2009, Portugal exempts foreign pensions from taxation. Starting in 2019 in Italy, new immigrants whoreceive foreign pensions benefit from a special low tax rate of 7% only for their first 6 years of residence in Italy.
26

culty that the US tax authorities have less power to audit effectively foreign financial institutions
than home financial institutions. Another route is to get foreign governments to share the in-
formation they can collect from their financial institutions. The second route is best in the
long-run but likely more difficult to establish as it requires international cooperation.52
Second, how much residence decisions of the wealthy are affected by taxation is also heavily
dependent on policy. The EU is organized to foster such tax competition. Individual income
and wealth taxation depends solely on current residence. Hence, when France had a progressive
wealth tax before 2018, moving from Paris to London would extinguish immediately progressive
wealth tax liability (except for domestic real estate assets). The Macron reform keeps the wealth
tax only on domestic real estate assets; this is an explicit surrender to tax competition. What
is more, EU countries have schemes to lure away the high skill or the wealthy from their home
countries by promising tax breaks to movers. Contrast this with US policy: US citizens remain
liable for US income taxes for life and regardless of residence (but with full credit for foreign
income taxes paid). The only way to escape the US income tax is to renounce US citizenship
and even then, the US imposes a substantial exit tax. The exit tax, formally known as the
expatriation tax, is essentially a tax on all unrealized capital gains upon expatriation. It applies
to high income (incomes over $160,000) or high wealth (wealth above $2 million) expatriates.
It applies to citizens who renounce citizenship and also to long-term residents who end their
US resident tax status.53 The wealth tax proposal by Elizabeth Warren proposes to further
strengthen the exit with a 40% wealth tax on expatriates’ assets. Such exit taxes can effectively
eliminate incentives to exit for tax reasons. While the EU and the US are the two polar opposites
along this tax competition dimension, midway solutions are possible and probably preferable.54
For example, movers could remain tax liable in their country of origin (but with full foreign tax
credit) for a certain number of years (for example 5 years). This would essentially negate the
effects of special schemes set up to attract high income foreigners which are typically temporary.
While countries in the EU generally have bigger governments, more social spending, and
more regulations than the United States, it is the reverse with the EU super-structure that
actually promotes policies that constrain governments more than what is done in the United
States: this is true for tax competition, but also for government deficits, and monetary policy.
52At the level of the EU, it is almost impossible to make progress on this front as any change requires unanimousagreements of all EU countries some of which are net beneficiaries of lax enforcement.
53See https://www.irs.gov/individuals/international-taxpayers/expatriation-tax for a descriptionof the expatriate tax regulations.
54The US system imposes a lifetime tax filing burden to US citizens who have lived abroad sometimes fordecades and who might not be very rich.
27

Fairness. Opposition to the wealth tax also arises from a feeling of unfairness: “the wealth tax
aggravates millionaires without bothering billionaires.”55 Aggravated millionaires are taxpayers
wealthy in illiquid assets (or at least wealthy enough to be above the exemption threshold) but
poor in cash. As a result, such taxpayers feel the wealth tax as a heavy and unjust burden. In
France, for example, some retired farmers on Ile de Re living on a small pension but owning very
valuable land, due to the real estate boom for secondary residences, became liable to the wealth
tax. In Denmark, there were complaints that historical castles’ owners were liable to the wealth
tax but had no income to pay the tax. The United States does not have a progressive wealth
tax but has a long experience with real estate property taxes. The property tax also generates
strong opposition when rapid tax appreciation leads to increasing property tax bills hitting
people on fixed incomes (such as retirees or widows) hard.56 A classical complaint against the
US estate tax is also that it can force the sale of family businesses or farms that have high
market value but no little liquid assets.
Obviously, to an economist, such complaints do not make sense as wealth is by definition
marketable and credit markets are supposed to function well when there are collateral assets.
But humans often do not behave as our standard perfectly rational economic model predicts:
people may not want to sell family estates or businesses, or even borrow against them. Such
“behavioral effects” have consequences and need to be taken into account for policy making.
Indeed, in practice, stories of “aggravated millionaires” can fuel successful lobbying against
wealth taxation. This leads to three types of reforms of the wealth tax that undermine the
integrity of the wealth tax.
Limitations based on fiscal income. First, a number of countries have introduced tax limitations
whereby the sum of the wealth tax and the income tax cannot exceed a certain percent to total
fiscal income. As we discussed above, this precisely defeats the main purpose of the wealth tax
as the ultra rich can find ways to report very low fiscal income relative to their true wealth or
true income. As a result, this type of tax limitation ends up exempting billionaires.
Base erosion. Second, special treatment is introduced for assets more likely to be illiquid such
as real estate assets and business assets. For example, the French and Spanish wealth taxes
exempted business assets when the owner is substantially involved in the business. As mentioned
above, when Spain exempted business assets from its wealth tax in 1994, top wealth holders
55This statement was made by Dominique Strauss-Kahn in 1997 when he was Minister for Economics, Fi-nance and Industry in the French center-left government of Lionel Jospin: “l’impot sur la fortune embete lesmillionnaires sans gener les milliardaires”.
56Wong (2019) shows that indeed property tax increases following re-appraisals increase financial hardshipmeasures such as delinquencies on mortgages.
28

were able to increase sharply the fraction of wealth held in the form of business assets, creating
both efficiency costs and reducing the tax progressivity (Alvaredo and Saez, 2009). In France,
the very richest taxpayers were typically able to incorporate and deduct such assets from wealth
taxation. In the case of wealth taxation, exempting some asset classes is particularly damaging
as marketable wealth can by definition be traded and hence converted into tax exempt wealth.57
Non-market values. Third, a number of countries have also used non-market values for some
asset classes such as real estate. As discussed in Piketty (2014, Chapter 15), the early progressive
wealth taxes in Prussia and Sweden used assessed values for real estate linked to the land/real
estate registries (“cadastral values”) and typically not updated with market prices. However,
with rapid inflation, such assessed values can quickly lag behind market prices. Spain today
for example uses low assessed values for wealth tax purposes. While this can provide relief to
some of the aggravated millionaires, in the long-run, this undermines the horizontal equity of
the wealth tax. Indeed, the German wealth tax was repealed in 1997 following a ruling by
the Constitutional Court that demanded equal taxation of all property. As US states know,
there is a tension between using market prices for real estate property taxes vs. introducing
property tax assessment limits. The use of market prices in a context of fast price increases led
to the famous tax revolt Proposition 13 in California in 1978 that froze real estate assessment
for property taxation to purchasing prices (with only a 2% annual adjustment). Four decades
later, the property tax in California has huge horizontal inequities: long-term residents can pay
one-tenth of what a new resident pays for identical homes. A number of US states have also
passed some forms of property tax assessments limits, often following ballot initiatives.
The cleanest solution to liquidity issues is to increase the exemption thresholds so that mere
millionaires are not liable. This route was followed for the US estate tax. The exemption was
increased from $1 million to $5 million by the Bush administration. The main argument was that
the “death tax” was also killing family businesses or family farms. With the higher exemption
threshold, the estate tax is harder to kill, as this argument is much harder to make. For example,
the recent tax reform TCJA of the Trump administration did not eliminate the estate tax even
though this was an initial goal of the reform. Instead, the reform doubled the exemption level
to $11.2 million (in 2018). The recent wealth tax proposal by Elizabeth Warren has also a very
high exemption level of $50 million which is 50 times higher than typical European progressive
wealth taxes. As a result, the policy debate on the proposal has not emphasized the issue of
57While there can also be income shifting for income tax purposes when some income forms are treatedpreferentially, such shifting is likely to be more limited than for wealth. Most wage earners for example wouldnot be able to transform their income into corporate profits, dividends or capital gains.
29

illiquid wealth and lack of cash.58
What lesson do we draw from the decline of progressive wealth taxes in Europe? First,
history shows that wealth taxes are fragile. They can be undermined by tax limits, base erosion,
and weak enforcement. When wealth taxes were repealed in Europe, it was primarily because
policymakers took the view that tax competition and offshore tax evasion were a given, making
a wealth tax too hard to enforce. This somewhat nihilistic view is, however, incorrect: tolerating
tax competition and tax evasion is a policy choice. Developing policies to curb evasion and tax
competition was hard for a single country, in a context where until recently little was done to
tame tax competition and offshore evasion at the EU level; but the US context today is different.
European wealth taxes were also undermined because of a poor policy response to complaints
by merely rich taxpayers. Instead of increasing the exemption threshold, the responses eroded
the base or created tax limitations that benefited billionaires the most. Drawing the lesson from
this experience, a US wealth tax could avoid this pitfall.59
4.3 Enforcing a US Wealth Tax
The key to successful modern income taxation is information reporting by third parties such
as employers and financial institutions (Kleven et al. 2011). This reporting allows the tax
administration to get direct information on most income sources so that self-reporting is reduced
to a minimum. The same principle should be followed for the wealth tax. Taxpayers and the IRS
would receive information returns from financial institutions showing the value of their assets
at the end of the year. For administrative success, it is essential that such third-party reporting
cover the widest possible set of assets and debts (just as the income tax is most successfully
enforced on the types of income with third-party reporting). A wealth tax also requires policies
regarding information reporting, the valuation of assets, the treatment of trusts, among other
design considerations. We discuss these below.
58Another possibility that seems most natural to economists is to provide credit (if markets fail to providesuch credit) to “aggravated millionaires”. One simple way to do so would be to allow taxpayers to borrow fromthe government to pay the wealth tax and repay the loan when the illiquid assets are sold or transferred. Forexample, the US estate tax allows to spread payments over 15 years at low interest for illiquid estates. Somestate property taxes also allow tax deferral in special cases (such as elderly or disabled homeowners in Texas).In practice, such tax deferrals are rarely used. Aggravated millionaires or homeowners dislike borrowing topay taxes whether it is borrowing on the private market or from the government. Therefore, it is probablyeconomists’ utopia to believe that creating credit markets will resolve the issue.
59If the tax exemption threshold were lowered considerably, complaints from the merely rich would easilyarise. In this case, one potential solution would be to provide credits for local property taxes paid which wouldeffectively protect real estate assets, the most common form of illiquid assets among the merely rich, from thefederal wealth tax.
30
Information reporting. The most important extension of the current information reporting
system would be to require financial institutions to report year-end wealth balances to the IRS.
In some cases, this could potentially be combined with existing information reporting for capital
income payments, while in others it would require new forms. For many types of assets, this
information is already stored by third parties (typically financial institutions) so reporting it to
the IRS would be straightforward. Information reporting requirements could be readily applied
to many types of assets and liabilities including checking and savings accounts, publicly listed
stocks, bonds, and mutual funds.
• Interest-bearing assets (deposits, saving accounts, bonds, etc.): information returns 1099-
INT already provide information on all interest income. They could also report the out-
standing balance. This requirement could be extended to non-interest paying accounts
such as zero-interest bank deposits.
• Publicly listed stock: Forms 1099-DIV for dividend income would report the market value
of the corresponding stock holdings (and this requirement could be extended to non-
dividend paying stock).
• Assets indirectly held through mutual funds: Mutual funds already provide information
returns on income earned through mutual funds. It would be easy to add a balance
reporting requirement on all mutual funds held by U.S. residents.
• Defined contribution pension assets: The current reporting requirement of IRA balances
(form 5498) could be easily extended to all defined contribution plans such as 401(k)s.60
• Defined benefits pension assets: Pension distribution forms 1099-R could report whether
the distribution is an annuity (so as to be able to compute the value of defined benefits
pensions for current pensioners).
• Vehicles: States already systematically register vehicles (including luxury vehicles such as
boats and planes). Such databases could be used to generate assessed values (based on
initial value and standard depreciations schedules).
• Mortgage balances: mortgage interest payments are already reported on form 1098. Mort-
gage debt balances are reported on forms 1098 since tax year 2017.
60Form 5498 in particular already requires valuations of closely held business assets in IRAs.
31
• Other debt balances: student loans balances could be reported on forms 1098-E (following
the model for mortgages). Consumer credit debt is already reported to the credit bureaus
and the IRS could require the credit bureaus to provide information returns on outstanding
balances.
• Closely held business ownership: The ownership of closely held businesses organized as
partnerships and S-corporations is already reported through K1 forms that report the
business income for each partner or shareholder.61 This ownership reporting requirement
should be extended to closely held businesses which are C-corporations. The information
is already stored in depositories and could be shared with the IRS.
4.4 Valuation
The general principle guiding valuations should be that all assets should be assessed at their
prevailing market value. In the majority of the cases, market values are easy to observe by the
IRS with proper information reporting. Here we discuss the cases that raise challenges. Two
general points should be kept in mind. First, value arises from the expected income stream and
expected sale value in the future. The current and past income stream can be observed. Second,
values are often eventually revealed by the market when a sale takes place. If the revealed value
is significantly different from values used for wealth tax purposes, it is always feasible to apply
a retrospective wealth tax correction at the time of sale.62 l
Valuing closely-held businesses. According to Saez and Zucman (2016) estimates, about
20% of the assets of the top 0.1% are business assets and private (i.e., non-traded) corporate
stock for which there is no systematic market valuation. The SCF and estate tax statistics
display a higher share of private businesses among top wealth holders, it is 33% from estate
tax data and about 45% in the SCF (Smith et al. 2019). As discussed above, it is likely that
the financial accounts understate the value of private businesses (while the SCF may rely on
overoptimistic owners reports). Therefore, it is likely that the share of private businesses among
top wealth holders is fairly large (probably around one third) and hence the issue of value of
closely-held businesses is very important. It is useful to distinguish between large vs. small
closely-held businesses.
61The recent work of Cooper et al. (2016) shows that the reporting system for partnerships is not perfect andought to be improved as they were not able to allocate about 15% of income to any final individuals (most likelybecause of the use of offshore partnerships for tax avoidance).
62Various cantons in Switzerland use such retrospective corrections “supplementary net wealth taxes” (Lehner2000, p. 670).
32

Large private businesses. For large private businesses, it is possible to draw on the financial
system to put market values on many of these assets. Large private businesses (such as Uber or
Lyft before their IPOs) are typically valued on secondary markets and their stock transactions
are centrally registered. Making such transactions reportable to the IRS would allow the tax
administration to value such stock systematically. More broadly, the financial industry regularly
values private businesses (in the context of venture capital funding, mergers and acquisition, or
share issuance). These valuations could be made reportable to the IRS for the purpose of ad-
ministering a wealth tax and could be used to value assets retrospectively.63 More ambitiously,
in case of disagreement about valuation for large private businesses between the IRS and the
owners, owners should pay in stock and the government can then create the missing valuation
market when selling back the stock. A defining feature of modern capitalism is precisely the
ability to divide business ownership with dispersed shareholding. Creating a valuation market
is the best solution as any asymmetry in treatment between comparable publicly traded corpo-
rations vs. private corporations would create incentives to game the system and in particular
remain private if private equity gets preferential treatment.
Small private businesses. For smaller businesses for which no information exists within the
financial industry, there already exists a section of the Internal Revenue Code (409A) that
values private businesses for the purpose of taxing stock options.64 These valuations can be
perfected based on best international practices. Switzerland is the best example of a country
that has successfully taxed equity in private businesses by using simple formulas based on the
book value of business assets and multiples of average profits in recent years. The IRS already
collects data about the assets and profits of private businesses for business and corporate income
tax purposes, so it would be straightforward to apply similar formulas in the United States.
Smith, Zidar, and Zwick (2019) are a recent example of how to use administrative data to
systematically create valuations for S-corporations using formulas based on profits, book value,
and sales.
This means that, when the business is owned by a very wealthy individual above the exemp-
tion threshold, the businesses faces a higher tax through the wealth tax that takes the form of
a profits surtax, a property surtax, and a sales surtax. The important point is that no costly
valuation would be required each year as the calculation would be entirely formula based. Note
also that only a very small fraction of small businesses are owned by the 75,000 families with
63Of course, taxpayers have an incentive to under-value their business for tax purposes. This is why the IRSshould use systematically existing valuations for business purposes.
64The IRS issued Ruling 59-60 (in 1959) as guidance on how to credibly value a closely held business. Thisruling has in turn influenced private valuations.
33

net worth above $50 million so that such surtaxes would apply only to a small number of small
businesses.65
A number of intangible assets (such as property rights on patents and trademarks, royalty
rights for books) are held are owned directly by individuals. In this case, the simplest would be
to consider such ownership as a business (producing income) and value it using the standard
formula. Some closely businesses, especially large ones, own financial assets. For example, the
largest private businesses such as Bloomberg LP or Koch industries own large chunks of publicly
traded stock. In this case, it seems desirable to value financial assets separately at the value of
the underlying securities. This effectively shuts down the ability of mask the value of underlying
assets by using intermediate shell corporations (see below).
Wealth held through intermediaries. Some assets are held through intermediaries such as
trusts, holding companies, partnerships, etc. Current estate tax enforcement allows taxpayers
to claim valuation discounts for assets repackaged into such intermediaries. But this opens the
door to widespread avoidance.66 The model to follow is the income tax model where dividends,
realized capital gains, and interest paid by stocks and bonds flow through intermediaries (trusts,
partnerships, mutual funds, etc.) to the individual income tax return of the ultimate beneficiary.
A third-party reporting of balances paralleling the third-party reporting of income would allow
to follow the same procedure for the wealth tax. Trust income distributed to beneficiaries is
considered income for beneficiaries and taxed as such. Trust income that is retained within the
trust is taxed directly at the trust level with very narrow brackets so that the top tax rate is
quickly reached.67 The rationale is to avoid progressive tax avoidance through splitting one’s
wealth into many smaller trusts (see below).
Wealth control vs. benefits. In contrast to income, there can be a separation between
who controls wealth and who benefits from wealth. For example, private foundations are often
controlled by their wealthy funders (the Bill and Melinda Gates is the most prominent recent
example) but the funds can only be used for charitable causes.68 Foundations often survive
their funder and operate as independent entities. A trust allows to separate (a) control, (b) who
65Based on our estimates (Piketty, Saez, Zucman 2018), families with wealth above $50 million receive only1.7% of total schedule C (sole prioprietorship) income. They receive 19% and 25% of partnership and S-corporation income.
66Repetti (2000), p. 613 notes “These devices currently result in valuation of interests in the partnership thatare approximately 30% to 40% less than the value of the partnership’s underlying assets.”
67In 2018, trust income above $12,500 is taxed at the top tax rate of 37%.68On a smaller scale, donor advised funds function in the same way.
34

receives the income stream, and (c) who might be ultimate recipient of the fund (for example
when the grantor dies). How should such trusts and foundations be treated for wealth tax
purposes?
To prevent tax avoidance, there needs to be clear rules that allocate such wealth to the
individuals who control or benefit from it. Assigning wealth in priority to the wealthiest person
involved (such as the funder if she retains control of the use of funds) and with lowest priority to
non-taxable entities (such as a charitable organization which may use the funds or will eventually
be able to use the funds) is the best way to curb tax avoidance. In all cases and to avoid liquidity
issues, the wealth tax liability created by the trust should be paid nominally out of the trust
fund itself.
More broadly, a progressive wealth tax (like a progressive income tax) raises the issues of
using straws, individuals who legally own the wealth but who do not control or benefit from
it in practice. This issue looms larger in developing countries where property rights are not as
clearly established as in advanced economies.
Valuing real estate. Local governments maintain registers of real estate property for the
administration of local property taxes. Such property taxes are based on assessed value. In most
states, assessed values closely follow market value. Commercial websites such as Zillow have
also developed systematic methods to estimate real estate values. Therefore, the technology
to systematically obtain reliable real estate values exists and these values could be reported
systematically to the IRS. This would also help improve assessments for property tax purposes
which are often highly imperfect and hence discriminatory (Avenancio and Howard, 2019).
Work of art and other valuables. Valuables such as works of art are often mentioned as
assets hard to value. In reality, they are quantitatively small, and they are most often insured,
which generates a useable valuation. There are also systematic catalogs of the most valuable
art and other collectibles.
Valuing defined benefit pension assets. In the case of defined benefit pensions not yet
in payment, the value of assets could be apportioned in proportion to the accrued benefits of
each worker using simple formulas based on current salary, tenure, and age. The key require-
ment is that the total current value of each defined benefit fund should be distributed across
beneficiaries.69
69Most pension wealth is owned on a pre-tax basis, which means that pension contributions were exempt fromincome tax but pension benefits are taxed at withdrawal. As a result, the government has a claim on such
35
5 Economic Effects
All economists agree that, to the extent that it would not be entirely avoided, a progressive
wealth tax would have real economic effects.
5.1 Optimal Tax Theory
A significant body of work has analyzed the problem of optimal capital taxation. Two famous
zero capital tax results have been highly influential.
In the Atkinson and Stiglitz (1976) life-cycle model where people earn and save when young
and consume their savings when old, the optimal capital tax is zero because there is no het-
erogeneity in wealth, conditional on labor income: any combination of labor and capital taxes
can be replaced by a more efficient tax on labor income only that leaves everybody better off
(Kaplow 2006, Laroque 2005). In the real world however, there is enormous heterogeneity in
wealth conditional on labor income history. Such heterogeneity arises because of inheritances,
heterogeneous rates of returns, preferences for wealth accumulation. In this case, taxing capital
becomes desirable (Piketty and Saez, 2013 and Saez and Stantcheva 2018).
In the Chamley (1985) and Judd (1987) model, the optimal capital tax is zero in steady
state because long-run capital supply is infinitely elastic. As is well known, taxing infinitely
elastic bases is not desirable. However, the infinite elasticity assumption is not backed-up by
empirical evidence. Introducing finite elasticities in the Chamley-Judd model leads to positive
taxes on capital income that follow classical inverse elasticity rules (Saez and Stantcheva 2018).
In basic models, taxing consumption is equivalent to taxing labor income and initial wealth,
but exempting capital income. Therefore, the zero capital tax recommendation is often ex-
pressed as “we should tax only consumption.” Concrete policy proposals have been made in
this direction (see e.g, the flat tax proposal by Hall and Rabushka 1985 and more recently Viard
and Carroll 2012). On normative grounds, there is a long standing philosophical debate (since
at least Hobbes) on whether it is better to tax consumption or income. Empirically, savings are
concentrated at the top of the distribution (see e.g., Saez and Zucman, 2016). Therefore, taxing
consumption allows the income rich to defer taxation (relative to an income tax). For example,
Jeff Bezos Amazon’s recently accumulated fortune may not be consumed before decades or even
longer if wealth is bequeathed across generations. Is it fair that Bezos pay low taxes if his per-
pension wealth (in contrast to wealth owned outright or post-tax pensions such as Roth IRAs). Some downwardadjustment to pre-tax pension wealth could be made to restore balance. Pension assets are small at the top (Saezand Zucman 2016) but this issue could become significant in the case of a wealth tax with a lower exemptionthreshold.
36

sonal consumption is low? For the ultra wealthy, personal consumption is likely to be modest
relative to economic power and hence seems beside the point when thinking about their proper
tax burden. The progressive wealth tax goes after accumulated wealth before consumption takes
place or even sometimes before income happens (when a start-up is created and expected to be
lucrative in the future).
5.2 Effects on Wealth Inequality
A well-enforced wealth tax would reduce wealth concentration. That seems to be a consensus
view among economists: In the IGM poll on wealth taxes, 73% of economists agreed and only
12% disagreed with such a statement (results weighted by self-reported expertise).70
The reason is simple: if the rich have to pay a percentage of their wealth in taxes each
year, it makes it harder for them to maintain or grow their wealth. Changes in consumption
vs. saving decisions can exacerbate this effect: with a wealth tax, wealthy taxpayers may
decide to spend more today and save less (this is the substitution effect: consuming now rather
than later becomes relatively cheaper). Changes in consumption vs. saving decisions could
conversely dampen this effect if the wealthy decide to spend less to preserve their wealth (this
is the wealth effect, as the wealth tax reduces economic resources of the taxpayer). In any
case, the wealth of people subject to the tax is expected to rise less fast after the introduction
of the wealth tax than before. There is relatively little empirical work evaluating whether a
progressive wealth tax can reduce wealth concentration. One recent exception is Jakobsen et al.
(2019) who exploit compelling identification variation with the Danish wealth tax and find that
the long-run elasticity of wealth with respect to the net-of-tax return is size-able at the top of
distribution.
5.3 Effects on the Capital Stock
A potential concern with wealth taxation is that by reducing large wealth holdings, it may
reduce the capital stock in the economy–thus lowering the productivity of U.S. workers and
their wages. However, these effects are likely to be dampened in the case of a progressive wealth
tax for two reasons.
First, the United States is an open economy and a significant fraction of U.S. saving is
invested abroad while a large fraction of U.S. domestic investment is financed by foreign saving.
Therefore, a reduction in U.S. savings does not necessarily translate into a large reduction in
70See http://www.igmchicago.org/surveys/wealth-taxes.
37

the capital stock used in the United States. In the extreme case of a small open economy model,
a reduction in domestic saving has no effect on domestic investment (as it’s fully offset by an
increase in foreign investment).
Second, a progressive wealth tax applies to only the wealthiest families. For example, we
estimated that a wealth tax above $50 million would apply only to about 10% of the household
wealth stock. Therefore increased savings from the rest of the population or the government
sector could possibly offset any reduction in the capital stock.
A large body of recent academic work in behavioral economics has shown that institutions
and non-tax policies can have major effects on middle-class saving. Middle class wealth consists
primarily of pensions, housing (net of mortgage debt), consumer credit debt, and student loans.
Each of these components have historically been directly affected by government regulations.
Government-sponsored 30-year mortgages increased home ownership rates and provided an ef-
fective tool to save over a lifetime. Regulations encouraged employer-provided pensions in the
post-World War II period. Student loans are affected by public funding for higher education.
Changes in government regulations since the 1980s have contributed to the decline in middle-
class saving. The rise in middle-class debt took place in a context of financial deregulation and
decline in the public funding for higher education. The surge in mortgage refinancing before
the Great Recession was associated with equity extraction (refinancing into a larger mortgage)
and amortization extensions (starting a new 30-year mortgage) both of which reduce saving.
The recent behavioral economics literature has shown compellingly that behavioral nudges
such as changing default choices for pension savings, or commitment choices, are much more
effective ways to encourage retirement savings than traditional tax incentives exempting returns
on pension funds from taxation. Madrian and Shea (2001) showed extremely large effects of
default choices on 401(k) pension contributions for new hires that persist for a long time.
Chetty et al. (2014) showed that defaults in Denmark not only change retirement savings but
also affect overall savings as individuals do not adjust their non-retirement savings; in contrast
exempting returns from taxation, the traditional policy, has minimal effects on overall savings
as (sophisticated) individuals just shift non-retirement savings into retirement savings.
In the standard economic model, where people maximize intertemporal utility, most of the
institutional forces affecting saving would be offset by individual decisions (barring corner so-
lutions). However, in modern societies, government is always heavily involved in the key con-
sumption smoothing decisions: education for the young, retirement benefits for the old and
disabled, health benefits for the sick, and insurance for the unemployed. It looks like societies
know better than individuals how to smooth consumption. Economists mistakenly assume that
38

individuals should know equally well how to smooth consumption.
5.4 Effects on Entrepreneurial Innovation
A wealth tax would reduce the financial payoff to extreme cases of business success, but would
it reduce the socially valuable innovation that can be associated with such success? And would
any such reduction exceed the social gains of discouraging extractive wealth accumulation? In
our assessment the effect on innovation and productivity is likely to be modest, and if anything
slightly positive. Most of U.S. innovation is done by people who do not start very rich. To foster
innovation, it is key to encourage young–and not yet wealthy–people to become entrepreneurs.
Bell et al. (2019) have shown that exposure to innovation during childhood has significant
causal effects on children’s propensities to become innovators themselves later in life. A large
body of work shows that credit constraints are a key factor slowing down small business growth
when the owners lack wealth or funding.
Established businesses typically devote a lot of their resources to protect their dominant
positions by fighting new competition. A progressive wealth tax hits wealthy owners who have
already established their businesses while it does not affect (yet) new emerging businesses.
Other policies such as antitrust should also play a major role to level the playing field. Large
businesses with diluted ownership can also be anti-competitive (but at least in this case the rents
accrue to a large number of middle-class owners rather than a few super wealthy owners). An-
titrust was typically thought as a market efficiency policy blind to distributional considerations.
In practice, monopoly rents are concentrated at the top of the wealth distribution and there-
fore the bad distributional consequences of monopoly power are likely more important than the
efficiency consequences. The antitrust movement of the early 20th century was famously fueled
by anger at the Robber Barons.
5.5 Charitable Giving
A wealth tax that does not apply to private foundations or public charities could spur an
increase in charitable giving among the extremely wealthy. This increase would reflect both an
acceleration in the timing of donations that would otherwise have been made later in life and
an increase in the overall level of charitable giving. This increase in charitable giving would also
reduce wealth concentration.
To prevent abuse, donor advised funds or funds in private foundations controlled by funders
should be subject to the wealth tax until the time that such funds have been spent or moved fully
39

out of the control of the donor. For example, assets in the Bill and Melinda Gates’ foundation
should be counted as part of the wealth of Bill and Melinda Gates’ wealth. If the foundation
receives funding from others such as Warren Buffett, this wealth would also be part of the Gates’
wealth. More generally, how to treat wealth held in foundations not controlled by the original
funder (who may have passed away) is a difficult question. To the extent that the foundation
is controlled primary by one person or family (as opposed to a board that rotates), such wealth
constitutes concentrated individual power and it makes sense to make such wealth taxable. At
the same time, because such wealth is pledged to charitable giving, it could arguably receive
preferential treatment. Currently, private foundation wealth is slightly above 1% of total US
wealth (1.2% in 2012 from Saez and Zucman, 2016) so this is relatively small relative to the
20% owned by the top .1%.
5.6 Inter-vivos Giving
A progressive wealth tax could also accelerate giving to children. However, gifts trigger gift
tax liability and result in a real de-concentration of wealth, thus generating tax revenues while
achieving one of the goals of the wealth tax, namely reduce wealth concentration. In some
situations, it is possible that such splitting could be done on paper while not changing in
practice how the wealth is controlled or used. For example, a business founder could give parts
of his wealth to his children while effectively running and controlling the business. The wealth of
minor children should be added to the wealth of their parents.71 Adult children may waste the
wealth away, a significant concern about wealthy parents. Indeed, in the US estate tax context,
Poterba (2001) shows that only about 45% of the wealthy take advantage of the opportunity
for tax-free inter-vivos giving.
The exemption levels for married vs. single families can also create tax arbitrage (either
toward marriage or toward divorce). Some countries with wealth taxes (such as France) treat
cohabiting partners in a non-marital relationship as a single tax unit for wealth tax purposes
to avoid couples splitting wealth through divorce.
5.7 Other Effects
Effects on Top Talent Migration. Would a wealth tax deter the talented from coming to
the United States? This issue looms large in the public debate but there is scant empirical
evidence on this issue. Many factors affect the migration of top talent. Top universities and
71Trust funds for children which are still controlled by parents should be also be taxed with parental wealth.
40
research centers are a key factor to attract and retain talented foreign students. The number of
skilled foreign workers is regulated through immigration and visa policies. The United States is
currently restricting top talent migration through its immigration policy. In principle, a change
in any of these policies could reverse any adverse effect of steeply progressive wealth taxation
on immigration in the United States.
Macroeconomic stabilization. A wealth tax would be pro-cyclical as the stock of wealth is
more pro-cyclical than income (see Figure 1 top panel). Furthermore the most pro-cyclical com-
ponents of wealth is corporate equity which are even more concentrated than wealth. Therefore,
a wealth tax would add to automatic macro-stabilizers.72
6 Optimal Billionaire Taxation
In this section, we would like to consider the specific problem of optimal taxation of billionaires’
wealth. It has the advantage of addressing a pressing issue, the surge of large fortunes, for
which there are actually data created by Forbes magazine rich lists. It is of course important
to keep in mind that the Forbes 400 data are far from perfect but they are the best we have
for billionaires (while waiting for a well enforced wealth tax). Another advantage is that, when
talking about billionaires’, it is immediately obvious that issues of consumption smoothing are
irrelevant, forcing us to depart from the traditional model of intertemporal utility maximization.
6.1 Basic Positive Model
Forbes magazine has created a useful panel of the 400 richest Americans since 1982 that tracks
their net worth year after year. The data offer a fascinating almost 4 decade long view on how
billionaires arise, how their wealth can grow explosively as they create new corporate behemoths
(such as Google, Amazon, or Facebook), and how it then matures as their new business remains
dominant (e.g., Microsoft), and how wealth then gets split among heirs (e.g., Walmart or Mars).
Suppose person i has (real) wealth trajectory Wi1, ..Wit, ...WiT from time t = 1 to time
t = T absent the wealth tax. Let us denote by 1 + rit = Wit+1/Wit real wealth growth from t to
t+ 1. rit capture the full return of wealth (price effects and income) net of any consumption (or
transfers to heirs or charities). For billionaires, it is likely that consumption is small relative to
wealth.
72Corporate profits and especially realized capital gains are even more pro-cyclical than wealth. This cyclicalityraises issues for states which have budget balanced requirements. In this context, a wealth tax construed as apre-payment on future realized capital gains might be helpful to reduce tax revenue cyclicality.
41
Suppose that at time 1, we introduce a wealth tax at average tax rate τ > 0 on individuals
with net worth above $1 billion. We assume that the tax rate applies to total wealth (and not
just wealth above $1 billion) as in the Colombian wealth tax analyzed in Londono-Velez and
Avila (2019). Let us denote by W τi1, ..W
τit, ...W
τiT the wealth trajectory of person i under the
billionaire wealth tax at rate τ .
Absent tax evasion and avoidance, in the first year of the tax, billionaire i pays τWi1 reducing
her wealth by a factor 1− τ so that W τi1 = Wi1 · (1− τ). For example, if Bill Gates held 10% of
Microsoft in year 1, with a tax of τ = 1%, he would hold only 9.9% of Microsoft after the tax
in year 1.
Let us make the simple assumption that the wealth tax does not affect the return rit on
wealth after the tax has been paid in period t and before the tax has to be paid in period
t+ 1. In the case of Bill Gates, this amounts to assuming that the Microsoft stock price evolves
in the same way with or without the tax: Bill Gates makes the same executive decisions and
the wealth tax rate is small enough that it does not affect Bill Gates ability to remain CEO
and chair. This also amounts to assuming that Bill Gates scales down by a factor 1 − τ his
consumption, giving and hence savings decisions due to his reduced wealth. For billionaires,
consumption decisions are likely small relative to the stock of wealth. Giving could potentially
be affected by the tax in a non-proportional form. If giving only happens at the end of life, the
proportional assumption holds. It is conceivable that Bill Gates could accelerate giving to avoid
the tax. He could also slow down giving if his goal is to keep ownership control of Microsoft
longer. Therefore, the proportionality assumption seems like a natural benchmark to start with.
Therefore, if we carry these assumptions up to year t, wealth in year t is going to be W τit =
Wit · (1 − τ)t. Hence, t years of taxation at rate τ reduce wealth by a factor (1 − τ)t. The
reduction is exponential with time. If person i is exposed only t′ years to the tax over the t
year period (because she might not be a billionaire for the full period), then wealth would be
W τit = Wit · (1− τ)t
′.
It is important to note that the simple multiplicative assumption makes sense for billionaires
but would break down for less wealthy individuals. For people of more modest wealth, savings
is driven to a much larger extent by labor income rather than returns from wealth. As a result,
it is likely that the wealth tax would have less than a proportional impact on savings. For
example, a homeowner whose wealth is only her home equity is likely to pay for the property
tax out of labor income (and reduced consumption) rather than downsizing her home.
Hence, the elasticity of the individual billionaire with respect to the net-of-tax rate 1 − τis simply the number of years exposed to the tax. The wealth of a young billionaire, such as
42

Zuckerberg, is less elastic than the wealth of a more mature billionaire wealth, such as Buffett.
For heirs such as members of the Walton family, the elasticity is not only the number of years
they have faced the tax but also includes the number of years their parents have been exposed
to the wealth tax as well.
In sum, young billionaire wealth is inelastic and not much affected by the wealth tax as it
has not been exposed that long to the tax while old billionaire wealth is very elastic as the
wealth tax has had more time to erode wealth.
Let us denote by B the set of billionaires in year T and by WA(1− τ) their collective wealth
under a tax at rate τ since time 1. Let T (i) be the number of years that billionaire i has been
exposed to the wealth tax from year 1 to year T . We have
WA(1− τ) =∑i∈B
WiT · (1− τ)T (i).
Therefore, the elasticity eT of the billionaire tax base with respect to the net-of-tax base after
T years of taxation is given by:
eT =1− τWA
dWA
d(1− τ)=
∑i∈B T (i) ·WiT · (1− τ)T (i)∑
i∈BWiT · (1− τ)T (i).
eT is simply the average number of years billionaire fortunes have been exposed to the wealth
tax (and weighting each billionaire by wealth).73
This average length of exposure eT is less than T and grows with T . Presumably, it converges
to some long-run e∞. If wealth rankings were frozen as in the standard dynastic model with no
uncertainty, then e∞ =∞. That is, the progressive wealth tax would eradicate all billionaires in
the long-run (a point made by Piketty 2001 and Saez 2012). In contrast, with uncertainty, there
would always be new billionaires arising and hence the tax base would not shrink to zero and
e∞ <∞. In words, a country where billionaires come from old wealth will have a large e∞ and a
hence a very elastic billionaire tax base. Conversely, a country where new billionaires constantly
arise and replace older ones will have a low e∞ and a hence a fairly inelastic billionaire tax base.
With the Forbes 400 data, it is possible to simulate the path of wealth under a billionaire at
rate τ starting in year 1982 and trace out the effect on the tax base to compute the elasticity eT .
In the Forbes 400 data, 2018 billionaires have been on the list for 15 years on average, implying
that eT = 15 for T = 36.
73This computation is an approximation because it assumes that a marginal change in τ does not affect anyof the T (i) nor the set B. We ignore such issues for simplicity of exposition. The rigorous way to obtain thisformula would be to consider a continuum with a smooth wealth density and assume that the wealth tax appliesto all individuals above a fixed percentile (in this case reshuffling due to a marginal tax change has only secondorder effects as people falling below percentile p are replaced by people with approximately the same wealth.
43
Here, we have considered a single average tax rate τ but it is possible in simulations to
consider more complex tax systems with several brackets. More complex tax systems however
do not lend themselves to simple analytical expressions.
6.2 Revenue Maximizing Tax Rate
What is the wealth tax rate τ that maximizes wealth tax revenue? In our basic setting, this is
a very simple question to answer. Wealth tax revenue is given by R = τWA(1 − τ). A small
increase dτ generates a change in revenue dR given by:
dR = WAdτ − τ dWA
d(1− τ)dτ =
[1− τ
1− τ· eT]·WAdτ
which is the classic expression from tax theory: the mechanical revenue effect is reduced by
the behavioral response effect. The revenue maximizing rate τR is such that dR = 0, i.e., the
mechanical and behavioral response effect cancel out. It is given by eT · τ/(1 − τ) = 1 which
can be re-arranged into the standard inverse elasticity rule:
Revenue maximizing billionaire wealth tax rate: τR =1
1 + eT.
In words, the revenue maximizing wealth tax rate for billionaires is the inverse of one plus the
average number of years billionaires have been billionaires subject to the tax.
Naturally, with a new tax, the revenue maximizing wealth tax rate is large. It is actually
100% in the first year of operation of an (unexpected) wealth tax. In the long-run, τR converges
to 1/(1 + e∞). If, like in the US, billionaires have been around for about 15 years on average,
the long-run revenue maximizing (annual) wealth tax would be around 6.25%. Several points
are worth noting.
First, we are computing the wealth tax revenue maximizing rate. To the extent that billion-
aires pay other taxes (such as corporate or individual income taxes), the wealth tax rate that
maximizes total tax revenue would be lower.74
Second, our theory is predicated on the key assumption that savings is in proportion to
wealth among billionaires. If billionaires accelerate giving or increase (enormously) their own
consumption, then the elasticity would be higher and τR correspondingly lower.
Tax evasion/avoidance. Third, we have assumed that the wealth tax can be perfectly en-
forced. We can use our simple model of tax evasion/avoidance laid out in Section 2.3 and assume
that the wealthy can hide a fraction h of their wealth.
74Lower top wealth generates a negative fiscal externality in the public economics jargon (Saez, Slemrod, andGiertz 2012).
44

With homogeneous evasion, each taxpayer hides a fraction h of their wealth, then the effective
wealth tax rate is (1 − h)τ instead of τ . Our model carries over by simply replacing τ by
(1−h)τ in the wealth accumulation equation and in the revenue calculation. Hence, the revenue
maximizing rate will be given by τR = 1/[(1− h) · (1 + eT )]. In words, the government simply
needs to adjust upward the nominal tax rate τ to get the effective tax rate (1 − h)τ where it
needs to be. This is true even if h depends positively on τ . If h increases extremely fast with
τ , it is conceivable that (1− h)τ might not be able to reach 1/(1 + eT ). In which case, τ should
be chosen to maximize the effective tax rate (1− h)τ .75 Uniform tax evasion is not a problem
for tax evasion.
With heterogeneous evasion, a fraction 1−h of taxpayers does not evade at all while a fraction
h evades the tax entirely. In that case, increasing τ hurts only the law abiding taxpayers and not
at all the evaders. If h is fixed, then the revenue maximizing tax rate remains τR = 1/(1 + eT )
but the effective tax rate in only (1−h)τR as it applies to a fraction (1−h) of true billionaires.
If h depends positively on τ , this is exactly like a standard extensive margin tax response.
Following standard optimal tax theory, this extensive elasticity just needs to be added to the
intensive margin elasticity we already had. In this context, the revenue maximizing rate takes
the form τR = 1/(1 + eT + η) where eT is the average duration of exposure to the wealth tax
among the law abiding taxpayers and η is the elasticity of the fraction of taxpayers who are law
abiding with respect to 1− τ : η = ((1− τ)/(1− h)) · d(1− h)/d(1− τ).76
Empirical illustration. Table 4 lists the name, source of wealth, and wealth in 2018 of the
top 15 richest Americans (Forbes magazine estimates). The last two columns show what their
wealth would have been if a moderate or radical wealth tax had been in place since 1982. The
moderate wealth tax has a 2% marginal tax rate above $50 million and a 3% marginal tax rate
above $1 billion (as in the Warren wealth tax proposal); the radical wealth tax increases the
billionaire marginal tax rate to 10%. The $1 billion threshold applies in 2018 and is indexed to
the average wealth per family economy wide in prior years. The wealth tax has a much larger
cumulative effect on inherited and mature wealth than on new wealth. Young billionaires such
as Bezos or Zuckerberg would still be multi deca-billionaires even with a 10% tax rate above
$1 billion. More mature billionaires such as Bill Gates or Warren Buffett would be hit much
75Formally, the government chooses τ to maximize R = τ ·(1−h(τ))·WA(1−(1−h(τ))τ) which is equivalent tochoosing τ ′ to maximize R = τ ′ ·WA(1− τ ′) (the initial problem without tax evasion) with the extra constraintthat τ ′ cannot exceed the maximum of τ · (1− h(τ)).
76If evasion (or avoidance) took the form of expatriation, exactly the same analysis would go through. Thesame formula is obtained in standard optimal labor income tax theory with migration responses (see Pikettyand Saez, 2013b).
45
harder as they would faced the tax for over three decades.
With a wealth tax, top wealth would look younger and more actively entrepreneurial, pretty
much as conservatives like to paint it. This also means that the stake owned by founders (or
their heirs) would shrink faster with a wealth tax, and hence they might lose a control of the
business faster. In principle, founders who remain active managers could be hired as CEOs
even if they no longer control their company (Steve Jobs with Apple is a famous example of a
founder who lost control but was later re-hired as CEO). On the negative side, separation of
control and ownership can create agency costs but US capitalism has historically resolved the
issue of control and ownership separation well (that is not true in many countries, especially
developing economies). On the positive side, external CEOs might be more competent than
family heirs. Perez-Gonzalez (2006) shows that US firms where incoming CEOs are from the
family of the departing CEO, founder, or large shareholder underperform relative to firms that
promote unrelated CEOs.77
What would be the consequences for top wealth concentration? Figure 5 depicts the share
of total wealth owned by the top 400 richest Americans since 1982 from Forbes magazine. We
normalize for growth in the number of total US families by picking exactly the top 400 in 2018
but correspondingly fewer rich people in earlier years. As is well known, the share of wealth
going to this top group, approximately the top .00025% richest US families, has increased
dramatically from slightly less than 1% in 1982 to about 3.5% in recent years. The figure also
depicts what their wealth share would have been if various wealth taxes had been in place since
1982. The moderate wealth tax has a 3% marginal tax rate above $1 billion as in the Warren
proposal. The radical wealth tax has a 10% marginal tax rate above $1 billion (as in Saez and
Zucman, 2019). Finally, the confiscatory wealth tax increases the billionaire marginal tax rate
to 90% (as discussed in Piketty, 2019). The $1 billion threshold applies in 2018 and is indexed
to the average wealth per family economy wide in prior years. In all three cases and as discussed
above, we assume that the wealth tax does not change the pattern of wealth growth from year
to year (except for the direct effect of the wealth tax). We re-rank families based on their wealth
with the tax and always pick the richest families in each year.
With a moderate wealth tax in place since 1982, the Forbes 400 wealth share would have been
around 2% in 2018 instead of its current 3.5%. With a radical wealth tax, it would have been
about 1% in 2018, as in the early 1980s. A confiscatory wealth tax on billionaires immediately
and permanently reduces the top 400 wealth share to around .4%. The radical tax raises only
77Bennedsen et al. (2007) confirm this finding in the Danish context using gender of first child of founders asan instrument for family vs. external CEO succession.
46

slightly more revenue than the moderate wealth tax from the richest 400 in 2018. Almost by
definition, the confiscatory wealth tax raises revenue in its first year of operation and almost no
revenue afterwards.
6.3 Normative Discussion
Is the revenue maximizing rate a good normative criterion for taxing billionaires? For economists
who believe in utilitarianism and decreasing returns to consumption, it is natural to assume that
the marginal utility of billionaires’ wealth is close to zero. As a result, revenue considerations–
and consequences on the rest of the economy–should be the only relevant issue from a normative
perspective. Another way to come to the same conclusion is to note that billionaires are negli-
gible demographically (around 900 American billionaires or .0005% of all US families) relative
to the wealth they own (around 4-5% of total US wealth): billionaires are about 10,000 more
important economically than demographically. The suffering from one multibillionaire losing a
billion dollar cannot by 10,000 worse than the suffering of an ordinary American family losing
$100,000. As a result, the revenue consequences of taxing billionaires outweigh the cost on the
welfare of billionaires.
There are three main arguments made against higher taxes on the super wealth. First, such
taxes could not be enforced. Second, such taxes would hurt the economy and hence ordinary
people ultimately. Third, such taxes would undermine respect for property rights and lead to a
slippery slope of spoliation: today billionaires, tomorrow millionaires, and then everybody.78
In our model old wealth is more elastic than new wealth because the wealth tax has cumu-
lative exponential effects with time. From a revenue maximizing perspective and applying the
classical Ramsey reasoning that elastic tax bases should be taxed less, this would imply that
old wealth should be taxed less than new wealth. Normatively however, this conclusion feels
wrong as old wealth is more likely to come from inheritances than be self-made.
The wealth tax accelerates the process of dispersion of stock ownership for very successful
businesses that make their owners-founders billionaires. Dispersed stock ownership has been a
feature of US capitalism and is a key reason why taxing wealthy business owners is feasible.
Importantly and in contrast to labor income, this dispersion does not mean that economic
activity disappears. There might not be even any effect on the wealth stock if the government
uses the wealth tax proceeds for public investment, debt reduction, or to create a sovereign fund.
The wealth disappears only if the government cannot save the money and cannot encourage
middle class saving.
78Piketty (2019) presents a broad history of such property right sacralizing ideology.
47
7 Conclusion
What can we conclude from our analysis about the prospects for progressive wealth taxation in
the United States?
First, the wealth tax is likely to be the most direct and powerful tool to restore tax progres-
sivity at the very top of the distribution. The greatest injustice of the US tax system today
is its regressivity at the very top: billionaires in the top 400 pay less (relative to their true
economic incomes) than the middle class. This regressivity is the consequence of the erosion
of the corporate and estate taxes, and the fact that the richest can escape the income tax by
reporting only half of their true economic incomes on their individual income tax returns. A
wealth tax with a high exemption threshold specifically targets the richest and could resolve
this injustice.
Second, our analysis shows that the wealth tax has great revenue and wealth equalizing
potential in the US context. Household wealth has grown very large in aggregate (5 years of
national income in 2018) and the rich own a growing fraction of it (20% is owned by the top
.1% of families). The wealth tax, if the tax rates are high enough, is also a powerful tool to de-
concentrate wealth. Wealth among the Forbes 400 has grown about 4.5 percentage points faster
annually than average since 1982. A wealth tax of 2 or 3% per year can put a significant dent
into this growth rate advantage. With successful enforcement, a wealth tax has to deliver either
revenue or de-concentrate wealth.79 Set the rates low (1%) and you get revenue in perpetuity
but little (or very slow) de-concentration. Set the rates medium (2-3%) and you get revenue
for quite a while and de-concentration eventually. Set the rates high (significantly above 3%)
and you get de-concentration fast but revenue does not last long. Which is best will depend of
course on ones political views.
Can a wealth tax be successfully enforced? Our review of past and foreign experiences, as
well as recent empirical work tells us that enforcement is a policy choice. We certainly have
plenty of evidence showing that a poorly designed wealth tax generates a lot of avoidance and
little revenue. But we also learn lessons about to design a wealth tax well. Cracking down on
offshore tax evasion, as the US has started doing with FATCA, is crucial. Taxing expatriates as
the US currently does is also very important to prevent the mobile wealthy from avoiding the
tax. Third, systematic reporting of wealth balances (instead of relying on self-assessments as
for the estate tax) is a necessary condition for good enforcement (as is amply demonstrated in
79If neither materializes, it means that enforcement is not successful. Or we learn that, in contrast to whatall the data sources tell us, US wealth is in reality equally distributed.
48
the income tax context). Finally, the issue of valuation of closely held businesses is key for the
integrity of the wealth tax. Our view is that the government has to create the currently missing
(or highly private) markets for equity of large closely held businesses. It is often the case that
accounting rules develop in synergy with the tax system.
As a caveat, it is important to note that progressive wealth taxes are fragile and susceptible
to being undermined. The left could undermine its political support by lowering the exemption
threshold too much and creating hardship for the illiquid merely rich. The right could then
undermine its effectiveness by providing exemptions (and hence loopholes) for certain asset
classes, or by imposing tax limitations based on income.

ReferencesAckerman, Bruce. 1999. “Taxation and the Constitution.” Columbia Law Review 99: 1-58.Allais, Maurice. 1977. L’impot sur le Capital et la Reforme Monetaire. Paris: Hermann.Alstadsæter, Annette, Johannesen, Niels, and Gabriel Zucman. 2018 “Who Owns the Wealthin Tax Havens? Macro Evidence and Implications for Global Inequality.” Journal of PublicEconomics 162: 89-100.Alstadsæter, Annette, Niels Johannesen, and Gabriel Zucman. 2019. ”Tax evasion and inequal-ity.” American Economic Review 109, no. 6: 2073-2103.Alvaredo, Facundo, Lucas Chancel, Thomas Piketty, Emmanuel Saez, and Gabriel Zucman.2018. The World Inequality Report 2018. Cambridge: Harvard University Press.Alvaredo, Facundo, and Emmanuel Saez. 2009. “Income and Wealth Concentration in Spainfrom a Historical and Fiscal Perspective.” Journal of the European Economic Association 7,no. 5: 1140-1167.Appelbaum, Eileen, and Rosemary Batt. 2014. Private Equity at Work: When Wall StreetManages Main Street. New York: Russell Sage Foundation, 2014.Atkinson, Anthony, and Joseph E. Stiglitz. 1976. “The Design of Tax Structure: Direct VersusIndirect Taxation.” Journal of Public Economics 6, no. 1-2: 55–75.Auerbach, Alan J. 1991. “Retrospective Capital Gains Taxation.” American Economic Review81, no. 1: 167–178.Avenancio-Leon, Carlos and Troup Howard. 2019. “Unequal Tax Burden? How PropertyAssessment Gaps Distort Taxation in Minority Communities.” UC Berkeley working paper.Batchelder, Lily and David Kamin. 2019. “Taxing the Rich: Issues and Options”, NYU workingpaper.Bell, Alex, Raj, Chetty, Xavier Jaravel, Neviana Petkova, and John van Reenen. 2018. “WhoBecomes an Inventor in America? The Importance of Exposure to Innovation.” QuarterlyJournal of Economics 134, no. 2: 647-713.Bennedsen, Morten, Kasper Meisner Nielsen, Francisco Perez-Gonzalez, and Daniel Wolfenzon.2007. “Inside the Family Firm: The Role of Families in Succession Decisions and Performance.”Quarterly Journal of Economics 122, no. 2: 647-691.Bourne, Jenny, Eugene Steuerle, Brian Raub, Joseph Newcomb, and Ellen Steele. 2018. “MoreThan They Realize: The Income of the Wealthy.” National Tax Journal 71, no. 2: 335–356.Bricker, Jesse, Alice Henriques, and Peter Hansen. 2018. “How Much has Wealth Concentra-tion Grown in the United States? A Re-Examination of Data from 2001-2013.” Finance andEconomics Discussion Series 2018-024. Board of Governors of the Federal Reserve System.Bricker Jesse, Alice Henriques, Jacob Krimmel, and John Sabelhaus. 2016. “Measuring Incomeand Wealth at the Top Using Administrative and Survey Data,” Brookings Papers on EconomicActivity, Spring, 261–321.Brown, Jeffrey, Jeffrey Liebman, and Joshua Pollet. 2002. “Estimating Life Tables That ReflectSocioeconomic Differences in Mortality.” in The Distributional Aspects of Social Security andSocial Security Reform, Martin Feldstein and Jeffrey Liebman, eds. (Chicago and London:University of Chicago Press).Brulhart, Marius, Jonathan Gruber, Matthias Krapf, and Kurt Schmidheiny. 2016. “TheElasticity of Taxable Wealth: Evidence from Switzerland.” NBER working paper No. 22376.Chamley, Christopher. 1986. “Optimal Taxation of Capital Income in General Equilibriumwith Infinite Lives.” Econometrica 54, no. 3: 607–622.
50

Chetty, Raj, John N. Friedman, Soren Leth-Petersen, Torben Heien Nielsen, and Tore Olsen.2014. “Active vs. Passive Decisions and Crowd-Out in Retirement Savings Accounts: Evidencefrom Denmark.” Quarterly Journal of Economics 129, no. 3: 1141-1219..Chetty, Raj, Michael Stepner, Sarah Abraham, Shelby Lin, Benjamin Scuderi, Nicholas Turner,Augustin Bergeron, and David Cutler. 2016. “The Association Between Income and LifeExpectancy in the United States, 2001-2014.” JAMA 315, no. 16: 1750-1766.Cooper, George. 1979. A Voluntary Tax? New Perspectives on Sophisticated Estate Tax Avoid-ance. Vol. 9. Washington DC: Brookings Institution Press.Cooper, Michael, John McClelland, James Pearce, Richard Prisinzano, Joseph Sullivan, DannyYagan, Owen Zidar, and Eric Zwick. 2016. “Business in the United States: Who owns it, andhow much tax do they pay?” Tax Policy and the Economy 30, no. 1: 91-128.Drutman, Lee. 2013 “The Political 1% of the 1% in 2012.” Sunlight Foundation, June 24, 2013.Guvenen, Fatih, Gueorgui Kambourov, Burhan Kuruscu, Sergio Ocampo-Diaz, and DaphneChenk. 2017 “Use It or Lose It: Efficiency Gains from Wealth Taxation.” unpublishedmanuscript, University of Minnesota.Hall, Robert, and Alvin Rabushka. The Flat Tax. Stanford, CA: Hoover Institution Press,1985.Jakobsen, Kristian, Katrine Jakobsen, Henrik Kleven and Gabriel Zucman. 2019. “WealthAccumulation and Wealth Taxation: Theory and Evidence from Denmark.” NBER workingpaper No. 24371, forthcoming Quarterly Journal of EconomicsJohannesen, Niels, and Gabriel Zucman. 2014. “The End of Bank Secrecy? An Evaluationof the G20 Tax Haven Crackdown.” American Economic Journal: Economic Policy 6, no. 1:65-91.Judd, Kenneth L. 1985. “Redistributive Taxation in a Simple Perfect Foresight Model.” Journalof Public Economics 28, no. 1: 59–83.Kaplow, Louis. 2006. “On the Undesirability of Commodity Taxation Even When IncomeTaxation Is Not Optimal.” Journal of Public Economics 90, no. 6-7, 1235-50.Kennickell, Arthur B. 2017. “Lining up: Survey and Administrative Data Estimates of WealthConcentration.” Statistical Journal of the IAOS 33, no. 1: 59-79.Kleven, Henrik. 2016. “Bunching.” Annual Review of Economics 8: 435-464.Kleven, Henrik, Martin Knudsen, Claus Kreiner, Soren Pedersen, and Emmanuel Saez. 2011.“Unwilling or Unable to Cheat? Evidence from a Tax Audit Experiment in Denmark.” Econo-metrica 79, no. 3: 651-692.Kleven, Henrik, Camille Landais, Mathilde Munoz, and Stefanie Stantcheva. 2019. “Taxationand Migration: Evidence and Policy Implications.” forthcoming Journal of Economic Perspec-tives.Kleven, Henrik, Camille Landais, and Emmanuel Saez. 2013. “Taxation and internationalmigration of superstars: Evidence from the European football market.” American economicreview 103, no. 5: 1892-1924.Kopczuk, Wojciech. 2015. “What Do We Know about the Evolution of Top Wealth Shares inthe United States?” Journal of Economic Perspectives 29, no. 1: 47–66.Kopczuk, Wojciech, and Emmanuel Saez. 2004. “Top Wealth Shares in the United States,1916-2000: Evidence from Estate Tax Returns.” National Tax Journal 57, no. 2: 445–487.Laroque, Guy R. 2005. “Indirect Taxation is Superfluous under Separability and Taste Homo-geneity: A Simple Proof.” Economics Letters 87, no. 1, 141-4.
51
Lehner, Moris. 2000. “The European Experience With a Wealth Tax: A Comparative Discus-sion.” Tax Law Review 53: 615-691.Londono-Velez, Juliana, and Javier Avila. 2019. “Can Wealth Taxation Work in DevelopingCountries? Quasi-Experimental Evidence from Colombia.” UC Berkeley PhD Thesis.Madrian, Brigitte C. and Dennis F. Shea. 2001. “The power of suggestion: Inertia in 401 (k)participation and savings behavior.” Quarterly Journal of Economics 116, no. 4: 1149-1187.Malkiel, Burton G. 2013. “Asset Management Fees and the Growth of Finance.” Journal ofEconomic Perspectives 27, no. 2: 97-108.Martinez, Isabel. 2017.“Beggar-thy-neighbour tax cuts: Mobility after a local income andwealth tax reform in Switzerland.” Luxembourg Institute of Socio-Economic Research (LISER)Working Paper Series 8.Mayer, Jane. 2017. Dark money: The Hidden History of the Billionaires Behind the Rise ofthe Radical Right. New York: Anchor Books.Miller, David S. 2005.“A Progressive System of Mark-to-Market Taxation.” Tax Notes 1047.Moretti, Enrico, and Daniel Wilson. 2019. “Taxing Billionaires: Estate Taxes and the Geo-graphical Location of the Forbes 400.” UC Berkeley working paper.Morningstar. 2019 “US Fund Fee Study for 2018.”, Morningstar Research.OECD (Organisation for Economic Co-operation and Development). 2011. “The Taxation ofMobile High-Skilled Workers.” Chapter 4 in OECD Tax Policy Study No. 21: Taxation andEmployment, (Paris: OECD).OECD (Organisation for Economic Co-operation and Development). 2018. “The Role andDesign of Net Wealth Taxes in the OECD.” Paris: OECD.Page, Benjamin I., Jason Seawright, and Matthew J. Lacombe. 2018. Billionaires and StealthPolitics. Chicago: University of Chicago Press.Pareto, Vilfredo. 1896. Ecrits sur la Courbe de la Repartition de la Richesse. Geneva: Droz.Perez-Gonzalez, Francisco. 2006. “Inherited Control and Firm Performance.” American Eco-nomic Review 96, no. 5: 1559-1588.Piketty, Thomas. 2001. “Income Inequality in France, 1901-1998.” CEPR Discussion Paperno. 2876.Piketty, Thomas. 2014. Capital in the 21st Century. Cambridge, MA: Harvard UniversityPress.Piketty, Thomas. 2019. Capital et Ideologie. Paris: Le Seuil.Piketty, Thomas, and Emmanuel Saez. 2003. “Income Inequality in the United States, 1913-1998.” Quarterly Journal of Economics 118, no. 1: 1-39.Piketty, Thomas, and Emmanuel Saez. 2013a. “A Theory of Optimal Inheritance Taxation.”Econometrica 81, no. 5: 1851-1886.Piketty, Thomas, and Emmanuel Saez. 2013b. “Optimal Labor Income Taxation.” In Handbookof Public Economics vol. 5, 391-474. Elsevier.Piketty, Thomas, Emmanuel Saez, and Gabriel Zucman. 2018. “Distributional National Ac-counts: Methods and Estimates for the United States.” Quarterly Journal of Economics 133,no. 1: 553–609.Piketty, Thomas, and Gabriel Zucman. 2014. “Capital is Back: Wealth-Income Ratios in RichCountries, 1700–2010,” Quarterly Journal of Economics, 129(3), 1255–1310.Plagge, Arnd, Kenneth Scheve, and David Stasavage. 2011. “Comparative Inheritance TaxationDatabase.” Yale University, ISPS Data Archive, 2011.
52

Poterba, James. 2001. “Estate and Gift Taxes and Incentives for Inter Vivos Giving in theUnited States.” Journal of Public Economics 79, 237-264.Repetti, James R. 2000. “It’s All About Valuation.” Tax Law Review 53: 607-614.Saez, Emmanuel. 2012. “Optimal progressive capital income taxes in the infinite horizonmodel.” Journal of Public Economics 97: 61-74.Saez, Emmanuel, Joel Slemrod, and Seth H. Giertz. 2012. “The elasticity of taxable incomewith respect to marginal tax rates: A critical review.” Journal of Economic Literature 50, no.1, 3-50.Saez, Emmanuel and Stefanie Stantcheva. 2018. “A Simpler Theory of Optimal Capital Taxa-tion.” Journal of Public Economics 162: 120–142.Saez, Emmanuel and Gabriel Zucman. 2016. “Wealth Inequality in the United States since1913: Evidence from Capitalized Income Tax Data.” Quarterly Journal of Economics 131, no.2: 519-578.Saez, Emmanuel and Gabriel Zucman. 2019. The Triumph of Injustice: How the Rich DodgeTaxes and How to Make them Pay. New York: W. W. Norton.Seim, David. 2017. “Behavioral Responses to an Annual Wealth Tax: Evidence from Sweden.”American Economic Journal: Economic Policy 9, no. 2: 395-421.Slemrod, Joel. 1994. “Fixing the Leak in Okuns Bucket. Optimal Progressivity when AvoidanceCan Be Controlled.” Journal of Public Economics 55, no. 1: 41-51.Slemrod, Joel, and Wojciech Kopczuk. 2002. “The Optimal Elasticity of Taxable Income.”Journal of Public Economics 84, no. 1: 91-112.Smith, Matthew, Owen Zidar, and Eric Zwick. 2019. “Top Wealth in the United States: NewEstimates and Implications for Taxing the Rich.” Working Paper.Summers, Lawrence H. and Natasha Sarin. 2019. “A ‘Wealth Tax’ Presents a Revenue Estima-tion Puzzle.” Washington Post, April 4.Summers, Lawrence H. and Natasha Sarin. 2019b. “Be Very Skeptical about How MuchRevenue Elizabeth Warren’s Wealth Tax Could Generate.” Washington Post, June 28.Thaler, Richard H. and Cass R. Sunstein. 2008. Nudge: Improving decisions about health,wealth, and happiness. New Haven: Yale University Press.US Treasury Department. 1976. Annual Report of the Commissioner of Internal Revenue 1975.Washington, DC: Government Printing Office.US Treasury Department. 2014. “Tax Expenditure for Exclusion of Capital Gains at Death,”Office of Tax Analysis report, August 2014.US Treasury Department. 2018. “Foreign Portfolio Holdings of U.S. Securities.” Washington,DC: Government Printing Office.US Treasury Department. 2019. Internal Revenue Service Databook 2018. Washington, DC:Government Printing Office.Viard, Alan, and Robert Carroll. 2012. Progressive Consumption Taxation: The X Tax Revis-ited. Washington, DC: AEI Press.Waldron, Hillary. 2007. “Trends in Mortality Differentials and Life Expectancy for Male SocialSecurity Covered Workers, by Average Relative Earnings.” ORES Working Paper Series, No.108, US Social Security Administration, Office of Policy.Weisbach, David A. 1999. “A Partial Mark-to-Market Tax System.” Tax Law Review 53:95-136.Wong, Francis. 2019. “The Financial Burden of Property Taxes.” UC Berkeley PhD thesis.
53

Zucman, Gabriel. 2013. “The Missing Wealth of Nations: Are Europe and the U.S. net Debtorsor net Creditors?” Quarterly Journal of Economics 128, no. 3: 1321-1364..Zucman, Gabriel. 2015. The Hidden Wealth of Nations: The Scourge of Tax Havens. Chicago:University of Chicago Press.Zucman, Gabriel. 2019. “Global Wealth Inequality.” Annual Review of Economics 11, 109-138.
54
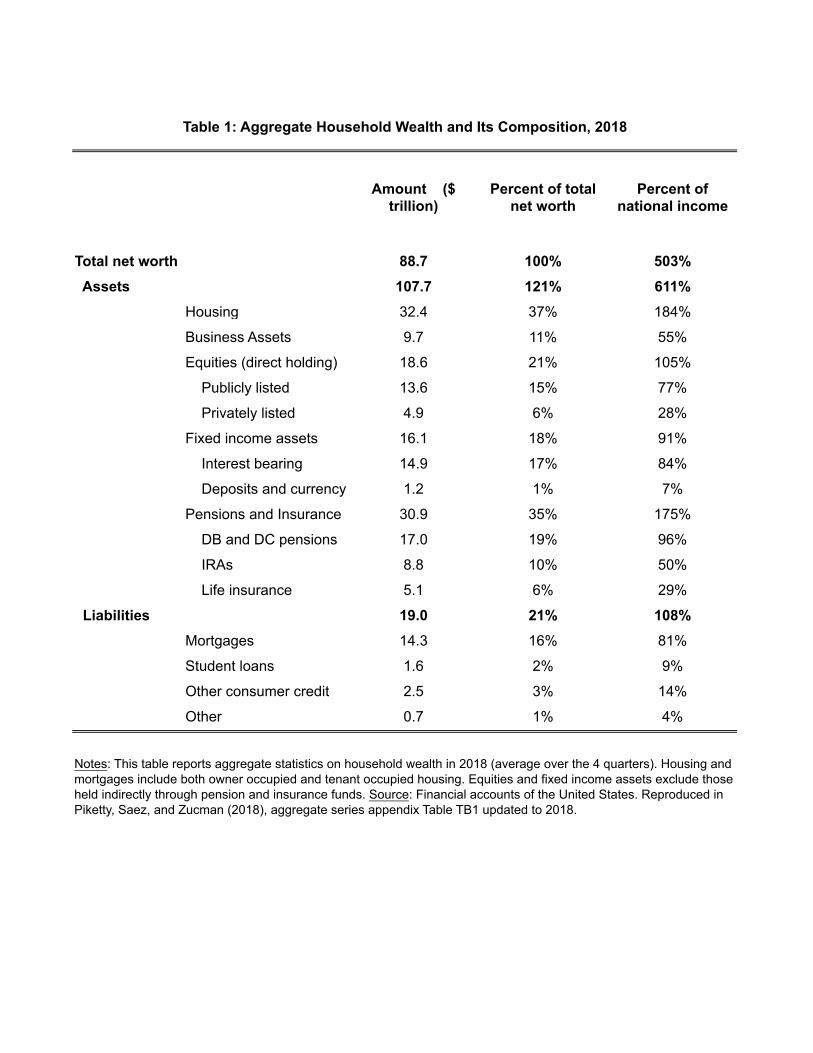
Amount ($ trillion)
Percent of total net worth
Percent of national income
Total net worth 88.7 100% 503% Assets 107.7 121% 611%
Housing 32.4 37% 184%
Business Assets 9.7 11% 55%
Equities (direct holding) 18.6 21% 105%
Publicly listed 13.6 15% 77%
Privately listed 4.9 6% 28%
Fixed income assets 16.1 18% 91%
Interest bearing 14.9 17% 84%
Deposits and currency 1.2 1% 7%
Pensions and Insurance 30.9 35% 175%
DB and DC pensions 17.0 19% 96%
IRAs 8.8 10% 50%
Life insurance 5.1 6% 29%
Liabilities 19.0 21% 108%Mortgages 14.3 16% 81%
Student loans 1.6 2% 9%
Other consumer credit 2.5 3% 14%
Other 0.7 1% 4%
Table 1: Aggregate Household Wealth and Its Composition, 2018
Notes: This table reports aggregate statistics on household wealth in 2018 (average over the 4 quarters). Housing and mortgages include both owner occupied and tenant occupied housing. Equities and fixed income assets exclude those held indirectly through pension and insurance funds. Source: Financial accounts of the United States. Reproduced in Piketty, Saez, and Zucman (2018), aggregate series appendix Table TB1 updated to 2018.
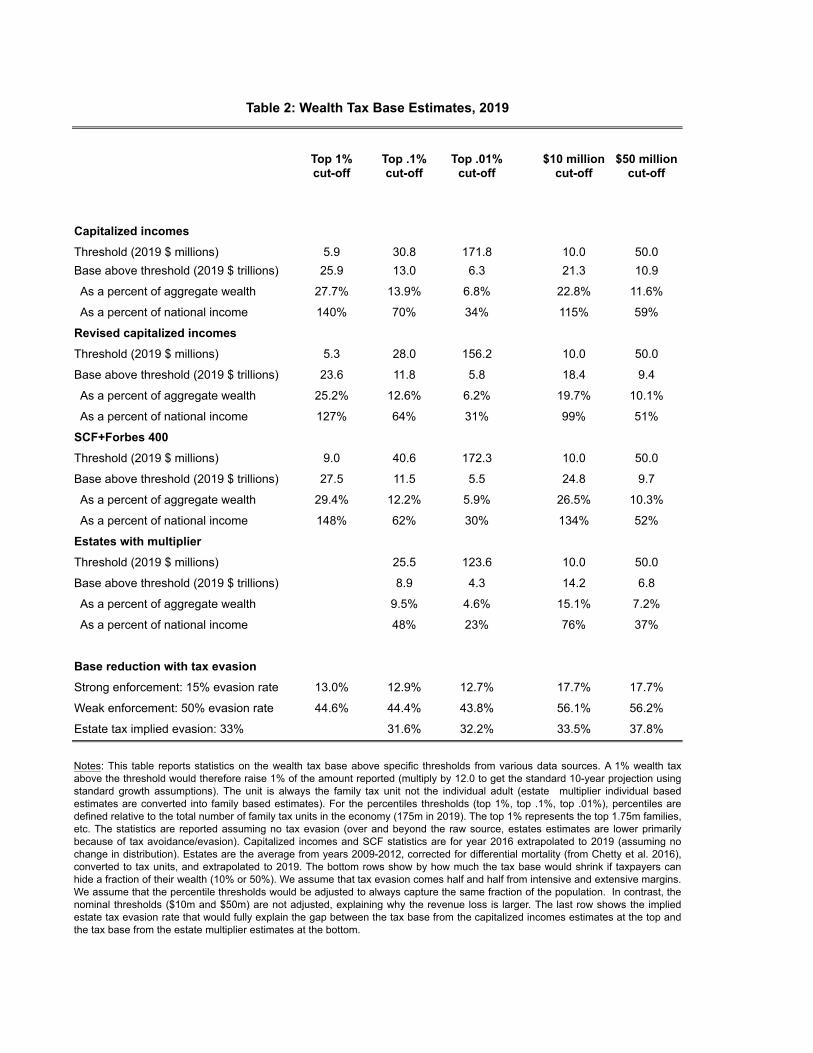
Top 1% cut-off
Top .1% cut-off
Top .01% cut-off
$10 million cut-off
$50 million cut-off
Capitalized incomesThreshold (2019 $ millions) 5.9 30.8 171.8 10.0 50.0Base above threshold (2019 $ trillions) 25.9 13.0 6.3 21.3 10.9
As a percent of aggregate wealth 27.7% 13.9% 6.8% 22.8% 11.6%
As a percent of national income 140% 70% 34% 115% 59%
Revised capitalized incomes Threshold (2019 $ millions) 5.3 28.0 156.2 10.0 50.0
Base above threshold (2019 $ trillions) 23.6 11.8 5.8 18.4 9.4
As a percent of aggregate wealth 25.2% 12.6% 6.2% 19.7% 10.1%
As a percent of national income 127% 64% 31% 99% 51%
SCF+Forbes 400Threshold (2019 $ millions) 9.0 40.6 172.3 10.0 50.0
Base above threshold (2019 $ trillions) 27.5 11.5 5.5 24.8 9.7
As a percent of aggregate wealth 29.4% 12.2% 5.9% 26.5% 10.3%
As a percent of national income 148% 62% 30% 134% 52%
Estates with multiplierThreshold (2019 $ millions) 25.5 123.6 10.0 50.0
Base above threshold (2019 $ trillions) 8.9 4.3 14.2 6.8
As a percent of aggregate wealth 9.5% 4.6% 15.1% 7.2%
As a percent of national income 48% 23% 76% 37%
Base reduction with tax evasionStrong enforcement: 15% evasion rate 13.0% 12.9% 12.7% 17.7% 17.7%
Weak enforcement: 50% evasion rate 44.6% 44.4% 43.8% 56.1% 56.2%
Estate tax implied evasion: 33% 31.6% 32.2% 33.5% 37.8%
Table 2: Wealth Tax Base Estimates, 2019
Notes: This table reports statistics on the wealth tax base above specific thresholds from various data sources. A 1% wealth taxabove the threshold would therefore raise 1% of the amount reported (multiply by 12.0 to get the standard 10-year projection usingstandard growth assumptions). The unit is always the family tax unit not the individual adult (estate multiplier individual basedestimates are converted into family based estimates). For the percentiles thresholds (top 1%, top .1%, top .01%), percentiles aredefined relative to the total number of family tax units in the economy (175m in 2019). The top 1% represents the top 1.75m families,etc. The statistics are reported assuming no tax evasion (over and beyond the raw source, estates estimates are lower primarilybecause of tax avoidance/evasion). Capitalized incomes and SCF statistics are for year 2016 extrapolated to 2019 (assuming nochange in distribution). Estates are the average from years 2009-2012, corrected for differential mortality (from Chetty et al. 2016),converted to tax units, and extrapolated to 2019. The bottom rows show by how much the tax base would shrink if taxpayers canhide a fraction of their wealth (10% or 50%). We assume that tax evasion comes half and half from intensive and extensive margins.We assume that the percentile thresholds would be adjusted to always capture the same fraction of the population. In contrast, thenominal thresholds ($10m and $50m) are not adjusted, explaining why the revenue loss is larger. The last row shows the impliedestate tax evasion rate that would fully explain the gap between the tax base from the capitalized incomes estimates at the top andthe tax base from the estate multiplier estimates at the bottom.

Estates above $100m (linked to
income tax)
SCF top .001% wealth holders
SCF top .01% wealth holders
Forbes Top 400 (combined with
IRS Top 400)
(1) (2) (3) (4)
Year 2007 2016 2016 2014
Wealth ($millions) 313 951 365 5,725
Reported income ($millions) 9.4 30.5 11.6 159
Reported income/wealth 3.0% 3.2% 3.2% 2.8%
Average macro return on wealth 5.9% 6.4% 6.4% 6.8%
Fraction true income reported 51% 50% 50% 41%
Sample size 116 86 465 400
Table 3: Reported income relative to true income for Top Wealth Holders
Notes: This table reports statistics on how much income top wealth holders report on their individual tax returns relative to their trueeconomic income using various sources of publicly available data (across columns). The first source in col. (1) is linked estate taxand income tax data from Bourne et al. (2018). The sample are all estates above $100 million for 2007 decedents. The secondsource in cols. (2) and (3) is the 2016 Survey of Consumer Finances (authors' computations). The sample are top .001% wealthholders in col. (2) and top .01% in col. (3) (SCF household unit). The third source in col. (4) combines the Forbes Top 400 (with theIRS Top 400 highest income earners). The table lists the year wealth was measured, the average wealth, average reported incomeon the individual tax return, the ratio of reported income to wealth. The next row reports total capital income to total household wealtheconomy wide (macro rate of return on wealth). The next row reports the fraction of true income reported on individual tax returns(assuming conservatively that the rich get the same rate of return as the macro-average). The last row reports sample size. In col(1), average wealth is estimated as 3.14 times the $100m threshold (based on estate tax statistics for 2007 decedents). The reportedincome of the Forbes 400 is estimated as 50% of the reported income of the IRS Top 400 (as SCF top .001% wealth holders havereported income of 50% of the SCF top .001% income earners in 2016).
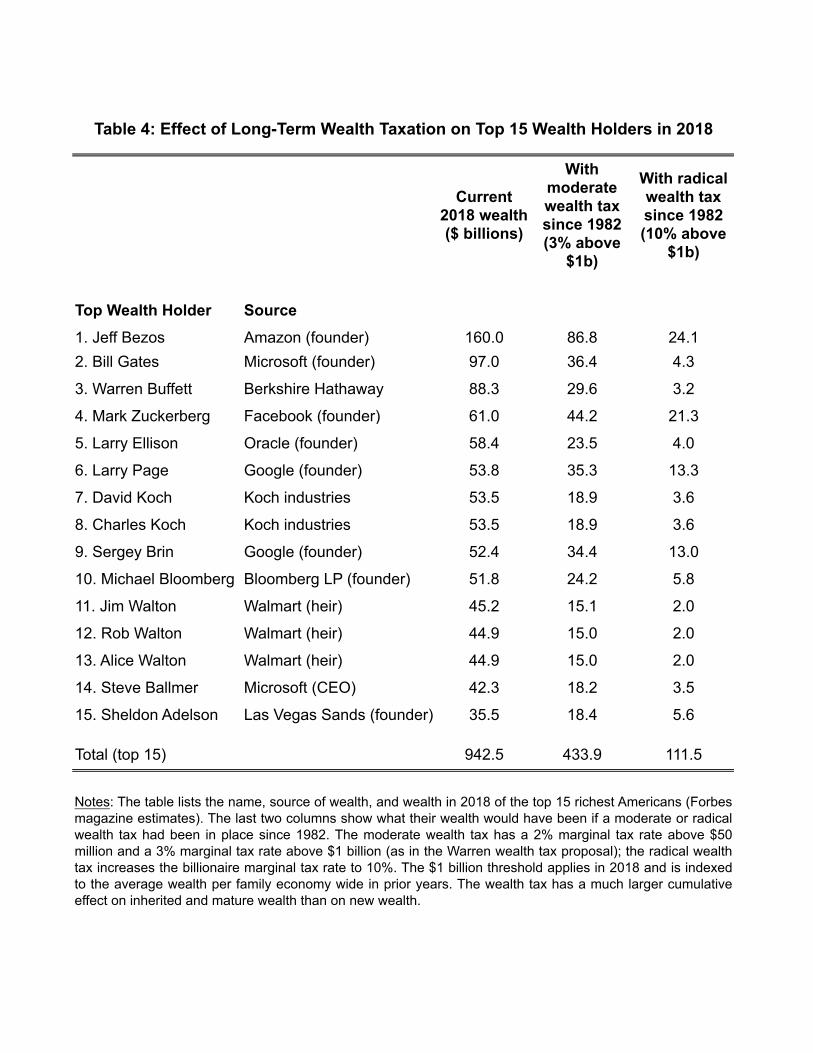
Current 2018 wealth ($ billions)
With moderate wealth tax since 1982 (3% above
$1b)
With radical wealth tax since 1982 (10% above
$1b)
Top Wealth Holder Source1. Jeff Bezos Amazon (founder) 160.0 86.8 24.12. Bill Gates Microsoft (founder) 97.0 36.4 4.3
3. Warren Buffett Berkshire Hathaway 88.3 29.6 3.2
4. Mark Zuckerberg Facebook (founder) 61.0 44.2 21.3
5. Larry Ellison Oracle (founder) 58.4 23.5 4.0
6. Larry Page Google (founder) 53.8 35.3 13.3
7. David Koch Koch industries 53.5 18.9 3.6
8. Charles Koch Koch industries 53.5 18.9 3.6
9. Sergey Brin Google (founder) 52.4 34.4 13.0
10. Michael Bloomberg Bloomberg LP (founder) 51.8 24.2 5.8
11. Jim Walton Walmart (heir) 45.2 15.1 2.0
12. Rob Walton Walmart (heir) 44.9 15.0 2.0
13. Alice Walton Walmart (heir) 44.9 15.0 2.0
14. Steve Ballmer Microsoft (CEO) 42.3 18.2 3.5
15. Sheldon Adelson Las Vegas Sands (founder) 35.5 18.4 5.6
Total (top 15) 942.5 433.9 111.5
Table 4: Effect of Long-Term Wealth Taxation on Top 15 Wealth Holders in 2018
Notes: The table lists the name, source of wealth, and wealth in 2018 of the top 15 richest Americans (Forbesmagazine estimates). The last two columns show what their wealth would have been if a moderate or radicalwealth tax had been in place since 1982. The moderate wealth tax has a 2% marginal tax rate above $50million and a 3% marginal tax rate above $1 billion (as in the Warren wealth tax proposal); the radical wealthtax increases the billionaire marginal tax rate to 10%. The $1 billion threshold applies in 2018 and is indexedto the average wealth per family economy wide in prior years. The wealth tax has a much larger cumulativeeffect on inherited and mature wealth than on new wealth.

Figure 1: US Aggregate Household Wealth and Capital Income
(a) Household wealth (percent of national income)
0%
100%
200%
300%
400%
500%
1913
1918
1923
1928
1933
1938
1943
1948
1953
1958
1963
1968
1973
1978
1983
1988
1993
1998
2003
2008
2013
2018
% o
f nat
iona
l inc
ome
Market value
Capital stock (at replacement cost)
(b) Capital income (percent of national income)
0%
5%
10%
15%
20%
25%
30%
35%
1913
1918
1923
1928
1933
1938
1943
1948
1953
1958
1963
1968
1973
1978
1983
1988
1993
1998
2003
2008
2013
2018
% o
f nat
iona
l inc
ome
Sources: Piketty, Saez, and Zucman (2018), updated to 2018. The top panel depicts total household wealth
(assets minus liabilities) at market prices as a fraction of national income since 1913. It also depicts the replace
cost of capital value of the US capital stock (all residential structures, but not land, and capital assets valued at
replacement cost; capital assets include the value of business intangible assets such as patents and copyrights).
The bottom panel depicts the share of capital income in national income (the remaining share being labor
income).

Figure 2: US Wealth Inequality and Its Evolution
(a) Top 0.1% wealth share
0%
5%
10%
15%
20%
25%
1913
1918
1923
1928
1933
1938
1943
1948
1953
1958
1963
1968
1973
1978
1983
1988
1993
1998
2003
2008
2013
Estate multiplier (adjusted)
SCF+Forbes 400
Capitalization
Revised capitalization
(b) Bottom 90% wealth share
0%
5%
10%
15%
20%
25%
30%
35%
40%
1913
1918
1923
1928
1933
1938
1943
1948
1953
1958
1963
1968
1973
1978
1983
1988
1993
1998
2003
2008
2013
SCF+Forbes 400
Capitalization
Notes: The top panel depicts various estimates of share of wealth held by the top 0.1% of family tax units in the
United States: (1) survey data combining the SCF and the Forbes 400 rich list, (3) the capitalization method
of Saez and Zucman (2016) updated to 2016 and improved upon in Piketty, Saez, and Zucman (2018), (3) the
capitalization method with adjustments to capitalizing interest income and valuing pass-through businesses, (4)
the estate multiplier method from Kopczuk and Saez (2004) updated in Saez and Zucman (2016), smoothed
out after 2000, adjusted for more accurate mortality differentials by wealth from Chetty et al. (2016) and
converted into tax units (instead of individual adults). See Figure 3 below for a step by step decomposition
of these adjustments. The bottom panel depicts estimates of the share of wealth held by the bottom 90% of
families (households for the SCF) (no estate multiplier estimates are available for this measure). To improve
comparability, the SCF estimates exclude consumer durables and add back the wealth of the Forbes 400 which
are excluded by design from the SCF.

Figure 3: Correcting Estate Multiplier Estimates
(a) Male mortality rate differentials by income percentiles in 2012-4
0%
10%
20%
30%
40%
50%
60%
70%
80%
90%
100%
24
28
32
36
40
44
48
52
56
60
64
68
72
76
80
84
88
Mor
talit
y ra
te (r
elat
ive
to a
vera
ge)
age
Kopczuk-Saez
P80-90
P90-99
Top 1%
(b) Correcting estate multiplier estimates
0%
2%
4%
6%
8%
10%
12%
14%
16%
18%
20%
1976
1980
1984
1988
1992
1996
2000
2004
2008
2012
2016
Top
.1%
wea
lth s
hare
2. Noise smoothing
4. From individuals to family tax units
3. Using Chetty et al. (2016) mortality differential
1. Kopczuk and Saez (2004) raw series and update
Notes: The figure shows how to correct estate multiplier estimates. The top panel depicts the mortality rates of
upper income groups relative to average by age (for males) in 2012-4 based on the recent work by Chetty et al.
(2016). Income is measured 2 years earlier or at age 61 whichever is less. The panel also depicts the mortality
rate advantage for top wealth holders assumed by Kopczuk-Saez estate multiplier series (from an estimate of
the college graduate mortality differential in the 1980s created by Brown, Liebman, and Pollet 2002). There is a
strong mortality gradient within the top 20% and the Kopczuk-Saez assumption greatly overestimates mortality
at the top in 2012-4. The bottom panel shows a step-by-step correction of estate multipliers in 4 steps. 1. We
start from the raw estimates from Kopczuk and Saez (2004), updated to 2012 in Saez and Zucman (2016). 2. We
smooth the series after 2000 to reduce noise. 3. We use the mortality differential from the top 1% from Chetty
et al. (2016) in 2012 and the Kopczuk-Saez differential in 1980 (with a linear phased-in adjustment for years
between 1980 to 2012). 4. We convert the individual adult estimates coming from estates into tax unit family
based estimates (using the same ratios of individual adult vs. tax unit from the Piketty, Saez, and Zucman
(2018) top wealth share series.

Figure 4: The Effects of Wealth Taxation on Overall Tax Progressivity
0%
5%
10%
15%
20%
25%
30%
35%
40%
45%
50%
55%
P0-10
P10-20
P20-30
P30-40
P40-50
P50-60
P60-70
P70-80
P80-90
P90-95
P95-99
P99-99
.9
P99.9-
99.99
P99.99
-top 4
00
Top 4
00
% o
f pre
-tax
inco
me
addingthe Warrenwealth tax
2018 tax rates
Notes: The figure depicts the average tax rate by income groups in 2018. All federal, state, and local taxes are
included. Taxes are expressed as a fraction of pre-tax income. P0-10 denotes the bottom 10% of adults, P10-20
the next 10%, etc. Taking all taxes together, the US tax system looks like a giant flat tax with similar tax rates
across income groups but with lower tax rates at the very top. A wealth tax of 2% above $50 million and 3%
above $1 billion increases progressivity within the top .1% (source is Piketty, Saez, and Zucman 2018 updated
estimates).

Figure 5: The Effects of Wealth Taxation on Top Wealth Holders
0.0%
0.5%
1.0%
1.5%
2.0%
2.5%
3.0%
3.5%
1982
1986
1990
1994
1998
2002
2006
2010
2014
2018
With moderate wealth tax (3% rate above $1bn)
With radical wealth tax (10% rate above $1bn)
With moderate wealth tax (3% rate above $1bn)
With radical wealth tax (10% rate above $1bn)
Actual share of wealth owned by the Forbes 400
With confiscatory wealth tax (90% rate above $1bn)
Sources: The figure depicts the share of total wealth owned by the top 400 richest Americans since 1982 from
Forbes magazine (the top 400 are included in 2018; in prior years, the number of richest individuals included is
indexed to the total number of families in the economy, so as to capture the same fraction of families in all years).
The figure also depicts what their wealth share would have been if a moderate, radical, or confiscatory wealth
tax had been in place since 1982. The moderate wealth tax has a 2% marginal tax rate above $50 million and a
3% marginal tax rate above $1 billion (as in the Warren wealth tax proposal); the radical wealth tax increases
the billionaire marginal tax rate to 10% (as discussed in Saez and Zucman, 2019); the confiscatory wealth tax
increases the billionaire marginal tax rate to 90% (as discussed in Piketty, 2019). The $1 billion threshold applies
in 2018 and is indexed to the average wealth per family economy wide in prior years. The wealth share of the top
400 has increased from less than 1% in 1982 to almost 3.5% in 2018. With a moderate wealth tax in place since
1982, their wealth share would have been around 2% in 2018. With a radical wealth tax, it would have been
about 1% in 2018, as in the early 1980s. A confiscatory wealth tax on billionaires immediately and permanently
reduces the top 400 wealth share to around .4%.


