Progress toward the eradication of T from wildlife in the ...
79
Progress toward the eradication of TB from wildlife in the Hauhungaroa Ranges OSPRI R-10731
Transcript of Progress toward the eradication of T from wildlife in the ...

Progress toward the eradication of TB from wildlife in the Hauhungaroa Ranges
OSPRI R-10731


Progress toward eradication of TB from wildlife in the Hauhungaroa Ranges
Graham Nugent, Peter Sweetapple, Ivor Yockney, Mandy Barron, M. Cecilia Latham
Landcare Research
Prepared for:
OSPRI
PO Box 3412 Wellington
April 2014
Landcare Research, Gerald Street, PO Box 69040, Lincoln 7640, New Zealand, Ph +64 3 321 9999, Fax +64 3 321 9998, www.landcareresearch.co.nz

Reviewed by: Approved for release by:
David Latham Scientist Landcare Research
Phil Cowan Science Team Leader Landcare Research
Landcare Research Contract Report: LC1806
DOI: https://doi.org/10.7931/p209-n794
Disclaimer
While every effort has been made to ensure the accuracy of the information provided in this report, no warranty or representation is provided regarding the accuracy of such information, and Landcare Research does not accept liability for any losses or damage arising directly or indirectly from reliance on the information.

Progress toward the eradication of TB from wildlife in the Hauhungaroa Ranges
© OSPRI 2014
This report has been produced by Landcare Research New Zealand Ltd for OSPRI (formerly the Animal Health Board of New Zealand). All copyright in this report is the property of OSPRI and any unauthorised publication, reproduction, or adaptation of this report is a breach of that copyright and illegal.


Landcare Research Page iii
Contents
Summary ..................................................................................................................................... v
1 Introduction ....................................................................................................................... 1
2 Background ........................................................................................................................ 1
2.1 Context and overall aims ..................................................................................................... 1
2.2 Report structure .................................................................................................................. 2
2.3 Components of the project ................................................................................................. 2
3 Objectives .......................................................................................................................... 3
4 Evaluating lower-cost aerial baiting options for TB-possum control in deep forest ........ 4
4.1 Aim....................................................................................................................................... 4
4.2 Data sources ........................................................................................................................ 4
4.3 Main findings ....................................................................................................................... 4
4.4 Discussion ............................................................................................................................ 5
5 Ground-based approaches for possum control and/or direct surveillance ...................... 9
5.1 Aim....................................................................................................................................... 9
5.2 Methods and data sources .................................................................................................. 9
5.3 Main findings ..................................................................................................................... 12
5.4 Discussion .......................................................................................................................... 20
6 TB spillback risk from deer to possums (and pigs) .......................................................... 22
6.1 Aim..................................................................................................................................... 22
6.2 Methods and data sources ................................................................................................ 22
6.3 Main findings ..................................................................................................................... 22
6.4 Discussion .......................................................................................................................... 27
7 Predicting the probability of TB freedom from control history ...................................... 28
7.1 Aim..................................................................................................................................... 28
7.2 Approach ........................................................................................................................... 29
7.3 Main findings ..................................................................................................................... 30
7.4 Discussion .......................................................................................................................... 46
8 Current probabilities of TB freedom in possums ............................................................ 46
8.1 Aim..................................................................................................................................... 46

Progress toward the eradication of TB from wildlife in the Hauhungaroa Ranges
Page iv Landcare Research
8.2 Approach ........................................................................................................................... 46
8.3 Probabilities of TB freedom in possums ............................................................................ 47
8.4 Discussion .......................................................................................................................... 51
9 Conclusions ...................................................................................................................... 52
10 Recommendations ........................................................................................................... 53
11 Acknowledgements ......................................................................................................... 54
12 References ....................................................................................................................... 54
Appendix 1 – Map of Hauhungaroa and Rangitoto ranges ...................................................... 59
Appendix 2 – Detection and targeted control of possums, Tihoi 3A, 2010–2011 ................... 60
Appendix 3 – Calibrating Trap-Catch, Chewcard indices and possum density ......................... 63
Appendix 4 – Deer spillback risk modelling .............................................................................. 67

Landcare Research Page v
Summary
Project and Client
Landcare Research was commissioned by OSPRI to collaboratively develop and implement a multi-facetted 6-year programme of field research, modelling, and surveillance aimed at determining progress toward achieving and declaring bovine tuberculosis (TB) freedom from wildlife in a large area of difficult terrain (namely the Hauhungaroa and Rangitoto ranges; HRR). Key aims were to: (1) predict the duration of spillback risk from deer to possums; (2) assist in the development and evaluation of new low-cost aerial baiting strategies for possum control; (3) develop and field-test ground-based approaches for ‘deep’ (difficult to access) forest possum control or surveillance to assess their likely cost-effectiveness; and (4) quantitatively assess progress toward TB freedom. This report covers the first three years of the research programme, with most of the research conducted between 2010 and 2013.
Objectives
In conjunction with OSPRI compare the cost-effectiveness of different operational strategies for showing progress toward TB freedom in wildlife hosts in the HRR by 2016, by:
• Designing and implementing, over 6 years, a series of operational trials, including supervision and training in new techniques and tactics, collating and interpreting multi-source data, modelling outcomes, and providing objective measures of TB persistence in possums and other wildlife hosts.
• Designing, as a subset of the above, an experimental operational strategy relying largely on aerial-1080-free ground-based ‘detection and targeted control’ (DTC) of possums and control of deer.
Main findings
• In this and other projects, we developed new strip and cluster sowing options for low-cost aerial 1080 baiting. These showed similar or better efficacy (and greater cost-effectiveness) compared with broadcast baiting in about two thirds of the 10 comparisons to date.
• We also proposed to test a further variant of low-cost aerial sowing in which aerial baiting was targeted only at those areas identified by ground-based mapping to have above-average possum densities. However, an initial mapping exercise suggested this variant would probably not be operationally cost effective.
• A 2010 trial in Tihoi 3A Vector Control Zone (VCZ) showed it was practicable and affordable ($20–$30/ha) to survey and control most of the native forest areas of the HRR using a ground-based (chewcard) DTC approach. We used spacings of 250 and 500 m between detection transects, and achieved reductions in possum density in the 30–60% range. This indicated that the cost of attaining DTC kills matching the >90% typically achieved by best-practice aerial baiting would be far higher than the $30–

Progress toward the eradication of TB from wildlife in the Hauhungaroa Ranges
Page vi Landcare Research
$35/ha typical of aerial baiting operations. However, the DTC approach could be feasible and affordable for some direct ground-based surveillance of TB in possums, such as (for example) where a single survey of about 60% of the possum population was required to achieve a Probability of Freedom target of 0.95 (PoF95).
• In 2012, we compared the relative cost-effectiveness of the DTC approach against standard systematic whole-area coverage using leghold trapping. This comparison favoured leghold trapping mainly because the possum detection rate in the DTC trial was anomalously low resulting in too little control effort being deployed there relative to the number of possums present. Overall, this and preceding trials indicated that DTC will only be more cost effective than whole-area trapping when possum densities are very low.
• In 2013, we assessed the cost-effectiveness of using widely-spaced kill traps (0.2 trap/ha) checked weekly as a potential possum surveillance tool. Results were poor, but further development and testing could increase the utility of kill traps.
• The actual risk of spillback from deer to possums is unknown, but adoption of a precautionary approach would require the assumption that the risk is real. Simulation modelling predicted that the risk could persist for up to 14 years after initial possum control. As TB was confirmed as being still present in possums in the western- central Hauhungaroa Range in 2005, this implies that possum density there should be maintained below the TB persistence threshold until at least 2019. Probable TB infection in pigs and deer was detected in 2013, and could recur.
• TB prevalence in wildlife has fallen dramatically in pigs, possums, and deer. Based on the predictions of the Spatial Possum Model, and using shortened and conservative possum control histories, the amount of control already imposed appears to have been sufficient to deliver a 0.90 prior probability of TB freedom (PrP0) in possums by 2013. Although there is evidence that a different suite of model parameters might be more appropriate for the HRR, preliminary exploration of those indicates they would not substantively alter the predicted progress toward TB freedom.
• Operational surveillance data from pigs and deer gathered since spring 2011, and using the predicted probabilities of freedom at that time, indicated that pigs were far more sensitive and cost-effective as sentinels than deer or possums. Provided no TB+ve pigs were found, 4–5 years of low-intensity pig surveillance of 0.4 pigs/km2/year at a cost of <$1/ha/year would be sufficient to achieve the PoF95 target for all wildlife.
• Combined pig and possum survey in the AS3 VCZ (the last-known bastion of TB in possums) indicates that even in that ‘worst-case’ area the PoF95 target has already been achieved. Overall, PoF95TB freedom in possums in each of the VCZs could be achieved from 2015 onward via a single direct survey of ~60% of the possum population.
Conclusions
• Low-cost aerial 1080 baiting can probably deliver high kills of possums, but with slightly less consistency than current best practice. High-cost dual prefed high-sowing-rate broadcast baiting should be adopted where near-total kills are required, but a

Progress toward the eradication of TB from wildlife in the Hauhungaroa Ranges
Landcare Research Page vii
range of lower-cost options are now available to maintain an already low possum density.
• Ground-based control of possums in the HRR will be less cost-effective than aerial baiting. The DTC approach is likely to be more cost-effective than systematic trapping only when possum densities are very low. However, where the PrP0 already exceeds 0.9, either DTC or trapping can deliver the level of possum surveillance required to achieve the PoF95 for possums for about $20–$30/ha. Use of the DTC approach would be favoured if surveillance was conducted 1–2 years after aerial baiting, when possum densities would be at their lowest levels.
• Pig surveillance is the cheapest option for quantifying TB freedom in possums, but in the short-to-medium term, this option is undermined by the risk of pigs detecting residual TB in deer that is of negligible epidemiological consequence while possum densities remain low. Deer surveillance is of little value in declaring TB freedom, but is clearly of value in assessing whether there is still a risk of spillback infection from deer to possums. TB+ve pigs are poor indicators of where TB was acquired.
• The HRR possum population is probably already free of TB, but may not be free of TB in deer until close to 2020. While further control is not required to eliminate TB from possums, it is nonetheless a sensible precaution to ensure possum densities do not recover before 2020 to levels at which TB could re-establish in possums. Only moderate control efficacy (~90% kills) in 2015–17 would be required to achieve that.
• We anticipate it will be difficult to declare TB eradication from all wildlife before 2020. However, it appears to be feasible and affordable to declare TB freedom in possums several years earlier than that by using direct surveillance of possums immediately after the final control operations planned for each VCZ, and even earlier still if the surveillance is conducted immediately before control (and is negative).
Recommendations
We recommend OSPRI should:
• Further investigate the effect of alternative parameter values in the SPM, especially TB-induced mortality, transmission rate, and home range variation with possum density, partly to identify whether using more realistic model values would significantly affect predicted outcomes, but also to improve prediction of how long it would take before TB could re-establish in a recovering possum population following a control operation.
• Conduct the already scheduled focal possum surveillance targeted at the sites at which TB+ve sentinels have been recently detected at a high level of intensity, and in such a way that possum density and home range size can be estimated, so that outcomes can contribute to the above evaluation of the SPM.
• Continue the current level of sentinel surveillance over the whole area at a cost of about $1/ha/year for the next 5–10 years. Initially both pigs and deer should be surveyed primarily to determine the location, magnitude, and potential duration of the spillback risk posed by deer, but eventually emphasis should shift toward pigs

Progress toward the eradication of TB from wildlife in the Hauhungaroa Ranges
Page viii Landcare Research
because of their greater sensitivity as sentinels, particularly in the context of assurance monitoring after TB freedom has been declared in possums.
• Consider which strategic approaches to declaring TB freedom in the HRR are likely to be acceptable to stakeholders. The main possibilities include:
• Waiting until after 2019 to declare TB eradication from wildlife (i.e. until after the spillback risk from deer is predicted to have fallen to zero).
• Declaring TB freedom in possums even when there is still some spillback risk from deer, by conducting direct post-control surveillance of about 60% of the possum population soon after the next scheduled control operation (i.e. 2017–2019).
• Declaring TB freedom in possums even earlier by conducting direct pre-control surveillance of 10–15% of the possum population immediately before the next scheduled control operations (i.e. 2016–2018).
• Consider expanding newly-initiated research scheduled for the next three years to further refine and test the best technical options for either moderate- or low-intensity ground-based surveillance of possums in deep-forest situations. This could include chewcard detection systems in combination with leghold and/or kill trapping.

Landcare Research Page 1
1 Introduction
Landcare Research was commissioned by OSPRI to develop and implement a multi-facetted 6-year programme of field research, modelling, and surveillance aimed at determining progress toward achieving and declaring bovine tuberculosis (TB) freedom from wildlife in a large area of difficult terrain (namely the Hauhungaroa and Rangitoto ranges, HRR) (Appendix 1). Key aims were to: (1) predict the duration of spillback risk from deer to possums; (2) assist in the development and evaluation of new low-cost aerial baiting strategies for possum control; (3) develop and field-test ground-based approaches for deep-forest possum control and/or surveillance to assess their likely cost-effectiveness; and (4) quantitatively assess progress toward TB freedom. This report covers the first three years of the 6-year programme, with most of the research conducted between 2010 and 2013.
2 Background
2.1 Context and overall aims
This initial 3-year phase of the project aimed to assist OSPRI in achieving one of the primary objectives in the second amendment (AHB 2009a) to the National Pest Management Plan for Bovine Tuberculosis (NPMP). That amendment took effect from 1 July 2011. The specific objective was the eradication of the disease, before 2026, from infected vector populations (wild animal populations able to carry TB) in two extensive forest areas representing relatively difficult operational terrain (AHB 2012). One of the targeted areas, HRR (a combined total of ~122,000-ha) in the western-central North Island, is the focus of this project and report.
Eradication of TB has not yet been confirmed for any large forest tract in which it was previously well established in multiple species of wildlife, including deer. Although not maintenance hosts, deer are considered particularly important because females infected at an early age may survive in an infected state for more than a decade (Nugent 2005), with implications for disease transmission. OSPRI’s eradication scenarios are therefore sensibly based on a precautionary time frame of 10–15-years, even though intensive possum control is predicted to eliminate TB from possums much more quickly (Ramsey & Efford 2005).
The term of the NPMP is 15 years, but the plan will be formally reviewed toward the end of the first five years. Government and industry funders of the NPMP will therefore be looking for strong evidence before then that eradication of TB from the HRR is feasible and affordable, in order to reaffirm their commitment to funding the NPMP beyond 2016. Thus, although OSPRI’s current aim is to declare the HRR free of wildlife TB by 2020 (with post-eradication surveillance until 2023; AHB 2012), it will be important to OSPRI to be able to demonstrate adequate progress toward that goal before 2016.
Since this project began in 2010, OSPRI has successfully developed and implemented a quantitative decision support tool, the ‘Proof of Freedom’ (POF) utility (Anderson 2011), based on the concepts and algorithms described by Nugent et al. (2006) and Anderson et al.

Progress toward the eradication of TB from wildlife in the Hauhungaroa Ranges
Page 2 Landcare Research
(2013). This tool quantitatively predicts the probability that the possum population in an area is free of TB. It takes into account the historical duration and intensity of possum control and the amount of empirical TB surveillance data (i.e. necropsy of possums, or sentinel species such as deer, pigs, and ferrets) collected without TB detection in any of them. Recently, this tool was used to help declare TB freedom for possum populations in ~ 500 000 ha of land previously classified as being part of a Vector Risk Area (VRA; an area known or believed to potentially contain TB-infected wildlife). Thus far, most, if not all, of the areas declared TB free have been predominantly farmland, where possum habitat is often sparse and possum TB surveillance is easier and more affordable than in continuously forested areas.
2.2 Report structure
This report combines a synthesis of the results and learnings from closely-related research projects, components of the project that have already been fully reported, and new field data presented here for the first time. For simplicity and clarity, only the most relevant findings are presented in the main body of the report. The detailed supporting data are presented in Appendices 2–4, either fully, or as abstracts or executive summaries if the work has already been formally published or presented to OSPRI in other reports. An ancillary report (Sweetapple et al. in prep) will explore in greater depth the methodological and operational implications arising from the research aimed at addressing the developmental objectives below for field testing of the ground-based-DTC approach.
2.3 Components of the project
The project (and this report) has four main components:
1. Evaluation of the cost and effectiveness of a number of different operational approaches to achieving TB freedom by reducing possum densities to very low levels and keeping them well below the threshold density for TB persistence in possums (KT). Because the HRR is almost completely forested, the focus is on aerial 1080 baiting (i.e. the cheapest way of attaining low possum densities in areas that are difficult or expensive to access on foot). In conjunction with a related project (R10710 Low-cost aerial baiting), we tested strip- and cluster-sowing approaches for achieving high possum kills at low cost in a series of trials both in the HRR and elsewhere. This research has been reported previously, so only the main relevant findings are summarised here.
2. Development and evaluation of ground-based methods for either achieving or quantifying TB freedom (or both) in possums in large forested areas. Initially, our focus was on detection and targeted control (DTC), i.e. an initial survey using detection devices such as chewcards to map locations where possums were present, followed by some form of lethal control such as leghold trapping at detection sites (Sweetapple & Nugent 2011). However, in 2012 and 2013 we also explored the feasibility and relative cost-effectiveness of untargeted leghold trapping and kill trapping.

Progress toward the eradication of TB from wildlife in the Hauhungaroa Ranges
Landcare Research Page 3
3. A theoretical evaluation of the risk of TB spillback from long-lived temporal vectors (deer) to possums. This involved predictive modelling of (a) the relative duration of TB persistence in possums and deer after the initiation of intensive possum control, (b) the rate of possum population recovery after the cessation of control, and (c) the likelihood of TB subsequently re-establishing in possums through spillback from deer. This research has been reported previously and also formally published, so, again, only relevant findings are summarised here.
4. Integration and synthesis of the above components into an overall evaluation of progress toward TB freedom in the HRR. This involves both quantitative assessment of the prior probability of TB freedom (PrP0) in 2011 and 2013, and assessment of progress toward the assumed target of a posterior probability of 0.95 (PoF95). It includes an evaluation of options for achieving and quantifying TB freedom. The ‘Proof of Freedom’ framework quantifies the probability of freedom using the Spatial Possum-TB Model (SPM; Ramsey & Efford 2010). This model predicts the likelihood that the level and duration of possum control historically imposed in a particular management unit has been sufficient to eradicate the disease from possums by the time TB surveillance was initiated. Empirical field data (specifically Surveillance Sensitivity estimates (SSe) derived from surveys of TB levels in possums or sentinel species such as pigs and deer) are then used in a Bayesian framework to empirically assess the probability of TB absence from possums. This part of the report therefore includes a summary of the control history of the various VCZs (management units) within the HRR, and an assessment of what values of the key epidemiological parameters in the SPM would be most appropriate for the HRR.
3 Objectives
In conjunction with OSPRI compare the cost-effectiveness of different operational strategies for showing progress toward TB freedom in wildlife hosts in the HRR by 2016, by:
• Designing and implementing, over 6 years, a series of operational trials including supervision and training in new techniques and tactics, collating and interpreting multi-source data, modelling outcomes, and providing objective measures of TB persistence in possums and other wildlife hosts.
• Designing, as a subset of the above, an experimental operational strategy relying largely on ground-based DTC of possums and control of deer.
The ground-based-DTC approach included the following developmental sub-objectives:
• Identifying the most cost effective combination of survey frequency (annual or biennial), timing (season) and transect spacing;
• Developing and comparing different ground-based systems for eliminating isolated foci of possums identified by non-lethal survey;
• Predicting the level (and cost-effectiveness) of deer control required to eliminate the risk of spillback of TB from deer to possums beyond specific dates, using simulation modelling.

Progress toward the eradication of TB from wildlife in the Hauhungaroa Ranges
Page 4 Landcare Research
The probability of TB freedom in possums provides a simple and direct measure of progress toward eradication. The ultimate aim of this report is therefore to estimate that probability, as at mid-2013, for representative vector control zones (VCZs) in the HRR. It also aims to assess how quickly and at what cost that probability could be increased to the target of >0.95 (PoF95), the current stopping rule used by OSPRI as a decision guide for stopping management of possum populations.
4 Evaluating lower-cost aerial baiting options for TB-possum control in deep forest
4.1 Aim
A central part of the original design of the project involved comparison, over about 6 years from 2010, of the cost-effectiveness of four proposed operational options for achieving TB freedom in possums in the HRR. Three of the options were variants of aerial 1080 baiting while the fourth was a ground-based alternative detailed below in Section 5. The original design has not been as formally implemented as was envisaged. The two main aerial 1080 baiting options were, instead, largely developed in areas other than the HRR as part of Project R10710 Low cost aerial baiting, but with operational trials in the HRR in 2011 and 2013. The third aerial-baiting option (partial aerial control targeted selectively at areas shown to have high possum detection rates) was not progressed after initial results indicated it was unlikely to be cost-effective.
4.2 Data sources
Since 2009, we have developed and field-tested strip- and cluster-sowing methods as alternative lower-cost options for aerial possum control in deep forest (Nugent et al. 2009, 2012a, c, 2013b; Nugent & Morriss 2010, 2011). These approaches aimed to reduce operational costs by substantially reducing sowing rates and the flying costs associated with aerial delivery. The outcomes of the low-cost aerial baiting trials conducted to date have been reported elsewhere so are summarised only briefly in this report.
A variety of monitoring techniques were used in these trials, mostly either an index of possum abundance based on leg-hold trapping (Trap Catch Index (TCI) or (for immediate post control monitoring Residual Trap Catch Index (RTCI)) or one based on ChewCard interference (Chewcard Index (CCI)) rates over seven nights unless otherwise stated).
4.3 Main findings
Trial outcomes are summarised in Table 1 and show that cluster and strip sowing can often deliver near-total reductions (>95%) in possum numbers, with percent kills usually similar to those achieved using broadcast sowing. In a third of the trials, one or more of the cluster or strip sowing treatment were less successful than broadcast baiting, mainly when a wide

Progress toward the eradication of TB from wildlife in the Hauhungaroa Ranges
Landcare Research Page 5
(150–180 m) flight path spacing (FPS) was used. Conversely broadcast treatments produced the lowest or near lowest reductions within about a quarter of the trials.
In the 2011 trials conducted within the HRR, the original aim was to compare cluster, strip and broadcast sowing, but failure of a newly-developed cluster-sowing bucket resulted in all of the low-sowing-rate treatment areas being strip sown (Nugent et al. 2012a). Key findings were:
• Conventional prefed broadcast sowing of 12-g 1080 baits at 1.5 kg/ha and 180-m FPS was effective in reducing possum CCIs by 92–94%.
• Strip sowing at 0.7–1.0 kg/ha and 100-m FPS also delivered large reductions (91–95%) cf. broadcast in two of three blocks. An apparently small reduction (51%) recorded in the third block likely reflected sampling error stemming from a low pre-control possum index equivalent to about 0.4% RTCI.
• Strip sowing at 0.46–0.66 kg/ha and 150-m FPS delivered only 48% and 70% reductions in two blocks. A high estimated reduction (100%) recorded in a third block likely reflected sampling error stemming from a low pre-control possum index equivalent to about 1% RTCI.
For these trials, we used a helicopter for the strip-sowing treatment. Thus, any savings resulting from reduced sowing rates would be offset by higher flying costs, if (based on the results above) a 100-m FPS was adopted as standard. However, fixed-wing aircraft can also be used to strip-sow bait, and they can have higher hopper capacities and flying speeds than helicopters. Modelling of direct operational costs (per-hectare bait and flight time) suggests that strip sowing could potentially reduce flying costs by two-thirds if fixed-wing aircraft were used (Nugent et al. 2012c).
4.4 Discussion
This project and related research has provided OSPRI with new options for low-cost aerial 1080 baiting, and provided further insight into the likely trade-offs between efficacy and cost. The sometimes very high kills that have been achieved using cluster sowing along transects spaced 150 m apart (e.g. Maruia, 2010; Table 1) led us to conclude that the rate at which possums are able to encounter multiple baits is a key determinant of poisoning success. That has led to more stringent control by OSPRI on bait size (to reduce the number of individual baits containing sub-lethal quantities of bait; D. Morgan, pers. comm.), and enabled operators to adopt wider spacing between flight paths during broadcast baiting (e.g. up to 180 m) and/or adoption of cluster or strip sowing.
There have not yet been enough low-cost strip, cluster, or wide-spacing broadcast operations to determine whether using such methods substantially increases the probability of an unacceptably low kill. Such low kills still occasionally occur with broadcast baiting (Table 1), so the few relative failures with strip or cluster sowing must be viewed in that context. Nonetheless, we conclude that where managers require high confidence that a high kill will be achieved, then a high-cost (i.e. dual prefed high sowing rate) broadcast option should be adopted. However, we suggest that a case could often be made for taking a

Progress toward the eradication of TB from wildlife in the Hauhungaroa Ranges
Page 6 Landcare Research
higher risk of failure in the third of the standard three operations scheduled currently stipulated as being the ‘recipe’ for eradication. This is particularly so in places such as parts of the eastern Hauhungaroa Range where the long control history already includes four aerial operations, with a fifth and final operation planned for 2016–2017.
As part of this project, a further variant of low-cost aerial sowing was proposed, namely the application of low baiting rates to only half the operational area, targeting only those areas identified by ground-based mapping as having the highest possum density. However, mapping of possum abundance in Tihoi 3A in 2010 (see Figure 2 in Section 5.3) indicated that the spatial scale over which abundance varied was possibly too fine to substantially reduce flying costs, by not baiting the low density areas. Aerial baiting contractors with whom this was discussed suggested that the time required to turn the helicopter around and go back over the previous high density area along a new parallel flight path was unlikely to be much less than the time required to simply carry on to the next high density area on the same flight path. The cost of the survey work required to produce the contour map could therefore exceed the potentially small savings in flying and bait costs, so the option was not developed further by OSPRI.

Progress toward the eradication of TB from wildlife in the Hauhungaroa Ranges
Landcare Research Page 7
Table 1 Summary of possum control outcomes achieved in trials comparing cluster- or strip-sown treatments with broadcast-sown treatments, 2007–2012. All toxic baiting was conducted using 0.15% 1080 cereal baits. W#7 = Wanganui No. 7, FPS = flight path spacing, PFI = prefeed interval, AS = aligned strip prefeeding, BC = broadcast. The TCI/RTCI (Residual Trap-Catch Index) and WaxTag BMI (Bite Mark Index) are measures of post-control abundance based on leghold trapping and WaxTag’s, respectively. The CCI Redn is the percent reduction in a Poisson-transformed Chewcard Index. Radio %kill is the percentage of radio-collared possums killed by the operation
Operation, year (Source)
Broadcast Cluster or Strip Index Broadcast Cluster or Strip
Whirinaki, 2007 (Nugent et al. 2008)
BC 1.0 kg/ha 2-g W#7 prefeed (BC) BC 2.0 kg/ha 12-g W#7 toxic 100-m FPS, 5-day PFI
BC 1.0 kg/ha 2-g W#7 prefeed CL (hand laid) 0.4 kg/ha 12-g W#7 toxic 100-m FPS, 5-day PFI
CCI Redn TCI Redn
99% 89%
97% 89%
Molesworth, 2008 (Nugent et al. 2009)
No prefeeds BC 2.5 kg/ha, 6–8-g RS5 toxic 130-m FPS
No prefeeds CL 1.0 kg/ha, 6–8-g RS5 toxic 130-m FPS
CCI Redn RTCI
96% 0.9%
96% 1.1%
Landsborough, 2009 (Nugent & Morriss 2010)
BC 1.0 kg/ha 6–8-g W#7 prefeed BC 3.0 kg/ha 12-g W#7 toxic 100-m FPS, 5-day PFI
AS 0.5 kg/ha 6–8-g W#7 prefeed CL 0.25 kg/ha 12-g W#7 toxic 100-m FPS, 6-day PFI
CCI Redn RTCI
90% 1.4%
87% 2.0%
Isolated Hill, 2009 (Nugent & Morriss 2010)
BC 1.0 kg/ha 6–8-g RS5 prefeed BC 3.0 kg/ha 6–8-g RS5 toxic 140-m FPS, 12–13-day PFI
AS 0.5 kg/ha 2-g RS5 prefeed CL 0.25 kg/ha 6–8-g RS5 toxic 100-m FPS, 12-day PFI
CCI Redn RTCI
88% 0.9%
73% 4.2%
Whanganui, 2010 (Nugent & Morriss 2011)
BC 1.0 kg/ha 6–8-g W#7 prefeed BC 2.0 kg/ha 12-g W#7 toxic 240-m FPS, 6-day PFI
AS 0.5 kg/ha 2-g W#7 prefeed CL 0.25 kg/ha 6–8-g W#7 toxic 100-m FPS, 7-day PFI
CCI Redn 42–78% 92–99%
BC 1.0 kg/ha 6–8-g W#7 prefeed BC 2.0 kg/ha 12-g W#7 toxic 240-m FPS, 6-day PFI
AS 0.5 kg/ha 2-g W#7 prefeed ST 0.45-0.60 kg/ha 6–8-g W#7 toxic 130-180-m FPS, 7-day PFI
54–87% 8–75%
Cascade (excl. PFI = 0), 2010 (Nugent & Morriss 2011)
BC 1.0 kg/ha 6–8-g RS5 prefeed BC 2.0 kg/ha 6–8-g RS5 toxic 100-m FPS, 9-day PFI
AS 0.5 kg/ha 2-g RS5 prefeed CL 0.25 kg/ha 6–8-g RS5 toxic 100–150-m FPS, 9-day PFI
CCI Redn RTCI
67–100% 2.4%
92–100% 2.2–3.4%
Maruia (excl. PFI = 0), 2010 (Nugent & Morriss 2011)
BC 1.0 kg/ha 6–8-g RS5 prefeed BC 2.0 kg/ha 12-g W#7 0.15% 1080 140-m FPS, 26-day PFI
CCI Redn 100% 99–100%

Progress toward the eradication of TB from wildlife in the Hauhungaroa Ranges
Page 8 Landcare Research
Clarence Reserve, 2011 (Nugent et al. 2012c)
- AS 0.5 kg/ha 2-g RS5 prefeed CL 0.3 kg/ha 6–8-g W#7 toxic 100mFPS, 11-day PFI
Radio %kill - 96%
No prefeeds 0.06 kg/ha 6–8-g W#7 toxic 500mFPS
Radio %kill - 78%
Haast, 2011 (Nugent et al. 2012c)
BC 1.0 kg/ha 6–8-g RS5 prefeed BC 2.0 kg/ha 6–8-g RS5 toxic 100-m FPS, 63-day PFI
AS 2 x 0.5 kg/ha 2-g RS5 prefeed 0.0.5 kg/ha 6–8-g RS5 toxic 100-m FPS, 60- & 3-day PFI
CCI Redn RTCI
72% 0.9%
82% 0.9%
Punakaiki, 2011 (Nugent et al. 2012c)
- AS 0.5 kg/ha 2-g RS5 prefeed 0.0.5 kg/ha 6–8-g RS5 toxic 100-m FPS, 10-day PFI
WaxTag BMI 5.9%
Whanganui, 2011 (Nugent et al. 2012c)
BC 1.0 kg/ha 6–8-g RS5 prefeed BC 2.0 kg/ha 6–8-g RS5 toxic 180-m FPS, 12–14-day PFI
AS 0.5 kg/ha 2-g RS5 prefeed 0.0.5 kg/ha 6–8-g RS5 toxic 100-m FPS, 11-day PFI
CCI Redn 40–75% 52–57%
AS 0.5 kg/ha 2-g RS5 prefeed CL 0.5 kg/ha 6–8-g RS5 toxic 100-m FPS, 10-day PFI
CCI Redn ‘ 38–52%
AS 0.5 kg/ha 2-g RS5 prefeed CL 0.7 kg/ha 12-g RS5 toxic 100-m FPS, 10-day PFI
CCI Redn ‘ 53–65%
Hauhungaroa, 2011 (Nugent et al. 2012a)
BC 1.0 kg/ha 6–8-g W#7 prefeed BC 1.5kg/ha 12-g toxic 180-m FPS, 19–29-day PFI
AS 0.5 kg/ha 2-g W#7 prefeed ST 0.5-1.0 kg/ha 12-g W#7 toxic 100-m FPS, 9–35-day PFI
CCI Redn RTCI (6 month)
92–94%. 0.1–0.9%
50–95% 0.2–1.7%
AS 0.5 kg/ha 2-g W#7 prefeed ST 0.5-1.0 kg/ha 12-g W#7 toxic 150-m FPS, 9–35-day PFI
CCI Redn RTCI (6 month)
‘ 48–100% 0.0–2.5%

Progress toward the eradication of TB from wildlife in the Hauhungaroa Ranges
Landcare Research Page 9
5 Ground-based approaches for possum control and/or direct surveillance
5.1 Aim
At the time this research was initiated, it was considered important to have a back-up option for cost-effectively reducing possum numbers in deep forest if the use of aerial 1080 baiting was somehow constrained. We therefore aimed to develop and compare different ground-based systems for possum control. Our initial focus was on determining whether a ground-based detection-and-targeted-mop-up approach might be a cost-effective alternative to aerial control. The logic was that if a DTC approach was implemented soon after an aerial operation (preferably the second of the three nominally required), the low density of possums present at that time would result in few detections and therefore a limited requirement for mop-up trapping. The hope was that the reduced cost would make ground-based control an affordable alternative to conducting a third aerial operation.
The original focus on control has since shifted, toward use of ground-based methods for direct surveillance of TB. We therefore assess our research outcomes in that context as well as for control purposes.
5.2 Methods and data sources
Initial development and operational testing: Tihoi 3A 2010–11
We initially aimed to assess the feasibility and efficacy of ground-based DTC of possum populations in deep forest. This approach used chewcards as a non-lethal way of mapping possum presence in an area (Sweetapple & Nugent 2011). Areas identified as having possums were then targeted using leghold traps (cf. the conventional approach of trapping the whole area). We predicted that where possum densities were low, the overall cost of targeted trapping would be less than the cost of whole-area trapping.
We conducted trials in Tihoi 3A VCZ in 2010 and 2011 (Sweetapple et al. 2011). This 8400-ha VCZ has been under intensive control since 1994. No possums were detected during residual trap-catch (RTC) monitoring after an intensive aerial 1080 baiting operation conducted in 2005. By 2009, however, an RTCI of 1% was recorded in an adjacent VCZ with the same control history. As well as assessing the operational feasibility and efficacy of the DTC approach, research objectives included comparing seasonal detectability and trappability of possums, and different ways of achieving maximum possum kill at detection sites.
A detailed summary of methods is provided in Sweetapple et al. (2011). Briefly, the whole area was surveyed using chewcards in 2010, with four sub-blocks surveyed once in winter 2010 using transects spaced at 250-m intervals and two sub-blocks surveyed twice at a 500-m transect spacing (once in winter 2010 and once again in summer or winter of 2011). A single flour-lured Cyanara50 cyanide paste bait was placed on each chewcard in one sub-block (Block A), and bagged Feratox (encapsulated cyanide) was placed near each chewcard in a second block (Block E) in 2010. In the 2011 resurveys, half of each sub-block was

Progress toward the eradication of TB from wildlife in the Hauhungaroa Ranges
Page 10 Landcare Research
surveyed in summer and half in winter, and pre- and post-control Chewcard Indices (CCIs) were measured on transects placed at right angles to the main transects, to calculate the percent reductions achieved by the main DTC operation. No poisons were used during chewcarding in 2011.
In the 2010 surveys, a cruciform of five traps, each 50 m apart, was placed at each detection site (i.e. where a chewcard had been bitten by possums) approximately one month after the detection survey. One flour-lured Cyanara50 bait and one Ferratox bait bag were placed close to each trap in all sub-blocks. In 2011, trapping began within one week of the chewcard survey and the number of traps was increased to 13 per site at about half the detection sites and left at five traps per site at the remainder of the detection sites. Again no poisons were used in 2011.
All possums captured were necropsied for the presence of visble lesions, and, in 2011 only, pools of superficial lymph nodes from groups of 10 possums were submitted for culture.
Chewcard detection vs leghold trapping for possum-TB surveillance: AS3 2012–13
To test whether the DTC approach actually delivered the projected increase in cost-effectiveness relative to ‘blanket’ or whole-area coverage using leghold trapping (LHT), we compared the two approaches in the AS3 VCZ in early–mid-2012. The 2981-ha AS3 VCZ is the area in which TB-infected possums have most recently been confirmed (in 2005; see Section 7.3) in the Hauhungaroa Range. It was last aerially poisoned in winter 2011, with a reduction in the transformed 7-day CCI by 92%, to 7.5% (Nugent et al. 2012a).
Three DTC and one LHT operations were conducted between March 2012 and February 2013. One DTC operation was undertaken in May-June 2012 , together with the LHT operation, to compare these two methods. The other two were undertaken opportunistically, by trapping at possum detections sites, firstly, to radio collar possums during a pre-control chewcard survey in March 2012, and secondly, following chewcarding for a separate project (see Sweetapple, 2014)) in a ~800-ha sub-area of the 2012 operational area, in February 2013.
In March 2012, we measured a pre-control, 6-night CCI in the most accessible parts of the block (~ 2150 ha), using 20 systematically located transects of 30 chewcards spaced at 400-m intervals, and then applied possum control (with concurrent TB survey) in May–June 2012, using either DTC (three sub-blocks, 482 chewcards at 0.4/ha for 6 nights) or systematic LHT (three sub-blocks, 375 traps at 0.4/ha for three nights). A post-control 6-night CCI was measured in July 2012 by remeasuring the pre-control chewcard transects. Additionally, we attempted to estimate possum kill by radio-collaring possums trapped at detection sites in March, and possums captured within the study area during other OSPRI-funded work done in February 2012. Low sample sizes (only 11 possums collared and 5 subsequently re-located in May) meant that we could not estimate percent kill using this method.
The February 2013 DTC trial was undertaken within the central part of AS3 Figure 1). This work measured 6-night CCIs along 1-km transects (n = 24; 480 chewcards) spaced at 250-m intervals. Sites where possums were detected were then trapped with three leghold traps

Progress toward the eradication of TB from wildlife in the Hauhungaroa Ranges
Landcare Research Page 11
for 4 nights, starting 8 days after completion of the chewcard survey. All possums were killed and inspected for evidence of TB infection.
Kill trapping for possum-TB surveillance: AS3 2013
From the results of the 2012 research in AS3, we concluded that DTC had, unexpectedly, been far less effective than whole-area leghold trapping. After consultation with OSPRI, we therefore explored kill trapping as an alternative, on the logical basis that kill traps would require only two visits (cf. 4–5 visits for 3–4 nights for leghold trapping), but would still be available to catch possums for an extended number of nights.
The ‘Proof of Freedom’ utility does not currently have the capacity to estimate surveillance sensitivity (SSe : the probability of detecting a TB-possum if one was present) based on kill trapping, but this could be added if empirical data on their efficacy becomes available. We therefore undertook an exploratory kill-trap trial with the primary aim of determining the likely SSe achievable using kill traps.
The trial was undertaken in winter 2013 using ~ 1900 ha of the parts of AS3 not used in the February 2013 DTC operation (Figure 1). Sentinel kill traps were placed on lines 500 m apart in three sub-blocks with 100 m between traps along the lines (0.2 trap/ha, 1.4 trap-nights/ha). All blocks were set on a northern bearing for 7 nights and baited with peanut butter. . The west block was trapped once but the north and south blocks were trapped on three successive occasions so that a removal-based trap-down approach could be used to estimate the effectiveness of kill trapping (percent kill).
A trapping interval of one week per trapping session was chosen to maximise the number of nights that traps were available to capture possums per field visit while minimising the likelihood that possums captured early in the period were too rotten to necropsy (as required for SSe estimation). To ensure that each session was independent and not biased by trap location, the traps were moved to new locations for each session. Specifically, session two and three traplines were set at +45° and -45°to the earlier (north-running) lines , respectively,. All captured possums were necropsied for the presence of visible lesions, and samples taken for Mycobacterium culture.
To estimate possum kill (and subsequently SSe) in the north and south blocks, we fitted an exponential decay curve to the weekly possum capture totals to predict the number of weekly trapping session required to remove all possums, calculate the total number of possums that would be killed by that number of sessions, and express the number killed in the first session as a percentage of that.

Progress toward the eradication of TB from wildlife in the Hauhungaroa Ranges
Page 12 Landcare Research
Figure 1 Location of kill-trap lines in three sub-blocks within AS3 VCZ. The central area that was not surveyed was trapped as part of a separate project (R-10765) undertaken in February 2013.
5.3 Main findings
Initial development and operational testing: Tihoi 3A 2010–11
We have previously demonstrated in research projects that low-intensity chewcard detection surveys along transects 1 km apart could be used to survey possum distribution across almost the entire width of the Hauhungaroa Range (Nugent et al. 2008) and could be implemented for more intensive surveys along transects 250 or 500 m apart at smaller scales within the HRR (Sweetapple & Nugent 2008; Sweetapple et al. 2010).
The 2010 operational trial in the Tihoi 3A VCZ confirmed that it was feasible to implement ground-based control using chewcard-based detection to target trapping at detection sites for most HHR habitats (Sweetapple et al. 2011). However, survey efficiency was low in the part of the area that included exotic plantation forest because dense slash from recent thinning operations made ground-based methods slow and expensive, and may have reduced possum access to chewcards.
In winter 2010, the average across-block CCI was 12.6%, but CCIs were highly variable between areas (range 6.7–26.7% between the sub-blocks surveyed; Table 2). We used a spatial interpolation approach to produce a ‘contour’ map of possum abundance (Figure 2). This map highlights the marked variation in possum abundance between areas only a few hundreds of metres apart.

Progress toward the eradication of TB from wildlife in the Hauhungaroa Ranges
Landcare Research Page 13
Assuming a 6:1 CCI:RTCI ratio (Nugent et al. 2012a), the CCI recorded in Tihoi 3A in 2010 (equivalent to 2% RTC but ranging up to 4.5%) was higher than expected given the RTCI of 1% recorded in 2009 in an immediately adjacent VCZ (Tihoi 2) with a similar control history. This provided another indication that possum numbers in Tihoi 3A were possibly increasing rapidly (perhaps at an exponential rate of annual increase of r = 0.55; see Evaluating SPM parameters for the HRR, p. 31). In line with that, CCIs in the two sub-blocks within Tihoi 3A that were resurveyed in 2011 were similar or higher that those recorded in 2010 despite the removal of 141 possums in 2010.
A total of 383 possums were killed during the 2010 operation, but just 65 (17%) of these were poisoned despite baits being presented with chewcards (before traps) in a third of the area and two baits being placed alongside all traps. Both a high rate of bait disturbance by rats (noted by contractors) and persistently unsettled weather (42% of days with rainfall > 2 mm) during the operation help to explain the poor efficacy of the cyanide baits.
To obtain an estimate of control efficacy in 2010, we estimated %kill by expressing the density of kills (the number of possum killed per ha) as a percentage of possum densities predicted from the 75:1 ratio between CCI and density (see Figure 7, p. 35). This CCI:density correlation was weak (R2 = 0.26), therefore caution is needed when interpreting the resulting predicted densities as they will have wide confidence intervals. The density of kills in three native forest blocks (A, D, F) with 250-m spacing between chewcard transects equated to 39% of possum predicted density, compared with 19% in the two blocks (B, D) with 500-m spacing (Table 2).
In subsequent resurveys conducted 6–12 months later in the two blocks with 500-m spacing between chewcard transects, both possum detection rates and possum kills per detection were, on average, one-third higher than in the same blocks in 2010 (Table 2&3). This resulted in nearly double the estimated density of kills (0.081 possum/ha vs 0.045 possum/ha across 3115 ha), and approximately double the estimated percent kill in these two blocks compared with 2010. These better results were achieved despite our dropping the additional cyanide poisoning conducted in the 2010 trials. Similar results were achieved in both seasons (i.e. summer and winter), and targeted trapping with 5 or 13 traps (Table 3).
Again using the 75:1 CCI: density ratio from Figure 7 (p. 35) and the overall average CCI for the two blocks of 24.0%, the kill density (0.081) is 25% of the predicted possum density (0.32). However, changes in CCIs on perpendicular monitoring transects suggested a higher overall percent kill (averaged across sub-blocks) of 52% (range 21–79%). There was a negative relationship between the CCI measured in each sub-block and the percent-kill estimates calculated from pre- and post-control monitoring (Pearson correlation coefficient: r = 0.813, P = 0.014) , which partly explains the difference between this and the estimate based on overall kill density.

Progress toward the eradication of TB from wildlife in the Hauhungaroa Ranges
Page 14 Landcare Research
Figure 2 Contour map of possum detection rates recorded in the Tihoi 3A VCZ in winter 2010. Darker colours represent the predicted highest detection rates, and the grey dots represent actual detection sites (i.e.; chewcards with possum bite marks on them; rom Fig. 7 in Sweetapple et al. 2011). The chewcards were distributed at 50-m intervals along parallel transects spaced 250 or (in the northeastern and southwestern blocks) 500m apart.

Progress toward the eradication of TB from wildlife in the Hauhungaroa Ranges
Landcare Research Page 15
Table 2 Number of possum detections and kills delivered by operational-scale implementation of chewcard detection survey and targeted control with leghold trapping (five traps per detection) in five sub-blocks comprising the native forest areas of the Tihoi 3A VCZ in winter 2010. Transect spacing (in metres) is shown in bracketed after the block identifier. Estimated initial possum densities are derived from a 75:1 ratio between CCIs and possum density. Cyanide poison was deployed with the chewcards in Blocks A and F, and with traps in all blocks. Data from the 992-ha sub-block C (which comprised a commercial pine planation with areas of heavy thinning debris) are not shown separately but are included in the “Total (all)”
Block
Chewcard survey Possums killed
Area (ha) CCI (%) Estimated
density (no./ha)1
Estimated total no. possums
Total killed
Total poisoned
Kills/ detection
% kill1
A(250) 1784 14.4 0.19 343 144 43 0.67 42.0
E(250) 1591 6.7 0.09 143 42 8 0.41 29.4
F(250) 918 7.4 0.10 91 38 1 0.58 41.8
Total (250) 4293 10.1 0.13 577 224 52 0.58 38.8
B(500) 1432 26.7 0.36 510 83 8 0.57 16.3
D(500) 1683 10.4 0.14 234 58 5 0.79 24.8
Total (500) 3115 17.9 0.24 744 141 13 0.64 19.0
Total (All) 8400 12.60 0.17 1412 383 65 0.56 27.4
1 Initial density and kill estimates based on a weak CCI:possum density correlation (Figure 7) so must be treated with caution.
Table 3 Number of possum detections, kills per detection and estimated percent kills (%kill) for four sub-blocks within each of Blocks B and D in the Tihoi 3A VCZ, using chewcard detections surveys along parallel transects with targeted leghold trapping at detection sites (5 or 13 traps per detection) in two season (summer and winter, 2011). Detection transects were spaced 500 m apart. The percent kill estimates were derived from changes in 7-day CCI measured before and after these surveys along monitoring transects placed at right-angles to the main survey transects
Block
Chewcard survey Targeted leg-hold trapping
Possum detections/
cards CCI (%)
N trap sites Possums trapped
Kills/detection
% kill1
Summer 2011
BNE(5) 47/171 27.5 203 48 1.021 47.6
BSW(13) 35/130 26.9 290 24 0.686 57.4
DNE(13) 38/174 21.8 365 41 1.079 38.9
DSW(5) 43/152 28.3 137 22 0.512 42.1
Total 163/627 25.8 995 135 0.825 46.5
Winter 2011
BNW(13) 39/118 33.0 321 35 0.897 20.9
BSE(5) 45/162 27.8 193 37 0.822 51.0
DNW(5) 28/145 19.3 132 31 1.107 79.4
DSE(13) 19/171 11.1 201 13 0.684 78.7
Total 131/596 22.0 847 116 0.878 57.5
1 Kill estimated based on pre- and post- control CCIs in treatment and non-treatment blocks.

Progress toward the eradication of TB from wildlife in the Hauhungaroa Ranges
Page 16 Landcare Research
The key ‘best practice’ learnings from this trial were:
• Delaying (by more than two weeks) implementation of targeted trapping following possum detection reduces mop-up efficacy.
• The use of cyanide paste baits alongside chewcards or in conjunction with trapping is ineffectual in the presence of abundant rats, particularly in wet weather.
• Because estimated 19%kill achieved in 2010 with a 500-m-spacing was half the 39% achieved with a 250-m-spacing, we infer that there would be no major benefit from conducting two operations with 500-m-spaced transects compared with one operation with transects at 250-m intervals, The former strategy is also likely to be less efficient due to rapid possum movement into voids created by the first control operation and the additional cost of visiting each area twice.
• Five-trap clusters were as efficacious as 13-trap clusters during targeted possum trapping.
• Similar possum population reductions appear achievable in summer and winter using the DTC approach.
• Extensive areas of low dense vegetation such as gorse, blackberry, toetoe and thinning slash should be excluded from detection surveys, and be controlled by alternative methods (e.g. aerial baiting or perimeter control using bait stations).
• Detection and mop-up costs varied greatly depending on the nature of the vegetation and initial possum abundance. This control method will be cost-effective only at very low possum densities.
Chewcards vs leghold traps for possum-TB surveillance: AS3 2012–13
A pre-control survey of the study area produced a mean possum detection rate (6-day CCI) of 4.2%, with the index (presumably by chance) in the three sub-blocks designated for leghold trapping (LHT) being only half that in the three sub-blocks designated for chewcard DTC (2.6% vs 5.5% respectively; Table 4). Conversely, during the control phase only 15 possums were removed from the DTC block compared with 19 in the LHT block, despite the former block being a third larger and having twice the initial possum abundance. Chewcard indices doubled in the DTC block between the pre-and post-control surveys, presumably, reflecting a major increase in possum detectability between the May and July surveys. However, CCIs remained stable during the same period in the LHT block, suggesting a reduction in possum abundance there of at least 50%.
To estimate percent possum kills for these trials we simulated a wide range of possible values for the percent increase in seasonal detectability (see Appendix 3; Trial 5). This analysis suggested a 64% kill in the trapping block but just 18% in the larger chewcard block, with initial possum densities of 0.03 and 0.07 per hectare respectively.

Progress toward the eradication of TB from wildlife in the Hauhungaroa Ranges
Landcare Research Page 17
Table 4 Comparison of chewcard-based detection and targeted control (DTC) and leg-hold trapping (LHT) in AS3 in May-June 2012. OTCI/OCCI = Trap Catch and Chewcard indices recorded during the ‘operational’ control phase (rather than as formal monitoring). See Appendix 3 (Trial 5) for kill estimation method
Chewcard DTC sub-blocks LHT sub-blocks
Area (ha) ~1200 ~900
Pre control 6-night CCI 5.5% 2.6%
Post control 6-night CCI 10.6% 2.4%
N control devices (device nights)
482 cards (2892 CC + 372t)
375 traps (1125t)
Device density/ha 0.04 0.04
Visits per device 2 (CCIs) 4 (traps) 4
Total visits (visits/ha) 1460 (1.2ha) 1500(1.7/ha)
Possums captured 15 (0.013/ha) 19 (0.021/ha)
Possums per detection 0.52 -
OTCI/OCCI 4.0%/6.0% 1.7%
Observed ‘reduction’ −97% 7%
Estimated %kill 18% 64%
Total person days 23 (chewcards) + 14 (traps) 31 (traps)
Predicted cost/ha $18 $21
The 64% kill in the LHT block exceeds the 0.53 SSe required to declare TB freedom if the PrP0 was set at 0.9 on the basis of the area’s previous control history (see Estimating the prior probability of TB freedom for the HRR, p. 36).
Assuming all-in operational contractor costs of $600 per field day and using the actual times required to complete the work, LHT at the rate of 0.4 traps/ha would cost ~$20/ha, while DTC based on 0.4 chewcard/ha with a CCI of ~5% would cost ~$18 (Table 4). The estimates above suggest that as much as four times more DTC effort would have been required to match the percent kill in the LHT block. That would have cost $72/ha, 3.6 times the cost of untargeted whole-area trapping. The poor result from the DTC is at odds with those for the preceding trials in Tihoi 3A, particularly the 2011 results (Table 3). The difference appears to be caused by a low detection rate in May 2012 (detectability possibly increased by as much as 230% by July 2012). A key illustration of this is a similar portion of traps (5.1%) detected (i.e. captured) possums during LHT operation as did chewcards (6.0%) during the DTC operation. This occurred despite the LHT area having an estimated initial possum abundance that was just 43% of the latter and despite the traps being ‘available’ for just 3 nights compared with 6 nights for chewcards.
The subsequent DTC operation conducted over ~800 ha of AS3 in February 2013 recorded a 6-night detection rate of 10.6%. This was 2.4 times higher than the 4.4% recorded over 6 nights in the same 800 ha 11 months earlier (March 2012), and 1.8-fold higher than the 6.0% recorded over 6 nights in 1200 ha in May 2012, before the removal of any possums.. Targeted trapping of this same area in March 2012 caught just 0.002 possum/ha, 18 fold less

Progress toward the eradication of TB from wildlife in the Hauhungaroa Ranges
Page 18 Landcare Research
than the 0.037 possum/ha caught in February 2013. These figures indicate that the CCI and/or trapping sensitivity were either anomalously low in March and May 2012 , anomalously high in February 2013 , or some combination of both.
To investigate this further we compared operational statistics across all of the DTC operations in Tihoi 3A or AS3 (Table 5). The estimated possum kills of 6% and 18% inMarch and May 2012, respectively, were far lower than in the four previous trials (36–57%), confirming that the 2012 operations were abnormally inefficient. This is attributed to anomalously low possum detectability and, in March, low trapability.. This may be partly related to poor weather during chewcarding, as the weather was moderately wet during these operations (Table 5) and there is a significant negative correlation ( R2 = 0.79 P < 0.001) between chewcard sensitivity to possums and the proportion of survey days with more than 2 mm of rain (Sweetapple and Nugent 2014). There may be an element of seasonality in these results, particularly as precipitation and season are linked, but the poor March 2012 result cannot be ascribed to seasonal precipitation because March is on average is the second driest month of the year at the nearby Pureoroa Forest CWS climate station (http://cliflo.niwa.cri.nz/ accessed 14/1/16).
The costs for the 2009–2011 DTC operations are not directly comparable with the 2012 LHT operation in AS3 as they were conducted at higher possum densities. However, they do suggest that LTH operations will probably be as cost-effective as DTC operations at all but very low possum densities (c. < 10% CCI).
Table 5 Cost estimates based on all-up contractor costs of $600/day (helicopter/consumables/travel/wet weather contingency). The May 2012 AS3 operation is shaded. The AS3 2009 data are derived from Sweetapple et al. (2010). Percent kill calculations for the AS3 2012 and 2013 trials are described in Appendix 3. The CCI indices were measured over 6 nights in the 2012 and 2013 AS3 operations and over 7 nights for all other operations
Parameter Operation
T3A Winter 2010
T3A Summer
2011
T3A Winter 2011
AS3 May 2009
AS3 Sept. 2009
AS3 March 2012
AS3 May 2012
AS3 Feb. 2013
Area (ha) 3115 1605 1536 224 224 2150 1224 800
Line spacing (m) 500 500 500 250 250 400 500 250
CCI 17.9 25.8 22.0 19.4 14.3 4.2 6.0 10.6
Traps/ha 0.30 0.62 0.55 1.09 0.41 0.05 0.10 0.26
Possums killed 141 135 116 31 31 5* 15 31
Possums per detection
0.64 0.83 0.89 0.60 0.76 0.2 0.52 0.42
Percent kill 19.0 46.5 57.5 36.4 48.1 6.1* 17.8 77-84
Density (no./ha) 0.24 0.18 0.13 0.38 0.29 0.05 0.07 0.06
Cost/ha ($) 23.19 33.02 32.29 32.14 32.14 14.26 18.14 24.00
% CCI days with >2mm rain
42 21 33 71 73 31 33 0
*Possums not killed but collared and released.

Progress toward the eradication of TB from wildlife in the Hauhungaroa Ranges
Landcare Research Page 19
Kill traps for possum-TB surveillance: AS3 2012–13
Only 33 possums were killed from 4452 kill-trap nights (Table 6). All were successfully necropsied despite some being dead for up to seven days before necropsy. In line with previous experience in Project R-10681 (Sweetapple & Nugent 2008) indicating that the western part of the VCZ held few possums; only a single possum was captured in the first trapping session there. As a result only the North and South trapping blocks were trapped for two further sessions.
Table 6 Numbers of possums captured, trapping effort (trap nights) and capture rates (possums per 100 trap nights, expressed as a percentage) during weekly trapping sessions in the three trapping blocks delineated in Figure 1, using sentinel kill traps spaced 100 m apart along parallel traplines 500 m apart. KTCI = 7-day Kill Trap Catch Index
Possum kills/trap night = %KTCI
Block Area (ha) Session 1 Session 2 Session 3
West 410 1/490 = 0.2%
AS3 North 500 4/560 = 0.71% 3/546 =0.55% 4/483 = 0.82%
AS3 South 720 11/826 = 1.33% 5/770 = 0.65% 5/777 = 0.64%
Totals 1630 16/1876 = 0.9% - -
N + S Totals 1220 15/1386 = 1.1% 8/1316 = 0.61% 9/1260 = 0.71%
The three consecutive trappings, in the north and south sub-blocks, produced an overall decline in trap-catch rate, but there was no reduction between the second and third sessions. With the low number of sessions, this inevitably makes estimation of population size using removal methods imprecise. Nonetheless, fitting an exponential ‘capture rate decline’ curve to the three data points (Figure 3), we estimated a total population of 67 possums in the two blocks. If so, the 32 possums captured from the three sessions represented a 47% kill, and therefore an SSe of about 0.45.
Alternatively, extrapolating the estimated July 2012 density of 0.037 possum /ha forward 12 months, using an exponential rate of increase of 0.55 (see p. 35), results in an estimated 90 possums present prior to kill trapping and a resulting kill estimate of 30.1% with a sensitivity of about 0.29. The accuracy of the rate-of-increase assumption for the AS3 possum population is not known, so this figure should be regarded as broadly indicative only.
A total of 68 days of fieldwork was required to complete the three trapping sessions in the North and South blocks. Assuming all-in operational contractor costs of $600 per field day, the cost of kill trapping was $29/ha. However, this included shifting traps twice – excluding that addition would reduce the cost to $19/ha, but capture rates may have reduced during the last two sessions. These estimates do not include the extra helicopter time required to distribute (and retrieve) kill traps across the study area. Countering that, trap spacing in this trial (0.2 trap/ha) was determined largely by the limited number of traps available to us, so it is likely that percent kill and cost-effectiveness could be improved if trap spacing along traplines was reduced to 30 or 50 m. However, increasing trap density will be offset by cost

Progress toward the eradication of TB from wildlife in the Hauhungaroa Ranges
Page 20 Landcare Research
increase due to the expense of establishing these bulky traps in deep forest, so the increase in cost-effectiveness might not be large.
Figure 3 Actual and predicted weekly capture rates (filled circles and dashed line respectively) for successive weekly trapping sessions of the northern and southern trapping blocks combined, using kill traps placed 100 m apart on traplines spaced 500 m apart in part of the AS3 VCZ in winter 2013. The solid line represents the trend line fitted to the actual data.
5.4 Discussion
The work conducted in Tihoi 3A in 2010 confirmed that it would be practicable and affordable to survey almost all of the native forest areas in HRR using ground-based methods. However, some areas of exotic forest were difficult to traverse on foot, so the cost of ground survey was high. Likewise, the steep sides of some river systems could make some riparian strips much more difficult and costly (and less safe) to survey than average.
The subsequent trials in AS3 were aimed originally at determining whether a ground-based detection-and-targeted-mop-up approach might be a cost-effective alternative to aerial control. The logic was that if a DTC approach was implemented soon after an aerial operation (preferably the second of the three nominally required), the low density of possums present at that time would result in few detections and therefore a limited requirement for mop-up trapping. If so, the reduced cost could potentially make ground-based control an affordable alternative to conducting a third aerial operation. This would be a useful option if constraints on the use of aerial 1080 baiting were increased. Since the trial was initiated, however, the likelihood of such constraints has diminished as a result of stronger independent support for 1080 (PCE 2013). Further, our trials collectively showed not only wide variation in the cost-effectiveness of the DTC approach, but also that at a spacing of 250–500 m between detection transects, the reductions in possum densities usually lay in the 30–60% range. That level of reduction is likely to be similar to or lower than the rate of possum increase at very low density that we believe is usual for possums in
y = 0.0118e-0.208x
0.0%
0.2%
0.4%
0.6%
0.8%
1.0%
1.2%
0 5 10 15 20
% catch per trap night
Weeks of trapping

Progress toward the eradication of TB from wildlife in the Hauhungaroa Ranges
Landcare Research Page 21
the HRR (see Evaluating SPM parameters for the HRR, p. 31). We conclude that using DTC for ground-based control alone is feasible but would likely be more expensive than low-cost aerial baiting.
Ground-based control has the advantage that it can deliver possum carcasses for surveillance. During the duration of this project, operational practice around declaring TB freedom has evolved. For many VCZs in the HRR, the prior probability of TB freedom probably exceeded 0.9 by the end of 2011, and was further increased by the end of 2013 (Section 8.3 Table 13). Current protocols (TBfree New Zealand 2013) stipulate that the PrP0 be set at the actual value or at 0.9, whichever is the lesser, so for most VCZs it is already at the maximum value of 0.9. The final control operations (mostly scheduled for 2016–2017) will therefore not change this value, but will increase our confidence that 0.9 is a conservative estimate.
A key implication is that with PrP0 = 0.9, a single survey of about 60% of the possum population is adequate to achieve the PoF95 target. That is both feasible and affordable with the DTC method, and could be conducted at any time. We consider that 250–500-m spacing could be adequate for that, at a cost of $20–$30/ha.
The answer to how often DTC will be more cost effective than leghold or kill trapping depends largely on possum density. The 2011 trapping in Tihoi 3A suggested a negative correlation between percent reduction in CCIs on monitoring lines and the pre-control CCI recorded in eight sub-blocks (Table 3), and at low CCIs the amount of targeted trapping is greatly reduced, magnifying the effect of that on cost-effectiveness. Although we now consider some of the very high reductions calculated were overestimates, we believe the negative relationship is valid.
Unless possum surveillance can be conducted in conjunction with the final control operation, we conclude, direct surveillance of possums (where considered necessary) would best be implemented soon after the final control. We suggest conducting surveillance about one year post-control would favour use of the DTC approach, yet minimise the effect of any immediate-post-control downward bias on the detection rate. If funding resources do not permit possum surveillance soon after control and, as a result CCIs in some blocks increased to >10%, leghold trapping would become more cost effective.
The hoped-for advantage of using kill trapping (substantially more trap nights per trap visit) was not realised. This occurred partly because the bulkiness of the traps greatly reduced the number that could be set and serviced per field day, and partly because we had insufficient traps available to us. In addition, the trapping success per night was lower than for leghold trapping. We therefore conclude that kill trapping with current designs and trapping success is unlikely to match the cost-effectiveness of leghold traps, unless the period between visits is extended to up to 2 weeks. For necropsy surveys, that is only feasible if they are conducted when temperatures are suitably low, usually in the middle of winter.

Progress toward the eradication of TB from wildlife in the Hauhungaroa Ranges
Page 22 Landcare Research
6 TB spillback risk from deer to possums (and pigs)
6.1 Aim
Deer appear able to survive in an infected state for many years, and there is circumstantial evidence that TB can spill back from deer to possums (Nugent 2011). That creates a spillback risk whereby TB could re-establish in possums after having been successfully eradicated through intensive possum control. To assess the duration of that risk, predictive modelling of the Hauhungaroa deer and possum population was undertaken, and the outcomes were compared with empirical (historical and recent) data on the decline in TB levels in deer (and pigs).
6.2 Methods and data sources
An overall model was constructed by integrating the following three component models (Barron & Nugent 2011; Barron et al. 2013):
• An age- and sex-structured deer population model for predicting (1) the population responses to various deer control options and (2) changes in TB prevalence in response to the reductions in force of infection as a result of possum control. It was assumed that all TB in deer was spillover infection from possums.
• A non-spatial model (Barlow 2000) of possum population dynamics and TB prevalence in response to three episodes of aerial 1080 poisoning at 5-yearly intervals, assuming 95% population reduction in the first operation and 85% in the subsequent two.
• A variant of the SPM (Ramsey & Efford 2010) that was used to predict the likelihood of TB re-establishing in possums after completion of the 10-year possum control programme if a single possum became infected through scavenging on the carcass of a deer that had been infected many years previously.
The models were, as far as possible, tailored to the HRR by using the substantial amount of historical data from that area on TB epidemiology and prevalence, and possum and deer abundance. We also summarised published and unpublished empirical data on the prevalence of TB in deer and pigs, and on the effect of possum control in reducing the prevalence of TB in those species.
6.3 Main findings
Modelling the duration of spillback risk from deer
We used a simulation model (Barron et al. 2013, Appendix 4) to first predict changes in TB prevalence without possum or deer control, with the following results. The model was configured to predict a density of about 12 deer/km2 and 650 possums/km2 (6.5 possums/ha), with TB prevalences of 35% in deer and 2.5% in possums (Figure 4, Scenario 1), approximating the situation that we believe prevailed before possum control was initiated. Assuming complete and even control-coverage at the levels specified, a

Progress toward the eradication of TB from wildlife in the Hauhungaroa Ranges
Landcare Research Page 23
programme of three aerial 1080 baiting operations over 10 years was predicted to eliminate TB from possums within c. 7 years (Figure 4, Scenarios 2–5).
Figure 4 Predicted changes in mean deer and possum density and TB prevalence under the following control scenarios (from the top down); Scenario 1: No deer or possum control; Scenario 2: Aerial 1080 baiting of possums on three occasions over 10 years, but not deer control; Scenarios 3–5: Same as Scenario 2, but with the various forms of deer control depicted by the declines in deer density (from Barron & Nugent 2011).
0
0.05
0.1
0.15
0.2
0.25
0.3
0.35
0.4
0123456789
101112131415
0 1 2 3 4 5 6 7 8 9 10 11 12 13 14 15 16 17 18 19 20
TB p
reva
len
ce
Den
sity
per
km
2
Year
Deer
0
0.01
0.02
0.03
0.04
0.05
0
100
200
300
400
500
600
700
0 1 2 3 4 5 6 7 8 9 10 11 12 13 14 15 16 17 18 19 20
TB p
reva
len
ce
Den
sity
per
km
2
Year
Possums
Density
Prev.
0
0.05
0.1
0.15
0.2
0.25
0.3
0.35
0.4
0123456789
101112131415
0 1 2 3 4 5 6 7 8 9 10 11 12 13 14 15 16 17 18 19 20
TB p
reva
len
ce
Den
sity
per
km
2
Year
0
0.01
0.02
0.03
0.04
0.05
0
100
200
300
400
500
600
700
0 1 2 3 4 5 6 7 8 9 10 11 12 13 14 15 16 17 18 19 20
TB p
reva
len
ce
Den
sity
per
km
2
Year
0
0.05
0.1
0.15
0.2
0.25
0.3
0.35
0.4
0123456789
101112131415
0 1 2 3 4 5 6 7 8 9 10 11 12 13 14 15 16 17 18 19 20
TB
pre
vale
nce
Den
sity
per
km
2
Year
0
0.01
0.02
0.03
0.04
0.05
0
100
200
300
400
500
600
700
0 1 2 3 4 5 6 7 8 9 10 11 12 13 14 15 16 17 18 19 20
TB p
reva
len
ce
Den
sity
per
km
2
Year
0
0.05
0.1
0.15
0.2
0.25
0.3
0.35
0.4
0123456789
101112131415
0 1 2 3 4 5 6 7 8 9 10 11 12 13 14 15 16 17 18 19 20
TB p
reva
len
ce
Den
sity
per
km
2
Year
0
0.01
0.02
0.03
0.04
0.05
0
100
200
300
400
500
600
700
0 1 2 3 4 5 6 7 8 9 10 11 12 13 14 15 16 17 18 19 20
TB
pre
vale
nce
De
nsi
ty p
er
km2
Year

Progress toward the eradication of TB from wildlife in the Hauhungaroa Ranges
Page 24 Landcare Research
With no additional deer control, the predicted spillback risk period after TB eradication from possums was a further ~7 years; i.e. was predicted to remain for 14 years after the initiation of intensive possum control (Figure 4, Scenario 2). The probability of TB re-establishing in possums from deer over that 14-year period was predicted to be 0.06, but with most of the risk falling early in the period. Additional targeted control of deer would reduce the risk period and probability of spillback to some extent, but even with high deer population reductions (up to 80%) only modest decreases in risk and risk period were predicted (Figure 4, Scenarios 3–5).
Applying those predictions in more detail, the indications are that resident TB-infected deer will have disappeared by about 2008 from the large parts of the Hauhungaroa area in which intensive control was initiated in 1994 or 1995. However, TB-infected possums were still present in a central-western part of the area in 2005 (de Lisle et al. 2009; and see TB and possum control histories in the HRR, p. 28), and the model therefore predicts that spillback risk could persist until about 2019 in at least that area. If the precautionary principle was followed, this would require that possum numbers not be allowed to exceed the TB persistence threshold before that date.
For the final three years of the programme, only one or two infected deer are predicted to remain alive, and consequently the probability of spillback risk is very low.
Empirical rate of decline in deer TB prevalence
Aerial 1080 baiting of the whole eastern flank of the Hauhungaroa Range (EHR) in 1994 and 2000 resulted in a steady decline in the prevalence of TB in deer in that area from 28% (n = 29; gross lesion prevalence only ) in 1993 to 7% (n = 61; included culture of ‘no-visible lesion’ cases) in 2001–2004 (Nugent 2005). An east–west gradient in TB prevalence in deer developed across the 7–8-km-wide area over the 1994-2004 period that probably reflected immigration by infected deer or possums from the still-infected possum population to the west (Figure 5). Excluding an infected deer found close to a confirmed focus of TB in possums, all female deer found to be infected were killed within 2.7 km of the western boundary of the control area. A key implication is that a 3-km radius (an area of ~2800 ha) around a female TB+ve deer is highly likely to include the site at which it became infected.
Another implication is that the observed decline in TB prevalence in deer in the EHR would likely have been faster if possums to the west had been controlled. In line with this, the impact of possum control on reducing TB prevalence in deer appears to have been more rapid in the western-central part of the Hauhungaroa Range. The highest prevalence of TB ever recorded in wild New Zealand red deer (47%, n = 44; Nugent 2005) was measured there in 1999. Although possum control was implemented there in 2000, it was ineffective in places and TB was still present in possums in 2005 (see TB and possum control histories in the HRR, p. 28). Deer were probably still becoming infected with TB until then. Intensive aerial control of possums was successfully imposed for the first time in 2005 and as early as 2011 TB levels in deer had fallen to near zero levels with no TB recorded in 36 deer killed in that area that year (Nugent et al. 2012a).

Progress toward the eradication of TB from wildlife in the Hauhungaroa Ranges
Landcare Research Page 25
However, two TB-infected deer classed as potentially infected in 2014, one from AS4 that is yet to be confirmed, and the other at the south-eastern edge of T3A (I. Yockney & J. Sinclair, pers. comm.). The latter, a young deer, was concerning, as discussed below (Section 6.4).
Figure 5 East–west gradient in TB prevalence in deer in the eastern Hauhungaroa Range in the 1994-2003 period. Data are sample sizes (open bars), number of TB-infected deer (filled bars), and TB prevalence (filled circles). The ‘Distance from boundary’ is the distance eastward from the western boundary of the 1994 poison operation (so deer shot in the western Hauhungaroa Range, where possums were not controlled, are assigned a negative distance). Only deer born and shot after 1993 are included. The dotted line excludes an infected deer shot near infected possums within the eastern Hauhungaroa Range. Image reproduced from fig. 9 in Nugent & Whitford (2003).
Assuming, as a worst case scenario, (1) the area that was not effectively controlled for possums until 2005 was ~ 100 km2 in size and (2) a deer density between 5 and 10 deer/km2 (Nugent et al. 1997), the deer population at risk of becoming infected would have comprised 500–1000 deer. If we assume firstly (most optimistically) that there was no further transmission to deer after the initial possum control in 2000, and an annual 30% mortality of deer (which is usual for a hunted population), then the resulting exponential decline in the number of infected deer results in TB disappearing from the deer population by 2014 (solid line, Figure 6).
Born after spring 1993
0
20
40
60
80
100
-4 -2 0 2 4 6
Distance from boundary (km)
Num
ber
of
dee
r
0%
10%
20%
30%
40%
Tb P
reval
ence
.
Born before spring 1993
0
20
40
-4 -2 0 2 4 6
Distance from boundary (km)
Num
ber
of
dee
r
0%
10%
20%
30%
40%
50%
60%
Tb p
reval
ence
.

Progress toward the eradication of TB from wildlife in the Hauhungaroa Ranges
Page 26 Landcare Research
Figure 6 Observed TB prevalence in deer in the central-western Hauhungaroa Range, and predicted number of TB-infected deer assuming an overall population of 1000 deer. The red circle for 2011–2013 represents the average recorded TB prevalence across those three years. The predicted number of infected deer assumes a constant exponential decline started in either 2000 (solid line) or 2005 (dashed line).
This is consistent with the predictions of the simulation model above. Alternatively, however, if a high rate of TB transmission from possums to deer continued until 2005, TB would persist in the deer population until about 2019 (dashed line, Figure 6). If all the TB suspects reported in 2013 are all confirmed as infected, the average recorded prevalence for the 2011–2013 period lies half way between these two predictions.
Focussing on the TB+ve deer shot on the south-eastern boundary of T3A, a 3km radius around the kill site is likely to encompass less than 2000 ha of deer habitat (the rest being clear farmland). Up till mid-2013, 32 deer had been necropsied from T3A & T3B since 2010, all TB-ve. That total will have increased to about 50 by mid-2014, suggesting a 3-year average prevalence of 2% (provided no further TB+ves are detected) (95% confidence interval 0-12%). Between this report being submitted for review (in April 2014) and its belated revision in 2016, this case of infection has been discounted.
Under the same assumptions as above, the area could contain 200 deer. At a prevalence of 2%, about four infected deer would be present. At an annual mortality rate of 30%, that number would decline to less than one well before 2020. At the upper 95% CL of 12%, the same assumptions predict the decline to less than one would take till 2022.
Empirical rate of decline in pig TB prevalence
The effect of possum control on TB prevalence in pigs in the eastern Hauhungaroa Range has been documented by Nugent et al. (2011a). In 1994, when control was first imposed, the prevalence of TB in the pig population appears to have been high because four of five pigs examined were infected (Lugton 1997). Prevalence between 1996 and 2000 was
0
100
200
300
400
500
0%
10%
20%
30%
40%
50%
1999 2004 2009 2014 2019 2024
Pre
dic
ted N
TB
deer
TB
pre
vapence in d
eer
Year
Observed TB prevalence
Averaged TB prevalence

Progress toward the eradication of TB from wildlife in the Hauhungaroa Ranges
Landcare Research Page 27
variable, but with a strong east–west gradient of prevalence, especially in pigs > 1 year old. Specifically, there was a near-zero prevalence at the eastern edge of the Hauhungaroa Range (which has been subject to possum control since 1994) , yet a high (80%) prevalence of TB in pigs 7-8km to the west in the areas immediately adjacent to the uncontrolled possum population in the central-western part of the range (Fig. 2 in Nugent et al. 2011a). In 2000, 79% of 19 pigs surveyed in the EHR were infected. Aerial control was conducted again in that area in 2000, and the adjacent central-western part of the range was also treated at this time. Prevalence fell to about 31–33% in each of the next four years. It then fell sharply to zero (n = 26 pigs surveyed) in 2007, within 2 years of high-intensity control being achieved over the whole area for the first time in 2005. Overall prevalence in the HRR is now very low, with none infected among the 353 pigs collected during operational surveillance in the 2012–2013 year. However, TB+ve pigs continue to be detected sporadically, with one TB+ve pig recorded in early 2012, and three suspected (but unconfirmed) cases so far detected in the 2013–2014 operational survey (I. Yockney, pers. comm.).
These results imply that, within poisoned areas, TB levels in possums must have fallen to very low levels within a few years of the initial imposition of effective control, otherwise TB levels in pigs well away from uncontrolled possums would not have fallen so quickly. Levels did not initially decline rapidly in pigs because pigs ranged widely enough to encounter TB+ve possums in uncontrolled (or poorly controlled) areas. The gradient of infection in pigs across the eastern side of the range spanned the whole 7–8-km wide area, indicating the kill site of a TB+ve pig (especially one more than a year or so old) provides a far less precise indication of where it is likely to have acquired infection than it does for female deer. Put simply, the presence of a TB+ve pig within a VCZ does not provide strong evidence that it acquired the infection in, or even within, 5 km of that VCZ.
6.4 Discussion
The detection of TB in pigs and in one deer in 2014 is consistent with (1) long-term persistence of TB in deer that were likely infected up to 15 years ago and (2) post-mortem transmission from deer carcasses to pigs.
For the probable TB+ve deer killed in late 2013 in AS4, its sex (male), age (5 years) and state of infection (well contained highly calcified lesions) are consistent with the infection being acquired from possums in about 2010 or 2011, and 2012 at the latest. As it was only 2–3 km from the last known locations of TB-infected possums in AS3, its occurrence is unsurprising. Crucially, however, it suggests that TB was still present in possums in that vicinity until at least 2010. Given no TB has been detected in any possum surveys conducted in AS3 since 2009 (233 possums), and the very low possum densities now prevailing in the neighbouring AS4 VCZ in which the TB-infected deer was found, we have some confidence that TB no longer persists in the possum population there. Nonetheless, despite that, TB may continue to be occasionally detected in pigs or deer over the next five or so years, either because of ancient infection in old deer, or in young and old pigs that have scavenged a deer carcass after it died from TB acquired long ago.
Our failure to detect any TB in over 500 possums necropsied in Tihoi3A in recent years during which TB pigs have been found very strongly suggests that TB is absent from the area

Progress toward the eradication of TB from wildlife in the Hauhungaroa Ranges
Page 28 Landcare Research
– if it is still present, there would be only a negligibly miniscule chance of the being more than one focus of persistent TB in possums, yet the two pigs had different whole genome sequences (M. Price-Carter, pers. comm.). That strongly favours the idea that TB has persisted outside the possum population, in deer and pigs. Our modelling indicated that the deer spillback risk (to possums and pigs) could potentially persist for up to 14 years after initial possum control. However, for most parts of the Hauhungaroa Range, including where this deer was found, control histories already substantially exceed that. The occurrence is therefore particularly worrying, and considerably strengthens the case for keeping possum density below the TB persistence threshold in T3A and northern T3B (and also AS3 and AS4) until at least 2019. The scheduled operations in 2015–2018 should deliver that reduction. The occurrence of this detection also highlights a need for continued deer surveillance to assess whether any spill back risk remains in other parts of the area.
The 8-km-wide gradient of TB infection in pigs that established in the eastern Hauhungaroa Range in 1994–2005, when possums on the east were intensively controlled but those on the west were not (Section 5.3), suggests pigs in the HRR may effectively be wide ranging, with maximum range lengths of 7-8km. Thus, the sample location of a TB+ve pig provides little insight into where infection was acquired, particularly for older pigs. This severely undermines their utility for declaring TB freedom at a VCZ scale. We therefore suggest that direct surveillance of possums be adopted as the primary approach for declaration of TB freedom in possums at the VCZ scale. Although this is likely to be much more costly than relying on pig surveillance, it would enable declaration of TB freedom in possums to be made far earlier in those individual VCZs in which effective control was achieved 20 years ago. We suggest that ongoing pig and deer surveillance over the whole HRR could be used to quantify whether any risk of spillback from deer persists and to provide a post-declaration early-warning system should TB re-establish in possums, leading eventually to a declaration of eradication from all wildlife.
7 Predicting the probability of TB freedom from control history
7.1 Aim
The ‘Proof of Freedom’ framework adopted by OSPRI relies on combining two sources of information – an assessment of the likelihood that enough possum control has historically been applied to eradicate TB from possums, and empirical surveillance data from possums or sentinels. In this section, we focus on the former. The prior probability of TB freedom in possums (PrP0) given a VCZ’s known or assumed history of possum control can be predicted for any time point using the SPM. For the purposes of this report, we used Spring 2011 and mid-2013 as our illustrative starting point for all VCZs to demonstrate progress toward TB freedom. The spring 2011 date was chosen to allow us to include in the control history aerial 1080 baiting operations conducted in winter 2011.

Progress toward the eradication of TB from wildlife in the Hauhungaroa Ranges
Landcare Research Page 29
7.2 Approach
TB and possum control in the HRR
A brief summary of the emergence and control of TB in the HRR was compiled from the scientific literature, unpublished reports, and personal knowledge available to us.
Evaluating model parameters for the HRR
The predictions of the SPM depend upon the underlying assumption used to parameterise the model. Usually, a set of default assumptions is applied (TBfree New Zealand 2013). However, a substantial amount of research has been conducted on possum ecology and epidemiology in the HRR. Thus, we revisit the default assumptions in this report to assess whether alternative assumptions might be more appropriate for the HRR. We therefore collated and summarised the published and unpublished data available to us to identify what we considered might be the most appropriate HRR-specific values for (1) pre-control carrying capacity K, (2) the intrinsic rate of annual increase r, and (3) the relationship between the two main indices of abundance (RTCIs and CCIs) and actual possum density. We then attempted to determine the extent to which HRR-specific parameters affected the predictions of the SPM, but within the scope of this project were unable to find a combination of parameters that consistently predicted the historically observed patterns of TB prevalence in possums both in the absence of control and in response to control. We therefore relied on the default or standard parameters.
Estimated prior probabilities of TB freedom
PrP0 values for each VCZ were estimated using the SPM parameterised with the standard ‘default’ values adopted by OSPRI and with truncated (i.e. since 2005) control histories. We initially planned to use the full control histories for each area. However, scant and incomplete information available from the earliest operations, plus major changes over time in the size, shape, and designation of management units and operational boundaries, made it difficult to do that accurately and meaningfully. We therefore used as our baseline the 2005 operation that covered the whole area except the Rangitoto Range, and assumed that the area had not been previously controlled. This approach aligns with TBfree NZ’s generic strategic approach to TB eradication using periodic aerial baiting (i.e. three aerial operations at ~5-yearly intervals), with the operations in 2005 and 2011–2012, and those planned for 2015–2017 comprising the three operations. For the Rangitoto Range and other VCZs not treated in 2005, we estimated likely possum abundance in 2005 by either forward or backward projection from the available data that were closest to that time point, and expressed it as a percentage of carrying capacity, then adopted that as a nominal reduction achieved in that year.

Progress toward the eradication of TB from wildlife in the Hauhungaroa Ranges
Page 30 Landcare Research
7.3 Main findings
TB and possum control in the HRR
Hauhungaroa Range
Bovine TB probably became established in possums in the HRR during the late 1960s, as it was already well established in deer in the western central part of the ranges by the late 1970s (Nugent 2005). The first formal survey of TB prevalence was conducted in 1982–83 with 2.1% of 6083 possums obtained from the perimeter of the area having gross TB-like lesions (Pfeiffer et al. 1995). There were 27 local clusters of infection, and in those clusters adult possums were 1.9 times as likely to be infected as immature animals, and the total prevalence was 5.4% in males compared with 3.9% in females.
Aerial 1080 baiting was conducted over parts of the area from as early as about 1975, including up to 2–3 km into the forest from the bush–pasture margin (K. Crews, pers. comm.), but subsequent control was limited. In the winters of 1994 and 1995, however, most of the Hauhungaroa Range was brought under control as part of a large adaptive management experiment to determine the effectiveness of aerial control in 1-, 3- and 7-km-wide ‘buffers’ from forest–pasture margins into deep forest in reducing the rate of infection in cattle (Fraser et al. 1995; Coleman et al. 2000). Only a ~19 000-ha ‘hole-in-the-middle’ area in the central-western section of the Hauhungaroa Range was left uncontrolled at that time.
In a south-eastern part of the area subject to control (Waihaha catchment), the pre-control possum density was moderate (TCI = ~20%) with a TB prevalence of 1.2%. After control, the RTCI in that sub-area was zero, indicating high efficacy. The TCI then increased to about 8% by 2000 (when control was repeated), but no TB was detected in the 408 possums necropsied there during 1995–1999 (Coleman et al. 2000). In contrast, in a western sub-area poisoned at the same time, control efficacy appears to have been lower, with TCIs increasing quickly to near pre-control levels by 2000 and TB-infected possums being detected 2 and 5 years after control (Coleman et al. 2000). The 5-year post-control infected possum was found close to the uncontrolled central area. TB-infected possums were also found at two other locations, one of which was also near the uncontrolled central area, and the other in a much smaller 300–400-m-wide streamside strip deliberately excluded from the 1994 poisoning operation (Nugent 2005). Thus the only evidence of TB persisting >2 years after control was first imposed was in or near uncontrolled areas.
In contrast to the low (or zero) prevalence in poisoned areas, the prevalence of TB was close to 6% in possums and 47% in deer within the uncontrolled central-western area (which includes the eastern parts of AS2, AS3, AS4, and AS6) during 1997–2000 (Nugent 2005). In August 1999, five (12.8%) of 39 possums killed along a 2-km cyanide line in AS3 had typical TB lesions (G. Nugent, unpubl. data). This uncontrolled area was brought under control for the first time in 2000–2001. The outcome of the 2001 operation was not measured, but in winter 2004, one of 141 (0.71%) possums killed during trend monitoring conducted throughout the entire Hauhungaroa Range had a typical TB lesion. That possum was killed on a line in the centre of AS3 on which 23% TCI was recorded. Pre-control trapping one year

Progress toward the eradication of TB from wildlife in the Hauhungaroa Ranges
Landcare Research Page 31
later in April–May 2005 identified a large area (~5000 ha encompassing most of what is now designated as AS3) where all but one of the 17 transects had TCIs > 13% (Nugent & Whitford 2006). One of the possums trapped during the 2005 pre-control survey also had gross TB-like lesions. A follow-up necropsy survey of a 24-ha area around the kill site of the infected possum produced 93 possums (3.8 per hectare), of which 1% had gross culture-positive lesions and a further 10% had no lesion but were culture positive (de Lisle et al. 2009). The implication was that the 2001 operation achieved only a modest or zero effect on possum abundance in parts of that area, enabling TB to persist in possums until 2005.
In 2005, however, a 82 976-ha operation covered the whole Hauhungaroa Range, with dual prefeeding at what would now be regarded as very high sowing rates applied to most of the area (Coleman et al. 2007). However, the AS3 VCZ was used in an attempt to compare the effectiveness of single and dual prefeeding. Specifically, in the AS3 VCZ, a single prefeed of 2 kg/ha of cereal pellets was followed by cereal bait containing 0.15% 1080 at 5 kg/ha, whereas the AS4 VCZ immediately to the south received two prefeeds, each of 2 kg/ha of cereal pellets. These treatments were compared using standard TCI/RTCI traplines in each block measured before and after control. The RTCI recorded in AS3 after the 2005 operation was 0.2% (one possum caught on 18 RTCI lines), ~98% lower than the 9.8% TCI recorded on 10 lines before control. None were caught in AS4. The AS3 VCZ was resurveyed three times in 2006–2008 using widely spaced chewcards as part of Project R-10669 and detection rates were consistently higher in the AS3 VCZ than in AS4 (Nugent et al. 2008). Although that difference was not statistically significant, a 47% CCI recorded in AS3 before control in 2011 was more than double that in AS4 (21%) (Nugent et al. 2012a). Taken with evidence that dual-prefeeding consistently increases kill rates (Coleman et al. 2007; Nugent et al. 2011b), these data indicate that the 2005 control operation is likely to have had slightly lower efficacy in AS3 than in the rest of the 81,000 ha operational area
Much of the area was again aerially poisoned in winter 2011. Pre-and post-control chewcard surveys were conducted in some VCZs, whereas RTCI monitoring was conducted in most of them (Table 7). This monitoring indicated wide variation in pre-control CCIs, with AS3 having the highest index. Post-control indices were below 1% in all VCZs except AS3 (1.7%) and the eastern half of AS2 (2.5%). Subsequently, AS3 has been partially covered by two ground-control operations (see Section 5.2) and AS2 was subject to repeat aerial control in 2013 that reduced the post-control CCI for the whole VCZ to 1.5% (i.e. equivalent to an RTCI of 0.25%).
To summarise, about three-quarters of the Hauhungaroa Range has been under effective control since 1994, and almost all of it was subject to particularly intensive control in 2005. However, apparently poor control in and near the AS3 VCZ in 2001, and the use of slightly less intensive control in AS3 in 2005, make that VCZ the area in which TB is likely to have persisted longest. Further, (as already noted) the last TB+ve possums recorded for the HRR were found in that VCZ in 2005, 9 years ago.

Progress toward the eradication of TB from wildlife in the Hauhungaroa Ranges
Page 32 Landcare Research
Table 7 Summary of recent monitoring outcomes in the Hauhungaroa Range, before and after aerial 1080 poisoning of most of the area in 2011, including additional control in the AS2 (E&W), AS4 and AS6N VCZs in 2013. The Tihoi 3B and AS6S VCZs were monitored but not poisoned in 2013. CCI = 7-day Chewcard Index. RTCI = Residual Trap-Catch Index
Study block
CCI (%) Autumn 2011
(Pre 1080)
CCI (%) Spring 2011
(Immediately post-1080)
CCI (%) Summer 2012 (6–8 months post-1080)
RTCI (%) Summer 2012 (6–8 months post-1080)
CCI (%) Autumn 2013
(Pre-1080)
CCI (%) Spring 2013 (Post-1080)
AS1 0.34 (± 0.50)
AS2 E 34.4 28 22 2.48 (± 1.42) 24 3
AS2 W 20.6 1 0 1.29 (± 1.14) 9 0
AS3 47.5 8 8 1.72 (± 1.17)
AS4 23.3 9 1 0.0 6 0
AS5 0.14 (± 0.29)
AS6 N 5.6 3 1 0.21 (± 0.45) 1 0
AS6 S 2.5 0 0.0 0 0
AS7 W 38.2 4 7 0.86 (± 1.06)
Tihoi 3B 17.6 1 2 0.34 (± 0.49) 2 2
Tihoi 4 0.34 (± 0.49)
Rangitoto Range
Possum control in the Rangitoto Range dates back to 1987 (Table 8). The ~4000-ha Waipapa Ecological Area within that area has been subject to intensive control for kōkako (Callaeas cinerea) protection, with long periods of annual ground-based possum and rat control we are confident will have eliminated TB from possums. For the larger area, the former Animal Health Board first applied control to the whole 40 000-ha area in 1996 and estimated kill at 99.3% (Sweetapple & Fraser 1997). Control was not repeated until 2007–2008, because trend monitoring in 2004–2005 indicated possum densities were still low (TCI = 1.4%). Given our belief that the rate of increase for possums in the area is high (Section 8.3), the low TCI in 2004–2005 adds weight to the very high kill estimate calculated for 1996.
Trend monitoring in 2012–2013 indicated a TCI of 1.9%, a four-fold increase over the 4.5 years since the 2008 control operation when the RTCI was 0.5%. This result implies that the 2008 operation was less effective than the operation in 1996. We are not aware of any information on TB levels in the possums in the Rangitoto Range since the 1980s, but in 1995 21% of 34 deer shot there had lesions typical of TB, lower than the 33% recorded in the Hauhungaroa Range at that time (Nugent 1998).
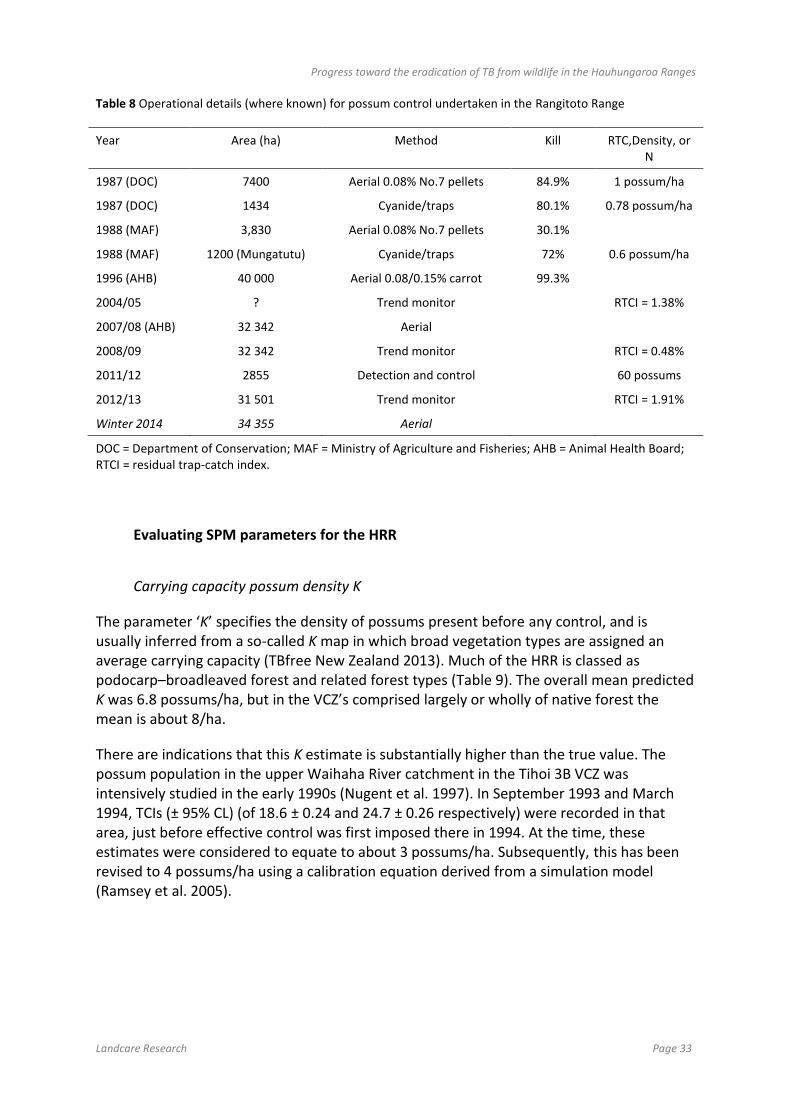
Progress toward the eradication of TB from wildlife in the Hauhungaroa Ranges
Landcare Research Page 33
Table 8 Operational details (where known) for possum control undertaken in the Rangitoto Range
Year Area (ha) Method Kill RTC,Density, or N
1987 (DOC) 7400 Aerial 0.08% No.7 pellets 84.9% 1 possum/ha
1987 (DOC) 1434 Cyanide/traps 80.1% 0.78 possum/ha
1988 (MAF) 3,830 Aerial 0.08% No.7 pellets 30.1%
1988 (MAF) 1200 (Mungatutu) Cyanide/traps 72% 0.6 possum/ha
1996 (AHB) 40 000 Aerial 0.08/0.15% carrot 99.3%
2004/05 ? Trend monitor RTCI = 1.38%
2007/08 (AHB) 32 342 Aerial
2008/09 32 342 Trend monitor RTCI = 0.48%
2011/12 2855 Detection and control 60 possums
2012/13 31 501 Trend monitor RTCI = 1.91%
Winter 2014 34 355 Aerial
DOC = Department of Conservation; MAF = Ministry of Agriculture and Fisheries; AHB = Animal Health Board; RTCI = residual trap-catch index.
Evaluating SPM parameters for the HRR
Carrying capacity possum density K
The parameter ‘K’ specifies the density of possums present before any control, and is usually inferred from a so-called K map in which broad vegetation types are assigned an average carrying capacity (TBfree New Zealand 2013). Much of the HRR is classed as podocarp–broadleaved forest and related forest types (Table 9). The overall mean predicted K was 6.8 possums/ha, but in the VCZ’s comprised largely or wholly of native forest the mean is about 8/ha.
There are indications that this K estimate is substantially higher than the true value. The possum population in the upper Waihaha River catchment in the Tihoi 3B VCZ was intensively studied in the early 1990s (Nugent et al. 1997). In September 1993 and March 1994, TCIs (± 95% CL) (of 18.6 ± 0.24 and 24.7 ± 0.26 respectively) were recorded in that area, just before effective control was first imposed there in 1994. At the time, these estimates were considered to equate to about 3 possums/ha. Subsequently, this has been revised to 4 possums/ha using a calibration equation derived from a simulation model (Ramsey et al. 2005).

Progress toward the eradication of TB from wildlife in the Hauhungaroa Ranges
Page 34 Landcare Research
Table 9 Predicted possum carry capacity (K) values for HRR VCZs, showing VCZ size, and the percent of each VCZ in the four overall most common vegetation types plus the overall mean K for the VCZ. T1 includes a large percentage of exotic grassland that is not shown here. Predicted K values were derived from a map in which broad vegetation types were assigned an average carrying capacity (TBfree New Zealand 2013
VCZ acronym (Appendix 1 )
Area (ha)
Podocarp–broadleaved
(%)
Beech / podocarp–broadleaved
(%)
Exotic forest
(%)
Other indigenous forest
(%)
Mean K (possums/
ha)
AS1 9209 5 4 86 1 2.6
AS2 10 529 62 27 2 6 7.4
AS3 2982 88 6 0 2 8.6
AS4 3052 70 26 0 2 7.8
AS5 9005 23 41 16 9 5.3
AS6 3402 67 26 0 2 7.7
AS7 10 503 76 2 15 2 7.6
T1 2189 6 10 18 8 2.1
T2 8895 48 27 13 5 6.5
T3A 8418 38 29 13 5 6.4
T3B 13 815 88 2 0 1 8.7
R4 9043 62 2 15 8 6.8
RTT 34 365 63 12 7 8 7.2
All 12 5405 57 15 14 5 6.8
Possum pellet frequencies (the percentage of 1.14-m-radius plots with possum faecal pellets present) in the study area increased from 1990 (28%) to 1993 (45%) (Nugent et al. 1997). This may reflect the cessation of commercial fur trapping in the area in about 1988 as a result of low fur prices.
Pellet frequencies were measured annually between 1994 and 1999 over most of the eastern Hauhungaroa Range and a large portion of the westernmost part of the range. In some parts, pellet frequencies in 1994 exceeded 50% (fig. 4 in Coleman et al. 2000). This suggests those areas likely would have had a higher TCI than the Waihaha estimates noted above. Further, a trap catch of 28.5% was recorded from six traplines in the western Hauhungaroa Range before control in 1994 (Coleman et al. 2000), and TCIs of up to 30% were recorded on individual traplines in the central-western area in 2005 (Nugent & Whitford 2007). We therefore consider that the values in Table 9 are overestimates of carrying capacity, and suggest that a more conservative estimate would be about 5.0 possums/ha. All else being equal, using a lower carrying capacity in the SPM tends to result in more rapid disappearance of TB after control.

Progress toward the eradication of TB from wildlife in the Hauhungaroa Ranges
Landcare Research Page 35
TB transmission rate β
The default value of β in the SPM is 0.5 when K is 10 possums/ha, but varies inversely with K, presumably as a result of an inverse correlation with home range size (and therefore contact rates) (Barron 2012). The current protocol for identifying PrP0 (TBfree New Zealand 2013) therefore allows β to be varied to determine a value that produces a stable prevalence that matches the observed estimates of TB prevalence before possums were controlled (Table 10).
Relationships between indices and actual density
In compiling control histories, we rely largely on indices of possum abundance – either TCI/RTCIs or CCIs. However, the SPM simulates actual possum densities, so those indices are, effectively implicitly converted to density estimates. The evidence linking these indices to actual density is sparse and highly variable (Jones & Warburton 2012). However, during this and related studies, new data specific to the HRR have been accumulated.
In 2012, we empirically measured the correlation between TCI/RTCIs and CCIs in the Hauhungaroa Range (Nugent et al. 2012a), and found a 1:6 relationship consistent with previous work elsewhere (Sweetapple & Nugent 2011). At moderate TCIs (i.e. 5–30), the ‘5% TCI/RTCI = 1 possum/ha’ calibration produced by Ramsey et al. (2005) is thought to be fit for purpose. Combining these calibration equations suggests that a CCI of 6% equates to a density of 0.2 possum/ha.
There are increasing indications that those predictions are too high at very low densities, at least in non-forest habitats. For example, in the Blythe Valley, Canterbury, possum density based on population reconstruction was estimated to be 0.019 and 0.005 possums per hectare of possum habitat in December 2009 and April 2012, respectively (Nugent et al. 2013a). However, CCIs of 4.6% and 2.1% were recorded, respectively. Using the calibration above, this would equate to predicted densities of 0.1535 and 0.070, respectively – about 10 times higher than the estimates of actual density. Similarly, calculations overestimated predicted densities by 3–4 times in the Branscombe GS3 VCZ during the same study. Further, in a southern South Island dryland study, a CCI of 85% was recorded in an area where a trapping-based mark–recapture estimate of possum density suggested there were just 1.3 possums/ha (Milestone Report 6b; Project R-10737 Improved efficiency and effectiveness of ground-based possum control and monitoring in the southern South Island).
We therefore analysed HRR data from a number of recent trials in which an estimate of actual density could be derived and compared to the observed TCIs and CCIs (Appendix 3). Although the estimates are individually imprecise and questionable, there was a significant correlation between the TCIs (which were measured using a 50-m trap spacing) and the corresponding, but independentestimates of density (R2 = 0.86, df = 3, P = 0.047; Figure 7). After adjusting the TCI/RTCI downward by a third (to approximate the more usual 20-m spacing between traps during TCI trapping based on data in Nugent et al. 2008), we found that the TCI/Density ratio was c. 15:1, still three times higher than predicted by the Ramsey et al. ratio. The CCI/density correlation was more variable, and not statistically significant,

Progress toward the eradication of TB from wildlife in the Hauhungaroa Ranges
Page 36 Landcare Research
but was likewise much higher than expected based on currently accepted calibrations (Figure 7c, d).
For areas with low indices of possum abundance (<2% RTCI), we used the HRR ratios in Figure 7b & c to derive the estimates of post-control density needed to characterise control histories and, subsequently, to parameterise the SPM.
Table 10 Outcomes of OSPRI’s standard approach to selecting a transmission parameter (β). Simulations were conducted on a square 10 × 10km area with a uniform habitat with K set to the predicted average value from Table 9 for each of five groups of VCZs. Values for β were identified by whether or not TB persisted at 2–5% prevalence in unmanaged possums for >30 years, and whether or not TB recovered to >1% prevalence within 20 years of a one-off 80% reduction in possum density
VCZ acronym (see locations in Appendix 1)
K values (/ha)
β TB persistence at 2–5% without control
TB recovery in 20 years to >1% after one-off 80% control
AS1, AS2 2.1-2.6 3.0 Yes Yes
1.0 No No
AS5 5.3 1.10 Yes No
1.00 Yes, <2% No
0.95 Yes, <2% No
T3A, T2, T4 6.4-6.8 0.95 Yes, >5% Yes
0.90 Yes, >5% Yes
0.88 Yes, ~5% Yes
0.85 Yes No
R, AS2, AS4,AS6, AS7 7.2-7.8 0.80 Yes, >5% Yes
0.75 Yes Yes
0.70 Yes No
0.60 No, <1% No
T3B, AS3 8.6-8.7 0.75 Yes, >5% Yes
0.65 Yes, >5% Yes
0.62 Yes Yes
0.55 Yes No

Progress toward the eradication of TB from wildlife in the Hauhungaroa Ranges
Landcare Research Page 37
Figure 7 Empirical relationships between the estimates of possum density calculated in Appendix 3 and the TCI/RTCIor CCIs recorded at the same time. The TCI/RTCIs in (a) were recorded using 50-m spacing between traps, while (b) shows the same data adjusted downward by a third to approximate the expected TCI for a 20-m spacing between traps. In (d), one additional data point (empty symbol) is included (a CCI predicted from a TCI rather than measured).
Exponential annual rate of increase r
The default rate of increase for the SPM is 0.40 (Barron 2012). However, that is considered low for diverse broadleaved North Island forests (Nugent et al. 2010). We have previously estimated r values of up to 0.59 based on chewcard data collected over 2.5 years following the 2005 aerial 1080 baiting operation that covered most of the HRR (Sweetapple & Nugent 2009). We therefore consider an r = 0.50-0.60 could be more appropriate for the HRR. Use of a higher-than-default mid-range value of 0.55 results in the SPM predicting possum population recovery toward carrying capacity more quickly than it would otherwise, which in turn increases the likelihood of TB persistence.
y = 22.34xR² = 0.86
0
1
2
3
4
5
6
0.0 0.1 0.2
50-m TCI (%)
Density (possums/ha)
a.
y = 14.89xR² = 0.86
0
1
2
3
4
5
6
0.0 0.1 0.2
20-mTCI (%)
Density (possums/ha)
b.
y = 75.41xR² = 0.26
0
10
20
30
0.0 0.1 0.2 0.3 0.4
CCI (%)
Density (possums/ha)
c.
y = 78.59xR² = 0.14
0
10
20
30
0.0 0.1 0.2 0.3 0.4
CCI (%)
Density (possums/ha)
d.

Progress toward the eradication of TB from wildlife in the Hauhungaroa Ranges
Page 38 Landcare Research
TB-induced death rate
The SPM assumes the rate of additional annual mortality caused by TB (α) is 1.0. That value is largely based on an estimate of the average total duration of infection in possums, which in turn was based on a guess at the pre-clinical early stage of infection (before external signs of TB can be detected) and a measured estimate of the clinical state in wild possums (Ramsey & Cowan 2003). However, recent research using a new artificial challenge model that reliably reproduces the same distribution of lesions seen in wild naturally infected possums indicates that the preclinical stage is only 5–7 weeks, far shorter than the 3.4–4.7 months previously presumed (Nugent et al. 2012b). The implication is that the assumed mortality rate of TB-infected possums currently used in the SPM is substantially lower than it should be.
Use of a higher mortality rate in the SPM results in a faster turnover of the TB+ve population, which requires use of a higher transmission rate, β, to predict steady-state infection in the 2–5% prevalence range.
Home range radius
The SPM assumes a default home range radius of about 73.5 m, equating to a circular home range size of about 1.7ha. However, recent evidence suggests that home range sizes are much larger when densities are low (Yockney et al. 2013), and, further, that home range size increases when density is reduced (Nugent et al. 2008). Within the HRR, average movement distances of several hundred metres have been recorded for possums in a number of studies, indicating that home ranges sizes at current densities are very large (Morgan et al. 2007; Nugent & Whitford 2011), consistent with an expansion of home range after control. That expansion could plausibly result in increased detection or capture rates that would change the relationship between possum density and indices such as CCI or TCI/RTCI, as discussed above. It could also explain the rapid increase in CCIs and TCIs in the year following possum control if the expansion is a gradual process that takes several months as surviving possums adjust to the usually massive reductions in density.
The SPM default home range size of about 1.7 ha would be too small if applied across all possum densities. However, the SPM includes functionality to simulate the expansion of home range size with decreasing possum abundance (Barron 2012), so provided that functionality is used, the low default value can be ignored.
Estimating the prior probability of TB freedom for the HRR
Background
As a first step towards demonstrating progress in declaring TB freedom in the HRR, we estimated the prior probability of TB freedom in each VCZ given a truncated control period starting in 2005 and ending in 2013 (Table 11). As one further operation is planned for each VCZ, these estimates will obviously understate the prior that will be predicted when the final case for declaring TB freedom is eventually made. Those declarations are currently

Progress toward the eradication of TB from wildlife in the Hauhungaroa Ranges
Landcare Research Page 39
scheduled mostly for 2020, but 2019 for Tihoi 3A and as late as 2024 for the southernmost VCZs that adjoin areas where it is expected eradication may not be achieved until later than that (OSPRI planning spreadsheet dated 2013).
Table 11 Summary of truncated control histories for the HRR VCZs showing the estimated percent kill (* or percent reduction below carrying capacity) by year for control operations conducted within the area. PrPo = prior probability of TB freedom in either September 2011 or mid-2013, based on the predictions of the Spatial Possum Model. The T1 VCZ is not formally part of the Proof of Concept area, and is largely farmland, but is included to illustrate how modest but more frequent ground control sufficient to keep possum numbers below 1% RTCI also results in high PrP0 values
PrPo
VCZ 2005 2006 2007 2008 2009 2010 2011 2012 2013 2011 2013
AS1 97 92 96 99
AS2 97 31 89 56 98
AS3 95 91 95 97
AS4 97 92 99 95 100
AS5 97 92 91 96
AS6 97 92 99 97 100
AS7 97 92 87 94
T1 90 50 50 50 86 97
T2 33* 95 4 77
T3A 97* 36 58 61 93
T3B 97 92 77 90
T4 97 92 97 100
RTT 92* 95 62 84
All of the VCZs other than Rangitoto were aerially poisoned in 2005. Except for AS3, all blocks were prefed twice before being poisoned, resulting in very low residual possum densities. An RTCI of 0.04% was recorded on 512 traplines (7 possums captured in ~15 000 trap nights (Coleman et al. 2007) monitored soon after control. Assuming that RTCI estimate understated the ‘true’ RTCI by two-thirds (Nugent et al. 2010), and conservatively assuming the conventional 5:1 %TCI/RTCI/density ratio (Ramsey et al. 2005) rather than the 15:1 ratio in Figure 7 suggests overall density was <0.02 possum/ha. A chewcard detection survey conducted 4–9 months after the operation over a large part of the HRR indicated an overall CCI of 1.5% (range 1.06–3.31) with this doubling over the next two years (Nugent et al. 2008). From the density–CCI relationship in Figure 7, these measurements also suggest densities of 0.02 possum/ha soon after control and of 0.04 possum/ha 2.5 years after control. These data indicate that immediate post-control density was <0.5% of the conservative estimate of carrying capacity, and by 2008 was still <1% of that. We therefore initially assumed for simplicity that control began with a 2005 reduction of 97% in all VCZs other than RTT, T1, T2 and AS3 (Table 11).

Progress toward the eradication of TB from wildlife in the Hauhungaroa Ranges
Page 40 Landcare Research
T3B (+AS1, AS4, AS5, AS6, AS7 and T4)
Tihoi 3B is the largest VCZ and has the highest carrying capacity. It is therefore the VCZ in which TB persistence is, all else being equal, most likely to occur. A β of 0.62 is required for the SPM to predict a steady-state low level of infection in this VCZ when the other parameters are set to the standard OSPRI default values (Table 10). With those assumptions, a single 99% reduction in 2005 was predicted to invariably drive TB to extinction within 12 years, and in >90% of cases within 8 years (i.e. by 2013) (Figure 8). Imposing the additional 92% reduction measured for 2011 results in the SPM predicting extinction in all 100 simulations within 8 years, and in >90% immediately after the 2011 operation (Figure 8). Conservatively assuming that only a 97% reduction in possum density was achieved by 2005, the SPM predicted long-term persistence (>10 years) in >10% of runs under a one-off control scenario, whereas imposing a 92% reduction in 2011 resulted in >90% of runs predicting extinction by 2013 (Figure 8). The imposition of a second control operation after 6 years was predicted to drive TB to extinction in a large majority of simulations in the year of control simply because the few infected possums present were often all killed during control. This VCZ would be assigned a prior probability of 0.9 under the OSPRI protocol.

Progress toward the eradication of TB from wildlife in the Hauhungaroa Ranges
Landcare Research Page 41
Figure 8 Predictions of the SPM (parameterised with standard default values) for the Tihoi 3B VCZ (the largest VCZ with the highest carrying capacity), showing the predicted outcomes of (a, b) single control operations at 99% or 97% kill (in 2005), and (c, d) in addition a second 92% reduction 6 years later (in 2011). The scenarios are extremely conservative as the effect of previous intensive control in 1994 and 2000 is ignored, and TB is assumed to have still been present at equilibrium levels (2–5%) in 2005.
We consider, on the basis of the values presented in Table 7, that the AS1, AS4, AS6, AS7 and T4 VCZs all have control histories and recent indices of residual abundance sufficiently similar to that of T3B to consider an assigned prior of 0.9 appropriate. AS4 and AS6 were subject to further control in 2013, with no possums detected after control in either block (Table 7). Consequently, the default prior of 0.9 will be particularly conservative for those two VCZs.
T3A
For this VCZ, we again assumed an estimated 97% reduction in possum numbers in 2005. This is conservative because trend monitoring in 2008–2009 recorded a TCI of 1.02%, and backwards prediction from that using a low rate of increase (r = 0.35), and a low carrying capacity (3.8 possums/ha) suggests that the possum density in 2005 would have been <2% of carrying capacity.
0
20
40
60
80
2005 2010 2015 2020 2025
% simspredictingextinction
Year
a. 99% kill in 2005
0
20
40
60
80
2005 2010 2015 2020 2025
% simspredictingextinction
Year
b. 97% kill in 2005
0
20
40
60
80
2005 2010 2015 2020 2025
% simspredictingextinction
Year
c. 99% kill in 2005, 92% in 2011
0
20
40
60
80
2005 2010 2015 2020 2025
% simspredictingextinction
Year
d. 97% kill in 2005, 92% in 2011

Progress toward the eradication of TB from wildlife in the Hauhungaroa Ranges
Page 42 Landcare Research
In winter 2010, a CCI of 10.8% was recorded over the whole area (range across sub-blocks = 6.7–26.7%), which (from Figure 7) equates to ~0.14 possum/ha, or ~1100 possums for the entire VCZ. A total of 386 were killed, suggesting a 36% kill. Transects were spaced mostly 250 m apart (4 sub-blocks) or 500 m apart (2 sub-blocks). However, 6–12 months later, CCIs in two of the highest density sub-blocks (using 500-m transect spacing) were ~50% higher (average = 24.2%, cf. 18.8% in 2010) despite the removal of possums in 2010. The implication is that the 2010 removal was less than the number of new possums recruited and/or that the winter 2010 CCI was biased low. Although it is difficult to interpret these inconsistent results, the average measured percentage CCI reduction in these two sub-blocks in 2011 was 52%, despite the 500-m spacing. Thus we consider that we can safely assume that the overall kill across the 2 years would have exceeded 36%.
In 2012, aerial 1080 control was applied to VCZ T3A. Monitoring indicated that within a 2300-ha sub-area within that VCZ, the CCI declined from 15.9% to 0.8%, i.e. a 95% reduction (Milestone Report 2: Project R-10751: Post Control Possum Movement and Aggregation). However, by 2013 the CCI had increased dramatically to 10.4%. Allowing for recruitment, back calculation suggested the kill might therefore have been as low as 58% (Milestone Report 3a Project R-10751). Although there are reasons to consider that this is far too low, we have accepted it, purposely biasing our calculations conservatively low. On that basis the SPM predicts a PrP0 of just 0.61 by 2011, but greater than 0.90 by 2013 (Figure 9).
AS3
A series of measurements obtained since 2006 have consistently suggested that the residual abundance of possums in AS3 VCZ is higher than in any other VCZ poisoned in 2005. AS3 had a 3.3% CCI recorded in early 2006, which increased to 47.5% in autumn 2011, despite some removal of possums during research projects (Table 7). However, a 3.3% CCI recorded in 2006 suggests densities had been reduced to <1% of K. Nonetheless, we conservatively assumed a 95% kill was achieved in 2005, followed by a 91% kill in 2011. The experimental ground control we conducted (as part of this study; Section 5) in parts of this block in 2009, 2012, and 2013 was not simulated. On that basis the PrP0 still exceeded 0.9 by 2011 (Figure 9), largely because of the small size of the block compared with Tihoi 3B.

Progress toward the eradication of TB from wildlife in the Hauhungaroa Ranges
Landcare Research Page 43
Figure 9 Prior probabilities of TB freedom from the SPM (parameterised with standard default values) for four exemplar VCZs showing the predicted outcomes of the conservative control histories in Table 11 on possum densities (possums/ha; left axis) and the number and cumulative percentage of model simulations (out of 100) for each VCZ. The effect of earlier control is ignored, and TB is assumed to have still been present at 2–5% prevalence in 2005.
0
20
40
60
80
100
0
1
2
3
4
5
6
7
8
9
10
2004 2014 2024
N or%
Year
d. AS2
N eradications Cumulative % eradication Density
0
20
40
60
80
100
0
1
2
3
4
5
6
7
8
9
10
2004 2009 2014 2019 2024
N or%
Year
b. Tihoi 3A
0
20
40
60
80
100
0
1
2
3
4
5
6
7
8
9
10
2004 2009 2014 2019 2024
Possum
density
Year
a. Tihoi 3B
0
20
40
60
80
100
0
1
2
3
4
5
6
7
8
9
10
2004 2009 2014 2019 2024
Possum
density
Year
c. AS3

Progress toward the eradication of TB from wildlife in the Hauhungaroa Ranges
Page 44 Landcare Research
AS2
For AS2, we assumed a 97% kill in 2005 (on the basis of the moderately high CCI for the eastern half of AS2 in Table 7 and a 31% reduction in 2011. Further control in 2013 reduced the high CCI in AS2 East by 89%. On that basis the SPM predicts a PrP0 of just 0.56 by 2011, but greater than 0.9 by 2013 (Figure 9).
RTT
For parts of the Rangitoto Range not under regular ground control by DOC, we predicted forward from a 1.4%TCI ‘trend’ monitor in 2004–2005, conservatively assuming a high rate of increase (r = 0.55) and a low carrying capacity of 4.2 possum/ha. This suggested a 2.2% TCI in 2005, and a pre control TCI of 6.3% in 2008. Likewise, projecting backwards from the 0.5% TCI recorded a year later, we predicted a post-control RTCI of 0.4%, and therefore a 95% kill for the 2008 aerial 1080 operation. For consistency with other VCZs, we treated the predicted 2005 TCI as (effectively) a 92% reduction from carrying capacity beginning at that time, a lesser kill than measured inthe main Hauhungaroa VCZs resulting in a 2013 PrP0 (0.84 Table 11) at the lower end of estimates values.
T1, T2
For T2, an aerial 1080 operation was conducted in 2008, and we assumed a 95% kill was achieved based on the Rangitoto Range operation that year. The outcome was a 0.1% post-control TCI, but by 2012–2013 trend monitoring showed that had increased to 5.75%. It is difficult to judge the likely possum abundance before control in 2008; we have therefore conservatively assumed that possum density in 2005 was only moderately below carrying capacity (33%). This VCZ will be poisoned on 2014, which seems certain to increase PrP0 to >0.9.
For the small 2100-ha T1, which has only ~1000 ha of possum habitat, the data available are for three output-based ground control operations conducted in 2009–2010 (0.19% RTCI) and 2012–2013 (0.93% RTCI) (and also in 2013–2014, 0.93% RTCI). In addition, input-based detection and mop-up was conducted in 2011–2012 in which 37 possums were killed. We therefore assumed a 90% kill for aerial control in 2005 and a 50% kill for each year of ground control.
Predictions with alternative parameters
Using a simulation area similar in size and carrying capacity to the T3B VCZ, we explored a wide range of combinations of the alternative HRR-specific parameters suggested above for the SPM. We applied the much higher rate of TB-induced mortality (α) suggested as being more realistic than the default. This approach assumed a far higher value for β than usual to compensate for the more rapid disappearance of TB+ve possums. Although combinations of these two parameters could be found that predicted low steady-state prevalence, those predictions became highly sensitive to carrying capacity, with TB either dying out quickly

Progress toward the eradication of TB from wildlife in the Hauhungaroa Ranges
Landcare Research Page 45
without control when low K values were assumed or prevalence rapidly increasing to unrealistically high levels when even slightly high values of K were assumed. Predicted outcomes were also highly sensitive to the shape of the curve used to characterise the way in which home range size is thought to expand as possum density is reduced. Combinations of parameters that successfully predicted low steady-state prevalence did not appear to increase TB persistence, even when using the higher rate of increase (r = 0.55) above. Further research, beyond the scope of this project, is required to confirm that very preliminary finding, with a particular focus on how the simulation of home-range-size expansion within the SPM affects predicted outcomes.
Empirical data on TB prevalence in possums: AS3
TB+ve possums were common in the AS3 VCZ in the 1990s and up until 2005 (Table 12). This VCZ was not properly controlled until 2005, and a prevalence of 11% was subsequently recorded in one small area within it. Since then, the series of trials and monitoring conducted in that block have resulted in >250 possums being necropsied, with no TB-infected possums found (Table 12). The 2008, 2012, and 2013 surveys are likely to have sampled between at least a third and a half of the possums within the parts of the block they covered. Collectively this indicates not only that the likelihood of TB being present in possums is low, but also that if TB-infected possums are still present, it is extremely unlikely there would be more than three infected possums. At present very low densities, the likelihood that any foci of infection could persist is also very low.
Table 12 Decline in TB prevalence in possums in the central-western Hauhungaroa Range since 1998. The 1998–1999 data are for the 9000-ha area not poisoned in 1994, and the 2004 data are for the whole range with the single TB-infected possum being found in AS3 on a transect with a 23% TCI
Year Study N possums TB prevalence
1998–1999 G. Nugent (unpubl.) 324 4.3%
1999 G. Nugent (unpubl.) 39 13.0%
2004 Env. Waikato trend monitor (unpubl.) 141 0.7%
2005 (de Lisle et al. 2009) 93 10.7%1
2007–2008 (Nugent et al. 2008) 17 0%
2009 (Sweetapple et al. 2010) 148 0%
2012 This study (LHT/DTC) 34 0%
2013 This study (KT/DTC) 64 0%
1 9 of 10 had no visible lesions. LHT = leghold trapping, DTC = chewcard-based detection and targeted control, KT = 7-day Kill Trap Catch Index.

Progress toward the eradication of TB from wildlife in the Hauhungaroa Ranges
Page 46 Landcare Research
7.4 Discussion
As already noted, TB was historically present in possums at moderate to high levels throughout much of the HRR. However, prevalence typically fell quickly as intensive control reduced possum numbers over much of this area. This is supported by data from possums, as well as a rapid decline in the incidence of new infections of TB in deer in the eastern parts of the HRR after 1994, and a similar decline in pigs after the 2005 operation.
Until the very recent discovery of a TB+ve deer in the southeast of T3A, the available evidence indicated that AS3 was most likely to have been the last bastion of TB infection in possums. Our data suggest that the amount of control already imposed in AS3 appears to have been sufficient to predict eradication of TB by 2013, at least when TBfree NZ’s standard approach to using the SPM is applied. Put simply, it appears that no further possum control is needed to attain the maximum value for the prior of 0.9 permitted under OSPRI’s protocols (TBfree New Zealand 2013).
The above conclusion is based on the use of the default assumptions in the SPM. We consider that some of the key parameters are substantial underestimates (specifically the TB-induced mortality rate and intrinsic rate of increase) and others are likely to be overestimates (predicted carrying capacity, residual density inferred from very low indices of abundance under the widely accepted 5:1 TCI/Density ratio). The effects of these over- and under-estimates on the SPM predictions probably largely balance out. Further, we were unable to find a combination of low carrying capacity, high TB-induced mortality, and high rate of increase that predicted a before-control equilibrium prevalence in the empirically observed 2–5% range that also resulted in TB persisting and recovering after a single moderate (80% kill) control operation. We therefore conclude that the standard-parameter predictions are unlikely to be overly optimistic, especially since for most VCZs the prior is already in excess of 0.9 with further control still scheduled.
8 Current probabilities of TB freedom in possums
8.1 Aim
Detection of TB in one, possibly two, deer and in up to three pigs in late 2013 indicated that it was premature to assess TB freedom in wildlife generally in the HRR at this time. The aim of the research presented here is therefore to estimate how much negative sentinel (pig and deer) and/or possum surveillance was required to achieve the PoF95 yardstick for declaring freedom.
8.2 Approach
We used the Proof of Freedom calculator (Anderson 2011) to estimate possum PoF based on the estimates of PrP0 for spring 2011 in Table 11 (i.e. immediately after the 2011 aerial poisoning operation covering much of the area). We collated the operational surveillance data available in Vector Net from mid-2011 to mid-2013. The data were provided by Jane

Progress toward the eradication of TB from wildlife in the Hauhungaroa Ranges
Landcare Research Page 47
Sinclair, OSPRI. They included the operational pig and deer data collected by OSPRI during 2012–2013. Using cost data collected during the various trials above and other fieldwork conducted in the HHR, and the known operational costs of collecting necropsy data for deer and pigs, we estimated the likely cost of achieving PoF95 once sufficient control had been done to attain a PrP0 of 0.9.
8.3 Probabilities of TB freedom in possums
2013 probabilities using 2011 priors
Although TB has not been detected in possums in HRR since 2005, the detection of TB deer in late 2013 suggests TB was highly likely to have been present in possums until recently. The other sources of infection from which the deer may have obtained TB are other deer or pigs, both of which are possible but arguably much less likely given the status of wild deer as spillover hosts. The most likely place for that to have occurred is in AS3, as the probably-infected deer was a male that could have easily dispersed the 2–3 km from the last known locations where TB-infected possums were found in 2004 and 2005, respectively. The continued presence of TB in possums in AS3 in 2010 is unsurprising, as the SPM predicted only a 0.44 probability of eradication by then (Figure 9).
The additional detection of TB in a young deer in south-eastern T3A is more surprising, despite a predicted prior of only 0.61 in spring 2011 (Table 11). That low prior reflects the assumed low level of control achieved in the most recent aerial 1080 operation (although the initial estimate of kill was high), but ignores a control history that stretches back to 1994.
The detection of TB+ve wildlife in 2013 clearly broke one of the qualitative rules used for declaring TB freedom (AHB 2009b) up until 2011 (i.e. before the adoption of the current more quantitative system). Specifically, those qualitative rules required no detection of TB presence in wildlife for at least 3 years. In that context, it is arguably premature to estimate quantitative probabilities of freedom for possums, but we do so here to assess how much and what kind of (TB-negative) surveillance would be needed to achieve the target of 0.95 probability of TB freedom in possums (PoF95).
Using the Proof of Freedom Calculator with the ‘Standard Parameter’ priors in Table 11 for 2011, and ignoring the recent detection of TB, current protocols (TBfree New Zealand 2013) would result in a default prior of 0.90 in the majority of VCZs (Table 13).
Using only pig data from what was, effectively, a single year of operational surveillance by OSPRI, we calculated PoF values of 0.909–0.931 for these ‘most advanced’ VCZs (Table 13). We conservatively assumed sub-adult pigs were 0.75 years old, and adult pigs were 1.5 years old, with a home range radius of 0.9 km (half the current PoF default). In most VCZs, about 0.4 pigs had been obtained per km2, delivering a 1–2% gain in PoF from the PrP0 of 0.9, but in AS3 the sampling rate was 0.77 pigs/km2, with a 3% gain. The SSe varied quite widely in relation to sample density, reflecting variation in the extent to which the kill locations of the pigs were highly clustered in only part of the block or distributed evenly through it. Overall, these results suggest that a sample density of about 1–1.5 pigs/km2

Progress toward the eradication of TB from wildlife in the Hauhungaroa Ranges
Page 48 Landcare Research
would be required to achieve the PoF95 target, with even higher sample densities required if the sampling is highly clustered and/or spread over many years (because this assumes some annual risk of TB re-establishment). In simple ballpark terms, for the whole HRR area, that equates to about 1200–1800 pigs, or 5–7 years of sampling at 250–300 pigs per year. At $400 per pig, that equates to roughly $1/ha/yr, or $5–7/ha in total. These projected timelines and costs will reduce if ongoing research in the Hauhungaroa Range indicates that the average age of pigs is higher and that pigs range far more widely than previously assumed.
Few or no deer were obtained in most VCZs in 2012, but it is clear from Table 13 that deer are of little surveillance value. This reflects the much lower probability of TB transmission from possums to deer than from possums to pigs that is assumed in the Proof of Freedom Calculator (based on empirical data from Nugent (2005)).
Possum data for the post-2011 period were only available from research trials in Tihoi 3A and AS3. For Tihoi 3A, the low 2011 PrP0 (0.61) makes POF calculation based on that parameter premature, but by 2013 it had increased to 0.93 after the 2012 aerial 1080 operation there (even using a highly conservative estimate of percent kill for that operation; Table 11). The low intensity of leghold trapping (0.05 trap/ha) was clearly insufficient to deliver much gain in the PoF prediction.
For AS3, the two sets of trials conducted in this project together delivered about two-thirds of the surveillance required to achieve PoF95. This is despite the 2012 trials covering only two-thirds of the block, and the 2013 kill trapping being conducted at a low intensity (0.2 trap/ha) as a result of limited availability of kill traps. When combined with the sentinel data for that block (and ignoring the probable TB+ve deer found nearby), there has been sufficient TB−ve surveillance within the block to reach PoF95. The possum data alone provide a high level of confidence (0.932) that the possum population was free of TB by mid-2013.
We estimate that a single DTC survey along the lines of those summarised in Table 5, costing $20–$30/ha and covering all of the area of interest, would be sufficient to reliably deliver a 60% kill (i.e. >0.53 SSe) and achieve the PoF95 target when PrP0 is set at 0.9. Leghold trapping at 0.4 trap/ha for 3 nights should deliver the same for about $20/ha (Table 4), as would kill trapping for three sessions for $30–$40/ha.
Future probabilities
By late-2013, the SPM-predicted PrP0 for all VCZs other than the Rangitoto Range and T2 will have exceeded 0.9 (Table 11). The aerial operation scheduled for winter 2014 in both those latter VCZs seems certain to increase the PrP0 to >0.9 immediately. On that basis, a single direct survey of possums at levels sufficient to achieve a 60% kill would enable the PoF95
target to be achieved, and could be implemented at any time from then on.
However, adherence to the qualitative rule requiring 3 years with no detection of TB+ve wildlife would currently set the earliest possible date for that at 2017 (if the HRR was considered as a single epidemiological unit). Any subsequent detection of TB+ve animals would push that date further into the future.

Progress toward the eradication of TB from wildlife in the Hauhungaroa Ranges
Landcare Research Page 49
It has yet to be resolved (by OSPRI) whether sentinel surveillance conducted within the 3-year period of no-positive-animals would be used for calculating the PoF, but assuming it was, then the typical current levels of 0.4 pig/ha would already have provided most of the surveillance required. If so, only a modest intensity of possum surveillance would be needed.

Progress toward the eradication of TB from wildlife in the Hauhungaroa Ranges
Page 50 Landcare Research
Table 13 Illustrative probabilities of TB freedom in possums (PoF) as at mid-2013, based on the prior probability of TB freedom (PrPo) for September 2011 as predicted by the SPM from the truncated possum control histories in Table 11. The calculations ignore the finding of TB pigs and deer in 2013, aiming solely to illustrate the extent to which recent surveillance would have been sufficient to declare freedom if no TB had been found. Only surveillance data for the 1.7 years after September 2011 were used, and records with no associated date were not included. The 1954 possum control devices in AS3 included 961 chewcards (7 nights), 363 leghold traps (3 nights), and 630 kill traps (7 nights), while those for Tihoi 3A were 470 leghold traps
PrP0 Pigs Deer PoF as at mid-2013
VCZ Area Sep 2011 Adopted (N) (Per km2) (N) Pigs only Pigs + deer Pigs + deer + possums Possums only
AS1 9209 96 0.90 39 0.42 0.919 - - -
AS2 10529 56 0.56 55 0.52 7 0.642 0.640 - -
AS3 2982 95 0.90 23 0.77 1 1954 0.930 0.931 0.952 0.932
AS4 3052 95 0.90 15 0.49 0.909 - - -
AS5 9005 91 0.90 33 0.37 0.910 - - -
AS6 3402 97 0.90 15 0.44 0.915 - - -
AS7 10503 87 0.87 32 0.30 0.881 - - -
Tihoi 1 2189 86 0.86 10 0.46 0.875 - - -
Tihoi 2 8895 4 0.04 39 0.44 0.048 - - -
Tihoi 3A 8418 61 0.61 3 0.04 4 470 0.609 0.609 0.609 0.619
Tihoi 3B 13815 77 0.77 61 0.44 24 0.799 0.800 - -
Tihoi 4 9043 97 0.90 42 0.46 26 0.915 0.914 - -
RR 34365 62 0.62 69 0.20 48 0.641 0.640 - -

Progress toward the eradication of TB from wildlife in the Hauhungaroa Ranges
Landcare Research Page 51
Survey then control (StC)
We have recently developed an as-yet-unpublished alternative ‘Survey then control’ (StC) approach to assessing TB freedom. It reverses the conventional approach by assessing TB prevalence immediately before a control operation and, provided that no infected possums are found, then calculates the probability that any infected possum could have survived undetected.
For illustrative purposes, we apply that logic to AS3. Using the 2009 survey (Sweetapple et al. 2010) as the pre-control survey, we assume that the removal of 148 TB−ve possums accounted for almost half the possum population in the 1400-ha study area. This suggests a population of about 300-400 possums. A 92% kill was achieved in the aerial 1080 operation 18 months later (Nugent et al. 2012a). Although the interval between survey and control is longer than theoretically desirable, we can assume that at low possum densities the numbers of TB+ve possums (if any) are far more likely to have declined than increased. On that basis, we can roughly estimate that there was a 0.05-0.10 probability that any TB-infected possum would have survived undetected in that 1400-ha area. Moreover, the subsequent TB−ve surveys in 2012 and 2013 (Section 5.2) will have further reduced these estimates, indicating that we can state that there is a high probability the possum population in AS3 is now free of TB, irrespective of the recent detection of probable TB in a deer killed nearby.
Application of the StC approach as part of the final aerial control operations scheduled for most VCZs in winter 2016 would enable direct inference about TB freedom in possums that year. Most of the scheduled operations are planned to be dual-prefed operations at a projected cost of $34/ha. Such operations should deliver a >95% kill. If so, recent modelling for the Hokonui Hills indicates that a TB−ve pre-control survey of about 15% of the possum population would indicate a PoF = 0.9. Coupling that with the default 0.9 PrP0 values in Table 11 would indicate PoF values of 0.99. The cost of such a low-intensity possum survey would be less than half that required to attain a 60% kill (i.e. $10–$15/ha).
8.4 Discussion
Our preliminary calculation of PoF values as of mid-2013 indicated that AS3 was the only VCZ where sufficient surveillance had been done to reach the PoF95 target. That is unsurprising given there had been only 1.7 years of surveillance data gathered at that time. We assume that declaring TB freedom in the AS3 VCZ would be seen as premature while TB+ve animals are still being detected, but our results show that achieving the target is well within reach at an affordable cost.
Surveillance of pigs is the lowest cost option for declaring TB freedom. However, at current typical sampling intensities of about 0.4 pigs/km2/year, it could take up to 6 years to gather sufficient data from pigs to do this. This is primarily because it is difficult to attain the required annual sampling intensity in areas where hunter access is difficult or in areas that contain low pig densities. Thus pig surveillance could be characterised as cheap but slow.

Progress toward the eradication of TB from wildlife in the Hauhungaroa Ranges
Page 52 Landcare Research
9 Conclusions
We have demonstrated in this and other studies that low-cost aerial 1080 baiting can deliver high kills, although possibly with less consistency than current best practice. We have also demonstrated that several alternative TB survey methods (systematic leghold trapping, chewcard detection and targeted trapping, and kill trapping) could all feasibly and (to varying degrees) affordably be applied in deep-forest situations to deliver the surveillance sensitivities required to confirm TB freedom at the 0.95 level provided the prior is already at 0.9.
TB may still be present in a few deer, and multiple further detections of TB+ve pigs and deer could occur for up to five more years, especially if current sentinel surveillance levels are maintained. The most recent confirmed case in deer is from late 2013, with detection of well-advanced TB in a deer estimated to have been born in 2009. Assuming that it had become infected no later than 2012, that extends the period in which there is some risk of spillback till well after 2020; However, the likelihood of that is negligibly low, because the prevalence in deer in 2012 (the latest likely infection date) wasalready very low compared to the high prevalence that our model predictions were based on.
That possibility of spillback risk extending to at least 2019 clearly provides strong justification for further possum control. However, our analyses suggest that it is likely TB has already been eliminated from possums in the AS3 VCZ, which we consider most likely to be the last major reservoir of infection. By extrapolation, we conclude that no major reservoir of infection in possums persists anywhere in the whole HRR. That general conclusion is obviously modified by the possibility that the TB in pigs and deer in south-eastern AS3 reflects a minor residual pocket of infection there, but we note that with 13 VCZs under consideration there is a more than 50:50 chance of TB still being present in one if the probability of freedom is <0.95.
Importantly, provided possum levels are kept low as planned, especially in the areas with TB+ve sentinels, the occasional occurrence of TB in old deer and in pigs is of little epidemiological consequence. Arguably, such occurrences do not preclude declaration of TB freedom in possums before 2019 if such declarations are based on direct surveillance of the possum populations. The future detection of TB in a young deer (< 5 years old) would require reappraisal of these conclusions.
Pig surveillance is, without doubt, the cheapest option for quantifying TB eradication from wildlife, but declaration of TB freedom is likely to be delayed for some years until pigs stop detecting residual TB in deer. The conservative and lowest cost approach to declaring TB freedom is likely to involve keeping possum numbers below the usual 2% RTCI target until beyond 2019 and implementing moderately intensive sentinel-based surveillance focusing largely on pigs for 5–6 years from about 2016 (or later if more TB+ve deer are found).
Alternatively, declaration of TB freedom specifically in possums (rather than from all wildlife) could be achieved in most VCZs within 1–2 years through direct survey of possums. However, we conclude that further control is required in at least AS3 and surrounds to mitigate spillback risk, so it would make sense to delay such surveillance until around the time that that control is imposed.

Progress toward the eradication of TB from wildlife in the Hauhungaroa Ranges
Landcare Research Page 53
There are two options for this. First, under the current PoF approach, a final control operation could be followed soon afterwards by a ground-based survey of possums that obtains necropsy data from about 60% of the residual possum population. We estimate the cost of that would be ~$20 (but possibly up to $30/ha). New research has been recently initiated in the HRR to determine whether the cost of such a survey could be substantially reduced through a two-stage stratified-sampling survey design that uses low-intensity detection surveys to map possum density in a way that enables most survey effort to be targeted at the areas with highest possum densities. The high cost of direct possum surveillance (relative to use of sentinels) could be offset by using a low-cost $15–$20/ha approach to the final aerial 1080 control operation rather the $34/ha operation currently planned for most of them (B. Webster, TBfree NZ, unpubl. data).
The second option involves applying the recently developed Survey-then-Control concept. Under this approach, a low-intensity necropsy survey of the possum population would be conducted immediately prior to the final control operation. This approach is yet to be demonstrated to funding stakeholders as a practical and defensible approach to declaring TB freedom that is acceptable. However, subject to that acceptance, it could be substantially cheaper than option one above. The lowest cost StC approach would involve combining a low-intensity survey with a low-cost control operation –this approach could be delivered for the same cost as currently budgeted for standard-intensity control alone. A higher cost StC approach would combine a low-intensity (~10%) survey with higher-intensity (dual prefeed) control. This should deliver a very high posterior probability of freedom and a very low residual post-control density of possums that would eliminate any potential for spillback re-establishment in possums well beyond 2019. A key aspect of the StC approach is that it provides an additional justification for conducting further control in areas where the prior is already high (i.e. control is required not only to eliminate spillback risk but because it also substantially reduces the cost of direct possum surveillance).
10 Recommendations
We recommend OSPRI should:
• Further investigate the effect of alternative parameter values in the SPM, partly to identify whether using more realistic model values would significantly affect predicted outcomes, but also to improve prediction of how long it would take before TB could re-establish in a recovering possum population following a control operation.
• Conduct the already scheduled focal possum surveillance targeted at the sites at which TB+ve sentinels have been recently detected at a high level of intensity, and in such a way that possum density and home range size can be estimated, so that outcomes can contribute to the above evaluation of the SPM.
• Continue the current level of sentinel surveillance over the whole area at a cost of about $1/ha/year for the next 5–10 years. Initially both pigs and deer should be surveyed primarily to determine the location, magnitude, and potential duration of the spillback risk posed by deer, but eventually emphasis should shift toward pigs because of their greater sensitivity as sentinels, particularly in the context of assurance monitoring after TB freedom has been declared in possums.

Progress toward the eradication of TB from wildlife in the Hauhungaroa Ranges
Page 54 Landcare Research
• Consider which strategic approaches to declaring TB freedom in the HRR are likely to be acceptable to stakeholders. The main possibilities include:
• Waiting until after 2019 to declare TB eradication from wildlife (i.e. until after the spillback risk from deer is predicted to have fallen to zero).
• Declaring TB freedom in possums even when there is still some spillback risk from deer, by conducting direct post-control surveillance of about 60% of the possum population soon after the next scheduled control operation (i.e. 2017–2019).
• Declaring TB freedom in possums even earlier by conducting direct pre-control surveillance of 10–15% of the possum population immediately before the next scheduled control operations (i.e. 2016–2018).
• Consider expanding newly-initiated research scheduled for the next three years to further refine and test the best technical options for either moderate- or low-intensity ground-based surveillance of possums in deep-forest situations. This could include chewcard detection systems in combination with leghold and/or kill trapping.
11 Acknowledgements
We thank OSPRI (especially Dr P. Livingstone, M. Bosson, B. Webster, J. Sinclair and M. Hudson) for their support and collaboration in implementing this complex project and providing operational surveillance data and other information. We also thank Chris Brausch and his contractor crews for undertaking much of the fieldwork, Dave Latham and Phil Cowan for their useful comments on earlier versions of this report, and Christine Bezar for editorial help.
12 References
AHB 2009a. National Bovine Tuberculosis Pest Management Strategy – Amendment Proposal Sept 2009.
AHB 2009b. Animal Health Board Annual Report 2008/2009. 67 p.
AHB 2012. Animal Health Board Annual Report 2011/2012. 64 p.
Anderson DP 2011. Development of a Proof of Freedom utility. Confidential Landcare Research Contract Report LC218, for the Animal Health Board (R-10730). 30 p.
Anderson DP, Ramsey DSL, Nugent G, Bosson M, Livingstone P, Martin PAJ, Sergeant E, Gormley AM, Warburton B 2013. A novel approach to assess the probability of disease eradication from a wild-animal-reservoir host. Epidemiology and Infection 141: 1509–1521.
Barlow N 2000. Non-linear transmission and simple models for bovine tuberculosis. Journal of Animal Ecology 69: 703–713.

Progress toward the eradication of TB from wildlife in the Hauhungaroa Ranges
Landcare Research Page 55
Barron MC 2012. Extending and validating the Landcare Research possum-TB model. Landcare Research Contract Report LC1006, for the Animal Health Board (R10736). 30 p.
Barron M, Nugent G 2011. Cost–benefit analysis of deer control within a TB eradication program. Landcare Research Contract Report LC234, for the Animal Health Board (R-10731). 22 p.
Barron MC, Nugent G, Cross ML 2013. Importance and mitigation of the risk of spillback transmission of Mycobacterium bovis infection for eradication of bovine tuberculosis from wildlife in New Zealand. Epidemiology and Infection 141: 1394–406.
Coleman JD, Fraser KW, Nugent G 2000. Optimal buffer widths for control of possums in the Hauhungaroa Range: 1994/95–19998/99. Population recovery of possums and wild deer and Tb prevalence in possums, wild deer, and cattle. Landcare Research Contract Report LC9900/55. 42 p.
Coleman J, Fraser K, Nugent G 2007. Costs and benefits of pre-feeding for possum control. New Zealand Journal of Zoology 34: 185–193.
de Lisle GW, Yates GF, Coleman JD 2009. Isolation of Mycobacterium bovis from brushtail possums with non-visible lesions. New Zealand Veterinary Journal 57: 221–224.
Fraser K, Coleman J, Nugent G 1995. Optimal buffer widths for control of possums in the Hauhungaroa Range: 1994: initial population reductions and Tb prevalence in possums, deer, and pigs. Landcare Research Contract Report LC9495/119, for the Animal Health Board. 13 p.
Jones C, Warburton B 2012. Relationships between commonly used indices of possum abundance. Confidential Landcare Research Contract Report LC709, for the Animal Health Board (R-10740). 20 p.
Lugton IW 1997. The contribution of wild mammals to the epidemiology of tuberculosis (Mycobacterium bovis) in New Zealand. Unpublished PhD thesis, Massey University, Palmerston North, New Zealand. 503 p.
Morgan DR, Nugent G, Gleeson D, Howitt R 2007. Are some possums untrappable, unpoisonable, and therefore unmonitorable? Landcare Research Contract Report LC0607/143, for the Animal Health Board (R-10623). 43 p.
NPCA 2011. Possum population monitoring using the Trap-Catch Method. Wellington, National Pest Control Agencies.
Nugent G 1998. Prevalence of Tb in wild deer: Summary of 1995/96 ‘Operational’ Surveys. Landcare Research Contract Report LC9798/073. 16 p.
Nugent G 2005. The role of wild deer in the epidemiology and management of bovine tuberculosis in New Zealand. PhD thesis, Lincoln University, Canterbury, New Zealand. 170 p.

Progress toward the eradication of TB from wildlife in the Hauhungaroa Ranges
Page 56 Landcare Research
Nugent G, Morriss G 2010. Low-cost Aerial Poisoning: Comparing the efficacy of clustered and broadcast baiting in two 2009 field trials. Landcare Research Contract Report LC0910/075, for the Animal Health Board (R-10710). 28 p.
Nugent G, Morriss G 2011. Low-cost Aerial Poisoning II: Refinement and testing of cluster sowing 2009-10. Landcare Research Contract Report LC1011/136, for the Animal Health Board (R-10710). 44 p.
Nugent G, Whitford J 2003. Epidemiology of bovine tuberculosis in wild deer. Landcare Research Contract Report LC0203/165, for the Animal Health Board (R-10479).45 p.
Nugent G, Whitford J 2006. The short-term effect of possum control on Tb prevalence in pigs. Landcare Research Contract Report LC0607/002, for the Animal Health Board (R-10577, Part 3). 31 p.
Nugent G, Whitford J 2007. Is residual Tb infection in deer and pig populations important? Landcare Research Contract Report LC0708/053, for the Animal Health Board (R-10678). 21 p.
Nugent G, Whitford J 2011. Effect of rat interference on possum kill during aerial poisoning. Landcare Research Contract Report LC851, for the Animal Health Board (R-10729). 21 p.
Nugent G, Fraser K, Sweetapple P 1997. Comparison of red deer and possum diets and impacts in podocarp-hardwood forest, Waihaha Catchment, Pureora Conservation Park. Science for Conservation 50. Wellington, Department of Conservation. 20 p.
Nugent G, Ramsey D, Caley P 2006. Enhanced early detection of Tb through use and integration of wildlife data into the national surveillance model. Landcare Research Contract Report LC0506/167, for the Animal Health Board (R-10627). 35 p.
Nugent G, Warburton B, Morgan D, Sweetapple P, Clayton R, Thomson C, Coleman M 2008. Local Elimination: A new strategic approach to large-scale control of small mammal pests. Landcare Research Contract Report LC0708/149, for the Animal Health Board (R-10669). 110 p.
Nugent G, Yockney I, Morgan D 2009. Increased cost-effectiveness of aerial 1080 poisoning of possums for reducing Tb incidence on Molesworth Station: Pt 1: Effect of reduced coverage and sowing rates on possum abundance. Landcare Research Contract Report LC0809/163, for the Animal Health Board (R-10629). 30 p.
Nugent G, Whitford J, Sweetapple P, Duncan R, Holland P 2010. Effect of one-hit control on the density of possums (Trichosurus vulpecula) and their impacts on native forest. Science for Conservation 304. Wellington, Department of Conservation. 264 p.
Nugent G, Whitford J, Yockney I, Cross M 2011a. Reduced spillover transmission of Mycobacterium bovis to feral pigs (Sus scrofa) following population control of brushtail possums (Trichosurus vulpecula). Epidemiology and Infection 140: 1036–1047.

Progress toward the eradication of TB from wildlife in the Hauhungaroa Ranges
Landcare Research Page 57
Nugent G, Warburton B, Thomson C, Sweetapple P, Ruscoe WA 2011b. Effect of prefeeding, sowing rate and sowing pattern on efficacy of aerial 1080 poisoning of small-mammal pests in New Zealand. Wildlife Research 38: 249–259.
Nugent G, Morriss G, Fitzgerald N, Innes J 2012a. Bait aggregation and deer repellent effects on efficacy, and non-target impacts on deer and birds, during aerial 1080 baiting: Hauhungaroa 2011. Landcare Research Contract Report LC1011, for the Animal Health Board (R-10710). 43 p.
Nugent G, Yockney I, Whitford J, Cross ML 2012b. Mortality rate and gross pathology due to tuberculosis in wild brushtail possums (Trichosurus vulpecula) following low dose subcutaneous injection of Mycobacterium bovis. Preventive Veterinary Medicine.
Nugent G, Morriss G, Warburton B, Farrell T, Smillie R 2012c. Low-cost aerial poisoning III: Refinement and testing of strip and cluster sowing, 2011. Landcare Research Contract Report LC990. 29 p.
Nugent G, Whitford J, Arienti-Latham C 2013a. Halving the cost of ground control through increased efficiency in detection-based control and surveillance operations. Landcare Research Contract Report LC1646, for TBfree New Zealand (R10721). 50 p.
Nugent G, Warburton B, Thomson C, Cross ML, Coleman MC 2013b. Bait aggregation to reduce cost and toxin use in aerial 1080 baiting of small mammal pests in New Zealand. Pest Managment Science 68: 1374–1379.
PCE 2013. Update report on the original investigation. Evaluating the use of 1080: Predators, poisons and silent forests. 15 p.
Pfeiffer DU, Hickling GJ, Morris RS, Patterson KP, Ryan TJ, Crews KB 1995. The epidemiology of Mycobacterium bovis infection in brushtail possums (Trichosurus vulpecula Kerr) in the Hauhungaroa ranges, New Zealand. New Zealand Veterinary Journal 43: 272–280.
Ramsey D, Cowan P 2003. Mortality rate and movements of brushtail possums with clinical tuberculosis (Mycobacterium bovis infection). New Zealand Veterinary Journal 51: 179–185.
Ramsey DSL, Efford M 2005. Eliminating Tb – results from a spatially explicit, stochastic model Landcare Research Contract Report LC0405/118, for the Animal Health Board (R-10619). 24 p.
Ramsey D, Efford MG 2010. Management of bovine tuberculosis in brushtail possums in New Zealand: Predictions from a spatially explicit, individual-based model. Journal of Applied Ecology 47: 911–919.
Ramsey D, Efford M, Ball S, Nugent G 2005. The evaluation of indices of animal abundance using spatial simulation of animal trapping. Wildlife Research 32: 229-237.

Progress toward the eradication of TB from wildlife in the Hauhungaroa Ranges
Page 58 Landcare Research
Sweetapple P 2014. Increasing capture rates of possums: efficacy of baiting chewcard sites. Landcare Research Contract Report LC1878 for TBfree New Zealand (R-10765, module 1).
Sweetapple PJ, Fraser KW 1997: Assessment of red deer and possum kills during an aerial 1080 control operation in the Rangitoto Range. Landcare Research Contract Report LC9697/139, for the Animal Health Board. 18 p.
Sweetapple PJ, Nugent G 2008. Tools for mapping and eliminating surviving possums following possum control. Landcare Research Contract Report LC0809/017, for the Animal Health Board (R-10681). 16 p.
Sweetapple P, Nugent G 2009. Possum demographics and distribution after reduction to near–zero density. New Zealand Journal of Zoology 36: 461–471.
Sweetapple P, Nugent G 2011. Chew-track-cards: A multiple-species small mammal detection device. New Zealand Journal of Ecology 35: 153–162.
Sweetapple P, Anderson D, Nugent G 2010. No possums, no TB. Confidential Landcare Research Contract Report LC0910/167, for the Animal Health Board (R-10710). 35 p.
Sweetapple P, Nugent G, Williamson J 2011. Detection and targeted control of possums: Tihoi 3A experimental operations, 2010-2011. Landcare Research Contract Report LC786. 22 p.
Sweetapple P, Nugent G 2014. Chewcard detection and targeted control versus whole-area ground control for possum TB surveillance surveys. Landcare Research Contract Report LC1856, for TBfree NZ (R-10731 ancillary report). 16 p.
TBfree New Zealand 2013. Proof of Freedom manual Module 3: Spatial Possum Model. Wellington. 29 p.
Yockney IJ, Nugent G, Latham MC, Perry M, Cross ML, Byrom AE 2013. Comparison of ranging behaviour in a multi-species complex of free-ranging hosts of bovine tuberculosis in relation to their use as disease sentinels. Epidemiology and Infection 141: 1407–1416.

Landcare Research Page 59
Appendix 1 – Map of Hauhungaroa and Rangitoto ranges
Map showing the location and acronyms for the Vector Control Zones in the Hauhungaroa and Rangitoto ranges ‘Proof of Concept’ area in the central North Island. The Rangitoto Range is assigned the acronym RTT in the main body of the report. Also shown, for illustrative purposes, are the Surveillance Sensitivity contours derived from pig surveys conducted after September 2011 but before July 2013. We conservatively assumed sub-adult pigs were 0.75 years old, and adult pigs were 1.5 years old, with a home range radius of 0.9 km (half the current default used in the Proof of Freedom calculation). The calculations assume that all pigs were TB-negative, but in fact some infected animals have been recorded.

Progress toward the eradication of TB from wildlife in the Hauhungaroa Ranges
Page 60 Landcare Research
Appendix 2 – Detection and targeted control of possums, Tihoi 3A, 2010–2011
Executive Summary from: Sweetapple P, Nugent G, Williamson J 2011. Detection and targeted control of possums: Tihoi 3A experimental operations, 2010-2011. Landcare Research Contract Report LC786. 22 p.
Project and Client
• A trial possum control operation was undertaken in Tihoi 3A Vector Control Zone by Landcare Research, Lincoln, for the Animal Health Board, Waikato, between May 2010 and July 2011. Possum distribution information from chewcard surveys was used to direct trapping and cyanide poisoning effort to sites of possum activity, as a trial alternative to broadcast aerial 1080 poisoning for controlling low-density possum populations.
Objectives
• Refine the detection and mop-up strategy for possum control and assess its practicality on an operational scale:
• Undertake a pre-control chewcard survey and targeted possum control using ground techniques over c. 8400 ha of the north-eastern Hauhungaroa Range.
• Compare the efficacy of chewcard transects spaced at 250- or 500-m intervals.
• Trial the efficacy of deploying cyanide poison on or close to chewcards.
• Quantify the dollar costs of the operation.
• Determine the TB status of possums by necropsy of carcasses and tissue culture.
• Quantify detectability and trappability of possums in summer and winter.
• Compare possum capture rates obtained from 5-trap and 13-trap trapping grids placed at sites of possum activity.
Results
• Possum distribution was patchy in 2010 with areas of high possum activity recorded adjacent to large areas of apparently possum free terrain.
• The percentage of trap clusters catching possums and number of possums caught at each cluster were higher in 2011 when trapping was undertaken within a week of possum detection, compared with 2010 when there was a delay of up to 2 months between possum detection and trapping.
• Few possums were killed by either cyanide paste or Feratox® bait, both at chewcard and trap sites, probably due to rat interference.
• Possum capture rates were similar along 250-m and 500-m transects blocks in 2010. No residual possum distribution patterns resulting from removal of possums along

Progress toward the eradication of TB from wildlife in the Hauhungaroa Ranges
Landcare Research Page 61
500-m spaced transects, but not between, in 2010, were evident during the 2011 Chewcard Index surveys.
• Possum detection rates were higher in summer than winter 2011, but capture rates and population reductions were similar in both seasons.
• Five-trap clusters caught similar numbers of possums per detection cluster as did 13-trap clusters, and resulted in similar population reduction estimates.
• None of the possum carcasses necropsied (n = 637) exhibited visible TB lesions.
• Chewcard detection survey costs in 2010 ranged from $8.56 to $17.91 per hectare (250-m transect equivalents) reflecting variable vegetation conditions and operator experience.
• Mop-up trapping costs in 2010 ranged from $9.46 to $26.5 per hectare reflecting the range in possum abundances between the six blocks.
Conclusions
• Possum populations redistribute themselves patchily across the landscape following control. This may have negative consequences for TB transmission but increases the efficiency of the detection and mop-up strategy.
• Delayed implementation of mop-up trapping following possum detection reduces mop-up efficacy.
• The use of cyanide baits alongside chewcards or in conjunction with trapping is ineffectual in the presence of abundant rats.
• No benefits were recorded by undertaking two operations with 500-m-spaced transects than one with transects at 250-m intervals. The former strategy is likely to be the least efficient due to rapid possum movement into voids created by the first operation.
• Five-trap clusters were equally efficacious as 13-trap clusters during targeted possum mop-up.
• Similar possum population reductions appear achievable in summer and winter using detection and mop-up methods.
• Detection and mop-up costs varied greatly depending on the nature of the vegetation and initial possum abundance. This control method will be cost-effective only at low possum densities.
Recommendations
• Cyanide poison should not be used during chewcard surveys or subsequent possum trapping in the presence of abundant rats.
• Follow-up trapping must be conducted as soon as possible, preferably within one week, after retrieval of possum detection chewcards, on a site-by-site basis.

Progress toward the eradication of TB from wildlife in the Hauhungaroa Ranges
Page 62 Landcare Research
• Of the two trap-cluster formats tested, we recommend using the ‘five traps within 50 m of each possum detection site’ (rather than the 13-trap format) and that at least four nights’ trapping be conducted at each site during follow-up possum control.
• Detection and targeted possum control operations should be conducted in summer, if only because of longer days and generally more settled weather allowing rapid follow-up to be more often achieved. However, it appears that similar control efficacy can be achieved in winter.
• Extensive areas of low dense vegetation such as gorse, blackberry, toetoe and thinning slash should be excluded from detection surveys, and be controlled by alternative methods (e.g. perimeter control using bait stations).

Progress toward the eradication of TB from wildlife in the Hauhungaroa Ranges
Landcare Research Page 63
Appendix 3 – Calibrating Trap-Catch, Chewcard indices and possum density
Background
In the Spatial Possum Model, the epidemiological dynamics of TB infection are simulated in relation to possum density. In Section 7.3, the model is used to simulate the probability that previous reductions in density (i.e. control operations) have eliminated TB. However, the estimates of possum density used to parameterise the model are not measured directly. Instead they are inferred from indices of possum abundance based on either trap-catch (NPCA 2011) or chewcard (Sweetapple & Nugent 2011) methods.
Simulation modelling of the relationship between the trap-catch index (TCI) and possum density suggests a 5:1 ratio (Ramsey et al. 2005). That estimate was derived using trapping data from unmanaged high density populations for which the home range radius was mostly about 60–70 m (equating to mean home range sizes of 1–1.5 ha). At the much lower densities that now prevail in the HRR, however, home range sizes appear to be much larger. If this reflects increased possum mobility (distance travelled per night), it is likely to increase the chance of a possum encountering traps, and therefore the TCI/Density ratio. In that context, using the same calibration ratio at both high and low density results in an underestimate of the reduction in density, and in the SPM model being parameterised with post-control densities substantially higher than reality. That then increases the probability of TB persistence predicted by the SPM.
The relationship between Chewcard Indices (CCIs) and density has not been similarly estimated, but there is a 6:1 ratio between 7-day CCIs and 1-night TCIs (Sweetapple & Nugent 2011) that is consistent with different time periods over which the index is assessed. Recent work in the HRR indicated that the 6:1 ratio applied even at very low possum density (Nugent et al. 2012a).
To assess whether using the 5:1 TCI/Density ratio (or the equivalent 30:1 CCI/Density ratio) was likely to introduce substantial biases into the SPM prediction of PossPreP0, we collated data from various recent trials in the HRR in which an estimate of possum density could be derived, and examined the correlation between the TCI/RTCI and/or CCIs recorded in those trials to the estimates of possum density.
We note that the TCI method used in these trials did not conform to the standard RTCI protocol (NPCA 2011) in that 50-m trap spacing was used. That is likely to result in a higher possum catch rate than with the standard 20-m spacing.
Data sources and analyses
Data from eight trials were available (Table 14). These were conducted for a number of different purposes (usually either control or TB surveillance), so trial designs differ widely, necessitating use of a number of different approaches to estimation of density. In most instances, either TCIs or CCIs were recorded on two occasions before and after a known number of possums was removed, and the change in the indices as a result of that possum removal was used to estimate population size at the time the pre-removal index was

Progress toward the eradication of TB from wildlife in the Hauhungaroa Ranges
Page 64 Landcare Research
measured. CCIs were recorded over 6–7 nights, and the TCI/RTCI data are for the first three fine nights of trapping.
Table 14 Summary of eight recent HRR trials in which TCI /RTCI and/or CCI data were collected and in which an estimate of actual possum density was obtained
Trial # VCZ Date 6–7-day CCI (%) TCI (%) Density (possums/ha)
1 Tihoi 3B Mar–Apr 2008 20.2 0.22
2 AS3 May 2009 19.3 0.34
3 AS3 Oct 2009 14.2 0.29
4 AS3 Nov 2009 3.44a 0.15
5 AS3 May 2012 2.9b 1.74a,c 0.03
6 Tihoi 3A Feb–Mar 2011 24.6 4.5d 0.18
7 Tihoi 3A May–Jun 2011 23.3 4.6d 0.23
8 Tihoi 3A May–Sep 2013 8.2 (May) 0.88a (Sep) 0.05
a Trap spacing = 50 m; b estimated from initial CCI and the relative change in CCI in an adjacent block. c Whole-area untargeted trapping, lines 500 m apart, traps every 50 m.; d targeted trapping in 5- or 13-trap clusters, traps 50 m apart
Trial 1: A 217-ha study block was surveyed using CCIs. Further chewcards were then deployed for 4 nights in grids around initial possum detections and DNA was obtained and genotyped from those cards. The grids were then leghold-trapped for 6 nights, catching 14 possums on the first three nights and one possum thereafter. Captured possums were also genotyped. Population size was estimated from the known number of possums removed and the proportion of possum genotypes recorded on the chewcards that were represented in 15 genotypes obtained from captured possums – a mark–recapture approach.
Trials 2–4: Possum distribution was mapped with chewcards over 6 nights in May and October 2009, in a 224-ha treatment block and a 755-ha non-treatment block. All detection sites in the treatment block were trapped and poisoned with cyanide immediately after mapping (possum mop-up), removing 31 possums on both occasions. The two blocks were then systematically leghold-trapped in November to assess residual possum abundance.
For the treatment block, the net percent reduction in possum abundance as a result of the removal of 62 possums over the May–November period was assumed to be approximated by:
Reduction(%) = (1 − (𝐶𝐶𝐼𝑁𝑇
𝐶𝐶𝐼𝑇×
𝑇𝐶𝐼𝑇
𝑇𝐶𝐼𝑁𝑇)) ∗ 100
where CCI is the initial May chewcard index, TCI is the November trap-catch index and NT and T are the treatment and non-treatment blocks, respectively.
A first estimate of the number of possums present at any time between May and November 2009 in the treatment block (95 possums) was derived by dividing the number removed (62)

Progress toward the eradication of TB from wildlife in the Hauhungaroa Ranges
Landcare Research Page 65
by the percent reduction (65%)The number present before the October operation (64) was then 95 less those those removed in October (31). These 64 were adjusted downward by 16% (the percentage of possums caught in October assessed as having been recruited into the population since May) to give 54 possums present and the end of the May operation, and 85 (54 + 31 removed) present at the start of May.
The total number of possums in the treatment block at the start of TCI trapping (33) was estimated by subtracting the number killed during the two mop-up operations (62) from the total number of possum accounted for (95) divided by the estimated percentage killed (65%; Sweetapple et al. 2010).
These estimates of possum numbers present at the beginning of each stage of the study were then divided by the area of the treatment block, including a 200-m buffer around transects, to estimate possum densities.
Trial 5: This trial was part of this study (Section 4.2) and involved two possum-removal (control) treatments (chewcard detection targeted control (chewcard DTC 1224 ha), and systematic leghold trapping (LHT; 912 ha)) in six contiguous blocks. A 6-day CCI was measured before (March) and after control (July). During the intervening control phase, possums were removed using the same spatial design for both DTC and the LHT methods (50-m device spacing on lines 500 m apart). Fifteen and 19 possums were removed from the DTC and LHT blocks, respectively
Planned estimation of percent kill and density was complicated by either little change or an increase in possum CCIs in the LHT or DTC blocks despite the removal of possums. We therefore assumed that this was attributable to a major seasonal change (increase) in chewcard detectability, and estimated possum kill rates as follows:
• We explored a wide range of possible values for the percent increase in seasonal detectability, and used each value to adjust the pre-control CCI upward, giving pre-control CCI values comparable with post-control values for that particular increase in seasonal detectability.
• The percent reduction in CCI for each treatment was then calculated for each seasonal increase/treatment combination using the following:
𝑃𝑜𝑠𝑠𝑢𝑚 𝑘𝑖𝑙𝑙 = (1 − (𝐶𝐶𝐼𝑝𝑟𝑒 − 𝐶𝐶𝐼𝑝𝑜𝑠𝑡
𝐶𝐶𝐼𝑝𝑟𝑒)) × 100
where CCIpre is the pre-control chewcard index and CCIpost is the post-control Chewcard Index.
• The number of possums actually removed during the TB surveillance operations was converted to a pre-control density using the estimated kill and the size of the operational area for each seasonal increase/treatment combination using the following:
𝐼𝑛𝑖𝑡𝑖𝑎𝑙 𝑝𝑜𝑠𝑠𝑢𝑚 𝑑𝑒𝑛𝑠𝑖𝑡𝑦 =𝑁𝐾𝑖𝑙𝑙
%𝐾𝑖𝑙𝑙÷ 𝐴𝑟𝑒𝑎

Progress toward the eradication of TB from wildlife in the Hauhungaroa Ranges
Page 66 Landcare Research
where NKill is the number of possums removed, %Kill is the estimated percent kill and Area is the size of the operational area in hectares.
• The natural log of the ratio of estimated initial possum densities was plotted against percent seasonal detection increase to find the value that matched the natural log of the ratio of the pre-control CCIs. The seasonal increase in possum detection rates thus identified was then used as the basis for estimating percent kill and pre-control densities.
Working through the actual values, pre-control CCIs were 5.5 and 2.6 in the DTC and LTH blocks, respectively (Ln(ratio) = 0.75). The simulated seasonal increase in detection rate that predicted the same was 135%. This equated to predicted percent kills of 18% and 64%, and initial possum densities of 0.07 and 0.03 possum/ha in the DTC and LTH blocks, respectively.
Trials 6–7: In both studies pre- and post-control-index chewcards were placed in four replicate treatment blocks and four non-treatment blocks for 7 nights. All treatment blocks were controlled using clusters of 5 or 13 leghold traps set for 3 nights at all possum detections on pre-control-index lines. The proportion of possums killed was estimated as follows:
𝑝(Kill) = 1 − (𝐶𝐶𝐼𝑇𝑝𝑜𝑠𝑡
𝐶𝐶𝐼𝑇𝑝𝑟𝑒×
𝐶𝐶𝐼𝑁𝑇𝑝𝑟𝑒
𝐶𝐶𝐼𝑁𝑇𝑝𝑜𝑠𝑡)
where T = treatment block, NT = non-treatment block, pre = pre-control and post = post-control.
Pre-control possum density in the treatment blocks was then estimated as:
Density = 𝑁𝑜. 𝑝𝑜𝑠𝑠𝑢𝑚𝑠 𝑟𝑒𝑚𝑜𝑣𝑒𝑑
𝑝(𝐾𝑖𝑙𝑙)×
1
𝐴𝑟𝑒𝑎

Progress toward the eradication of TB from wildlife in the Hauhungaroa Ranges
Landcare Research Page 67
Appendix 4 – Deer spillback risk modelling
Abstract from: Barron M, Nugent G, Cross F 2013. Importance and mitigation of the risk of spillback-transmission of Mycobacterium bovis infection for eradication of bovine tuberculosis from wildlife in New Zealand. Epidemiology and Infection 141: 1394–1406.
Introduced brushtail possums (Trichosurus vulpecula) are wildlife maintenance hosts for Mycobacterium bovis in New Zealand, often living sympatrically with other potential hosts, including wild red deer (Cervus elaphus scoticus). Population control of possums has been predicted to eradicate tuberculosis (TB) from New Zealand wildlife; however, there is concern that long-lived M. bovis-infected deer could represent a ‘spillback’ risk for TB re-establishment (particularly when possum populations recover after cessation of intensive control). We constructed a time-, age- and sex-structured, deer/TB population generic model and simulated the outcomes of deer control on this potential spillback risk. Maintaining intensive possum control on a 5-year cycle, the predicted spillback risk period after TB eradication from possums is ∼7 years, while the probability of TB re-establishing in possums over that period is ∼6%. Additional targeted control of deer would reduce the risk period and probability of spillback; however, even with high population reductions (up to 80%) only modest decreases in risk and risk period would be achieved. We conclude that possum control alone remains the best strategy for achieving TB eradication from New Zealand habitats in which possums and wild deer are the main M. bovis hosts.