PROGRESS REPORT TO THE COMMISSION ON HIGHER EDUCATION …metro.inter.edu/rectoria/docs/Assessment...
95
PROGRESS REPORT TO THE MIDDLE STATES COMMISSION ON HIGHER EDUCATION FROM INTER AMERICAN UNIVERSITY OF PUERTO RICO METROPOLITAN CAMPUS SAN JUAN, PUERTO RICO, 00919 CHIEF EXECUTIVE OFFICER MARILINA WAYLAND, CHANCELLOR DR. LUIS PEDRAJA ACCREDITATION LIAISON OFFICER OCTOBER 1, 2010 SUBJECT OF THE FOLLOW-UP REPORT: DATE THE PRR WAS SUBBMITTED: JUNE 1, 2008
Transcript of PROGRESS REPORT TO THE COMMISSION ON HIGHER EDUCATION …metro.inter.edu/rectoria/docs/Assessment...

PROGRESS REPORT TO THE MIDDLE STATES COMMISSION ON HIGHER EDUCATION
FROM INTER AMERICAN UNIVERSITY OF PUERTO RICO
METROPOLITAN CAMPUS SAN JUAN, PUERTO RICO, 00919
CHIEF EXECUTIVE OFFICER MARILINA WAYLAND, CHANCELLOR
DR. LUIS PEDRAJA ACCREDITATION LIAISON OFFICER
OCTOBER 1, 2010
SUBJECT OF THE FOLLOW-UP REPORT:
DATE THE PRR WAS SUBBMITTED: JUNE 1, 2008

2
TABLE OF CONTENTS
Introduction ................................................................................................................................................... 3
MS-CHE Last Accreditation Action ............................................................................................................. 3
MC-Action Agenda on Assessment of Student Learning (Standard 14) ...................................................... 3
Implementation of the Assessment Process .................................................................................................. 4
Actions taken ................................................................................................................................................ 5
Institutional level ...................................................................................................................................... 5
Program level ............................................................................................................................................ 6
Classroom Level ....................................................................................................................................... 7
Immediate Outlook ....................................................................................................................................... 7

3
INTRODUCTION
Inter American University of Puerto Rico (IAUPR) is a private, non-profit Hispanic-serving institution
and the largest private university in Puerto Rico with nine campuses and two professional schools: School
of Law and School of Optometry. Enrollment, in recent years, has been maintained at approximately
44,000 students. It was originally founded in 1912 as the Polytechnic Institute of Puerto Rico by the
Reverend John William Harris. Since 1944, the Institution has been accredited by the Middle States
Association of Colleges and Schools. It was the first four-year liberal arts college accredited outside the
continental limits of the United States.
The Metropolitan Campus (MC) is the largest academic unit of IAUPR system. It was established in
1962 and serves low income, low middle class, Hispanics students. In the Fall of 2009, MC had an
enrollment of 10,600 students. Metropolitan Campus offers: 12 technical certificates, 9 associates, 46
baccalaureates, 6 professional certificates, 42 masters and 12 doctoral degrees. Annual graduating class
average is 2,000 students. MC is licensed by the Puerto Rico Council on Higher Education (PRCHE) for
the higher education level and Puerto Rico General Education Council for the technical certificate level.
MC is also accredited by the Middle States Commission on Higher Education (MSCHE). It also has
professional accreditations for its Nursing, Social Work, and Medical Technology programs by the
National League of Nursing, Council on Social Work Education, and National Accrediting Agency for
Clinical Laboratory Sciences, respectively. MC Continuing Education Program is accredited by the
International Association for Continuing Education and Training.
MC has a diverse student population and its services aim to address the needs of talented, Honor, adult,
and international students coming from different countries, especially, from the Caribbean. MC is the
only institution in Puerto Rico that offers programs in both Spanish and English languages. Students can
earn undergraduate degrees in Entrepreneurial and Managerial Development, Nursing and Psychology
and master degrees in Business Administration studying in English.
In 2008-09, MC concluded the revision of its Mission and Goals to guide the institutional agenda toward
the development of leadership and entrepreneurial skills of students who live and work in a global
community. The mastery of English and Spanish, as well as other languages, is important to the
fulfillment of MC Mission and Goals since communication skills are key for international and
multicultural collaboration and understanding. Also it is important to MC Mission that students develop
interpersonal sensitivity and empathy to individual needs, core values of the Christian ecumenical
tradition of IAUPR.
MSCHE LAST ACCREDITATION ACTION
On November 20, 2008 the MSCHE reaffirmed the Inter American University (IAUPR) Metropolitan
Campus (MC) accreditation. A progress report documenting evidence of direct methods of assessment of
student learning at the institutional and program level, including evidence that student learning
assessment information is used to improve teaching and learning (Standard 14), was requested by October
1, 2010. In response to this request, MC submits the following report that demonstrates how it uses
assessment information to improve teaching and learning.
MC-ACTION AGENDA ON ASSESSMENT OF STUDENT LEARNING (STANDARD 14)
The MC Assessment Model is centered on student learning outcomes and responds to the Campus
Mission and Goals (Appendix 1). Responsibility for assessment processes at MC is shared by faculty,
administrators and Chancellor’s staff. The Dean of Studies oversees and coordinates the academic
assessment (program level and classroom level) effort, to ensure the successful systematic operation of
assessment processes within the academic programs, in order to achieve continuous improvement of
student learning. The Dean of Institutional Research and External Funds is responsible for assisting

4
programs and faculty members by providing essential database information. Academic programs are
organized in 4 academic division or faculties, each under the supervision of a dean: the Faculty of Science
and Technology, the Faculty of Humanistic Studies, the Faculty of Education and Behavioral Sciences,
and the Faculty of Economics and Administrative Sciences. The organizational structure of each of the
four faculties is similar; divided into specialized departments or schools with a director and program
coordinators. Each faculty dean is responsible, among other duties, for successful operation of their
assessment plan at the program and classroom level within their academic offerings and ensures that
assessment is done continuously and systematically. Deans and the department or school directors and
faculty members are responsible for developing and implementing a program assessment plan that is
consistent with the Institution’s mission and goals, including reviewing the results and taking actions
within their academic programs to improve student learning outcomes.
An Institutional Assessment Committee (IAC) for MC has been appointed by the Chancellor. The
president of IAC is the Dean of Institutional Research and External Funds. The Dean of Studies, the
Dean of Student Affairs and four faculty members constitute the committee. Specific roles are defined in
the Assessment Model. IAC is represented on the Chancellor’s staff, on the Strategic Council, as well as
the Academic Senate, since all Deans are members of these bodies. IAC is responsible for monitoring the
ongoing assessment of student learning outcomes in undergraduate and graduate programs and assures the
program congruency with the Institution’s mission and goals. It also identifies database needs and
determines necessary surveys to support the assessment process in compliance with MSCHE accreditation
standards. Information provided by outcomes assessment process at program and classroom levels
support decisions making related to MC allocation of resources, annual budget, and MC Strategic Plan.
It is important to note that the Puerto Rico Council on Higher Education authorizes all academic offerings
of higher education institutions on the Island. This process requires the submission of a proposal that must
include four main components: (1) congruency of academic program with institutional mission and goals,
(2) student learning expectations at the program level, (3) a mapping with student learning expectations
and courses, and (4) congruency of course syllabi, student learning outcomes and student learning
expectations at program level. MC academic offerings comply with these components of academic
program authorization and all MC academic offerings have PRCHE authorization.
IMPLEMENTATION OF THE ASSESSMENT PROCESS
MC implemented the assessment plan that was included in the Periodic Review Report (2008). Since a
new MC mission and goals were adopted in 2009, the institutional assessment plan was revised. A copy
of the revised MC Academic Assessment Plan (institutional level) is included in Appendix 2. By the end
of 2009, each Academic Faculty had developed a Program Assessment Plan using the MC Academic
Assessment Model as a guide. Outcomes assessment and the results are analyzed and used to determine
the actions needed to maintain or to strengthen the achievement of student learning goals. Through their
Program Assessment Plan, faculty members determine when, what, and how the student learning
outcomes are assessed. Assessment efforts vary by academic programs. Although there are programs,
like Nursing that have a systematic and comprehensive assessment process (See Appendix 3) others are
initiating the implementation of their assessment plan with data collection, elaboration appropriate
assessment tools, and integrating all assessment efforts (See Appendix 4)
Direct assessment measurements used by programs include: performance in licensure or external
certification exams, pre-post tests, dissertations, comprehensive tests and employer surveys, among
others. For example, Nursing, Medical Technology, Psychology, and Teacher Education programs use
student performance in licensure or certification tests. Results are analyzed annually to determine areas
for improvement. Other direct measurements have been incorporated, such as pre and post tests
administered in Accounting, Biology, Psychology, Teacher Education Program and General Education
Program, among others.

5
Based on the student learning outcomes assessment, changes have been implemented at the institutional
and program levels. Actions taken include revision of syllabi, recruitment of new faculty members, use of
new teaching methodologies, integration of technology, curricular revision, and program elimination.
Some of these changes are mentioned below and supporting evidence and documents appears in the
corresponding appendices.
ACTIONS TAKEN
Institutional level
Retention Efforts - Retention has been one of MC primary concerns. The retention performance
indicator at the System level is 70% at the end of the first year. MC first-year retention rate has been:
72.5%, in 2006; 66.6, in 2007; 68.5, in 2008; and 67.7, in 2009. To improve this rate, MC has
implemented the following strategies to gather data and information: satisfaction survey analysis, early
warning systems, Retention Management System/College Student Inventory, student withdrawals report
and questionnaire and gateway courses data.
The student satisfaction surveys, administered every two years to undergraduate and graduate student
samples, were analyzed and compared through the years both at Campus and university system levels.
Results reflect the following areas for improvement: Schedule of classes, financial aid and library.
Actions taken include: reengineering of class scheduling process, wide dissemination of financial aid
opportunities and services, and a revision of the book acquisition process that resulted in lower book
prices.
An early warning system was developed at the System level. Predictive factors of student success are
identified and reports are submitted annually with a list of students at risk. Each Academic Faculty
receives the reports for student follow-up. Academic and Professional Advising processes are in place for
each program and each intervention activity is documented. A referral process for counseling at the
Student Orientation Center (SOC) was established. In addition, the SOC interviews every student as part
of an official withdrawal process. Students complete a questionnaire that provides information about the
factors affecting their academic success.
RMS/CSI provides information about first year student profiles. The questionnaire is administered
annually to students registered in GEIC 1000 sections in July before the beginning of regular trimester.
The results are used to organize the Orientation Center annual work plan. Relevant information is shared
with key administrators and faculty members. An analysis of courses data reflects that Mathematics and
Religion have the lowest passing rate. Mathematics faculty has implemented new teaching strategies and
incorporated the use of on-line resources to their courses. A tutorial laboratory has been established for
math students. The general education course about the Christian Faith has been revised and faculty
development workshops have been held.
New retention initiatives have been implemented this academic year in the following programs: Popular
Music, Biology, Nursing and Teacher Education Program. A Title V project proposal dealing with
retention improvement with an emphasis in peer and faculty mentoring, and a student engagement system
platform was submitted in June 2010.
Distance Learning
The number of distance learning students and course sections has significantly increased in the last five
years (from 181 to 672 on-line class sections). Several projects have been developed to determine
distance learning education effectiveness. The Center for Distance Learning and Technology Integration
was established; a director who is a specialist in the area and four technical specialists were recruited.
Faculty evaluation was incorporated to the distance learning courses through the Web, on-line student

6
satisfaction surveys for distance learning students was administered and a comparative study of student
performance in on-line versus traditional mode of GEIC 1000 registered students was initiated. Actions
taken include: a professional counselor was assigned to provide services to on-line students, new
software (WIMBA) to facilitate the teaching learning process has been acquired. An on-line helpdesk
was developed and tutorials are being implemented.
Planning and Budget
Assessment provides relevant information for decision making during the planning and budget process.
The annual budget cycle begins in November with the update of the five year strategic plan designed to
achieve the mission and goals. The first phase of analysis takes place at the departmental level, where the
information provided by the different assessment tools is integrated and translated into the corresponding
activities for the work plan and budget request. The second phase involves the participation of the deans
in the decision making process and the chancellor. Every petition must be justified with corresponding
data and aligned with the strategic plan. Examples of these processes are the allocation of funds for:
faculty positions, technological resources, student support services, faculty development and professional
accreditations. During the academic year 2009-10, the School of Business was granted the NIBS
accreditation and the Teacher Education Program and the Associate Degree in Nursing Program received
the candidacy for accreditation by TEAC and NLNAC, respectively. These accreditation processes
required outcomes assessment that evidenced compliance with their corresponding standards.
External Communities of Interest
Alumni, employers and community leaders provide important feedback for strategic growth and
development of MC. Assessment efforts that reach these communities of interest include alumni survey
and employers survey (Appendix 5). An important outcome was the need to improve the services and
academic offerings for international students. Accordingly, the international relations office was
established and MC joined the ACE Laboratory for Internationalization. A self- study was prepared and
submitted for ACE consideration and the evaluation visit will be held in November 2010. In order to
establish a regular communication with community leaders, an advisory board was designated in August
2010. The members represent diverse professional sectors related to the four academic faculties. The
objectives of this group are: to provide immediate reaction to academic initiatives and projects, to
identify opportunities for enhancement of the Campus academic offerings, to serve as liaisons with
external community activities.
Program level
Curriculum revisions require outcomes assessment as an integral part of this process. The Institution has a
Five-Year Plan for all programs. Review is based in a five-year cycle. This process is carried out by
faculty members at the department level. Academic department recommendations are submitted to the
Academic Senate, in which faculty members, students and administrators are represented. After the
approval by the Academic Senate revisions are ratified by the University Council at the university system
level, and authorized by the President.
Assessment results must be included in the proposal to be considered by the Academic Senate in program
revisions and assessment plans are required as part of program creation proposals. The following
programs have been revised within the past two years: Popular Music, Chemistry, Medical Technology,
Environmental Evaluation and Protection, Labor Relations, History, Occupational Education and
Managerial Economics, in accordance with the institutional five-year revision plan.
Assessment of the General Education Program is an ongoing university system effort. MC faculty
members participate in every step of the assessment process, especially in faculty training to develop

7
standardized tests and analysis of results. Actions taken for basic skills course improvement (Spanish,
English and Mathematics) include the development of on-line modules to address specific competencies
required for higher level courses, course and syllabi revision and the restructuring of skills development
tutorial laboratories.
Several programs developed outstanding assessment practices that represent the best of MC efforts.
Among these are: the use of computerized assessment tools by the School of Nursing for diagnostic and
remediation of student competencies, the alignment of master level Psychology courses with the
competencies required to practice the profession as licensed psychologist; the contribution of CPA alumni
focal groups to enhance the Accounting Integrating Seminar and the mapping of Education professional
competencies with the required courses within the Teacher Education Program. All of these examples
benefitted from the analyses of certification exam results offered to all professionals entering their
respective practices in Puerto Rico. Programs submit assessment progress reports annually. The
Chancellor selects a sample of reports to be presented to all faculty members at a meeting.
Classroom Level
Significant changes have been undertaken as a result of classroom assessment. Among the assessment
tools used by faculty members are standardized test results, reflective diaries, one-minute papers, balloon
pitch sessions, debates, oral presentations, and pre- and post-tests. Several teaching strategies have been
integrated for the improvement of learning outcomes, as exemplified by peer-mentoring, integrating
seminars, on-line educational resources, tutoring and use of case studies in courses within different
disciplines.
IMMEDIATE OUTLOOK
The complexity of organizing and managing the assessment data at MC requires a mechanism to facilitate
the systematic and ongoing implementation and monitoring of the assessment process. Consequently,
IAUPR acquired TK20, a technological platform designed for this purpose. MC already identified an
organizational structure within which the data will be collected and organized. All programs objectives
and student competencies will be aligned with campus mission and goals. This software allows
interaction with both Banner and BlackBoard platforms. Assessment results will be readily available for
ongoing use by key faculty and personnel. This project is under the joint oversight of the Dean of
Institutional Research and External Funds, the Dean of Studies and the MC Institutional Assessment
Committee (see Appendix 6).
As part of its commitment to assessment, IAUPR has planned an assessment forum to be held on
December 1st at the MC Theater. This forum will be an opportunity for all faculty members to further
refine their assessment practices as well as to showcase best practices among professors within the
System. The keynote speaker for this event will be Prof. Linda Suskie.

Inter American University of Puerto Rico Metropolitan Campus
2009-2010
Appendix 1 Assessment Model

APPENDIX 1: IAUPR-METROPOLITAN CAMPUS ASSESSMENT MODEL
2
Inter American University of Puerto Rico
Metropolitan Campus
Assessment Model
Introduction
During the last two decades, assessment of formal student learning has been institutionalized at higher
education institutions as a critical variable in evaluating institutional effectiveness. As a result,
institutions of higher education have improved their planning processes, evaluation instruments and
have implemented new strategies, trained and empowered their faculty and administrators. The
assessment of student learning outcomes as a process and product is an essential element in
organizational culture, centered in the student quality of learning. This assessment requires all
constituent commitment to achieve the institution mission and goals.
The literature has defined the assessment concept in various ways. Palomba and Banta (1999) define
assessment as the “systematic collection, revision, and use of information concerning its programs for
the purpose of improving student learning and development.” Rosa (2004), on the other hand, makes
reference to the process of collecting information that integrates a variety of instruments and measures
to obtain a multiple of opinions with reference to a program. This process can be carried out at the
institutional and program level and may include courses and profiles of students and professors. The
assessment process is geared towards strengthening student learning within the cognitive and affective
domains during their academic experience.
Assessment centered on student learning is a paradigmatic change that has had a positive effect on
student evaluation and academic program effectiveness. This new paradigm redefines the academic
endeavors in a systemic way at the Campus. This view on learning compels us to look at the empirical
bases that support decision-making and at the strategies for the qualitative improvement of student
learning. For faculty members, this implies a new frame for the discussion of objectives, curriculum
organization, teaching methodologies and student profiles definitions.
Campus Assessment Model The assessment framework of the Inter American University of Puerto Rico System is based on the
premise that all that takes place within an educational institution has an effect on learning. It recognizes
that the cornerstone of the assessment process is the vision and mission of the organization, and
provides the framework for the Campus Assessment Model. The model has a systemic approach to
define its elements and their interrelationship. The following key elements and their corresponding
interrelationships summarize the Campus Assessment Model.

APPENDIX 1: IAUPR-METROPOLITAN CAMPUS ASSESSMENT MODEL
3
The elements in the model are input, process, product and final results. Each element provides for both
formative and summative assessment. The first two elements are generated through the internal efforts
of the programs. The third element is the programmatic result translated into products for learning.
Lastly, the results correspond to the social (external) impact of the graduates relative to the mastery of
professional competencies within the context of employment or graduate education. The analysis can
be conducted with one element or with the general profile of all the elements that contribute to the
expected results. The following figure includes examples of the different elements.
ASSESSMENT MODEL OF THE METROPOLITAN CAMPUS1
INPUT PROCESS PRODUCT RESULTS
Students Instruction: Strategies,
Educational Materials,
Evaluation
Academic Achievement
- Level of skills, acquired knowledge and attitudes
Graduate employees in their
major or related areas
Faculty Course Level Retention and Graduation Employer’s Opinion
Accreditation and
Licensing Standards
Curriculum Sequence Satisfaction with the degree
and the educational
experience
Graduate’s Opinion
Curriculum – Mission,
Objectives, Curriculum
Model
Section Size Performance on
Comprehensive Examinations-
Knowledge and skills level
Contribution to the Community
Educational Resources Modality Intellectual Development Graduate Leadership
Equipment Faculty and Student
Development Professional Growth
Congruence between social
necessity and services rendered
1 Rosalie Rosa Soberal (2006).
INPUT PROCESSES PRODUCT RESULTS
CONCLUSIONS
DECISIONS
AND
ACTIONS TAKEN

APPENDIX 1: IAUPR-METROPOLITAN CAMPUS ASSESSMENT MODEL
4
ASSESSMENT MODEL OF THE METROPOLITAN CAMPUS1
INPUT PROCESS PRODUCT RESULTS
Physical Installations:
classrooms, laboratories,
technology
Satisfaction Level of Faculty
and Students
Contribution to the Discipline –
Dominance by skill and
educational level
Community Service
Budget Course Evaluation by
Students and Faculty
Administrative Structure Use of Technology
Supporting Personnel
INTERNAL EXTERNAL
Principles
The following principles support the assessment model:
Assessment is composed of four fundamental processes: (1) it clearly identifies the product or expected outcomes of student learning, (2) it gathers evidence that documents the results, (3) it interprets the data collectively and (4) it is utilized to improve student teaching and learning.
Mastery of the competencies in the disciplines is associated with an educational process that is systematic, deliberate, to the learning process that takes place during the systematic and deliberate awareness of the educational process.
The learning assessment product requires an examination of the demands of the external environment, the accreditation and licensing institutions, as well as student profiles.
A systemic vision allows the integration of program efforts and results (internal); and the social impact (external) on the society to make academic and administrative decisions.
The results form a profile of the relationship of the mission, goals and objectives to determine institutional effectiveness.
PROGRAM EFFORTS PROGRAM RESULTS SOCIAL IMPACT

APPENDIX 1: IAUPR-METROPOLITAN CAMPUS ASSESSMENT MODEL
5
The results are useful as a managerial tool during the planning, development and assignment of resources to improve the institution, its programs and services.
The active participation of all members of the university community is essential in achieving the institutional mission and its goals.
Quantitative and qualitative methodologies allow the combining of a variety of direct and indirect measures that contribute valuable information needed to document decision-making.
The learning assessment model offers information on the processes that affect the expected outcomes.
An evaluation of the results of the learning model leads to an evaluation of the institution: its mission,
goals and objectives. The purpose of assessment at the institutional level serves to determine the
feasibility of its academic offerings; its strategic planning and an analysis of the tendencies at the higher
education level, the emerging technologies, and the social, historical and cultural context of the
institution.
MC Academic Assessment Plan
The assessment model has been used to formulate and revise the MC Academic Assessment Plan, that
is, the activities, strategies and the procedures geared towards achieving the results. The MC Academic
Assessment Plan is an instrument that gives direction, organization, and guidance to the particulars of
the academic programs.
Based on the MC Academic Assessment Plan, a work plan was developed. It includes the time needed to
ponder the program assessment plans against the action taken and a timetable to examine the expected
outcomes against the results and improvement activities incorporated. MC considers the discrepancies
between the expected outcomes and those achieved to incorporate corrective action as soon as
possible.

APPENDIX 1: IAUPR-METROPOLITAN CAMPUS ASSESSMENT MODEL
6
Responsibility for assessment is an institution-wide process that is shared by faculty, administration, and
staff. At MC the assessment process is organized at different levels. The responsibilities for each level
are delineated in the following table. The assessment process initiates with the definition of the
expected student learning outcomes at the different levels starting with curricular design for new
programs and periodic academic program review (at least every five years).
MC ASSESSMENT RESPONSABILITIES BY LEVELS
ORGANIZATION LEVEL ROLE
MC INSTITUTIONAL
ASSESSMENT
COMMITTEE
CAMPUS
1. Fulfills a coordinating and advising role for outcomes assessment campus-wide
2. Supports communication and coordination of assessment efforts and the flow of information about assessment finding.
3. Provide training to staff and faculty members in assessment of student learning outcomes.
4. Distribute assessment instruments to Assess Learning.
5. Monitor the ongoing assessment of student academic achievement in undergraduate and graduate programs.
6. Determine congruency of assessment results with the Institution’s mission and goals.
7. Provides expertise in designing assessment activities, advising faculty and programs; and in coordinating the General Education Program assessment activities.
8. Determine database needs to support the MSCHE accreditation process.
FACULTY DEANS,
DEPARTMENT
CHAIRS/SCHOOL
DIRECTORS AND
ASSESSMENT (FACULTY)
COMMITTEE
ACADEMIC FACULTY
OR
PROGRAM
1. Encourage and support outcome assessment at all levels in the academic faculty.
2. Develop, implement, operate and manage the assessment plan within their academic programs to achieve continuous improvement of student learning
3. Facilitate program changes as designed by faculty in response to classroom and program assessment findings
4. Collect program and classroom assessment data 5. Analyze data results 6. Discuss assessment results within the program
stakeholders 7. Proceed with the corresponding actions to
improve student learning outcomes, including curricular revision

APPENDIX 1: IAUPR-METROPOLITAN CAMPUS ASSESSMENT MODEL
7
MC ASSESSMENT RESPONSABILITIES BY LEVELS
ORGANIZATION LEVEL ROLE
FACULTY MEMBERS PROGRAM AND COURSES 1. Conduct classroom assessments in order to focus in student learning
2. Incorporate instructional strategies and direct and indirect measurement methods that support improvement of student learning
3. Report at least annually the use of classroom assessment in order to share ideas and strategies with peers
4. Engage and support institutional and accreditation efforts
5. Participate in planning in conducting program assessment and then work with peers to improve program outcomes
When assessment results reveal a need for curricular revision or policy changes, a proposal to the
Academic Senate, the legislative body for program and curriculum development, is submitted for
approval.
The assessment model also supports decision making in the planning and budget processes. Assessment
results are essential for the determining budget allocation priorities. As stated by Middaugh (2010)
“…the primary objective of assessment is to produce information (note again the emphasis on
information as opposed to data) that can be used for decision-making and institutional improvement”.
Assessment Work Plan Time Table for 2010-11
The Assessment Work Plan Time Table for 2010-2011 follows.

ID Tasks Begins Ends Duration 2010 2011
Aug Sep Oct Nov Dec Jan Feb Mar Apr May Jun Jul Aug
1. Profile of Incoming Students
2.
Students by Major or Concentration
3. Training Activities by Assessment Faculty
4. Updating of Syllabi and Course Outlines
5. Profile of Professors
6. Analysis of Strategies and Educational Materials
7. Training Activities for Assessment Faculty
8. Introduction of Assessment Instruments in Courses
9. Analysis of Educational and Technological Resources
10. Analysis of Classrooms, Laboratories and Equipment
11. Evaluation of the Work Plan and the Budgeting Process
12. Analysis of the Retention and Graduation Rate
13. Analysis of the Satisfaction Level of Students, Graduates and Employers
14. Analysis of the Final Examinations


Inter American University of Puerto Rico Metropolitan Campus 2009-2010 Appendix 2 MC Assessment Plan

APPENDIX 2: IAUPR-METROPOLITAN CAMPUS ASSESSMENT PLAN
2
Inter American University of Puerto Rico Metropolitan Campus
Assessment Plan 2008-2010
MC Mission: MC offers an academic education to students from diverse cultural and national backgrounds; is geared toward the development of leaders and entrepreneurs committed to making significant contributions that comprise service, democratic values; with Christian roots and ecumenical focus.
Input MC Goal
Assessment Goal
Assessment Criteria Indicator Instrument Responsible Level
Use of Assessment
Student 1 & 2 1.0 Students will demonstrate knowledge, skills, attitudes and appreciations that represent what all students are expected to know and be able to do as candidates for graduation
1.0.1 Number/percentage of alumni reporting satisfaction with their preparation and abilities in each of the learning areas 1.0.2 Number/percentage of graduates that pass licensure or certification exams 1.0.3 Number/percentage of students that pass the, capstone seminar or the comprehensive exams
1.0.1.1 Seventy percent or more of the students surveyed every two years, state that they strongly agree or agree that they are satisfied with the academic preparation that they received 1.0.2.1 Increase in the number of success by at least 5% annually 1.0.3.1 Increase in the number of success by at least 5% annually
Student periodical satisfaction survey (every 2 yrs)
Annual Program performance reports
Program performance reports and Annual Statistical Report,
SCO & Campus Program directors and Academic Deans SCO and Program directors
Program evaluation and curricular revision

APPENDIX 2: IAUPR-METROPOLITAN CAMPUS ASSESSMENT PLAN
3
MC Mission: MC offers an academic education to students from diverse cultural and national backgrounds; is geared toward the development of leaders and entrepreneurs committed to making significant contributions that comprise service, democratic values; with Christian roots and ecumenical focus.
Input MC Goal
Assessment Goal
Assessment Criteria Indicator Instrument Responsible Level
Use of Assessment
IAUPR
Students 1&2 1.0.4 Number/percentage of students that complete academic degree within the maximum time established by the federal agencies.
1.04.1 Increase by 10 % in the number of students that complete their degree in 150% the time required
Fall Statistical Report IAUPR
SCO & Campus
Graduates (alumni)
1&2 2.0 Graduates demonstrate continuous personal and professional educational growth
2.0.1 Number/percentage of students that continue studies at the bachelors, master, doctoral or professional certificate level
2.0.1.1 70% or more of the associate degree graduates continue studies at the bachelor’s level 2.0.1.2 25% or more of the bachelor’s degree students continue studies at the graduate level 2.0.1.3 5% or more of the master’s degree level continue studies at the doctoral level 2.0.1.4 25% or more of the
Institutional graduates study report
SCO & Campus
Program revision, course syllabi evaluation

APPENDIX 2: IAUPR-METROPOLITAN CAMPUS ASSESSMENT PLAN
4
MC Mission: MC offers an academic education to students from diverse cultural and national backgrounds; is geared toward the development of leaders and entrepreneurs committed to making significant contributions that comprise service, democratic values; with Christian roots and ecumenical focus.
Input MC Goal
Assessment Goal
Assessment Criteria Indicator Instrument Responsible Level
Use of Assessment
graduates take professional development courses
Faculty 2&5 3. 0 Faculty members use diverse teaching techniques to facilitate leaning. 3.1 Faculty members use technology as a n educational resource to facilitate learning 3.2 Faculty members participate in the program curricular revision and in the preparation of new program proposals
3.0 Number/percentage of faculty members that apply diverse teaching techniques in their courses. 3.1.1 Number/percentage of faculty members that use technology as an educational resource to facilitate learning. 3.2.1 Number/percentage of faculty members that participate in program curricular revision and in the preparation of new program proposals
3.0.1.1 50% of faculty members use two or more innovative teaching techniques 3.1.1.1 85% of the syllabi have technological bibliographic references in course syllabus 3.2.1.1 At least 70% of faculty members in a program participate in the curricular revision or in the development of a proposal for the establishment of a new academic program
Campus Annual Report
Course syllabus
Academic Faculty Annual Report
Academic Deans and Dean of Studies Department/ School Directors & Academic Deans Department / Schools directors & Academic Faculty Deans
Program evaluation & improvement of the teaching and learning process

APPENDIX 2: IAUPR-METROPOLITAN CAMPUS ASSESSMENT PLAN
5
MC Mission: MC offers an academic education to students from diverse cultural and national backgrounds; is geared toward the development of leaders and entrepreneurs committed to making significant contributions that comprise service, democratic values; with Christian roots and ecumenical focus.
Input MC Goal
Assessment Goal
Assessment Criteria Indicator Instrument Responsible Level
Use of Assessment
3.2.1.2 At least 10% of the faculty members participate in the institutional curricular revisions committees.
VPAASP Report
Vice President & Dean of Studies
3.3 Faculty members participate in discipline specific research 3.4 Faculty members participate in professional development activities 3.5 Faculty members engage
3.3.1 Number/percentage of faculty members that participate in discipline specific research 3.4.1 Number/percentage of faculty members that participate in professional development activities about assessment processes, teaching and learning concepts and styles, use of technology in education 3.4.2 Retention rates 3.5.1 Number/percentage of faculty members that
3.3.1.1 At least 10% of faculty members do research in the specific discipline 3.4.1.1 At least 95% of the faculty members participates in at least two professional development activities per year 3.4.2.1 At least a 5% increase in student retention by 2008 3.5.1.1 By 2007, over 90% Full Time
Academic Faculty Report
Annual Academic Faculty Report
Institutional Statistical Report
Annual Academic
Academic program directors & Faculty Deans Academic program directors & Faculty Deans Academic program directors & Faculty Deans
Planning, faculty development and teaching/ learning process improvement

APPENDIX 2: IAUPR-METROPOLITAN CAMPUS ASSESSMENT PLAN
6
MC Mission: MC offers an academic education to students from diverse cultural and national backgrounds; is geared toward the development of leaders and entrepreneurs committed to making significant contributions that comprise service, democratic values; with Christian roots and ecumenical focus.
Input MC Goal
Assessment Goal
Assessment Criteria Indicator Instrument Responsible Level
Use of Assessment
in assessment initiatives
participate in assessment initiatives
faculty members are trained in assessment practices
Faculty report
3.6 Faculty members engage in special research projects with the students
3.6.1 Number/percentage of faculty members engaged in special projects with the students
3.6.1.1 At least 5% of faculty members present research findings at local, national, and or at international forums
Academic Faculty Annual report
Academic program directors & Faculty Deans
Planning, faculty development and teaching/ learning process improvement
Faculty & 5
3.6 Faculty members engage in special research projects with the students
3.6.2 Number/percentage of faculty members that include journal articles readings as a primary source of learning 3.6.3 Number /Percentage of faculty members teaching graduate courses that include a research project or paper as part of the course requirements
3.6.2.1 At least 70% of faculty members require students to do a literature search using the services of the Access Information Center 3.6.3.1 At least 70% of faculty members require students to locate and evaluate journal articles as a primary source of learning 3.6.3.2 At least 90% of faculty
Course syllabus and Faculty Annual Reports
Faculty member annual report and course syllabus
Faculty member
Academic directors and deans Academic directors and deans Academic directors and
Strengthening of literacy and research skills Strengthening of research and critical thinking skills Strengthening of research and critical thinking skills

APPENDIX 2: IAUPR-METROPOLITAN CAMPUS ASSESSMENT PLAN
7
MC Mission: MC offers an academic education to students from diverse cultural and national backgrounds; is geared toward the development of leaders and entrepreneurs committed to making significant contributions that comprise service, democratic values; with Christian roots and ecumenical focus.
Input MC Goal
Assessment Goal
Assessment Criteria Indicator Instrument Responsible Level
Use of Assessment
members have as a requirement for the course the development and submission of a research project or paper
annual report and course syllabus
deans

APPENDIX 2: IAUPR-METROPOLITAN CAMPUS ASSESSMENT PLAN
8
MC Mission: MC offers an academic education to students from diverse cultural and national backgrounds; is geared toward the development of leaders and entrepreneurs committed to making significant contributions that comprise service, democratic values; with Christian roots and ecumenical focus.
Input MC Goal
Assessment Goal
Assessment Criteria Indicator Instrument Responsible Level
Use of Assessment
Programs 1, 2, & 5
4.0 Academic programs are congruent with the campus mission and goals. 4.1 Academic offerings are flexible and provide diverse options to students for completion 4.2 Non traditional course offerings are available to interested students 4.3 Academic departments and faculties have established assessment plans 4.4 Academic program curricular revisions are
4.0.1 Congruency between the academic program goals with the Campus Mission and Goals 4.1.1 Percentage of students that agree or strongly agree that the program of study had options available for degree completion 4.2.1 Percentage of courses taught using nontraditional modalities 4.3.1 Percentage of programs having an assessment plan implemented systematically 4.4.1 Percent of programs that are in compliance with the
4.0.1.1 100% of the academic offerings are congruent with the Campus Mission and Goals 4.1.1.1 70% of students are satisfied 4.2.1.1 Non-traditional academic offerings of courses availability will increase at least 2% annually 4.3.1.1 By 2008 all programs will have a systematic continuous assessment plan operating. 4.4.1.1 !00% of the programs revised
Approval of program proposals by Academic Senate
Institutional Satisfaction study
Statistical Report
Assessment plans submitted to the Dean of Studies
Proposal submitted to
Academic Senate SCO SCO Academic Faculty Deans Program directors,
Program evaluation Program evaluation and strengthening Programming of courses improvement Academic Program evaluation, review and strengthening. Program improvement

APPENDIX 2: IAUPR-METROPOLITAN CAMPUS ASSESSMENT PLAN
9
MC Mission: MC offers an academic education to students from diverse cultural and national backgrounds; is geared toward the development of leaders and entrepreneurs committed to making significant contributions that comprise service, democratic values; with Christian roots and ecumenical focus.
Input MC Goal
Assessment Goal
Assessment Criteria Indicator Instrument Responsible Level
Use of Assessment
performed following the 5 year cycle
revision cycle
or are going through a revision process
academic senate
Deans and Dean of Studies
Infrastructure 10 5.0 Technological infrastructure is available in the classrooms 5.1 Bibliographical resources are available in both physical and electronic sources 5.2 Classroom facilities are appropriately equipped
5.0.1 Number/percentage of classrooms that are equipped with computers and multimedia projectors 5.1.1 Percent score in satisfaction surveys 5.2.1 Percent score in satisfaction surveys
5.0.1.1 At least a 5% annual increase of classrooms equipped with computers and multimedia projects 5.1.1.1 Under-graduate and graduate level students as well as alumni rate the services provided by the CAI with 80% or more in satisfaction survey 5.2.1.1Undergraduate and graduate level students as well as alumni rate the classroom facilities as satisfactory
Dean of Studies Annual Report
Satisfaction surveys every two years
Satisfaction surveys every two years
CAI, Dean of Studies, Dean of Academic Faculties SCO, Dean of Studies & Dean of CIFE SCO, Dean of Studies & Dean of CIFE
Strengthening learning process Strengthening student academic support services Strengthening leaning environment

Inter American University of Puerto Rico Metropolitan Campus
2009-2010
Appendix 3 Nursing Program Assessment Progress Report

2
Inter American University of Puerto Rico
Science and Technology Faculty
School of Nursing
Outcomes Assessment Report
Expected Outcomes
Evaluation of student learning demonstrates that graduates have achieved identified
competencies consistent with the institutional mission and professional standards, and that the
outcomes of the nursing education unit have been achieved.
Systematic Pan for Evaluation
The systematic plan for evaluation emphasizes the ongoing assessment and evaluation of the
student learning and program outcomes of the nursing education unit and NLNAC standards.
Outcome: Written plan for systematic program evaluation and assessment of outcomes
includes the mentioned elements.
The School of Nursing (SON) has a systematic written plan for program evaluation and
assessment of outcomes for the evaluation of the nursing programs. The plan includes the
NLNAC required criteria;
1. A written plan
2. Components that are evaluated
3. Expected level of achievement
4. Frecuency of Assessment
5. Assessment Methods
6. Implementation (results and actions)
The SON has an independent, specific, ongoing evaluation plan, organized as per
NLNAC standards and criteria. Table 1 shows the Systematic Plan for Program Evaluation for

3
ADN and BSN Tracks – 2005-2011. The evaluation plan was updated in 2008, according to
new NLNAC standards and criteria. Data was collected and analyzed by the SON which
maintains evidence on file (faculty meeting records, director evaluation reports, presentations in
faculty development forums, and others).
Findings from those evaluations are utilized for curricular changes, revisions, program
development and improvement, faculty development, decision-making, resource allocation, and
strategic plan.

4
Table 1. Systematic Plan for Program Evaluation
SYSTEMATIC PLAN FOR PROGRAM EVALUATION
STANDARD 1, MISSION AND ADMINISTRATIVE CAPACITY: The Nursing Education Units mission reflects the governing organizations core values and
is congruent with its strategic goals and objectives. The governing organization and program have administrative capacity resulting in effective delivery of the
nursing program and achievement of identified outcomes.
PLAN IMPLEMENTATION
Component
Expected Level of
Achievement
Frequency of
Assessment
Assessment Method Results of Data
and Analysis
Actions for Program
Development
Mission and
governance
The SON mission
and governance
reflects congruency
with the mission,
goals and objectives
of IAUPR and MC.
Every 5 years Comparative analysis of Institutional documents Results
demonstrate
congruency in
most aspects.
SON mission will be
revised to include
concepts such as
entrepreneurship,
leadership and
internationalization,
among others.
SON and the
organization
Faculty,
administrators and
students participate
in IAUPR and SON
governance.
Annually Evaluation of faculty meeting minutes
Faculty and student participation in committees
and in the Academic Senate
SON Director participation in Chancellor’s
Strategic Council
Faculty participation in special projects at SON,
campus and institutional level
Data show that
faculty,
administrators,
and students
participate at all
levels of decision
making
Administrative staff
and faculty will be
encouraged to
continue
participation in
governance bodies
Students will be
invited and
encouraged to
participate
Communities of
interest
At least 70 % of
clinical practice
agencies directors,
professional
organizations,
alumni, employers,
nursing supervisors,
provide input in
Annually Evaluation of attendance to meetings of
community interests representatives, employers
survey participation
61% of clinical
practice
representatives
participated in
meetings
50% of the
clinical agencies
The clinical
coordinator is
having weekly
meetings with the
clinical agency
representatives
Invitation to the next

5
SYSTEMATIC PLAN FOR PROGRAM EVALUATION
STANDARD 1, MISSION AND ADMINISTRATIVE CAPACITY: The Nursing Education Units mission reflects the governing organizations core values and
is congruent with its strategic goals and objectives. The governing organization and program have administrative capacity resulting in effective delivery of the
nursing program and achievement of identified outcomes.
PLAN IMPLEMENTATION
SON program
processes and
decision making
that employ
graduates
answered the
employers survey
meeting will include
the agenda and
activities to be held
and follow up calls
will be made by the
clinical coordinator
SYSTEMATIC PLAN FOR PROGRAM EVALUATION
STANDARD 2, FACULTY AND STAFF: Qualified faculty and staff provide leadership and support necessary to attain the goals and outcomes of the nursing
education unit.
PLAN IMPLEMENTATION
Component
Expected Level of
Achievement
Frequency of
Assessment
Assessment Method Results of Data and
Analysis
Actions for Program
Development
Faculty credentials 100% of faculty hold
at least an MSN and
are updated in their
areas of academic
responsibilities
At least 75% of the
Annually Analysis of faculty annual reports and
evaluation instruments
All of the faculty
members have at
least an MSN degree,
3 hold doctoral
degrees, and 3 faculty
members are
pursuing PhD.
100% of the faculty
members report
participating in
professional
development
activities.
75% of faculty
members are active in
scholarly activities
Continue providing
support to members
of the faculty
pursuing the doctoral
degree, stimulating
others to pursue a
higher level degree,
and providing
support for
professional
development.
Faculty members will
be required to engage

6
SYSTEMATIC PLAN FOR PROGRAM EVALUATION
STANDARD 2, FACULTY AND STAFF: Qualified faculty and staff provide leadership and support necessary to attain the goals and outcomes of the nursing
education unit.
PLAN IMPLEMENTATION
faculty members
evidence scholarly
activity.
such as, evidenced-
based practices.
in scholarly activities.
Number and
utilization of faculty
Faculty/student ratio in
classrooms and
clinical practices
provide adequate
teaching supervision
and evaluation in the
ADN and BSN tracks
Annually Evaluation of course enrollment reports Faculty/student ratios
for the BSN lecture
courses is 1:36. For
ADN
courses is 1:38.
Faculty/student ratio
for the ADN clinical
practice courses is
1:9.
For BSN clinical
practice
courses is1:9.
These ratios are
within the
institutional
parameters.
Maintain the
faculty/student ratios
in compliance with
institutional policies.
Number and
utilization of faculty
Faculty/student ratio in
classrooms and
clinical practices
provide adequate
teaching supervision
and evaluation in the
ADN and BSN tracks
Annually Evaluation of course enrollment reports Faculty/student ratios
for the BSN lecture
courses is 1:36. For
ADN
courses is 1:38.
Faculty/student ratio
for the ADN clinical
practice courses is
1:9.
For BSN clinical
practice
courses is1:9.
Maintain the
faculty/student ratios
in compliance with
institutional policies.

7
SYSTEMATIC PLAN FOR PROGRAM EVALUATION
STANDARD 2, FACULTY AND STAFF: Qualified faculty and staff provide leadership and support necessary to attain the goals and outcomes of the nursing
education unit.
PLAN IMPLEMENTATION
These ratios are
within the
institutional
parameters.
Staff qualifications 100% of non-nurse
faculty and staff are
appropriately
credentialed.
Annually Evaluation of personnel evaluation
instruments
100% non-nurse
faculty and staff
members hold the
required credentials
and are sufficient for
the operation of the
SON.
Maintain non-nurse
faculty and staff
qualifications.

8
SYSTEMATIC PLAN FOR PROGRAM EVALUATION
STANDARD 3, STUDENTS: Student policies, development and services support the goals and outcomes of the SON
PLAN IMPLEMENTATION
Component
Expected Level of
Achievement
Frequency of
Assessment
Assessment Method Results of Data and
Analysis
Actions for Program
Development
1. Student policies SON student policies
are congruent with
those of the institution,
publicly accessible,
nondiscriminatory,
and consistently
applied.
Annually Analysis of students’ incident reports,
faculty feedback, staff periodical reports.
100% of the students’
complaints and
concerns have been
resolved. There has
been no need for
establishing new
policies.
Maintain follow up
procedures.
2. Support
services
Student have access to
support services,
which are
commensurate with
their needs
At the end of
each term
SON Satisfaction Surveys (Tutoring,
clinical practice agencies, admission
processes)
100% satisfaction
with clinical practice
courses and clinical
practice agencies.
100% satisfaction
with the curricular
integration of the
science content to the
nursing courses.
80% of the students
are satisfied with the
SON infrastructure
Results of the 2009-
10 survey are under
evaluation. The
Maintain the
agreements with the
clinical practice
agencies and continue
offering the support
services
SON facilities have
been remodeled since
last visit. The
Renovation Plan was
divided into three
phases. Phase three
will be completed by
the end of this
academic year.
Institutional efforts

9
Biennially
Institutional Satisfaction Survey
results are not
available at the
program level.
are being directed
toward the
segregation of student
population by
program.
3. Integrity and
consistency of
SON
information
All information about
the SON intended to
inform the general
public has integrity
and consistency.
Every two years Evaluation of IAUPR publications,
including the General Catalog, brochures,
graduate performance in licensure exams,
accreditation status, and public notices.
Graduate
performance in
licensure exams have
been published in the
MC Webpage under
the SON section.
General Catalog was
revised to include the
accreditation status of
SON programs.
Accreditation (ADN)
and reaccreditation
(BSN) status will be
updated in
IAUPR/MC
publications,
according to the
NLNAC
determinations.
Technology
availability to
students
Orientation to
technology is provided
and technological
support is available to
students.
At the
beginning of
each academic
year.
Evaluation of the admissions protocol and
student satisfaction surveys with the
services provided.
100% of students
received the
orientation about
technology as part of
the admissions
protocol, ATI
(initiated in 2007)
and through the
Information Literacy
Course (GEIC 1000),
which includes an
orientation to the
Blackboard Platform
and to the UNICORN
Library Information
System.
Include ATI in the
Assessment Plan.

10
SYSTEMATIC PLAN FOR PROGRAM EVALUATION
STANDARD 4, CURRICULUM: The curriculum prepares students to achieve the outcomes of the nursing education unit, including safe practice in
contemporary healthcare environments.
PLAN IMPLEMENTATION
Component
Expected Level of
Achievement
Frequency of
Assessment
Assessment Method Results of Data and
Analysis
Actions for
Program
Development
Curricular design
and revision
The curriculum
incorporates the
established
professional
standards, guidance
and competencies,
and has clearly
articulated student
learning and
program outcomes.
Annually Evaluation of course syllabi, course mapping
with professional competencies and standards.
!00% of syllabi have
been revised and
professional
competencies and
standards are
addressed. Student
learning outcomes
are included in the
corresponding
syllabi.
Course syllabi will
be revised and
updated annually.
Learning outcomes At least 80% of
SON graduates
demonstrate
proficiency in the
nursing process,
humanistic care,
wellness/illness,
communication,
research, leadership
and management.
At the end of
the second
(ADN) and at
the third level
(BSN).
Annually
Every three
years
Evaluation of SON student learning outcomes
using various instruments:
-curriculum assessment by student (initiated in
2009)
-competency satisfaction survey
-graduate performance in licensure exams
-alumni and employers questionnaires.
See Table 32 –
Curriculum
assessment
See Tables 61 and
62
Performance in
licensure exam
scores have
improved after the
SON implemented
an action plan.
See Figure 1 & 2
In 2009, 80% of the
alumni expressed
that in general the
SON helped them to
accomplish the

11
SYSTEMATIC PLAN FOR PROGRAM EVALUATION
STANDARD 4, CURRICULUM: The curriculum prepares students to achieve the outcomes of the nursing education unit, including safe practice in
contemporary healthcare environments.
PLAN IMPLEMENTATION
professional nursing
competencies.
Since 2005, the
following concepts
were incorporated
into the curriculum:
-Patient safety goals
were grouped and a
guideline was
developed
-TeamStepps,
-Evidence based
practice
-Culture sensitivity
-Integrated science
content educational
technology
-Electronic records
-Interdisciplinary
collaboration
Diversity and global
dimension
SON students
demonstrate global
awareness of
political, social,
cultural and
environmental
issues that influence
health care, health
policies and the
nursing profession
Every two years Course syllabi assessment, Campinha-Bacote
questionnaire (assessment of cultural and social
sensitivity), Student Satisfaction questionnaire for
international students
Evaluation of syllabi
to validate the
incorporation of
diversity and global
dimension
Identification of
SON baseline in
Campinha-Bacote
questionnaire
Evaluation Methods Evaluation
methodologies
measure the
Every trimester Comparative analysis of outcomes according
questionnaire about ADN and BSN competencies
Students master the
competencies
Faculty
development plan
according to new

12
SYSTEMATIC PLAN FOR PROGRAM EVALUATION
STANDARD 4, CURRICULUM: The curriculum prepares students to achieve the outcomes of the nursing education unit, including safe practice in
contemporary healthcare environments.
PLAN IMPLEMENTATION
achievement of
student learning
strategies to deal
with students
deficiencies and
new ways of
delivery of
instruction
Education theory,
interdisciplinary
collaboration and
best practice
standards
Curriculum and
instructional
processes reflect
theory and best
practice standards
Every two years Analysis and application of interdisciplinary and
collaborative processes; comparative analysis of
syllabi
Integration of
evaluation
methodologies in
the clinical courses;
Students
demonstrate mastery
of competencies
Faculty
development plan
to incorporate best
practices in
clinical courses;
revision of course
syllabi and
assessment
instruments
Program length Students obtain their
degree within the
timeframe of the
program
Annually Retention and graduation rates ADN and BSN;
percentage of students who complete their
degrees in the established timeframe
Validation of
calendars and
curricular plans
Curricular
revision of plans
and calendars
Practice learning
environment
The environment is
appropriate for
student learning
Each trimester Student, faculty, and administrators evaluation of
clinical agencies
Student satisfaction,
support provided by
the agencies;
clinical agency
environment
Non-renewal and
substitution of
clinical agencies
SYSTEMATIC PROGRAM EVALUATION
STANDARD 5, RESOURCES: Fiscal, physical, and learning resources promote the achievement of the goals and outcomes of the Nursing education unit.
PLAN IMPLEMENTATION
Component
Expected Level of
Achievement
Frequency of
Assessment
Assessment Method Results of Data and
Analysis
Actions for
Program
Development
Fiscal resources Adequate to support
the SON outcomes
Annually Evaluation, planning, and budget processes Cost analysis,
unattended needs,
projected need and
Annual work plan
and budget
petitions, budget

13
outcomes amendments, and
supplementary
resources
Physical resources
and technology
Sufficient
technology, and
physical facilities to
meet SON outcomes
Annually Regular inspections and satisfaction
questionnaires
Recommendations
to MC Strategic
Plan, SON annual
work plan and
budget
Renovations,
update of
technological
infrastructure
Learning resources Comprehensive,
current, and
accessible to faculty
and students
Annually Satisfaction questionnaires, library committee
reports, use of learning resources
Recommendations
to library for
acquisition and
substitution of
learning resource
Acquisition and
updating of
resources,
information
literacy trainings

14
Aggregated Evaluation Findings
Aggregated evaluation findings inform program decision-making and are used to maintain or
improve student learning outcomes.
Outcome: Evaluation finding are used for decision-making
The SON has been utilizing the aggregated evaluation findings for decision-making. The
following areas have been evaluated, utilizing SON systematic assessment plan:
AREAS STRATEGIES
Integrated Sciences •Questionnaire and Concept Mapping Analysis
Pharmacology • Concept Mapping Analysis
Standardized language (NIC) •Compilation
Patient safety standards •Checklist
Knowledge competencies •ATI and Tutoring
Culture sensitivity •Concept Mapping Analysis
Results of student satisfaction with Integrated Sciences is provided in Table 60.
Table 2. Student Satisfaction with Integrated Sciences
Criteria A B C D E Comments
The knowledge of natural science in the courses prepares me
for the content in nursing.
X
A=100% Strongly agree
I am satisfied with the teaching of the integrated science in
the nursing curriculum.
X
A=100% Strongly agree
The science content is included in appropriate related
textbooks.
X
A=100% Strongly agree
I understand the science content taught. X A=100% Strongly agree
I am able to apply the science content to the nursing courses.
X
A=100% Strongly agree
The teaching of the Sciences is given in a clear and organized
manner and is related to the nursing courses.
X
A=100% Strongly agree
I was taught:
Anatomy
X
A=100% Strongly agree
Physiology X A=100% Strongly agree
Microbiology X A=100% Strongly agree
Chemistry X A=100% Strongly agree
This content was taught in a manner from the most simple to
the most complex.
X
A=100% Strongly agree
I could apply the basic science content learned to
pathophysiology.
X
A=100% Strongly agree
Note: Results from 2nd
level students; 56% female; Spanish trimester

15
Syllabi have been updated with trended data analyzed in faculty meetings. An action plan
has been implemented to improve the competencies of the students learning outcomes. All
faculty members have integrated concepts and strategies according to assessment outcomes.
The student satisfaction questionnaire included an open ended question: “What would
you improve in relation to the integration of sciences content in the nursing courses?” Some
students responded to this question as follows:
1. “Utilize one day for sciences and another day for nursing (pathophysiology and
nursing interventions).”
2. “Having one teacher for both sections is best.”
3. “Each system was taught, and then the nursing component is applied. Excellent!”
Other students suggested that science content needed more integration.
These answers were discussed in faculty meetings and decisions were made regarding the
students’ recommendations. The following decisions were taken to address these
recommendations.
1. Nursing professors that teach sciences need availability the same days as other
professors, in order to offer continuity to topics of both components. (See Minutes
Dec. 2008).
2. Meeting October 5, 2009: The Adult Care I and Adult Care II faculty created tables
where the science content is distributed and integrated into the nursing content (see
Minutes October 5, 2009). Tables were prepared, discussed, and integrated into the
courses.
3. The professors for sciences in core courses must be Nurses according to a faculty
decision. (See Faculty Minutes.)

16
Evaluation Findings and Communities of Interest
Evaluation findings are shared with communities of interest.
Outcome: Faculty, students and administrator are regularly informed of evaluation
findings.
Evaluation findings are shared with communities of interest by meetings with students,
faculty, clinical practice agencies; by the webpage, and written reports in a timely manner.
These findings are also discussed with both part-time and full-time faculty members regularly
scheduled meetings.
The nursing faculty gets input or feedback for curriculum updating or development from
different sources, such as: in-service staff, clinical practice agencies, professional development,
student evaluations, new trends in healthcare services, and assessment tools.
Various discussions related to evaluation findings are held with other departments and
other nursing programs of IAUPR. Trended data obtained in assessment is discussed with the
agencies where students practice. Part-time and full time faculty members are oriented through
in-service development activities related to areas of improvement according to the assessment
program.
Presentations about the SON assessment program are done in various communities of
interest at different universities levels and in others agencies. Dr. Áurea Ayala presented
changes made and trended data on PowerPoint presentations or videos to communities of
interest.

17
Graduates Achievement of Competencies
Graduates demonstrate achievement of competencies appropriate to role preparation.
Outcome: SON outcome assessment plan include competencies in role preparation.
A questionnaire about nursing competency performance in the ADN and BSN tracks is
administered periodically as part of SON assessment. Tables 61 and 62 present results obtained
in one of 2007 administration.
Table 3. ADN Competencies Achievement Results (2007)
COMPETENCIES
CO
MP
LE
TE
LY
AG
RE
E
AG
RE
E
PA
RT
IAL
LY
DIS
AG
RE
E
N/A
You feel capable of applying theoretical knowledge and clinical practice in
the discipline of nursing when government analyzes the biosocial,
psychological, and spiritual being in different growth and development
stages.
87%
12%
---
---
You can demonstrate updated skills in the therapeutic nursing interventions
when you offer care along sickness and health scenarios (utilizing evidence
based).
87%
12%
---
---
You can utilize the nursing care process as an instrument to make decisions
and at the same time demonstrate critical thinking skills when you offer
safety care with quality and with lower costs.
87%
11%
---
---
You can demonstrate responsibilities and legal commitment to humanistic
care in response to changes in society.
89%
11%
---
---
You can demonstrate management of care and effective skills in collaboration
with the interdisciplinary team and improve healthcare constantly.
89%
11%
---
---
You can demonstrate responsibility and commitment to the discipline of
nursing.
57% 22% --- ---
You can utilize communication skills and the technology to maintain the
nursing care that is offered to the client and improve self knowledge.
87%
22%
---
---
You feel capable of passing the nursing board exam. 55%
33%

18
Table 4. BSN Competencies Achievement Results (2007)
COMPETENCIES
CO
MP
LE
TE
LY
AG
RE
E
AG
RE
E
PA
RT
IAL
LY
DIS
AG
RE
E
N/A
You feel capable of integrating your knowledge to provide safe and effective
nursing care to the clients, families, and communities.
71%
29%
---
---
You feel capable of providing nursing interventions to prevent disease and
promote, maintain, and restore health.
33%
52%
.09%
---
You feel capable of performing assessment and interventions when you provide
nursing care in diverse scenarios, in order to improve the expected outcomes in
health care.
28%
66%
.04%
---
You feel capable of providing holistic care in the nursing practice to protect,
optimize, and preserve human dignity utilizing evidence based.
28%
66%
---
---
You feel capable of assuming effective leadership as a care manager while
establishing balance within the available health care resources.
57%
38%
.04%
---
You feel capable of integrating critical thinking skills when making clinical
decisions and using research findings to continue and improve the nursing
practice.
57%
43%
.04%
---
You feel capable of communicating effectively to optimize your performance as a
provider and coordinator of care, and as a member of the profession.
57%
33%
---
---
You feel capable of passing the nursing board exam for the BSN. 57% 24% .09% ---
In addition to the students’ questionnaire, the SON implemented the following activities
to assess appropriate knowledge and skills:
1. Extensive evaluations by faculty in each clinical practice.
2. Utilization of simulators for practice in laboratories.
3. Skills evaluated on a one-to-one basis retro feedback from faculty (guides provided in
each clinical course).
4. ATI – Online assessment monitoring.
5. Reviews for the Board exams.

19
Evidence of Achievement of Program Outcomes
The program demonstrates evidence of achievement in meeting the following program
outcomes: performance on licensure exam; program completion; program satisfaction; and job
placement.
Outcome: The SON evaluation plan demonstrates how and to what extent the program is
attaining the outcomes.
The SON specific outcomes are:
• Seventy percent (70%) of the ADN and BSN graduates who take the Puerto Rico Nurse
Licensure Examination will pass the exam the first time.
• Ninety percent (90%) of the ADN track students will graduate in less than two (2) years.
• Ninety percent (90%) of the BSN track students will graduate in less than four (4) years.
• Ninety percent (90%) of the ADN and BSN students will be satisfied with the program.
• Ninety percent (90%) of the ADN and BSN graduates who seek employment will be
employed in a nursing position within six (6) months after graduation.
Tables 63 and 64 provide evidence of achievement of the SON outcomes for the ADN or
BSN tracks. Both tables present SON program outcomes, expected level of achievement, actual
level of achievement and resulting actions taken and the corresponding time frame.

20
Table 5. Summary - ADN’s Track Outcomes
Required Program
Outcomes
Expected Level of Achievement
Actual Level of Achievement
Resulting Actions Taken Time Frame for
Implementation
Actions Time Frame
1. Performance on ADN
Licensure Examination
Seventy percent (70%) of the
graduates who take the PR ADN
Nurse Licensure Examination will
pass the exam the first time.
By 2008-2009 fifty percent
(50%) of the graduates who
took the PR ADN Board Exam
passed the first time.
See Strategic Plan to increase passing
rate
Review test offered by August 2010.
(Diagnostic test)
Final ATI exam will have a proctor
assigned. Professor Yolanda Torres has
been assigned to this project.
Professor Alice Santiago is assigned to
follow-up on students who are going to
take the NCLEX.
All students must take review tests with
the ATI, according to the plan.
Self-tutorials must be completed in
each course.
August 2010
August 2010
August 2010
August 2010
August 2010

21
Required Program
Outcomes
Expected Level of Achievement
Actual Level of Achievement
Resulting Actions Taken Time Frame for
Implementation
Actions Time Frame
2. Program Completion Ninety percent (90%) of the ADN
track students will graduate in less
than two (2) years.
Ninety percent (90%) of the students
will complete the ADN program in the
required time.
By 2009, one hundred percent
(100%) of the ADN track
students will graduate 1.6 years
(18 months). This represents
five (5) trimesters.
The SON is utilizing the trimester
calendar.
The trimester calendar has been
extremely successful with an
enrollment that has increased from 150
to 500 hundred in the last two years.
The Metropolitan Campus is the first
campus to implement the trimester
calendar in all of the faculties. The MC
considered the trimester calendar as the
standard for the academic offering.
Every Year
3. Program
Satisfaction
Ninety percent (90%) of the students
will express satisfaction with the SON,
the clinical and theory courses, the
sciences and physical facilities.
One-hundred percent (100%) of
the graduates expressed
satisfaction with the SON, with
the curriculum, and with
integrated sciences.
Eighty (80) percent of the
graduates expressed satisfaction
with the SON.
Continue with the systematic
assessment during the academic year.
a. Satisfaction with clinical agencies.
b. Satisfaction with clinical courses.
c. Satisfaction with infra-structure
(physical facilities).
* Our alumni express satisfaction with
the SON.
Focal groups to identify satisfaction
with the curriculum (students from
different levels) and with physical
facilities.
August-
October 2010
August to
September2010
4. Job Placement Ninety percent (90%) of the graduates
who seek employment will be
employed in a nursing position within
six (6) months of graduation.
Sixty-seven percent (67%) of
the graduates were employed in
a nursing position immediately
after they finished the ADN
Continue with job placement practices.
Annually

22
Required Program
Outcomes
Expected Level of Achievement
Actual Level of Achievement
Resulting Actions Taken Time Frame for
Implementation
Actions Time Frame
track.
Thirty three percent (33%) of
the graduates were employed in
a nursing position within six (6)
months after graduation.
One- hundred percent (100%) of
ADN graduates are employed in
a nursing position within six (6)
months of graduation.
Continue evaluating and updating the
curriculum in order to respond to health
care systems and society needs.

23
Table 6. Summary – BSN Track Outcomes
Required Program
Outcomes
Expected Level of Achievement
Actual Level of Achievement
Resulting Actions Taken Time Frame for
Implementation
Actions Time Frame
1. Performance on BSN
Licensure Examination
Seventy percent (70%) of the
graduates who take the PR BSN
Licensure Examination will pass the
exam the first time.
Seventy-four percent (74%) of
the graduates who took PR
BSN Board Exam passed it the
first time (40 students).
Review test offered by August
2010.
An ATI Proctor exam must be
monitored. Prof. Yolanda Torres
has been assigned to this project.
Professor Alice Santiago is assigned
to follow up students who are going
to take the NCLEX.
All students must take review tests
(ATI).
Self-tutorials must be completed in
each course.
Annually
2. Program Completion Ninety percent (90%) of the students
in the BSN track will graduate in less
than four (4) years.
For years 2009 and 2010 one
hundred percent (100%) of the
students of the BSN track had
graduated in three (3) years.
The SON is currently following a
curricular plan that is completed in
three (3) years, in a trimester
calendar.
Annually
3. Program Satisfaction Ninety percent (90%) of the students
and alumni will express satisfaction
with the SON’s program.
Ninety percent (90%) of the
students expressed satisfaction
with clinical agencies.
Ninety percent (90%) of the
students expressed satisfaction
with clinical courses.
Letters of appreciation to all the
hospitals and agencies.
Annually

24
Eighty percent (80%) of the students
will express satisfaction with
physical facilities.
Eighty percent (80%) of the
alumni express that, in general,
the SON helped them
accomplish the academic
competencies.
Twenty percent (20%) of the
students expressed the need to
renovate infrastructure.
Continuity of the systematic
assessment during the academic
year.
Focal groups to identify satisfaction
with the curriculum.
Remodeling of the School in three
phases.
Three phases in
the remodeling:
-The front of
the School
(August’08)
-The back of
the School
(May’10)
-The front of
the School
(May 2011)
4. Job Placement Ninety percent (90%) of the
graduates who seek employment will
be employed in a nursing position
within six (6) months after
graduation.
Seventy one percent (71%) of
the graduates were employed
in a nursing position
immediately after they ended
the BSN track.
Twenty eight percent (28%) of
the graduates were employed
in a nursing position within six
(6) months after they ended the
BSN track.
Ninety-nine percent of both
levels completed the track,
which is over the expected
level of achievement.
Continue with job placement
practices.
Continue evaluating and updating
the curriculum in order to respond
to health care systems and society
needs.
Annually

25
Licensure/Certification Pass Rates
Outcome: At least 70% of the SON graduates will approve the Puerto Rico State
Licensure (JEPSPR) Board Exam. (ADN and BSN)
Efforts have been made to receive official results from NCLEX. However, the situation
between the National Council and the Puerto Rico status need to be resolved. Nevertheless, the
SON has information of alumni who have taken and passed the NCLEX.
The JEPSPR board exam is offered to both ADN and BSN graduates. Since 2007, this
exam is computerized and is offered to students several times a year in different locations.
Compared to the overall passing rate for the JEPSPR exam, SON graduates perform above the
national mean. However, there is a general concern among all nursing schools in Puerto Rico
regarding the structure and content of these exams.
Figures 1 and 2 show ADN and BSN JEPSPR exam results, which are published in MC
Webpage.

26
Figure 1. ADN JEPSPR Exam results
Figure 2. BSN JEPSPR Exams Results

27
Nursing board results and actions taken
There was a significant increase in the JEPSPR exam passing rate for the BSN in 2009
administration while Puerto Rico mean significantly decreased. The SON is positioned over the
Puerto Rico’s mean in all administrations. The SON surpassed the expected outcome of 70%
passing rate.
ADN graduates passing rate have been 50% or more in the JEPSPR exam and above
Puerto Rico mean for all years except 2007. SON has given special attention to this situation and
actively participates in a Puerto Rico-wide committee to address this with the Board. The leader
of this committee is Luz Virginia Camacho, the current President of the Colegio de Profesionales
de Enfermería de Puerto Rico. The SON Director, a member of this committee, is preparing a
plan that involves government officials in the issue. Meanwhile, a systematic plan to increase
ADN passing rates is currently operating, as shown in Table 65.

28
Table 7. Strategic Plan to Increase the Board Exam Passing-Rate ADN & BSN Track Graduates
Outcome: Increase the passing rate by 5% within a five year period.
Objective Dates Strategy Resources Factors to consider Performance indicators
Offer practice test to students
2007 -
2010
Faculty development in the
following areas: effective test
preparation, standardized
specification tables, test
validity and reliability,
student profile (high risk),
item integration in exams
Dr. Luis Allen
Ryan
Dr. Larry
Simmons
Professors must continue
developing competencies in:
Test construction
Use of standardized
specifications table
Student profile: Generation
Y, X, Millennium, Baby
Boomers, Silver Strikers,
and others.
Faculty development
1. Student profile
2.Test construction
Professors participated in
faculty development courses
related to the standardize
specification table.
Professors are applying these
concepts.
Students exams are well
constructed (faculty evaluation
by students).
Provide student support
2007-
2010
2010
Programmatic Assessment
based on ADN and BSN
competencies,
ATI monitor exams, tutoring,
Offer Board exams review
every year.
Curriculum Assessment:
Integrated Workshop and
Critical Thinking Appraisal
(authorized by Amparo
Lefebvre)
Professors
ATI
Professors and
Lab Coordinator
Tutors
Recommendation
of the Saunders
Board review
Book
ADN & BSN Competency
Assessment at levels II and
IV
Evaluation of the workshop
to include topics of interest
according of new advances.
A student must be honest
doing their critical thinking
appraisal.
Increasing passing rate Board
exam since 2006
Revision of NURS 4980-
Integrated Workshop by
August –October 2010 (2011-
13)
Students must practice
regularly with ATI
(Comprehensive test)

29
Outcome: Increase the passing rate by 5% within a five year period.
Objective Dates Strategy Resources Factors to consider Performance indicators
1. Mentorship to
students
2. Reviews
3. Meetings with
the Board
Exam
members.
4. Meeting with
de CPEPR
(in Spanish)
5. Education
activities with
educators in
PR
A review workshop is offered
every year in summer.
Attendance is poor.
Interact with JEPSPR members
2009
2010
2006-
2010
2002-
2010
Participation in appropriate
committees
Professors
Professors
Students
Professors
Nursing School
Director
Agency disposition to invite
the SON
Depends on economic
viability
Revision of ADN exams
1. First conference – 32
educators attended
2. Second conference – 66
educators attended

30
Expected Levels of Achievement for Program Completion
Expected levels of achievement for program completion are determined by the faculty and reflect
program demographics, academic progression, and program history.
Outcome: The expected levels of achievement for program completion are determined by the
faculty.
The SON defines completion/graduation rates as the number of students who entered the
Nursing Program in a given time and completed the nursing and general educational courses and
graduated, divided by the number of years it took the students to finish the degree.
The data for program completion is calculated every year. Table 8 ADN track
completion reflects the demographics, for this track. Since 2007, more students have obtained
the certification for the ADN, and they have filled out the application for the Board Exam.
Students wanted to work as a nurse while pursuing the BSN track.
Table 8. ADN Track Completion
Year
Number
of
students
Sex
Percent Total
Population
( Both Track)
GPA
Years
F M
2007 28 24
86%
4
14%
10% 3.34 2.4
2008 38 27
71%
11
29%
14% 3.33 2.1
2009 56 38
68%
18
32%
12% 3.2 1.6
2010 81 46
57%
35
43%
17% -- --
The data for the BSN Track Program Completion is calculated every year. Table 9 BSN
Track Completion reflects the demographics for this track.

31
Table 9. BSN Track completion
Year
Number
of
students
Sex
Percent Total
Population
( Both
Trajectories)
GPA
Years
F M
2007 78 56
72%
22
28%
30% 2.98 2
2008 93 68
73%
25
27%
35% 3.33 2.1
2009 93 60
65%
33
35%
20% 3.23 3.1
2010 114 114
65%
40
35%
24% -- --
The faculty discussed the assessment results on a daily basis to determine how to improve
every aspect of the SON. The faculty and staff aim to excellence in nursing education. Faculty
recognizes that ADN and BSN students must demonstrate the competencies in providing a safe,
effective, efficient, timely, and equitable care, while pursuing the IOM’s quality goals. The
achievements of these competencies have improved the care that is provided by SON graduates.
The SON has been using the trimester calendar since 2005 for both Spanish and English
tracks. Prior to this, enrollment was decreasing. With the adoption of the trimester calendar,
student satisfaction increased as well as retention. Furthermore, since 2006 SON enrollment and
average section size have been increasing. Figure 4 shows SON enrollment in the last four years.
The SON has had the ADN as an exit option since 2001. However, students usually
continue in the BSN track, the option accredited by the NLNAC (See Tables 10 and 11 for
Retention Cohort for ADN and BSN, respectively). The number of ADN students increased last
year 2009 as shown in Figure 5; and the number of BSN students has steadily increased since
2007 as shown in Figure 6. In 2008 the faculty determined to accredit the ADN by NLNAC and
the candidacy was submitted and approved in 2009.

32
Figure 3. SON Enrollment 2007-2010
Table 10. Retention Cohort for ADN
Cohort
Base
Retention
Transfers to Other
Programs
2006 11 7(64%) 0%
2007 12 8(67%) 0%
2008 13 6(46%) 0%
Table 11. Retention Cohort for BSN
Cohort
Base
Retention
Transfers To Other
Programs
2006 50 39(78%) 0%
2007 55 39(71%) 4%
2008 95 64(47%) 5%
255
349
448
617
0
100
200
300
400
500
600
700
2007 2008 2009 2010
SON NURSING STUDENTS 2007 to 2010

33
Figure 4. Nursing Student ADN Track 2007-2010
Figure 5. BSN Nursing Student Enrollment
The SON is working to improve retention in the ADN and BSN tracks. Accordingly, the
SON has implemented a retention plan outlined in Table 12. Attrition at MC is mostly a result
of economic or health concerns and it is usually a stop-out rather than a drop-out phenomenon.
In 2009, the SON made a phone survey among non-returning students from the ADN and BSN
tracks. ADN students cited the following situations among others:
2935 34
62
0
10
20
30
40
50
60
70
2007 2008 2009 2010
ADN STUDENT TRACK
226
314
414
555
0
100
200
300
400
500
600
2007 2008 2009 2010
BSN STUDENTS TRACK 2007 to 2010

34
1. “I moved to the USA.”
2. “Financial problems.” “I have to support my family”.
3. “Army training”
4. “It is difficult to travel”.
5. “I have an illness.”
Some of the causes for attrition in the BSN track were:
1. “I can work with an ADN.”
2. “I am going to study when I resolve my financial situation.”
3. “I moved to a place far away from the school.”
4. “I did not pass the first block in the BSN track.”
Table 12 presents the retention plan activities, expected outcomes, and dates.

35
Table 12. Retention Plan for the Nursing School 2006-2010
Objectives Expected Outcome Activities Person In
Charge
Date Action Taken
To offer quality services,
academic advising, and
professional counseling.
Establishment of a
preventive and a proactive
program for retention with
80% effectiveness.
Increase first-year student
retention to 70% in ADN and
BSN tracks
Preparation of a workshop for new students.
Clarification of differences between
university and high school preparation.
Analysis of student profiles
Special activities for other aspects related to
the teaching-learning process.
Help students to get uniforms, health
certificate, immunizations, books, and
others.
Assign mentors to help new students in their
transition to university life.
Establish an alert system for students at risk,
students who work, single female students
who are head of household, students with
economic constraints, students with limited
social integration, and students with
personal challenges.
Faculty,
Director,
and
Associate
Director
Annually
Evaluation and
revision of
retention
activities.
Protocol for the
admission of new
students.
Assessment of
the admissions
process.
Mentoring
services by:
Students
Lab coordinators
ATI Program
To enroll students in a
friendly and efficient
manner
The faculty will facilitate
adequate academic advising
and mentoring.
Programmatic assessment; Comprehensive
activities for the development of the student
competencies; academic advising; attention
to students with special needs.
Faculty in-service training related to
students with special characteristics and
conflict resolution.
Faculty and
Staff
Annually
Students assigned
to faculty
meeting
(curriculum and
assessment)
Video by
students
(Transmitted by
YouTube)

36
Objectives Expected Outcome Activities Person In
Charge
Date Action Taken
To train faculty members
in addressing student needs
related to caring attitudes
and best practices.
Faculty members will be
prepared to provide quality
student support services
Tutor development, mentoring student
association, participation in student
association activities, support student
association by providing physical and
logistical support, student participation in
faculty meetings, modeling SON values and
best practices.
Faculty and
Staff
Annually
Students assigned
to faculty
meeting
List of academic
advisees per
faculty members

37
Table 13. SON Values and Actions that Promote Retention
Psychological Support Performance Actions
Care
Comprehension
Positive approach
Inspire
Demonstrate interest in students
Realistic expectations
Listen to students
Respect and confidentiality
No judgment
Honest and discreet communication
Flexible to different points of view
Concern with students’ success
Availability during office hours.
Help others without taking control
Clear and effective communication
Share information openly and clearly
Provide continuous feedback
Utilize adequate and reasonable
evaluation methods
Help in the identification of
problems and their resolution
Serve as a model
Frequent and early contact with
students
Help students with course selection
and registration.
Monitor students’ academic progress
Identify problems and solutions
Provide academic assistance with
course content and study skills
Refer students for tutoring services
Refer students for professional
counseling
Help students in their preparation for
the Board Exam.
Qualitative and Quantitative Program Satisfaction
Program satisfaction measures (qualitative and quantitative) address graduates and their
employers.
Outcome: Ninety percent (90%) of the students are satisfied with the SON.
The SON conducted a graduate survey with the alumni who had finished their studies in
the last three (3) years. Fifty percent (50%) of questionnaires sent to ADN alumni were
answered. Many of ADN graduates pursue the BSN. ADN graduates’ ages range from 20 to
69. The majority of them stated that the program helped them develop competencies to practice
as nurses. One-hundred (100%) percent of respondents were satisfied with the nursing
curriculum and with the preparation that the SON provided. They also expressed satisfaction

38
with the theory and clinical courses, the evaluation processes, and the administrative support.
They all stated that if they ever needed to study again, they would choose MC. In general the
ADN graduates expressed that the curriculum prepared them adequately.
The BSN alumni expressed in the survey that they finished their preparation in three (3)
years. Their ages ranged between 20 and 50 years of age. All of the graduates expressed that the
clinical practice of their program of studies was relevant to their professional preparation. They
also expressed satisfaction with the evaluation processes, the clinical areas, and the support
services.
In general, the alumni were very satisfied with faculty members and they would choose
MC if they ever study again. They expressed that they are well prepared to provide services to
our country. It is interesting to note that all the ADN alumni mentioned that they would return to
this Nursing Program to complete their BSN.
Employers expressed satisfaction with the SON graduates. The latest employer survey
was conducted with 14 agencies and hospitals in the Metropolitan area in academic year 2008-
09. They expressed their satisfaction with the SON graduates and their work performance. Fifty
percent of respondents represented private institutions in which SON alumni were employed.
See the following pie chart for the statistics.

39
Figure 6. Employers Classification
Major services provided by SON alumni were: Pediatrics (50%), Medical and Surgical
(25%), Maternity and Neonatal (12.5%) and Mental Health (12.5%). The average monthly
salary for the professionals ranged between $1,500 and $2,000 (62%). The employers were
generally satisfied with the clinical competencies of the graduates (See Figure 8).
Figure 7. Employer Satisfaction with Clinical Competencies of the Graduates
50%
25% 12.5%
12.5%
Employers' Classification
PrivatePublicOther
50%
37.5%
12.5%
20%
Totally agree
Agree
Partially agree
Other

40
The employers responded positively in terms of the graduates’ attitudes, willingness to
learn, knowledge base, and other competencies. They maintained that MC graduates compared
favorably to graduates from other institutions. According to the employers, some students have
the ability to conduct therapeutic interventions.
Job placement rates are addressed through quantified measures that reflect program
demographics and history.
Outcome: SON graduates job placement data reflect program demographic and history.
The SON defines job placement rates as the number of graduates who report on surveys
that they accepted employment in nursing and related areas. Students in the BSN program fill
out the application for the JEPSPR exam when they finish the ADN exit option. Others continue
in the program until they finish their BSN to start the process for JEPSPR exam. Usually, they
begin in a nursing position in one of the hospitals, with a temporary license. Forty-one percent
of ADN graduates stated that they were recruited within six (6) months after graduation. Sixty
percent stated that they were recruited immediately.
The employers stated that, if they had the opportunity to recruit SON’s alumni, they
would do so instead of recruiting student from other schools. Sixty-five percent of the employers
stated that the clinical knowledge demonstrated by SON alumni is superior than that
demonstrated by graduates from other schools.

41
Figure 8. Level of Clinical Knowledge of Graduates According to Employers
One-hundred percent (100%) of employers who participated in the survey would
recommend other directors and supervisors to recruit SON BSN alumni or to keep them working
in the unit. Even though some SON graduates move to the USA and work in nursing positions,
SON does not have official statistics about this. Graduates filled out applications to work in
various states within the continental USA and faculty members issue recommendation letters on
their behalf. Also, many students apply for the NCLEX; however, as previously stated, the SON
does not get official data on those results.
26%
12.5%
12%
12.5%
LEVEL OF GRADUATE CLINICAL KNOWLEDGE
Totally agree
Agree
Partially Agree
Other

Inter American University of Puerto Rico Metropolitan Campus
2009-2010
Appendix 4 Program Assessment Progress Report Samples

Inter American University of Puerto Rico Metropolitan Campus
Education and Behavioral Sciences Faculty Psychology Assessment Progress Report 2009-2010
Introduction
Psychology School faculty members revised their assessment plan to include the following areas: dissertations contribution to the discipline of Psychology; alumni satisfaction with academic experience; retention and graduation rates; mastery of competencies in the areas of ethics, cognitive evaluation, personality evaluation, intervention and administrative skills (record management and progress reports). At the master level, a capstone course was used as a performance measure. In addition to institutional assessment measurements, the Psychology School uses licensure exams to determine student learning outcomes and areas for improvement. Psychology students’ performance in licensure exams is below the MC standard of 75%. However, assessment efforts have resulted in a gradual improvement in results. The following figure shows licensure passing rate.
The School of Psychology faculty members, as part of the assessment process, have addressed the licensure content and subject areas. Figure 1 shows an increase in student performance in licensure exams after the implementation of this assessment strategy. MC students are qualified to take exams with a master degree, while other institutions do not offer this option and students are required to finish a doctoral program in order to take the exams. Nevertheless, MC student passing rate is above Puerto Rico.
Figure 1. Psychology Licensure Exams
3641
6762 61
51 53
65 6471
October 2006 N=42
May and November 2007
N=78
November 2008 N=39
May 2009 N=45
November 2009 N=46
PsychologyPassing Rate
MC PR

Assessment Goal Where did the
assessment of this goal take place?
Methods or instruments
used*
Results (Institutional and
Statewide Pass Rate)
Action taken
Master the competencies in Psychology evaluated in the licensure exams
Puerto Rico Board of Psychology
Board Exams October 2006: Puerto Rico = 51%; MC=36% May & November 2007: Puerto Rico = 53%; MC=41% November 2008: Puerto Rico = 65%; MC=67% May 2009: Puerto Rico = 64%; MC=62% November 2009: Puerto Rico = 71%; MC=61%
As part of the assessment process, the following actions took place during academic year 2009-2010: 1. Content of
licensure exams was analyzed
2. Using the study guides for the exams, ten competency areas were identified: Ethics, Measurement, Statistics, Physiology, Social, Development, Learning, Personality, Motivation, and Psychopathology
3. Mapping of exam content areas and subject matters
4. Alignment of course syllabi with exam content areas
5. Senior Seminar was revised
6. Elaboration of on-line pre and post tests to be administered in 2010-2011

Inter American University of Puerto Rico Metropolitan Campus
Economic and Administrative Sciences Faculty Accounting Assessment Progress Report 2009-2010
Introduction
The Accounting program faculty revised its mission during this academic year to be congruent with the new Metropolitan Campus (MC) Mission and Goals. The accounting program mission is:
To expose students to the principles, norms and laws that regulate the Accounting profession in the United States and Puerto Rico. The student is exposed to the application of theory and practice related to the diverse areas of specialization in the accounting field. The profession’s organization, the ethics and accountants’ responsibilities are included in the course of studies. The new trends in doing business require that students have ample knowledge in accounting and other areas such as communications, use of technology, economics, commercial finance and human resources.
The organization of the Accounting is depicted in the following figure:
Figure 2. Accounting Assessment Organization
Faculty members defined expected student learning outcomes as follows:
Expected student learning outcomes Apply generally accepted Accounting principles in a Puerto Rico and the United broad range of business transactions. Use the techniques used to determine cost, preparing budget, and measuring performance. Analyze the regulatory framework that governs auditing in States. Evaluate the accounting issues associated with international business. Use technology in current accounting systems environment. Apply Government Accounting Principles in a broad range of government business transactions. Explain the broad role of individual, corporation and partnership taxation in the business decision-making process for Puerto Rico and the United Stated Apply the problem solving processes in the solution of ethical dilemmas An understanding of the ethical dilemmas faced by accountants and how to respond to such on regulatory guidance.

Different assessment measurements have been incorporated to collect data to determine student learning outcomes, among them: pre and post tests, reflective diary, focus groups, and alumni focus groups. Data gathered will be analyzed by faculty members and an action agenda will be implemented in those areas that the results are below the performance indicator. Faculty meetings will be held in the second trimester to discuss assessment results and improvement strategies.
Assessment Goal Where did the
assessment of this goal take place?
Methods or instruments
used*
Results
Action taken
Explain the broad role of individual, corporation and partnership taxation in the business decision-making process for Puerto Rico and the United Stated
Pre and post test in Accounting 2041 course
Pre & post tests
Question Number
Pre Testing
% of Correct
Post Testing
% of Correct
The performance indicator was 75% in post test. Faculty members will discuss these results in academic year 2010-11.
1 14% 86%
2 36% 79%
3 79% 100%
4 57% 86%
5 36% 64%
Apply generally accepted Accounting principles in a Puerto Rico and the United States broad range of business transactions.
Accounting 1161
Reflective Diary
97% of students identified and demonstrated knowledge of topics considered in the course. 94% expressed confusion with on some topics.
Faculty members clarified those topics that students stated they need further clarification
Use the techniques used to determine cost, preparing budget, and measuring performance.
Accounting 1162
Reflective Diary
85% of students identified topics 45% of students demonstrated knowledge of topics 36% stated that some topics needed further clarification
Faculty members clarified those topics that students stated they need further clarification
Alumni identified that MC prepares them for their profession
MC meeting room
Focus group Alumni expressed satisfaction with faculty, infrastructure, and academic preparation and recommended: 1. Develop master’s degree
in taxes.
2. Promotion of the program should be a priority to draw new students and to make known the achievements of the Metropolitan
Faculty members will consider these recommendations in academic program review and faculty meetings.

Assessment Goal Where did the
assessment of this goal take place?
Methods or instruments
used*
Results
Action taken
Campus alumni.
3. Participate in the employment fair. The program should sponsor and help the students on these activities.
4. Excel courses are a necessary tool for the job.
5. Promote reading and using the research in the area of accounting courses (Research)
6. Include more courses of audit in the general program.
7. Greater orientation to students in relation to the opportunities of employment and positions in a company within the accounting field.
8. Develop projects such as bookkeeping, audit, financial statements, etc., a fictional problem to have the experience and the connection between theory and practice company. Having seen all aspect of a company.
9. Course of Company Law should be required; not an elective.
10. Statistics and economics courses are recommended for students in accounting.

Inter American University of Puerto Rico Metropolitan Campus
Education and Behavioral Sciences Faculty Teacher Education Assessment Progress Report 2009-2010
The Teacher Education Program has a candidacy status by the Teacher Education Accreditation Council (TEAC). The program assessment plan is based on TEAC standards. The Teacher Certification exam is a standardized test required for all teachers in order to practice in Puerto Rico. The passing rate is obtained by combining results for two parts: Fundamental Knowledge and Communication competencies and Professional competencies. PART I A: Main Findings
Assessment Goal Where did the
assessment of this goal take place?
Methods or instruments
used*
Results (Institutional and
Statewide Pass Rate)
Action taken
Students’ learning in the following areas:
1. Fundamental knowledge and communication competencies
2. Professional competencies
3. Specialization
College Entrance Examination Board
Standardized test: Teachers’ Certification Exam (TCE) (This exam is administer and computerized by an external agency)
Results from the following years: 2003-2004 2004-2005 2005-2006 2006-2007 2007-2008 2008-2009
Work Shops Reviews For all students who will be taken the Teachers’ Certification Exam since 2000 to 2009 Exercises to Develop Writing Skills in All four Courses of field experiences since 2006 – 2009 Creation of new courses: Mathematics for Teachers Final Seminar
It is expected that 80% of the students who take the TCE approve Fundamental Knowledge and Communication Competencies
Teachers’ Certification Exam (TCE)
Institution Pass Rate 2004-05 – 117/131 = 89% 2005-06 – 41/50 = 82% 2006-07 – 44/56 = 79% 2007-08 – 43/52 = 83% 2008-09 – 45/58 = 78%
Statewide Pass Rate 2003-04 = 2004-05 = 91% 2005-06 = 2006-07 = 81% 2007-08 = 81% 2008-09 = 82%
It is expected that 80% of the students who take the TCE approve Professional Competencies
Teachers’ Certification Exam (TCE)
2004-05 – 117/129 = 91% 2005-06 – 43/49 = 88% 2006-07 – 44/55 = 80% 2007-08 – 44/52 = 85%
2004-05 = 2004-05 = 93% 2005-06 = 2006-07 = 88%

Assessment Goal Where did the
assessment of this goal take place?
Methods or instruments
used*
Results (Institutional and
Statewide Pass Rate)
Action taken
2008-09 – 48/58 = 83%
2007-08 = 86% 2008-09 = 86%
It is expected that 80% of the students who take the TCE approve content of the Specialization
Teachers’ Certification Exam (TCE)
2004-2005 – 38/39 = 97% 2005-2006 – 20/20 = 100% 2006-2007 – 18/20 = 90% 2007-2008 – 11/14 = 79% 2008-2009 – 16/19 =84%
2003-04 = 2004-05 = 93% 2005-06 = 2006-07 = 85% 2007-08 = 84% 2008-09 = 80%
It is expected that 80% of the students who take the TCE approve in the Summary Pass Rate
Teachers’ Certification Exam (TCE)
2004-2005 – 111/132 = 84% 2005-2006 – 40/50 = 80% 2006-2007 – 38/58 = 66% 2007-2008 – 34/52 = 65% 2008-2009 – 42/60 =70%
2003-04 = 2004-05 = 87% 2005-06 = 2006-07 = 73% 2007-08 = 74% 2008-09 = 74%
PART I B: Use of main findings of the assessment conducted during the year.
How has the faculty discussed the assessment process and the findings? Check all that apply. XX in a meeting of the program, school, or department which was dedicated only to assessment __as one of several points in the agenda of a meeting of the program, school, or department __in a meeting of the assessment committee of the college, program, school, or department __in other departmental committee meetings XX in informal conversations between faculty members XX Others (please specify) discussing assessment results with students in class and Work Shops
Reviews __The assessment findings have not been discussed by the faculty this year. How have you used the finding of current or past assessments during this academic year to improve student learning or to improve the assessment process? (Maximum suggested length is 500 words.) PART II: ACTIVITIES FOR THE NEXT ACADEMIC YEAR
Assessment goals to be assessed next year
Where will the assessment take place?
(Course? Any other activity?)
Methods or assessment instruments which will be used
Classroom assessment
Fundamentals and
specialization courses
Results of pre tests and post text exams
Written exercises

Inter American University of Puerto Rico Metropolitan Campus
Humanistics Studies Faculty Political Sciences Assessment Progress Report 2009-2010
The BA in Political Sciences mission is to provide students with the theoretical and philosophical foundation of the principles of politics and to develop student skills in analyzing and interpreting the political scene and understanding political problems part. The program assessment plan emphasized student performance and mastery of theoretical and social bases necessary for a better understanding the political world. I A: MAIN FINDINGS ASSESMENT
GOAL
ASSESMENT
CRITERIA
INDICATOR INSTRUMENTS EXPECTED
OUTCOME
USE OF
ASSESMENT
Students will Identify the theoretical and social basis necessary for a better understanding of the political world.
Number or percentage of students who pass the Introduction to Political Science class with an A or B overall average.
10% Increase in the number of students who pass the class with an A or B average per academic term.
Students presentations, class participation, assignments, quizzes and tests.
90 % of the
students will
pass the class
with an A or B
grade, by the
end of the
third academic
year.
Incorporate new
student
classroom
evaluation
techniques and
methods that will
better measure
class
commitment and
participation.
Incorporating pre
and post tests, as
well as portfolios
and other
techniques that
promote higher
class
involvement.
Students will learn and apply the theoretical frameworks needed for political research and investigation. .
Number or percentage of students who pass the Political research Seminar with an A average.
10% annual
increase in the
number of
students who
pass the class
with an A
average.
Class presentation
of a political
science research
paper prepared
by the student.
Students are
required to apply
the research
techniques
studied in class.
100% Of the students will pass the class with an A average. .
Explore new ways
of incorporating
research
techniques in
most of the
political science
courses, and
request that Pols.
2100 , Political
Analysis and
Research become
a pre requisite for
this class

PART I B: USE OF PRINCIPAL FINDINGS OF THE ASSESSMENT DURING THE YEAR
1. How the faculty has discussed the process of Assessment and/or results?
The assessment process has been discussed with faculty members through organized departmental meetings, that started last year, and by individual one on one meeting between the faculty and the faculty representative liaison and program director. A classroom learning assessment plan is in developed by the faculty committee the process How you use the results of current or past assessments during the academic year to improve students’ learning or to improve the process of assessment?
The findings are discussed in faculty meetings. New ideas and methodology are presented and discussed in order to improve the assessment process.
PART II: ASSESMENT ACTIVITIES FOR NEXT ACADEMIC YEAR
Student assessment goals based on findings
Instruments Outcomes
1. To incorporate new methodologies in classroom assessment, such as debates in political sciences topics.
1.1Currently we have begun to use the debate as a learning method in the course: Introduction to Political Sciences. The use of debates will be integrated as a method of assessment in some of the courses.
1.1- Number of students who participate
2. To create a Political Science Students Debate Club in order for the students to exchange reasoned arguments and opinions in a formal forum.
2.1 Organize competitions in and outside classrooms and at the university premises by the Political Science Students with the support of Professors.
2.1-Debate Tournaments and class room participation
3. To stimulate more class participation in discussion groups and to improve investigation methods, through class presentation and research papers.
3. Develop research skills through the integration of class participation and Teaching Assistantship projects with the faculty.
3.1 Number of students who participate in research assignments with the professors.
4. Creating an online Political Science Department Student Magazine
4.1 Student Journal
4.1 Number of students who publish in the magazine

Student assessment goals based on findings
Instruments Outcomes
5. Another project that is currently unfolding is the Cyber- Political Science Magazine. This magazine seeks to create a forum for our students to public research work that they do in concentration courses. With this project we seek to develop the investigation and writing skills in our students.
5.1 The articles for the magazine may be conducted as part of the course requirements for Political Analysis and Research Techniques or through other courses where research is required as part of their assessment requirements. Students may also submit articles on topics of interest related to Political Science.
5.1 Investigations and Compositions
6. The faculty is to be exposed to innovative ways in assessing classroom assessment.
6.1 Faculty workshops in classroom learning assessment.
6.1 Number of workshops and % or faculty who participate.
PART II: ADDITIONAL INFORMATION AND OUTCOMES
Outcome Assessment
Program Revision The Political Science Program is in its six years academic evaluation. The program was revised in 2003 and professor Aline Frambes has been assigned to preside over for the program revision at The Central Administration Office.
Faculty Assessment The Department is in the process of assessing the need for new faculty members based the findings in the program assessment
Student Assessment We are in the process of evaluating and incorporating student’s satisfaction needs and recommendation based on the student assessment results, incorporating graduates opinions and recommendations.
Student Classroom Assessment
Goals Instruments
Outcomes
Introduction to Political Science (Blackboard)
Reading Comprehension
Quizzes, Homework and class Discussion
Number of students who participated and completed all tasks.
Introduction to International Relations.
Development of research skills. Knowledge of Research skills and methodology
Short essay compositions of five to seven pages about specific topics Research Project
Number of students who successfully completed the assigned tasks and submitted the research project with a passing grade of C or higher
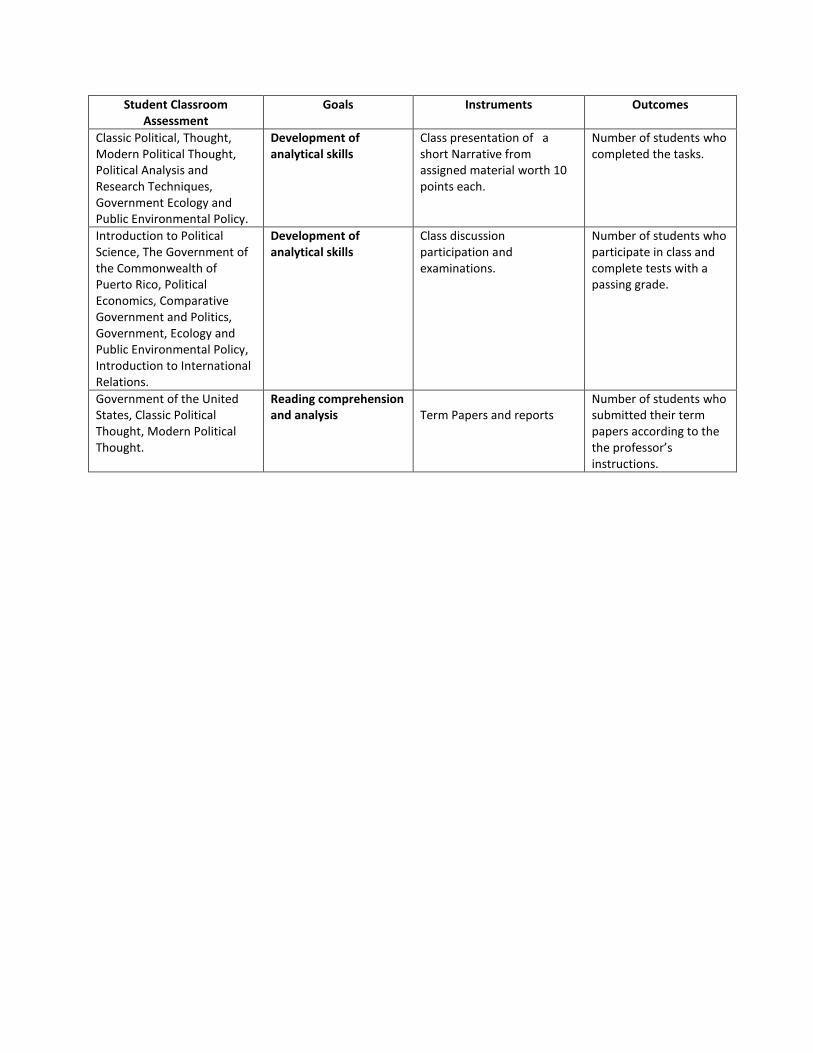
Student Classroom Assessment
Goals Instruments
Outcomes
Classic Political, Thought, Modern Political Thought, Political Analysis and Research Techniques, Government Ecology and Public Environmental Policy.
Development of analytical skills
Class presentation of a short Narrative from assigned material worth 10 points each.
Number of students who completed the tasks.
Introduction to Political Science, The Government of the Commonwealth of Puerto Rico, Political Economics, Comparative Government and Politics, Government, Ecology and Public Environmental Policy, Introduction to International Relations.
Development of analytical skills
Class discussion participation and examinations.
Number of students who participate in class and complete tests with a passing grade.
Government of the United States, Classic Political Thought, Modern Political Thought.
Reading comprehension and analysis
Term Papers and reports
Number of students who submitted their term papers according to the the professor’s instructions.

Inter American University of Puerto Rico Metropolitan Campus
Appendix 5Employers and Alumni Surveys
Summary of Results
APPENDIX 5: IAUPR- METROPOLITAN CAMPUS EMPLOYERS AND ALUMNI SURVEYS

Employers and Alumni Surveys
• These surveys are developed at the university system level with participation of representatives from all academic units.
• Institutional studies (alumni, employers, student satisfaction – graduate and undergraduate--, among others) are developed at the university system.
• Institutional studies results are segregated by Campus.• At the Campus level, these surveys are administered by the Dean of
Academic Affairs Office in coordination with the Center for Institutional Research and Sponsored Programs.
• At the university system level, all results are discussed with the President and all academic unit Chancellors.
• At the Campus level,– The Chancellor discuss results with her staff, faculty members, Academic
Senate, and Strategic Council and delineate with the academic community strategies for improvement.
– All academic divisions and departments define an action agenda to be included in their assessment plans.
APPENDIX 5: IAUPR- METROPOLITAN CAMPUS EMPLOYERS AND ALUMNI
SURVEYS

Employers preference among highereducation institution graduates
0
10
20
30
40
50
60
70
80
90
UIPR UPR Catholic Univ. of PR
Polytechnic Univ.
Univ. Sacred Heart
Turabo UMET UNE USA Other
Percentage of Preference

Value given to extracurricular activities
0
10
20
30
40
50
60
70
80
Cultural Leadership Service Practicum Athletic Other
Percentage of value given

Major Findings1. 45% of sample employed UIPR graduates
2. UIPR graduates are represented more in the government than
in the private sectors.
3. Three major disciplines represented in the government sector
are: business administration, information and
telecommunications, and human resources.
4. Three major disciplines represented in the private sector are:
business administration, information and telecommunications,
and engineering.
5. Competencies considered more important by employers are:
teamwork, interpersonal relations, abilitiy to follow instructions,
ethics, lifelong learning, and global competencies.
6. Employers considered UIPR graduates as well prepared as those
of other institutions.
APPENDIX 5: IAUPR- METROPOLITAN CAMPUS EMPLOYERS AND ALUMNI
SURVEYS

Actions Taken
1. Soft competencies have been included in recentcurricular revisions.
2. Practicum opprotunities have been added toprofessional programs.
3. Revision of community service activities in General Education courses.
4. Establishment of Entrepreneurship Center and theOffice of International Relations.
5. New employer surveys are being designed forCampus specific academic programs.
APPENDIX 5: IAUPR- METROPOLITAN CAMPUS EMPLOYERS AND ALUMNI
SURVEYS

Alumni Survey 2006
Alumni Class of 2003
Summary of Results
APPENDIX 5: IAUPR- METROPOLITAN CAMPUS EMPLOYERS AND ALUMNI
SURVEYS

Methodology
• 308 participants from 1,856 graduates
• Representation from all educational levels and the following academic areas:
– Business Administration
– Natural Sciences
– Education
– Health
– Social Sciences
APPENDIX 5: IAUPR- METROPOLITAN CAMPUS EMPLOYERS AND ALUMNI
SURVEYS

Metropolitan CampusPercentage of alumni working
79%
6%
15%
Sí, Full time
Sí, Part time
No
92%
5%
3%
Sí, Full time
Sí, Part time
No
Bachelor: N = 138 Master: N = 157
APPENDIX 5: IAUPR- METROPOLITAN CAMPUS EMPLOYERS AND ALUMNI
SURVEYS

Metropolitan CampusAnnual Income
20%
14%
33%
13%
9%
4%
6%1%
Menos de $8,000
$8,001-$16,000
$16,001-$24,000
$24,001-$32,000
$32,001-$40,000
$40,001-$48,000
$48,001-$56,000
$56,001 ó más
Bachelor: N = 142 Master: N = 147
APPENDIX 5: IAUPR- METROPOLITAN CAMPUS EMPLOYERS AND ALUMNI
SURVEYS

Metropolitan CampusTime pass from graduation to employment
56%30%
5%
9%
Ya tenía empleo cuando
me gradué
De 1 a 6 meses
Entre 7 meses y 1 año
Más de 1 año
Bachelor: N = 127 Master: N = 155
APPENDIX 5: IAUPR- METROPOLITAN CAMPUS EMPLOYERS AND ALUMNI
SURVEYS

Metropolitan CampusRelationship between major and employment
48%
23%
10%
19% Altamente relacionado
Moderadamente
relacionado
Poco relacionado
Ninguna relación con
lo estudiado
Bachelor: N = 124 Master: N = 152
APPENDIX 5: IAUPR- METROPOLITAN CAMPUS EMPLOYERS AND ALUMNI
SURVEYS

Metropolitan CampusValue of academic preparation to employment
Bachelor: N = 102 Master: N = 147
APPENDIX 5: IAUPR- METROPOLITAN CAMPUS EMPLOYERS AND ALUMNI
SURVEYS

Findings
• Students majoring at the master level in Accounting, Psychology, Criminal Justice, Human Resources, and Counseling had more difficulties in finding jobs related to their field of studies
• Students majoring at the bachelor level in Psychology, Marketing, Criminal Justice, Accounting, and Human Resources had more difficulties in finding jobs related to their field of studies
• Alumni expressed that they were more competent in Spanish oral and written skills than in English.
• The following competencies were identified by alumni as less developed: problem solving skills, research, leadership, and effective use of technology.
• The following competencies were identified by alumni as more developed: lifelong learning, entrepreneurship, critical thinking, and negotiating skills.
APPENDIX 5: IAUPR- METROPOLITAN CAMPUS EMPLOYERS AND ALUMNI
SURVEYS

Actions Taken• CPA track has been enhanced and promoted
among Accounting students.
• Problem solving, research, leadership, and the use of technology have been emphasized across the curriculum.
• Research experiences, practicum, internship, and English communication skills have been emphasized in program reviews, especially, in majors that alumni had more difficulties in finding employment.
APPENDIX 5: IAUPR- METROPOLITAN CAMPUS EMPLOYERS AND ALUMNI
SURVEYS

Inter American University of Puerto Rico Metropolitan Campus
2009-2010
APPENDIX 6
INSTITUTIONAL AND PROGRAM ASSESSMENT COMMITTEE
MEMBERS

2
Institutional Assessment Committee
Dr. Debora Hernández, President – Dean of the Institutional Research and External Funds
Prof. Migdalia M. Texidor – Dean of Studies
Dr. Carmen A. Oquendo – Dean of Students
Dr. Irma Brugueras – Professor of the Teacher Preparation Program
Dr. Rosalie Rosa – Professor of Social Work
Dr. Arline Milán – Professor of Human Resources
Dr. Lillian Gaya-Gonzalez – Professor of Biology
Academic Assessment Coordinators –Program Level
Dra. Irma Brugueras – Teacher Preparation Program
Dra. Agnes Dubey – Chemistry
Prof. Ernesto Torres – Environmental Sciences
Dr. Miguel Cubano – Popular Music
Prof. Belma Borras – Accounting
Dr. Aurea Ayala – Nursing
Dr. Laura Pando – English
Dr. Luis Mayo – Spanish
Prof. Manuel Garcia – Mathematics
Dr. Jaime Santiago – Psychology
Prof. Angeline Liang – Criminal Justice
Prof. Maria de Jesus – Computer Science
Dr. Noel Allende – Music Education
Dr. Angel Velez – Religion
Dr. Juan Karman – Computerized Information Systems
Prof. Jose Hernandez – Political Science
Prof. Mildred Soto – Management