Microsoft Excel VBA an Introduction -...Programming In Excel VBA ...
1
Revision
Main topics:
• Looping (lecture 1)
• Macro recording (lecture 2)
• Curve fitting (lecture 4)
• Interactive In and Output (lecture 5)
• Arrays and array functions (lecture 6)
• Customized User Forms (lectures 7 and 8)
Looping:
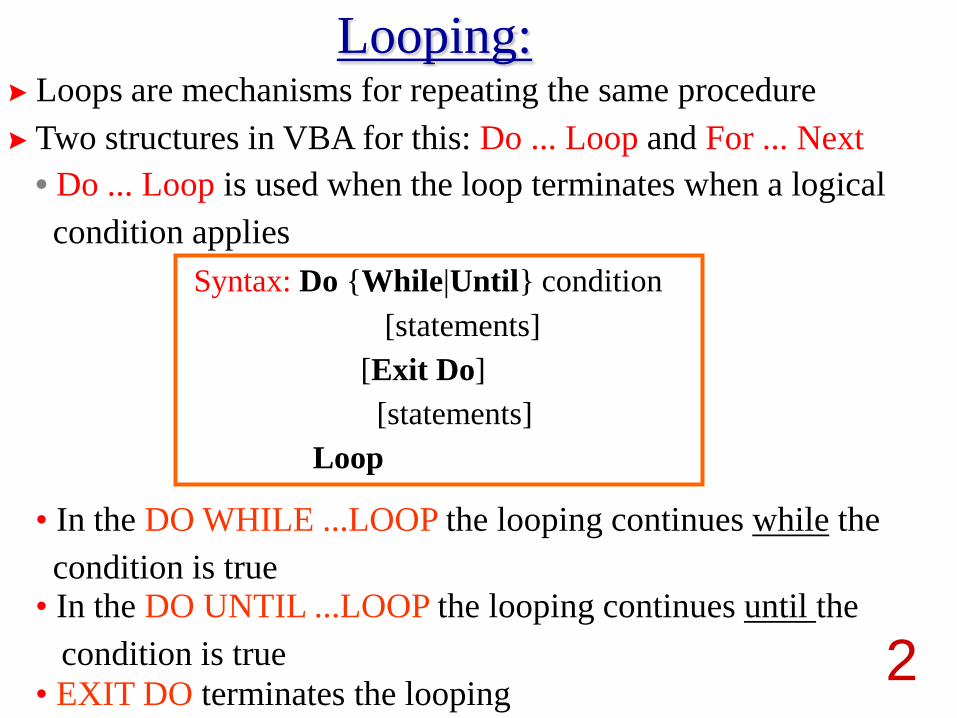
Two structures in VBA for this: Do ... Loop and For ... Next
• Do ... Loop is used when the loop terminates when a logical
condition applies
Loops are mechanisms for repeating the same procedure
2
• In the DO WHILE ...LOOP the looping continues while the
condition is true • In the DO UNTIL ...LOOP the looping continues until the
condition is true
• EXIT DO terminates the looping
Syntax: Do {While|Until} condition
[statements]
[Exit Do]
[statements]
Loop

3
Syntax: For counter = first To last [Step step]
[statements]
[Exit For]
[statements]
Next [counter]
• For ... Next is used when you know in advance how many times
you want to iterate
Exercises: Verify the following identities using looping:
(see Labsession 1 task 1)
4
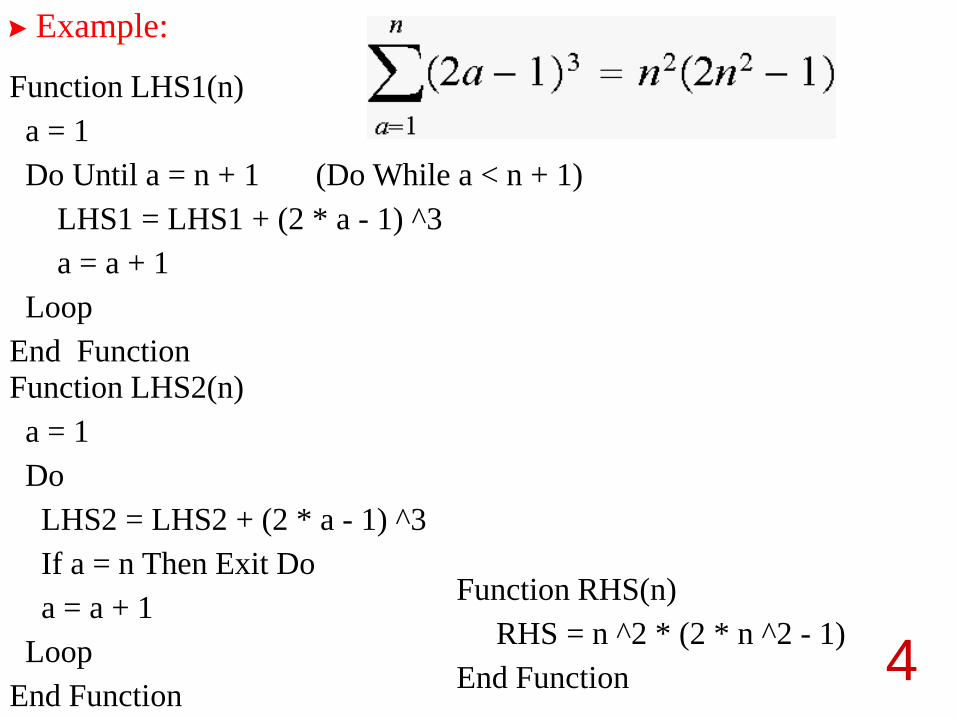
Example:
Function LHS1(n)
a = 1
Do Until a = n + 1 (Do While a < n + 1)
LHS1 = LHS1 + (2 * a - 1) ^3
a = a + 1
Loop
End Function
Function LHS2(n)
a = 1
Do
LHS2 = LHS2 + (2 * a - 1) ^3
If a = n Then Exit Do
a = a + 1
Loop
End Function
Function RHS(n)
RHS = n ^2 * (2 * n ^2 - 1)
End Function
5
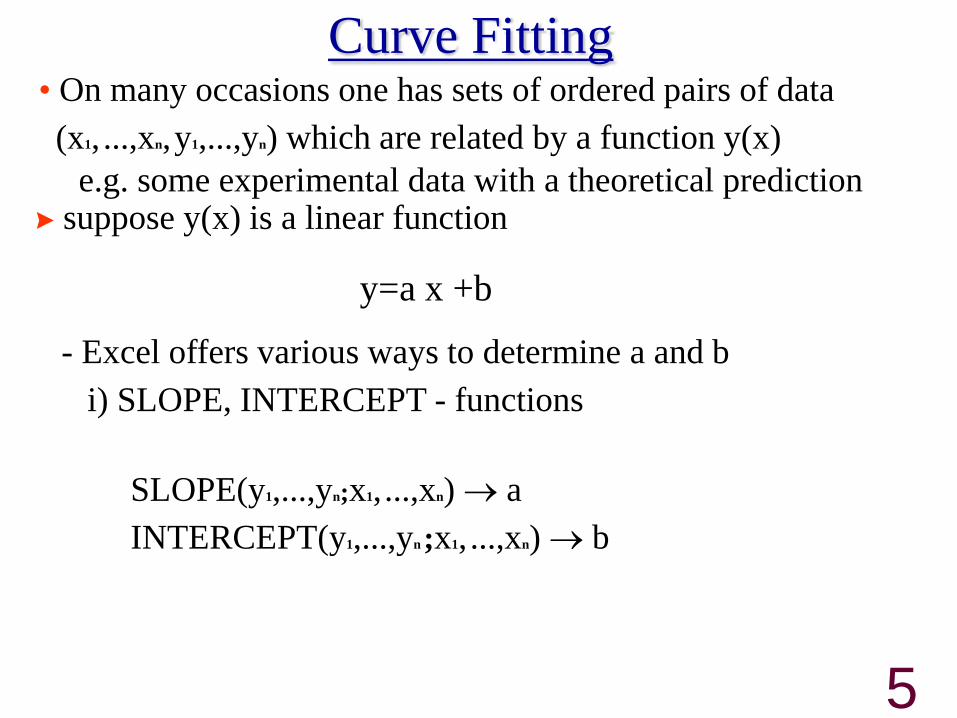
• On many occasions one has sets of ordered pairs of data
(x1, ...,xn,y1,...,yn) which are related by a function y(x)
e.g. some experimental data with a theoretical prediction suppose y(x) is a linear function
- Excel offers various ways to determine a and b
SLOPE(y1,...,yn;x1, ...,xn) a
INTERCEPT(y1,...,yn ;x1, ...,xn) b
i) SLOPE, INTERCEPT - functions
Curve Fitting
y=a x +b

6
LINEST(y1,...,yn ,x1, ...,xn,constant,statistics)
ii) LINEST - function
this function is more sophisticated than the previous one
- if constant = TRUE or omitted the intercept is computed
otherwise it is zero
- if statistics = TRUE the function returns regression
statistic values with the output:
slope intercept
standard error in the slopestandard error in the
intercept
r-squaredstandard error in the y
estimation
- we restrict ourselves here to
7
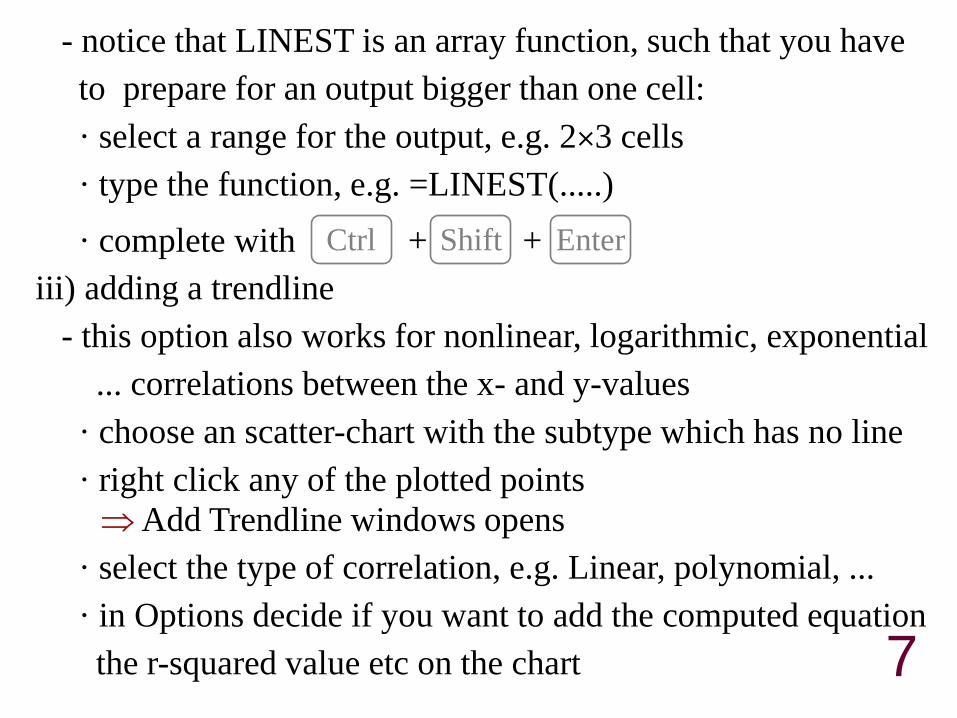
- notice that LINEST is an array function, such that you have
to prepare for an output bigger than one cell:
· select a range for the output, e.g. 23 cells
· type the function, e.g. =LINEST(.....)
· complete with + + Ctrl Shift Enter
iii) adding a trendline
· choose an scatter-chart with the subtype which has no line
- this option also works for nonlinear, logarithmic, exponential
... correlations between the x- and y-values
· right click any of the plotted points
Add Trendline windows opens
· select the type of correlation, e.g. Linear, polynomial, ...
· in Options decide if you want to add the computed equation
the r-squared value etc on the chart
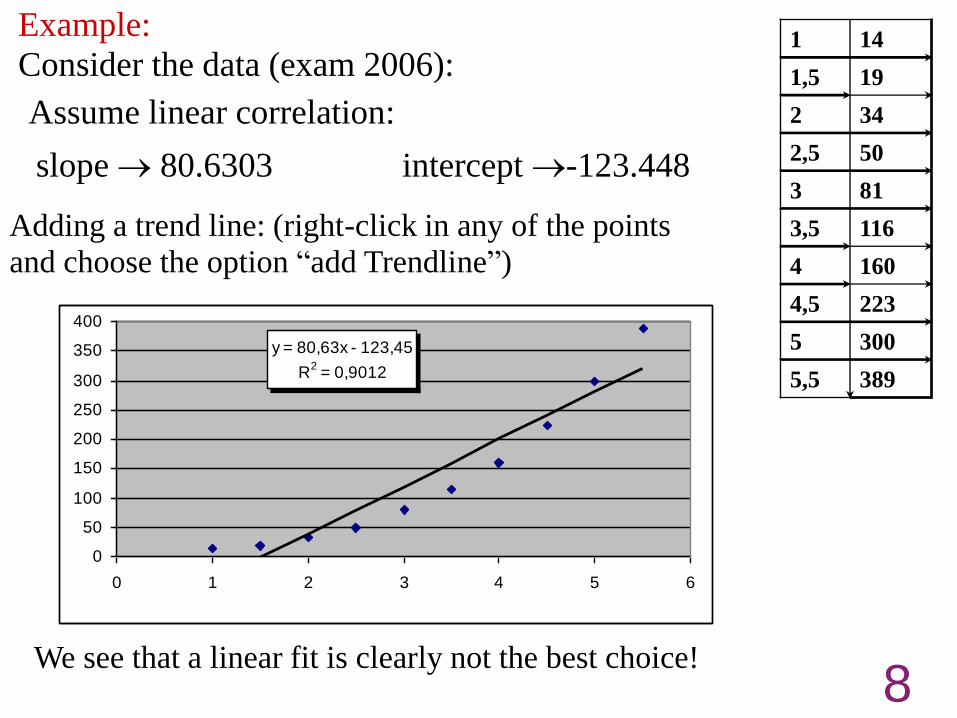
Example:
Consider the data (exam 2006):
slope 80.6303 intercept -123.448
Assume linear correlation:
1 14
1,5 19
2 34
2,5 50
3 81
3,5 116
4 160
4,5 223
5 300
5,5 389
Adding a trend line: (right-click in any of the points
and choose the option “add Trendline”)
We see that a linear fit is clearly not the best choice!
y = 80,63x - 123,45
R2 = 0,9012
0
50
100
150
200
250
300
350
400
0 1 2 3 4 5 6
8

9
In the exam, students were asked to perform a polynomial fit of the
type y=a x³ + b x² + c x + d. Doing that we obtain:
y = 2,1305x3 + 0,1515x
2 + 4,331x + 6,6303
R2 = 0,9998
0
50
100
150
200
250
300
350
400
450
0 1 2 3 4 5 6
Note: Remember that in order to have the equation for y and
the value of R² written in the graph you have to choose that
option when you add the trendline. There will be a window
called options which allows you to fix that!
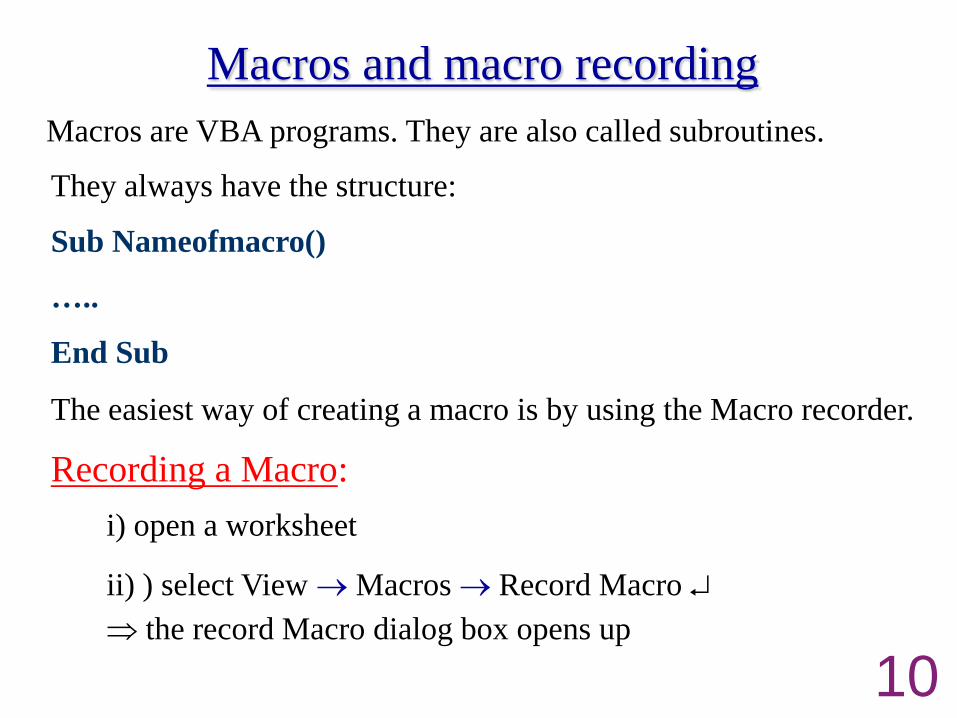
Macros and macro recording
Macros are VBA programs. They are also called subroutines.
They always have the structure:
Sub Nameofmacro()
…..
End Sub
The easiest way of creating a macro is by using the Macro recorder.
Recording a Macro:
i) open a worksheet
ii) ) select View Macros Record Macro
the record Macro dialog box opens up
10
11
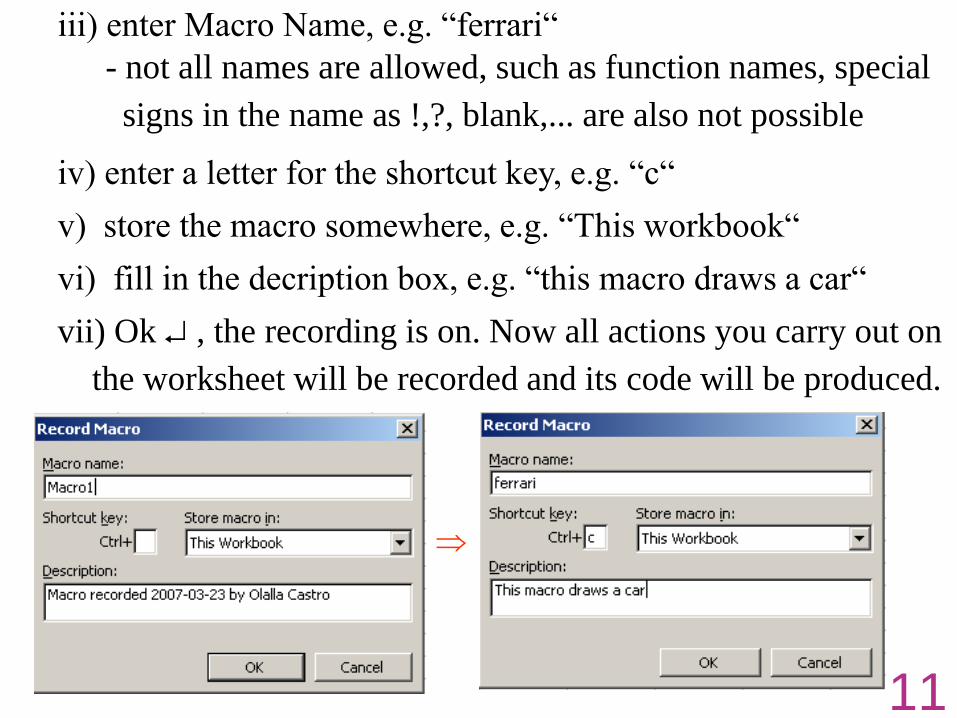
iii) enter Macro Name, e.g. “ferrari“
- not all names are allowed, such as function names, special
signs in the name as !,?, blank,... are also not possible
iv) enter a letter for the shortcut key, e.g. “c“
v) store the macro somewhere, e.g. “This workbook“
vi) fill in the decription box, e.g. “this macro draws a car“
vii) Ok , the recording is on. Now all actions you carry out on
the worksheet will be recorded and its code will be produced.
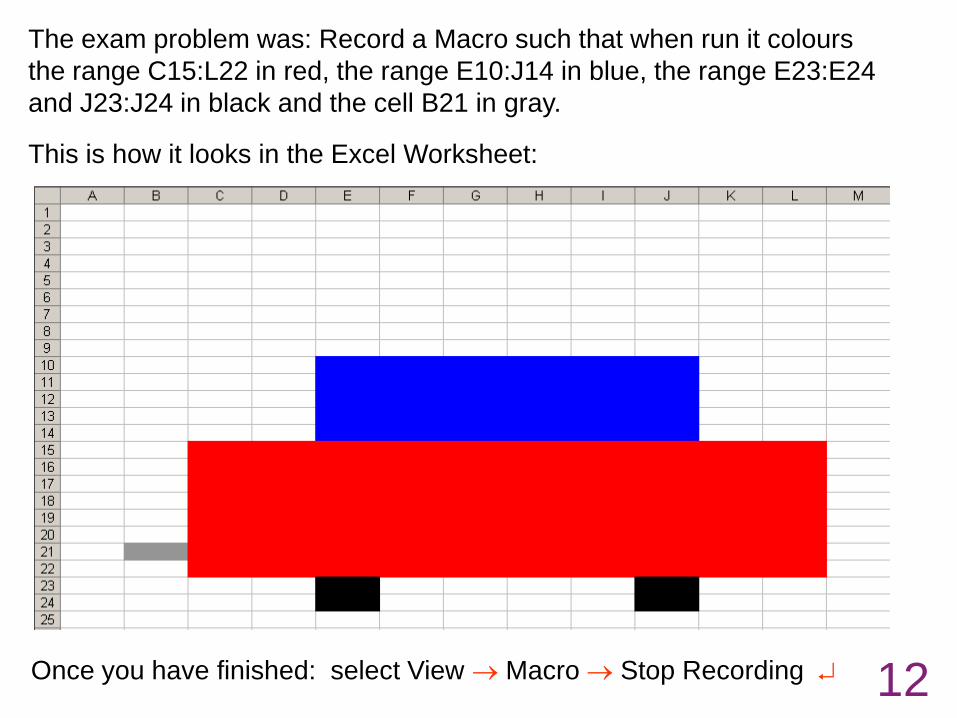
The exam problem was: Record a Macro such that when run it colours
the range C15:L22 in red, the range E10:J14 in blue, the range E23:E24
and J23:J24 in black and the cell B21 in gray.
This is how it looks in the Excel Worksheet:
12Once you have finished: select View Macro Stop Recording
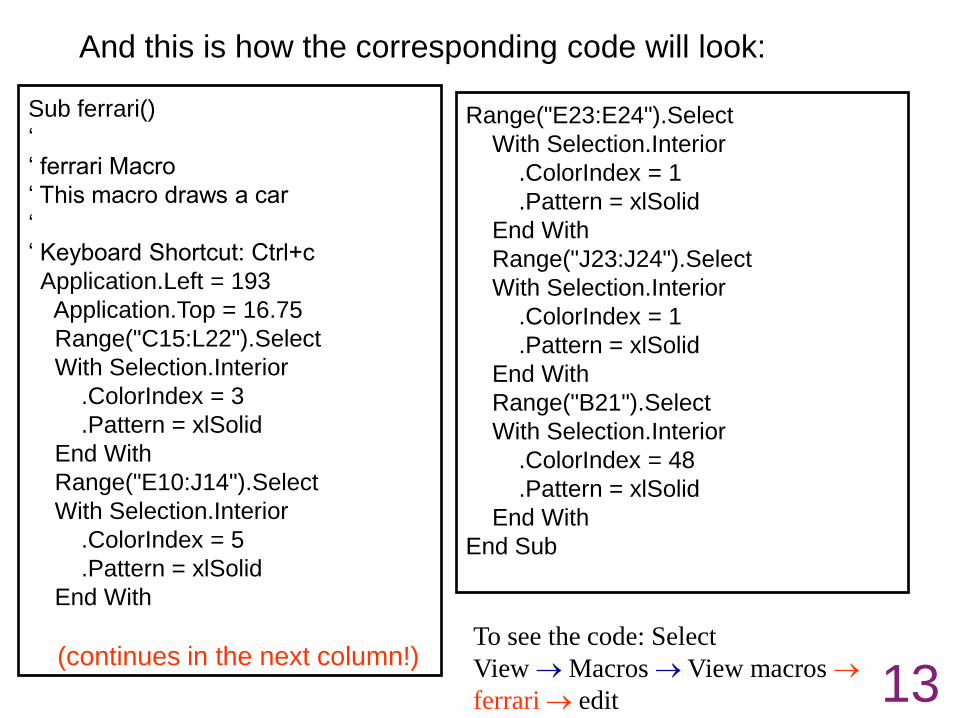
And this is how the corresponding code will look:
Sub ferrari()
„
„ ferrari Macro
„ This macro draws a car
„
„ Keyboard Shortcut: Ctrl+c
Application.Left = 193
Application.Top = 16.75
Range("C15:L22").Select
With Selection.Interior
.ColorIndex = 3
.Pattern = xlSolid
End With
Range("E10:J14").Select
With Selection.Interior
.ColorIndex = 5
.Pattern = xlSolid
End With
(continues in the next column!)
Range("E23:E24").Select
With Selection.Interior
.ColorIndex = 1
.Pattern = xlSolid
End With
Range("J23:J24").Select
With Selection.Interior
.ColorIndex = 1
.Pattern = xlSolid
End With
Range("B21").Select
With Selection.Interior
.ColorIndex = 48
.Pattern = xlSolid
End With
End Sub
To see the code: Select
View Macros View macros
ferrari edit 13
14
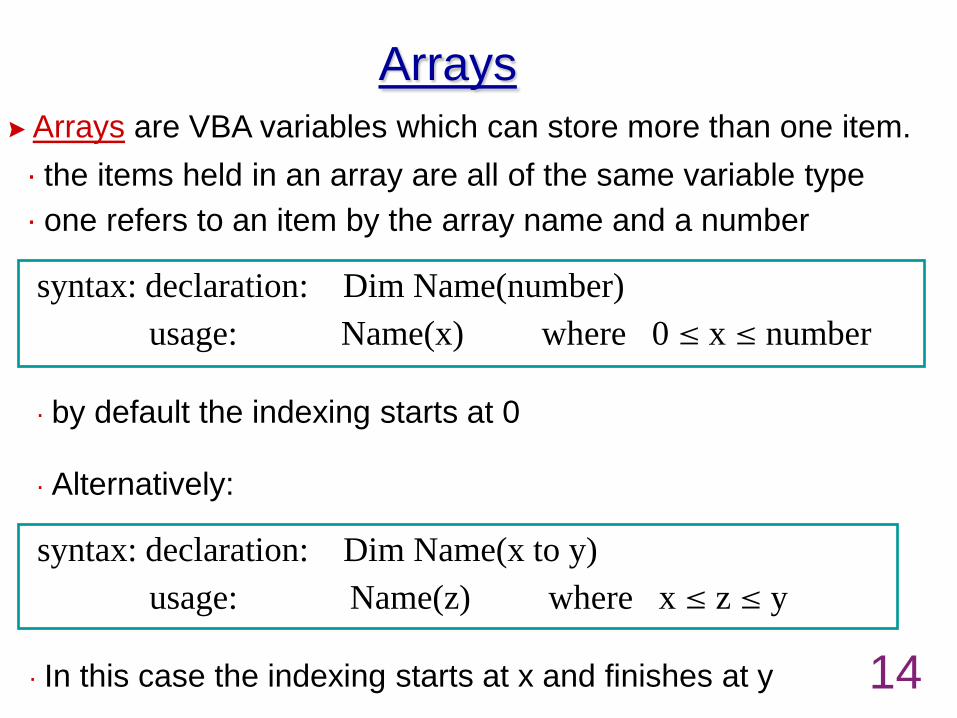
Arrays
Arrays are VBA variables which can store more than one item.
syntax: declaration: Dim Name(number)
usage: Name(x) where 0 x number
· the items held in an array are all of the same variable type
· one refers to an item by the array name and a number
· by default the indexing starts at 0
syntax: declaration: Dim Name(x to y)
usage: Name(z) where x z y
· Alternatively:
· In this case the indexing starts at x and finishes at y
15
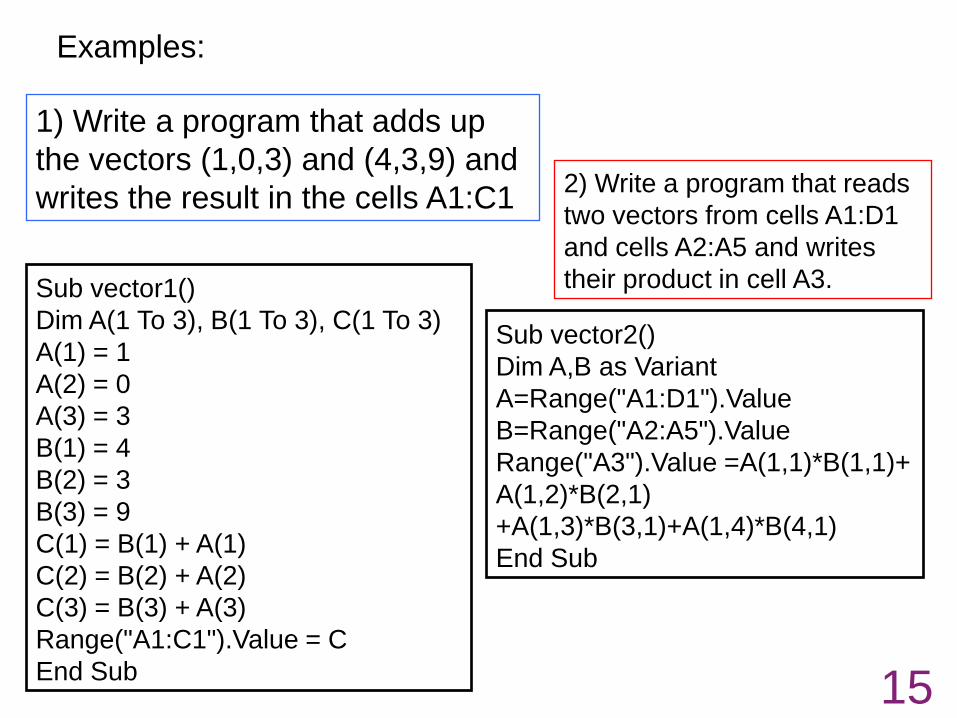
Examples:
1) Write a program that adds up
the vectors (1,0,3) and (4,3,9) and
writes the result in the cells A1:C1
Sub vector1()
Dim A(1 To 3), B(1 To 3), C(1 To 3)
A(1) = 1
A(2) = 0
A(3) = 3
B(1) = 4
B(2) = 3
B(3) = 9
C(1) = B(1) + A(1)
C(2) = B(2) + A(2)
C(3) = B(3) + A(3)
Range("A1:C1").Value = C
End Sub
2) Write a program that reads
two vectors from cells A1:D1
and cells A2:A5 and writes
their product in cell A3.
Sub vector2()
Dim A,B as Variant
A=Range("A1:D1").Value
B=Range("A2:A5").Value
Range("A3").Value =A(1,1)*B(1,1)+
A(1,2)*B(2,1)
+A(1,3)*B(3,1)+A(1,4)*B(4,1)
End Sub

16
syntax: declaration: Dim Name(num1,num2,num3,...)
usage: Name(x,y,z,...) 0 x num1
0 y num2
0 z num3
.......................
Multidimensional arrays are VBA variables which can holdmore than one item related to several index sets (up to 60)
When there are only two index sets, then the array is a matrix. For example:
Dim A(1 to 3, 1 to 3) defines a 3 x 3 matrix with entries A(1,1), A(1,2), A(1,3), A(2,1),A(2,2), A(2,3),A(3,1),A(3,2),A(3,3)
Dim B(2,2) defines also a 3 x 3 matrix with entries B(0,0),
B(0,1), B(0,2), B(2,0),B(2,1), B(2,2),B(2,0),B(2,1),B(2,2)
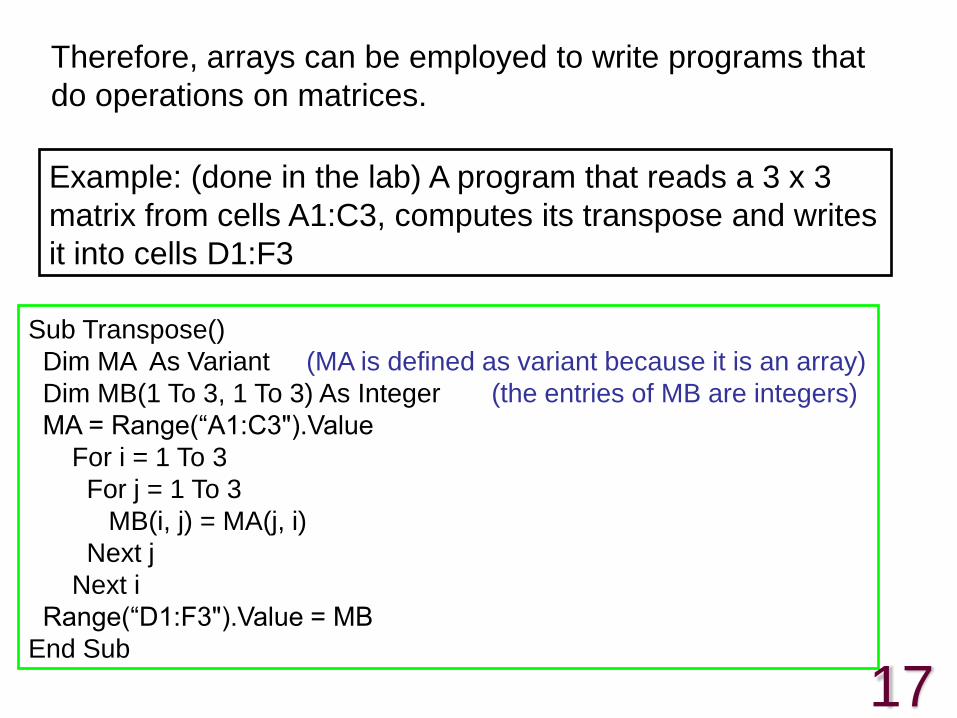
Therefore, arrays can be employed to write programs that
do operations on matrices.
Example: (done in the lab) A program that reads a 3 x 3
matrix from cells A1:C3, computes its transpose and writes
it into cells D1:F3
Sub Transpose()
Dim MA As Variant (MA is defined as variant because it is an array)
Dim MB(1 To 3, 1 To 3) As Integer (the entries of MB are integers)
MA = Range(“A1:C3").Value
For i = 1 To 3
For j = 1 To 3
MB(i, j) = MA(j, i)
Next j
Next i
Range(“D1:F3").Value = MB
End Sub
17
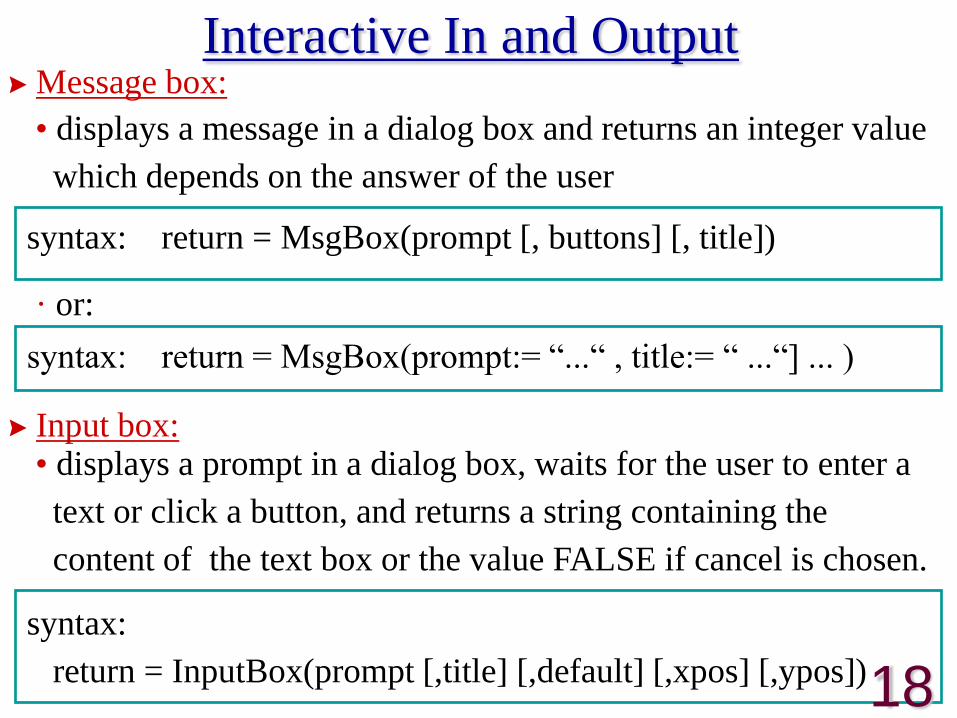
Interactive In and Output Message box:
syntax: return = MsgBox(prompt [, buttons] [, title])
• displays a message in a dialog box and returns an integer value
which depends on the answer of the user
syntax: return = MsgBox(prompt:= “...“ , title:= “ ...“] ... )
· or:
Input box:• displays a prompt in a dialog box, waits for the user to enter a
text or click a button, and returns a string containing the
content of the text box or the value FALSE if cancel is chosen.
syntax:
return = InputBox(prompt [,title] [,default] [,xpos] [,ypos])18
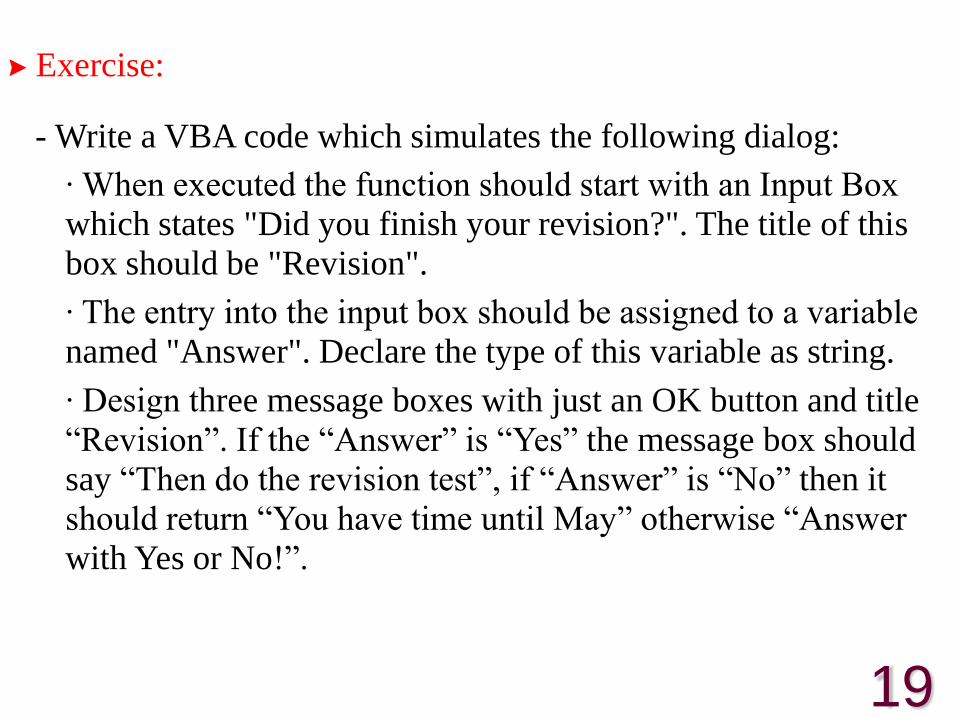
Exercise:
- Write a VBA code which simulates the following dialog:
∙ When executed the function should start with an Input Box
which states "Did you finish your revision?". The title of this
box should be "Revision".
∙ The entry into the input box should be assigned to a variable
named "Answer". Declare the type of this variable as string.
∙ Design three message boxes with just an OK button and title
“Revision”. If the “Answer” is “Yes” the message box should
say “Then do the revision test”, if “Answer” is “No” then it
should return “You have time until May” otherwise “Answer
with Yes or No!”.
19

Sub revision()
Dim Answer As String
Answer = InputBox(“Did you finish your revision?”, “revision”)
If Answer = “Yes” Then
MsgBox (“Then do the revision test!”, “revision”)
ElseIf Answer = “No” Then
MsgBox (“You have time until May”, “revision”)
Else
MsgBox (“Answer Yes or No!”, “revision”)
End If
End Sub
You will find more complicated MsgBox examples in former years
exams! (see also the notes for lecture 7)
Some programs use GOTO to go back to a certain place in the
program! (see the notes for lecture 7).
20
Customized User Forms (CUF)
CUF are user defined dialog boxes
(similar to MsgBox and InputBox, but far more flexible)
Creating and designing a CUF:
- Select Insert UserForm
a new user form object with the default name
“UserForm1” is created
- Open the VBA editor
- By using the ToolBox, many different types of Controls
can be added to the form
21
22
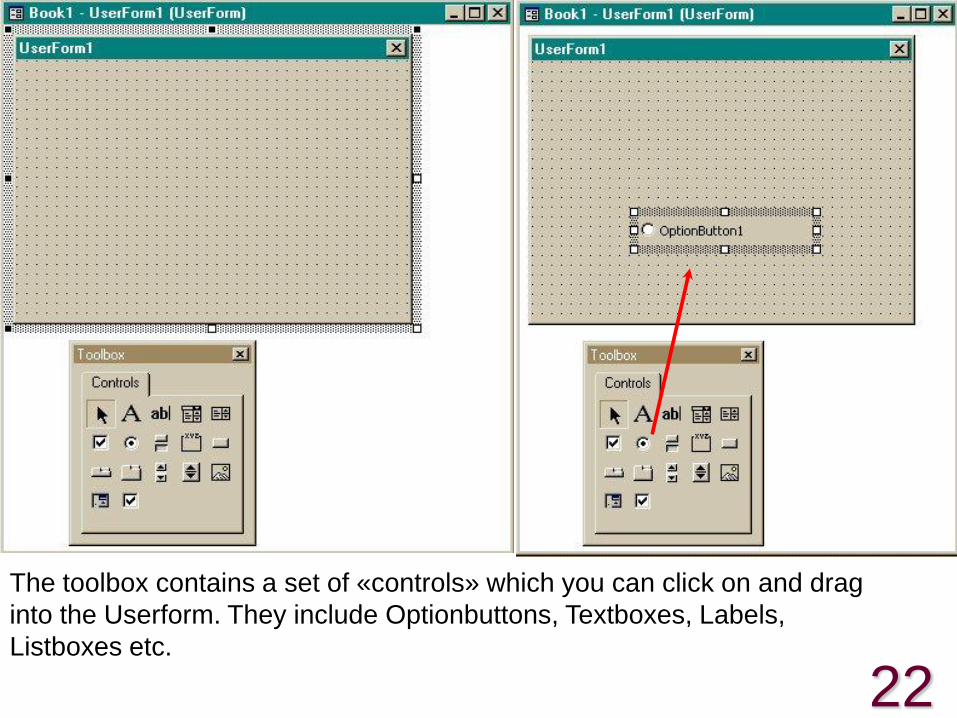
The toolbox contains a set of «controls» which you can click on and drag
into the Userform. They include Optionbuttons, Textboxes, Labels,
Listboxes etc.

23
Example:
•Create a Customized UserForm which contains a ListBox,
two TextBoxes and three Labels.
•The ListBox should be associated to a two-dimensional array
called A consisting of 2 columns and 2 rows with values
A(1,1)=1, A(1,2)=6, A(2,1)=5 and A(2,2)=9.
•The UserForm should be linked to a program, which when
run would display the value of the determinant of the Matrix A
in the first TextBox and its trace in the second TextBox.
•Finally there should be one Label “A=“ to the left of the
ListBox, a Label “Det(A) =“ to the left of the first TextBox and a
Label “Tr(A)=“ to the left of the second TextBox.
24
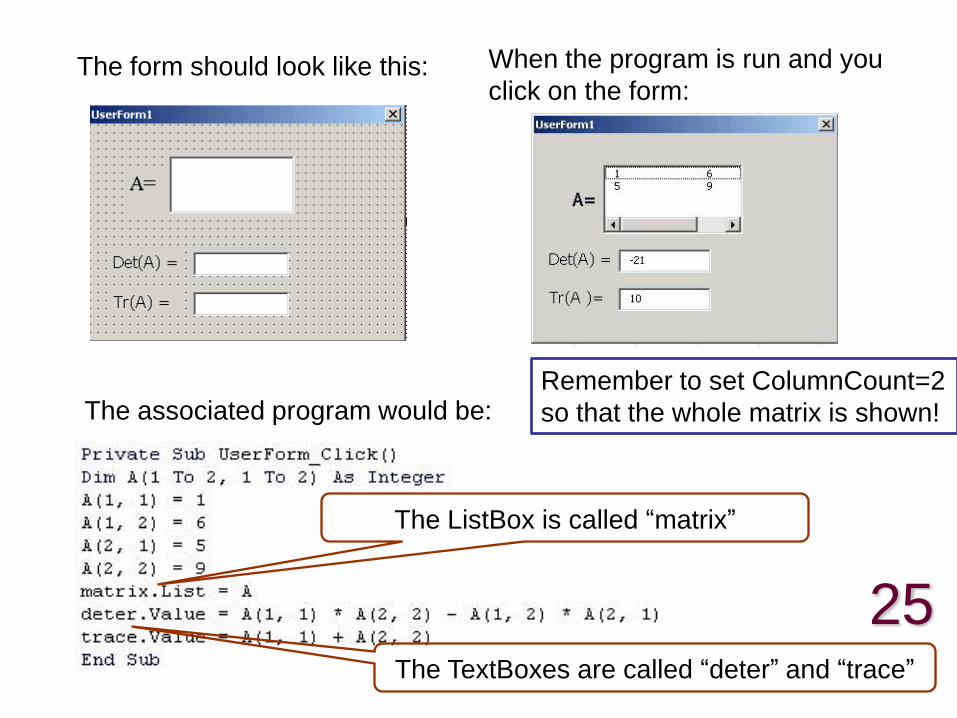
The form should look like this:
The associated program would be:
The ListBox is called “matrix”
The TextBoxes are called “deter” and “trace”
When the program is run and you
click on the form:
Remember to set ColumnCount=2
so that the whole matrix is shown!
25

The progress test date is April 28th, 10-11:30 am
It is an open book exam. You may use your lecture notes as well as task- and
solution-sheets from previous lab-sessions. Books will not be allowed.
You will be able to use a computer to verify your answers. You will have to
write your answers in the booklet provided.
The exam will consist of 4 questions. Each questions carries 25 marks. Full
marks may be obtained for correct answers to all four questions.
To avoid possible accusations of cheating all applications except Excel & VBA
must be closed before and during the exam.
The final mark for the module will be the average of the marks of the 1st and
2nd progress test. This average must be at least 40 in order to pass.
About the progress test
26