ProgrammeResponseInvestor CDP 2010
55
CDP 2010 Investor CDP 2010 Information Request Carbon Disclosure Project The Westpac Group Module: Introduction Page: Introduction 0.1 Introduction Please give a general description and introduction to your organization. The Westpac Group is a financial services company with operations in Australia, New Zealand and the near Pacific, and maintain offices, in key financial centres around the world. We are ranked in the top 5 listed companies by market capitalisation on the Australian Securities Exchange (ASX). As at 31 March 2010, our market capitalisation was $83bn (AUD). We have five key customer facing divisions through which we serve around 10 million customers in institutional, business and retail banking, wealth management and insurance. These are: Westpac Institutional Bank (WIB) St.George Bank (StG) Westpac Retail & Business Banking (WRBB) Westpac New Zealand (WNZ) BT Financial Group (BTFG) and are referred to throughout this submission. Sustainability is a core component of Westpac’s culture and a key component of our corporate strategy. A crucial part of this is managing our environmental impact - and dealing with the critical issue of climate change. Climate change will have significant economic, social and environmental impacts in the regions in which we operate. This means that our investment, lending and development decisions must take these impacts into account - but we also expect to drive shareholder value through our response. We were amongst the first Australian companies to take action on climate change: publicly reporting our emissions since 1996; responding to the CDP each year since it began; and with a history of calling for early action on climate change from government and the broader business community. In 2008, we launched a five-year climate change strategy building on our existing activities, together with our position statement ‘Transitioning to a low a carbon economy’. Our work focuses on five key areas by working throughout our value chain. (1) Managing our own environmental footprint. Building on the 40% emissions reduction achieved between 1996 and 2008 to target a further 30% reduction by 2013 and to account for more of our indirect impacts. (2) Employee engagement. Raise awareness of climate change issues and support employees in developing local and personal responses. (3) Risk and capacity building. Equipping our people with the knowledge and tools to explicitly incorporate climate change into business decision making. (4) Products and services. Develop product and services to support positive environmental outcomes and engage with customers to help them reduce their climate impacts. (5) Communication and advocacy. More broadly we seek to drive awareness and action in the community and amongst business and policymakers to help the transition to a low carbon economy. Ultimately all parts of the economy will need to collaborate to effectively address climate change. For further information on the Group see www.westpac.com.au 0.2 Reporting Year Please state the start and end date of the year for which you are reporting data. Enter Periods that will be disclosed Tue 01 Jul 2008 - Tue 30 Jun 2009
Transcript of ProgrammeResponseInvestor CDP 2010

CDP 2010 Investor CDP 2010 Information RequestCarbon Disclosure Project The Westpac Group
Module: Introduction
Page: Introduction
0.1
Introduction Please give a general description and introduction to your organization. The Westpac Group is a financial services company with operations in Australia, New Zealand and the near Pacific, and maintain offices, in key financial centres around the world. We are ranked in the top 5 listed companies by market capitalisation on the Australian Securities Exchange (ASX). As at 31 March 2010, our market capitalisation was $83bn (AUD). We have five key customer facing divisions through which we serve around 10 million customers in institutional, business and retail banking, wealth management and insurance. These are: Westpac Institutional Bank (WIB) St.George Bank (StG) Westpac Retail & Business Banking (WRBB) Westpac New Zealand (WNZ) BT Financial Group (BTFG) and are referred to throughout this submission. Sustainability is a core component of Westpac’s culture and a key component of our corporate strategy. A crucial part of this is managing our environmental impact - and dealing with the critical issue of climate change. Climate change will have significant economic, social and environmental impacts in the regions in which we operate. This means that our investment, lending and development decisions must take these impacts into account - but we also expect to drive shareholder value through our response. We were amongst the first Australian companies to take action on climate change: publicly reporting our emissions since 1996; responding to the CDP each year since it began; and with a history of calling for early action on climate change from government and the broader business community. In 2008, we launched a five-year climate change strategy building on our existing activities, together with our position statement ‘Transitioning to a low a carbon economy’. Our work focuses on five key areas by working throughout our value chain. (1) Managing our own environmental footprint. Building on the 40% emissions reduction achieved between 1996 and 2008 to target a further 30% reduction by 2013 and to account for more of our indirect impacts. (2) Employee engagement. Raise awareness of climate change issues and support employees in developing local and personal responses. (3) Risk and capacity building. Equipping our people with the knowledge and tools to explicitly incorporate climate change into business decision making. (4) Products and services. Develop product and services to support positive environmental outcomes and engage with customers to help them reduce their climate impacts. (5) Communication and advocacy. More broadly we seek to drive awareness and action in the community and amongst business and policymakers to help the transition to a low carbon economy. Ultimately all parts of the economy will need to collaborate to effectively address climate change. For further information on the Group see www.westpac.com.au
0.2
Reporting Year Please state the start and end date of the year for which you are reporting data.
Enter Periods that will be disclosed
Tue 01 Jul 2008 - Tue 30 Jun 2009

0.3
Are you participating in the Walmart Sustainability Assessment? No
0.4
Modules As part of the Investor CDP information request, electric utilities, companies with electric utility activities or assets, companies in the automobile or auto component manufacture sectors and companies in the oil and gas industry should complete supplementary questions in addition to the main questionnaire. If you are in these sectors, the corresponding sector modules will be marked as default options to your information request. If you have not been presented with a sector module that you consider would be appropriate for your company to answer, please select the module below. If you wish to view the questions first, please see www.cdproject.net/cdp-questionnaire.
0.5
Country list configuration Please select the countries for which you will be supplying data. This selection will be carried forward to assist you in completing your response.
Select country
Australia New Zealand United Kingdom Rest of world (Pacific Banking)
0.6
Please select if you wish to complete a shorter information request.
Further Information
Please note that Rest of the World refers to our Pacific Banking operations which includes 5 nations and less than 2% of overall emissions.
Attachments
Module: Governance
Page: Governance
1.1
Where is the highest level of responsibility for climate change within your company? Board committee or other executive body
1.1a
Please specify who is responsible. Individual Board Member
1.1b
Select the lower level department responsible.
1.2
What is the mechanism by which the board committee or other executive body reviews the company’s progress and status regarding climate change? The Board Sustainability Committee (BSC) and Executive Team (ET) endorsed our 5 year climate change strategy and review progress 3 and 4 times a year respectively. The BSC oversees climate change performance in a number of ways, including regular metrics reporting, updates on strategy implementation, papers on specific issues, education and training and broader based discussions with internal and external experts. Regularly reported metrics and items include: • Scope 1, 2 & 3 emissions levels • Product development to assist customers in reducing their own emissions • Progress in incorporating carbon considerations into credit and risk processes • Our advocacy position and activities • Emerging regulation and the Group’s response. Papers are also presented on specific issues, including analysis of the short and medium term risk to our insurance business and the results of client engagement on emerging emissions trading legislation. A new addition to the meeting format over the last 2 years has been the introduction of a workshop discussion between the BSC and ET with input from external and internal experts on specific issues, including a session specifically on climate change. Carbon training was also conducted with these groups during 2009/10. There are a number of other mechanisms across the business that feed into our approach to climate change governance. These are summarised below, in the attached diagram and discussed in ques 2.1. Our Sustainability Council meets monthly and consists of senior representatives from each of the divisions. It has oversight of the implementation of the Group’s sustainability strategy. Divisions with lead responsibility for specific aspects of climate change also have governance forums in place with updates provided to the Council and the Executive Team and BSC. For instance, Group Property track progress and review options for meeting our emissions reduction targets via the Facilities Governance Forum. A similar model is in place in New Zealand where the Environmental Steering Committee, chaired by the CFO monitors emissions management. The bimonthly Westpac Institutional Bank (WIB) Carbon & Water forum sets the direction of carbon-related activities for the institutional bank. It is chaired by the WIB Group Executive, and includes executives from all divisions within the institutional bank. Two sub-committees have been established on carbon risk and renewable energy to formally integrate carbon & water risk assessment into our credit risk systems & processes and implement our renewable energy investment strategy. A similar model has been established within Westpac Retail & Business Banking (WRBB) chaired by the Chief Executive, Commercial and Agribusiness. Membership consists of representatives from risk, marketing, sustainability and the WIB forum, to develop responses to the specific needs of the agricultural and forestry sectors. A sub-committee of carbon champions has been established with state representatives to focus on local level climate change impacts. Similarly a sustainability

committee has been established within the Product & Operations division consisting of general managers and other senior leaders to look at a range of areas including product development, supply chain and risk. Sustainability considerations are embedded within the criteria of key decision making processes across the Group. Most well known is our supplier assessment process which require all suppliers to provide details of their sustainability processes and practices, regardless of size. The responses of selected large and high risk suppliers are independently verified each year. Full details are available at (http://www.westpac.com.au/about-westpac/sustainability-and-community/governance/suppliers/sscm_questionnaire). The annual Group-wide Business Strategy Review (BSR) process has been updated to ensure that major funding decisions align with the Group’s sustainability strategy, including the anticipated carbon emissions associated with proposed activities.
1.3a
Please explain how overall responsibility for climate change is managed within your company.
Refer 1.2
1.3b
Please explain how overall responsibility for climate change is managed within your company.
Refer 1.2
1.4
Do you provide incentives for the management of climate change issues, including the attainment of greenhouse gas (GHG) targets? Yes
1.5
Please complete the table. Who is entitled to benefit from
those incentives?
The type of incentives
Chief Executive Officer (CEO) Monetary reward Corporate executive team Monetary reward All employees Monetary reward All employees Recognition (non-monetary) All employees Prize
Further Information
Our 2008/09 emissions reduction target was a shared target for our Executive Team. Performance against this target was included as part of the determination of their at risk remuneration. All employees have a component of their personal performance scorecard that relates to a sustainability measure. For a number of roles this objective relates specifically to climate change objectives and activities. Typical roles that may include a climate change specific objective include roles in sustainability, property, sourcing, institutional banking, risk, agribusiness and IT/Technology. Performance against this measure forms a component of the individual’s performance objectives and annual performance rating. For employees eligible for at risk remuneration the amount received is

linked to their annual performance rating. Percentage contributions to overall at risk vary between roles from 5% to 70%. CEO Environment Awards are available each year for an individual and team recognising their contribution to the environment. Winners receive $10,000 AUD to donate to the environmental cause of their choice. In 2009, the winning individual was an employee from the Cook Islands who has engaged with community members and local tourist organisations to educate them on their impacts on the environment and also encourages Westpac customers and employees to get involved in clean up days. In 2009, the winning team worked with the Australian Federal Government to develop an interest free Green Loan, helping families to install energy and water saving products in their home. Employees are encouraged to submit ideas on how the Group can improve its environmental footprint through a series of blogs and competitions held throughout the year. Many of the ideas have been implemented resulting in both environmental and cost savings. For instance, one million sheets of paper were saved by amending duplicate processes which saw customers receive two Financial Services Guides. The result was a 32 tonne reduction in paper consumption and associated Scope 3 emissions, as well as the end of some unnecessary frustration for customers. Employee donations to all registered charities are matched by the organisation dollar for dollar up to $10,000 each year per employee, including a number with an environmental focus. An internal champions program also rewards members with invitations to special briefings and the opportunity to trial environmental initiatives in their workplace. Attendance at climate and carbon information sessions count towards professional education requirements.
Attachments
Module: Risks and Opportunities
Page: Risks & Opportunities Identification Process
2.1
Describe your company’s process for identifying significant risks and/or opportunities from climate change and assessing the degree to which they could affect your business, including the financial implications. Climate change risks & opportunities are identified & prioritised via both traditional risk mechanisms & specialised processes. High risk & opportunity items are reported to the Board Sustainability Committee and managed by the relevant divisional forums. Westpac has viewed climate change as a material issue, using these processes for more than a decade and has in place a climate change strategy to respond (see link). Strategy planning: Group Strategy manage the development of organisational strategy and conduct environmental scanning both internally and externally drawing on a number of the risk frameworks described below. In November 2007, it led a strategic offsite that confirmed our commitment to sustainability leadership as part of business strategy. Stakeholder engagement framework and strategic partnerships: Engagement with external stakeholders, and the application of the AA1000 inclusivity principle, has been key to our understanding of climate impacts. Our flagship mechanism, the Community Consultative Council (CCC), takes place annually and includes the Australian CEO’s of leading environmental NGOs and divisional Westpac CEOs. A range of sustainability issues & potential impacts are discussed. Specific stakeholder engagement sessions are held to improve our understanding of highlighted issues, for instance soil carbon. Participation in collaborative research projects has also enhanced our own understanding of climate risks & opportunities and their potential impact for Westpac. Most notably was 'The Business Case for Action on Climate Change', 'The Future of Energy in Australia' and 'Stepping Up' reports which included assessment of macro economic impacts and required investment opportunities. Globally, our

continued involvement in the UNEP FI and UN Global Compact helps us connect with like-minded organisations. In 2010 we launched a 3 year partnership with the Climate Institute to explore emerging issues and will include a secondment program and specific research projects. Materiality process: Westpac has used the AA1000 Assurance Standard across its operations since 2001, including the principle of materiality. A number of internal & external data sources feed into the identification and prioritisation of material issues for the business. A draft materiality matrix is developed by the Group Sustainability team. The draft is then subject to an internal governance process and endorsed by the Board Sustainability Committee. The matrix is publicly reported (attached). Environmental Management System: Our EMS, consistent with ISO 14001, has been in place since 2001. It has been independently reviewed to test its effectiveness in capturing emerging business risks and opportunities and the development of resulting action plans. Regulatory risk framework: Regulatory developments within our areas of operations and around the world are monitored by Group Compliance & Regulatory Affairs and their reports are logged in a Regulatory Risk Register. Each item is assigned to and managed by a business division, including the management of any compliance costs, and includes many of the regulations discussed in q3. Reputation Risk Framework: Our reputation risk framework identifies key risks, their underlying drivers/causes and materiality, and the effectiveness of risk mitigation and management. This includes carbon and water. Whilst issues can be identified and escalated at any time, risks are formally reported, discussed & agreed quarterly with the Group Operational Risk & Compliance Committee consisting of the Executive Team. Credit Risk: Credit policy is managed by Group Risk & endorsed by the Enterprise Risk Leadership Team that consists of divisional and functional risk general managers. The identification of the need to address broader ESG risks saw a formal review in 2007 by KPMG and has led to the completion of a Group ESG Credit Policy. Specific carbon risks/opportunities are monitored by the WIB, and WRBB Carbon and Water Forums (see 1.2). A Carbon Risk Sub-Committee incorporates carbon risk into credit risk assessments and seeks to better understand the risks in individual sectors and transactions. The Renewable Energy Sub-Committee explores opportunities in this emerging area. This process has been supported by a dedicated client engagement program undertaken with clients identified as high risk across industry sectors.
Further Information
Attachments
Page: Regulatory Risks
3.1
Do current and/or anticipated regulatory requirements related to climate change present significant risks to your company? Yes
Do you want to answer using: The table below

3.2A
What are the current and/or anticipated significant regulatory risks related to climate change and their associated countries/regions and timescales?
Risk
Region/Country
Timescale in Years
Comment
International agreements
Other: All areas of operation
Current
Many critical aspects of domestic, national and regional policy and regulatory frameworks to reduce emissions in all our areas of operation are framed by the international agreement, as currently set out by the Kyoto Protocol. This includes national emission reduction targets and global carbon market mechanisms which feed into domestic emissions trading regimes. More intangibly, is a global momentum for consistent and clear regulatory responses to climate change. While many significant advances were achieved at Copenhagen, the failure to secure a strong internationally binding agreement, and the lack of clarity over specific aspects of the international carbon trading mechanisms, have generated greater regulatory uncertainty in jurisdictions where Westpac operates.
Cap and trade schemes Australia Current
This is by far the most significant area of regulatory risk and opportunity for the Group. A number of significant events have occurred over the last 12 months which continue to generate significant regulatory uncertainty. Most notably was the defeat of the proposed Carbon Pollution Reduction Scheme (CPRS) in Australia despite a series of amendments negotiated between the Government and the main Opposition Party, including a fixed price in the first year. A federal election in Australia is due in 2010, and this is creating further uncertainty in the domestic political and regulatory debate around climate change. The Government has confirmed that it would be delaying legislation to implement the CPRS until after the election and has removed it from the list of Bills to be considered by the Senate and from three year forward estimates. Beyond this, the Government appears unwilling to commit to any further detail on when or how it would move implement the CPRS.
Cap and trade schemes
New Zealand Current
The New Zealand Government has committed to an emissions reduction target band of between 10% & 20% below 1990 levels. In late 2009 it passed the Climate Change Response (Moderated Emissions Trading) Amendment Bill. The NZETS covers forestry, stationary energy, industrial processes, liquid fossil fuels and, unlike most schemes, agriculture. Forestry has been covered since 01-Jan- 2008 and has recently begun to receive allowances. During the initial transitional period, ending 31 December 2012, a price cap of NZ$25 will be in place. After this the market will move to a full floating price. A review of the NZETS is scheduled for mid-2011 and there is concern that without greater progress in the international environment there will be further debate around extending the preliminary transitional period which continues to impact the emergence of the market.
Emission reporting obligations
Australia Current
Within our major geographies of operation mandatory reporting legislation is most advanced in Australia through a number of national and State-based Acts already in place. However, we expect that this will

Risk
Region/Country
Timescale in Years
Comment
follow in other areas, particularly in New Zealand. Most notably in Australia are the National Greenhouse and Energy Reporting Scheme (NGERS) and the Energy Efficiency Opportunities Act (EEO). The Westpac Group triggered the reporting thresholds for both schemes in 2009. In addition is a NSW state scheme, the NSW Energy Administration Amendment (Water & Savings) Act 2005 (EAA) under which we have submitted water and energy savings action plans for three of our sites that have triggered the reporting threshold.
Product labeling regulations and standards
Australia Current
From 2010 the National Australian Building Energy Ratings Scheme (NABERS) rating of the base building of a corporate building must be disclosed at the time of sale, lease or sub-lease for office space over 2,000 square metres. This has been done to improve market transparency and create market mechanisms for promoting energy efficiency. This has direct impacts for the Group both for the buildings it directly owns or holds in property trusts as well as a tenant seeking new premises.
General environmental regulations, including planning
Australia Current
There have also been a series of recent policy developments by Australian State governments in relation to sea level rise. In late 2009 the New South Wales State Government released a Sea Level Rise Policy Statement which adopts sea level rise planning benchmarks of 40cm by 2050 and 90cm by 2100. Draft guidelines to assist local councils in preparing and adapting to sea level rises were also released for comment. It is expected that these will flow into Local Environment Plans and planning decisions. Already over the last 12 months an increasing number of local councils have rejected building applications on low level coastal areas due to concerns of future sea level rises.
Indirect exposure through suppliers and clients
Other: Australia and New Zealand
Current Please see comments relating to cap and trade schemes, product labelling and general environmental regulations in this section.
Uncertainty surrounding new regulation
Other: Australia and New Zealand
Current
Please see specifc comments relating cap and trade schemes above. In additional have been recent policy changes in Australia, including the cancellation of a number of programs, including the Green Loan program in which Westpac had been a provider of interest free loans to householders to fund energy and water saving activities.
Carbon taxes Australia 0 -- 5
Whilst uncertainty remains surrounding the policy debate on an emissions trading scheme in Australia the possibility of a carbon tax is raised by certain sectors.
Other: Renewable Policy Australia Current
Legislation to introduce the expanded Renewable Energy Target scheme was finalised in August 2009, including a legislated target of 45 000 GWH by 2020, up from 9,000 GWh previously. This is expected to drive approximately $25 billion worth of new investment in the period up to 2020. Since then a number of amendments to the scheme have been proposed ,as the revised RET framework created structural difficulties in the Renewable Energy Certificate (REC) market by including both small scale household level projects and large scale renewable energy projects. Under the household ‘Solar Credits’

Risk
Region/Country
Timescale in Years
Comment
stream, a small-scale solar photovoltaic (PV), wind or micro-hydro system was able to create five times as many RECs as under the standard deeming arrangements. This resulted in a flood of Solar Credits entering the market, pushing down the REC price and undermining the investment business case for large scale renewable energy projects. From 1 January 2011, the existing scheme will be separated into two separate streams – the Small-scale Renewable Energy Scheme (SRES) and the Large-scale Renewable Energy Target (LRET). This had an immediate impact on REC market prices and is expected to bring forward significant volumes of large scale renewable energy investment that had previously been stalled. The 2010 Federal Budget, released May 2010, also announced that the Government will direct $652 million towards a new renewable energy fund. This is discussed further in our response to question 6.1
Other: Offset standard Australia Current
The National Carbon Offset Standard (NCOS) was released in January 2010 and is intended to come into effect in Australia on 1 July, 2010. It is designed to provide guidance on the voluntary offset market and carbon neutrality claims. Whilst providing greater certainty on the types of offsets to considered within a voluntary carbon market it was also designed to be linked to as yet to be approved emissions trading scheme. Given the recent Government announcement on the implementation of the CPRS (see above), it remains unclear, at this stage, what impact this will have on the finalisation of the NCOS framework and the state of the voluntary market as a whole, including the current Greenhouse Friendly program. As The Westpac Group has focused on achieving aggressive emissions reduction targets rather than offsetting its activities there is little direct risk to the business.
3.2B
What are the current and/or anticipated significant regulatory risks related to climate change and their associated countries/regions and timescales?
3.3
Describe the ways in which the identified risks affect or could affect your business and your value chain. The regulatory risks described above have the potential to impact compliance requirements around our direct operations, create new commercial dynamics across impacted industry segments within our customer base, require new demand for carbon market products and risk management solutions and impact finance and investment funding requirements and viability. International agreements - Lack of clarity around a post-Kyoto agreement increases the risk of regulatory uncertainty within our domestic markets as Governments adopt a wait and see approach.

These risks, and indeed the most material of Westpac's regulatory risks, are indirect through their impacts on our customers, and to a lesser extent, suppliers. Emissions trading - As described above this remains an area of uncertainty which continues to exacerbate current and ongoing investment uncertainty for impacted industries and generate volatility in electricity markets. The impact of these regulatory risks will likely include: •Ongoing regulatory uncertainty impacting investment decisions •Increasing impact of additional policies and regulation in clean energy and energy efficiency to achieve national emission reduction commitments •Ongoing requirement for Westpac to work with customers to assist in managing short term regulatory risk, future carbon risk impacting the viability of investment decisions (both negatively and positively) and carbon market risk implications. Prior to the defeat of the legislation there was a market expectation that the Federal Government would have to delay the CPRS by at least 12 months to reflect the timing requirements of implementing the CPRS. This had been factored into recent business planning and decision-making processes. However, lack of clarity over the legislative timetable and implementation date as well as potential flow on effects to the NZETS review continue to generate substantial regulatory risks for Westpac and its customers. Renewable Policy - Westpac has sought to provide feedback on proposed amendments to the Renewable Energy Target (RET) framework from the perspective of both a financier of small and large scale renewable energy projects or transactions and as a financial market participant. Westpac’s involvement in the renewable energy market includes: •Financial relationships with energy retailers likely to have significant liabilities to acquit SRECs and RECs •Financial relationships with EITEs with residual liability to acquit SRECs and RECs •Financing for large scale renewable energy projects likely to benefit from the sale of RECs to liable entities •Financing for small businesses involved in the installation of small generation and solar hot water units that will benefit from SRECs •Portfolio trading in electricity, RECs, carbon and other commodities, carbon and energy markets. As such there is significant risk to us in these roles if the market does not function well. In providing feedback, Westpac has generally applied an approach of supporting the removal or adjustment of structural measures that are currently inhibiting the effective functioning of market mechanisms whilst preserving those market attributes which are well-established via the existing REC market. Emissions reporting obligations - The Westpac Group has been publicly reporting emissions data since 1996. Whilst some of the boundaries and scope of our reporting has changed in line with the Acts described above generally speaking our experience in emissions reporting provided a useful background and helped in meeting our compliance requirements. This early action saw the Group under the reporting threshold requirements for many of the current pieces of legislation until an increase in our footprint following the merger with St.George Bank in 2008. Reporting guidelines have been developed supported by an online reporting tool to help meet our compliance regulations. This, combined with our ongoing commitment to annually verifying this information has lessened the risk of non-compliance . Council decisions on planning zones - Changes to planning laws has the potential to impact major property or infrastructure projects in addition to mortgage and insurance portfolios at the residential level. Work is underway through the risk teams to examine potential associated operational and credit risks. Geographic mapping work of our mortgage portfolio has been completed and will be assessed against current government research.
3.4
Are there financial implications associated with the identified risks? Yes
3.5
Please describe them.

Non-compliance with many of the reporting schemes described above has significant financial penalties attached. For instance, NGERS non-compliance can result in fines of $220,000 as well as daily penalties for failing to register. Indirectly, and more substantially, are costs associated with the lack of clarity around a carbon price when making lending and investment decisions. Similarly are risks associated with changes to planning laws which may result in lost revenue and delays in major projects. Work to mitigate these risks and improve our assessment of carbon risk is described in 3.6. Finally is the risk to successfully undertake busines in emerging markets such as those supported by the renewable energy scheme. This is discussed in more detail in the opportunities section.
3.6
Describe any actions the company has taken or plans to take to manage or adapt to the risks that have been identified, including the cost of those actions. We have adopted an approach of embedding active management of carbon risks & opportunities within business-as-usual (BAU) product development, risk management and other processes. This makes it difficult to separate specific costs associated with responding to these regulatory risks as they have been absorbed with BAU expenditure. Our main areas of action are summarised below. Government engagement - We remain a strong proponent of market based mechanisms and details of our ongoing engagement are detailed in 9.11. Governance and oversight mechanisms - Westpac has a number of executive & operational governance mechanisms to manage our response to these and other risks (refer 1.2). This includes the management of related costs and investments. For instance, the Facilities Management Governance Forum and has oversight of our compliance with mandatory reporting requirements (see NGER report attached) and abatement cost curve detailed in the opportunities section. Additional examples are provided in ques 2.1. Regular communication, education & capacity building - with employees & customers to help them understand and manage these risks. Regular analysis & updates are distributed to employees in Australia and New Zealand. More specific analysis of regulatory developments are distributed to key relationship managers and impacted industry teams and to credit risk officers, to facilitate the adjustment of credit policies or processes. Regular customer updates discuss key regulatory developments and significant events and employees regularly speak on carbon issues & impacts at mainstream conferences and customer information sessions. We have also completed an extensive round of customer engagement to help understand and manage their carbon risk. Credit policies, processes and client engagement – Westpac has adapted credit policies & processes to respond to emerging regulatory challenges and opportunities. As discussed in 2.1, the Carbon Risk Committee is integrating carbon risk considerations into our credit risk policies and processes. Carbon liabilities are explicitly factored into credit decisions for all high risk sectors. We work with customers to actively manage carbon risk in the structuring of innovative finance solutions to ensure both the financial and environmental sustainability of their operations in light of regulatory trends. For example, management of carbon risk is embedded within the standard coal industry sector analysis, with specific requirements to monitor and respond to the changing regulatory environment on a high frequency basis. Separate underwriting standards have been established to support greater investment in the renewable energy sector in response to the significantly changed regulatory environment under the expanded Renewable Energy Target (RET) framework. Targeted business strategies – Regulatory uncertainty has been factored into business planning & decision-making processes. We have pursued an organic growth strategy for carbon markets & carbon finance products & services, reflecting the uncertain nature of any emerging market. Westpac has been trading the EU ETS since late 2006 and are now actively trading the New Zealand Emissions Trading Scheme. By growing our carbon business in a slow and consistent manner, we believe we are well positioned to manage the regulatory uncertainties inherent in the carbon market. A Carbon Deal Team has been established within the Institutional Bank to identify practical customer solutions from the development of carbon markets and the additional climate change and carbon regulatory and market developments (clean energy, clean technology, energy efficiency and forestry for example). This team will play an important role in working with customers to manage carbon issues and impacts as regulatory frameworks firm up. Since re-invigorating our renewable energy strategy in 2008, Westpac has been involved in almost every large scale renewable energy infrastructure project undertaken. Currently an estimated 50% of our infrastructure and utilities financing is directed towards renewables (including hydro), totalling $1,110m and publicly reported in our 2009 Annual Review & Sustainability Report.

3.7
Please explain why you do not consider your company to be exposed to significant regulatory risks - current and/or anticipated.
3.8
Please explain why not.
Further Information
Attachments
https://www.cdproject.net/Sites/2010/51/19051/Investor CDP 2010/Shared Documents/Attachments/InvestorCDP2010/RisksOpportunities-RegulatoryRisks/NGER Annual Report 2009GC_ 091023[1].pdf
Page: Physical Risks
4.1
Do current and/or anticipated physical impacts of climate change present significant risks to your company? Yes
Do you want to answer using: The table below
4.2A
What are the current and/or anticipated significant physical risks, and their associated countries/regions and timescales?
Risk
Region/Country
Timescale in Years
Comment
Changes in precipitation patterns
Other: all areas of operation Current
Note timescale is both short and long-term. Refer to the further information box for details of the current view on impacts within our areas of operation.
Changes in frequency of extreme weather events
Other: all areas of operation Current
Note timescale is both short and long-term. Refer to the further information box for details of the current view on impacts within our areas of operation.
Induced changes in
Other: all areas of operation Current Whilst some experience of this risk is current it is
deemed to increase over time. Refer to the further

Risk
Region/Country
Timescale in Years
Comment
human and cultural resources
information box for details.
Induced changes in natural resources
Other: all areas of operation Uncertain
Particularly in relation to agriculture and high water industry users within our value chain. Refer to the further information box for details.
Induced changes in supply chain and/or customers
Other: all areas of operations Current
Immediate impacts have been felt through the impacts of weather events on customers as well as water scarcity issues in the agricultural sector.
4.2B
What are the current and/or anticipated significant physical risks, and their associated countries/regions and timescales?
4.3
Describe the ways in which the identified risks affect or could affect your business and your value chain. The key direct impacts of physicals risks can be summarised as: - damage to our physical sites and in some instances the need to relocate them, due to weather events and sea level rise - increased pressures on air conditioning and therefore energy consumption - human health impacts on our employees, for instance heat stroke or from diseases that typically follow natural disasters - impacts to business continuity through impacts to our own sites or those of suppliers - impacts to business continuity if employees are impacted and potentially unable to come to work either through impacts to their own homes or transport networks The key indirect impacts include: - increased need to provide financial relief packages to customers and charitable to donations to relief efforts for weather events - potential need to write down assets due to increased physical risks - impact of physical risk on key industry sectors potentially reducing their profitability, including agriculture and tourism - increased stress on the insurance business through increased weather events - risks to key infrastructure assets, both which we have a financial stake in or that contribute to economic growth (for instance transport infrastructure)
4.4
Are there financial implications associated with the identified risks? Yes
4.5
Please describe them. There are a number of financial implications associated with physical risks - both directly through impacts on our own operations and indirectly through impacts on our customers and suppliers.

Although it is difficult to attribute any single event to climate change we would anticipate that demand for financial relief packages for customers in natural disaster areas will increase. The Group already provides relief packages for customers following the formal declaration of a natural disaster area. This relief package has been made available to 15 communities within our areas of operation since January 2009. This is in addition to ongoing relief packages and independent counselling available to farmers in drought affected areas. The relief package offers: -Affected customers with Westpac home loans may apply to defer repayments for up to three months -Affected businesses with existing loans can request loan restructuring without incurring the usual bank establishment fees -Affected credit card customers may request an emergency credit limit increase -Affected customers with Westpac personal loans can apply to refinance their loan at a discounted fixed interest rate -The Group will waive interest penalties for affected customers wishing to withdraw term deposits -General insurance assessment and decisions will be fast tracked In addition we often make donations to impacted communities to assist in the relief effort and expect that as the number of events increases so too may the number of donations made. Over time we would expect that in some instances where the impact has been severe, we may need to write off assets impacted by severe weather events. This is of particular concern where events occur in areas where building codes, for instance, may not require properties to be cyclone proof. This has potential impacts to both our lending and insurance businesses. A number of key sectors of the economies where we operate are particularly susceptible to the impacts of climate change including agriculture, tourism and minerals and resources. Therefore depending on the adaptation plans these industries put in place we would expect their risk profile to increase. The Group is also at risk of losses within our own premises, through both the costs of repair and work days lost. For instance the 2009 flooding in Fiji destroyed one of our branches. Similarly there are also costs associated with having to evacuate premises, although not directly related to climate change, during tsunami alerts in the Pacific region last year across many of our Pacific operations were evacuated. A further 25 branches experienced power outages during recent storms in Perth on the Western Australian coast. A small number of these also experienced minor leaking. Business continuity may also be interrupted by employees needing to secure their own properties or serve as volunteers during times of natural disaster. There are specific provisions within our Community Volunteering Policy for employees involved in the State Emergency Service, Rural Fire Service or other emergency organisations, whereby extended leaves of absence may be available. Also of concern is the potential for illness or injury in the days following a weather event due to water borne and other diseases and the movement south of disease such as Ross River Fever as temperatures increase and the impacts on employee health.
4.6
Describe any actions the company has taken or plans to take to manage or adapt to the risks that have been identified, including the cost of those actions. Physical risks to Westpac are both direct & indirect and short & long term in their nature. Our response therefore encompasses both immediate requirements, for instance business continuity planning for weather events, as well as long term adaptation planning to understand the risks to our customers, and in turn potential increased risks to Westpac. In addition to the activities described in 4.5, over the last 12-18 months, we have increasingly engaged with customers to better understand their requirements and responses around adaptation planning and physical risk management. Our response to the longer term trends is primarily being assessed by Carbon & Water Forums in WIB and WRBB. This includes representatives from credit and work includes changes to the credit manual to reflect regulatory impacts but also longer term climate trends, particularly in relation to water scarcity & agriculture. This follows on from the development of an agribusiness & regional banking strategy in which climate change is a key area of focus. Sector strategies for main areas of agricultural operations have been updated to include physical impacts of climate change.

Westpac is participating in a number of multi-party working groups to examine climate & water impacts and the integration of specific risk considerations into business-as-usual credit risk assessment processes. These include the CEO Water Mandate, the Water Stewardship Initiative, UNEP FI working groups & the UN Global Compact work on environmental stewardship. The main costs associated with these activities are in the form of membership fees to these organisations. Locally, we are also active in the Agricultural Alliance, and undertake research in partnership with a range of expert organisations including the Climate Institute & the Australian Conservation Foundation. In late 2009, a specific session on physical risk & likely impacts within Australia was run for credit & risk officers across the Group. Over 150 employees attended the presentation, developed by Tony Coleman, former Chief Risk Officer of Insurance Australia Group, & recently appointed member of the Australian Carbon Trust Board of Directors. Our wealth management business, BT, is also a signatory to the UN PRI and is implementing the Principles across its business, including environment and climate. As well as gaining a better understanding of the likely risks to it also important to continue to advocate for mitigation & adaptation efforts more broadly across the global economy. The Group has been using its influence as one of the largest listed companies in Australia to advocate for structural changes to reduce the levels of physical risk. This has included lobbying for effective policy responses (see 9.11), engaging & educating our own employees and providing products & services that help our customers reduce their own emissions levels. Westpac Retail & Business Banking (WRBB) has traditionally supported rescue services, both in Australia & New Zealand, through our long-term partnerships with rescue helicopters and Surf Lifesaving. This year our support has taken on a more explicit adaptation focus with support for a spotter plane in Victoria to assist in the detection & monitoring of bush fires. We have recently completed a review of short term risk to our insurance business as well as a mapping exercise of all mortgage assets. The next step is to review against climate predictions to assess potential levels of exposure in due to physical risk. This will also be repeated for non-housing assets, including infrastructure and agricultural crops. Our current business continuity planning addresses significant natural events & our online compulsory health & safety training modules includes specific information on what to do in the event of severe weather events including storms. With the number of high temperature days already increasing, advice is also available via the intranet for all employees to help prevent the onset of heat stress as well instructions on how to identify and treat the symptoms. Building audits have also looked at options to improve insulation and water collection, particularly in sites in southern Australia. As part of our supplier screening major suppliers are required to have in place business continuity plans of their own and selected suppliers may need to submit a copy to the Group each year for review and/or approval. In 2010, Westpac will be finalising a more comprehensive approach to Adaptation Risk Management for our operations and our customers, which incorporates insights experienced and work undertaken to date.
4.7
Please explain why you do not consider your company to be exposed to significant physical risks - current and/or anticipated.
4.8
Please explain why not.

Further Information
As outlined in our position statement on climate change released in 2008 and in previous responses to CDP, we anticipate significant changes within our areas of operation over the near and long-term. The statement draws upon the work of the Intergovernmental Panel on Climate Change (IPCC), as well as domestic research undertaken within Australia, New Zealand and the Pacific, to identify projected impacts and emerging physical risks for the jurisdictions in which we operate. We anticipate that the near term physical effects of climate change will include drought, warmer than average weather, heatwaves and an increased frequency of severe weather events. In the longer term, severe weather events are expected to continue to have a widespread impact posing risk to property and facilities, while higher than average temperatures have the potential to result in increased incidences of tropical diseases across the continent with ensuing health impacts. This reflects a number of prevailing economic, social and environmental conditions. The Australian and New Zealand climates are already highly variable and pre-disposed towards extreme weather events, whilst their ecosystems are finely balanced and often unique. In addition, populations are densely concentrated in a relatively small number of larger coastal cities which are potentially exposed to rising sea levels and storm surges. Lastly, many of the economies where we operate are dominated by agriculture, tourism and carbon intense export industries such as coal and other minerals and resources. The short and long-term physical impacts for Australia have most recently been summarised in a report released by the CSIRO and Bureau of Meteorology. The report charts temperature and rainfall changes already observed as well as likely trends and shows that: - all areas in Australia have shown some warming over the past 50 years, the highest increases occurring in central and eastern Australia - rainfall has increased in the north and decreased in the south and east - sea surface temperatures have increased by about 0.4 degrees - projects that on current trajectories average temperatures will increase by 0.6 to 1/5 degrees by 2030 and 2.2 to 5 degrees celsius by 2070. - further decreases in rainfall are likely in the south with an increase in intense rainfall events in many areas. Similarly our operations throughout the Pacific region face some of the most extreme physical risks from climate change, particularly through rising sea levels on low lying Island communities. As discussed in our previous responses, reduced rainfall, soil erosion and increased salination of coastal plains, changes in traditional fishing grounds because of warmer sea temperatures and changing weather patterns causing erratic crop production cycles and extreme weather events such as cyclones. These physical risks associated with changing weather conditions will impact large scale mining and resource extraction activities in the region, as well as localised agricultural activity and crop production, tourism and commercial fishing.
Attachments
Page: Other risks
5.1
Does climate change present other significant risks - current and/or anticipated - for your company? Yes
Do you want to answer using: The table below

5.2A
What are the current and/or anticipated other significant risks, and their associated countries/regions and timescales?
Risk
Region/Country
Timescale in Years
Comment
Reputational risks
Other: all areas of operation Current
Climate change remains a divisive public issues in many of our areas of operation. Most notably this has recently played out in the political debate in Australia, contributing to leadership changes in the main opposition party.
Market risks Other: all areas of operation Current
As with all new markets and areas of potential competitive advantage there are risks associated with determining appropriate levels of investment and focus on emerging market opportunities relative to other areas of the business and competitors.
Financial risks
Other: all areas of operation Current
The risks outlined above have the potential to result in financial risks for the organisation in addition to rising energy costs.
5.2B
What are the current and/or anticipated other significant risks, and their associated countries/regions and timescales?
5.3
Describe the ways in which the identified risks affect or could affect your business and your value chain. Communicating around climate change has always been challenging given the highly politicised debate surrounding climate change policy development and responses both locally and internationally. In addition, how organisations respond to and manage climate change issues and impacts across their business will influence their reputation and standing within the broader community. Reputational risks associated with climate change are evident through our retail banking business via customer and NGO correspondence and campaigning but also apply across our broader business and institutional banking divisions. In early 2010, further stakeholder analysis on climate change within Australia found that there is a broad public acceptance and understanding of the longstanding Westpac position on climate change, as Westpac has been advocating on key elements of the debate for over a decade. There are also high expectations that Westpac will continue to advocate its core policy positions during this period of regulatory uncertainty. This was highlighted by recent questions regarding our Australian advertising which had previously included strong environmental messages. Some commentators have expressed concerns whether our current campaign 'We're a bank you can bank on signals a shift in our priorities. However we feel that the current campaign focuses on thinking about the big issues and acting responsibly as well as being part of local communities is a more implicit demonstration of embedding sustainability into the way we do business. Management of these highly complex risks can involve competing priorities across business divisions and different interpretations of what the right outcome or preferred approach should be from an environmental perspective. An example of this was highlighted for us during the year following the announcement of our involvement as lead arranger for a desalination plant in Victoria. Whilst many governments around the world are looking to desalination as a climate change adaptation measure (particularly when the desalination plant incorporates renewable energy generation to meet increased

energy demand) there was some local community protest around the establishment of the plant. We continue to hold ongoing discussions with local community groups and other project participants to better understand and respond to these concerns in a manner which ensures we also respect customer privacy. There is also a risk that actions may exceed current demand, particularly in relation to the development of green retail banking products. Although customer support for our sustainability stance is not yet equalled with strong take-up of our specific sustainability related retail offerings, we see this as an important time to refine our offerings as this market emerges. Reputation risk is equally relevant amongst current and potential employees as it influences engagement levels as well as our ability to attract and retain employees, particularly in the context of a shrinking labour market.
5.4
Are there financial implications associated with the identified risks? Yes
5.5
Please describe them. These risks speak directly to our ability to attract and retain both customers and employees and is reflected in revenue generated or lost due to reputational and brand impacts. It can also be reflected in the costs or costs savings associated with retaining employees as well as brand valuation. In addition are the financial risks associated with rising energy costs, although this is a small percentage of our overall cost base. The broader energy reduction issue is also closely linked to reputational risk as our baseline performance is a key to our credibility in environmental markets.
5.6
Describe any actions the company has taken or plans to take to manage or adapt to the other risks that have been identified, including the costs of those actions. We believe that effective and consistent management of carbon and climate change risks and opportunities will minimise our exposure to reputational or market risk impacts. This is undertaken using the framework detailed in question 2. As an early mover in this area The Westpac Group has strong credentials in relation to its broader environmental performance and on climate change more specifically. Our performance has been recognised with our activities identified by the SAM Group and WWF as one of only six ‘mainstreamers’ in the global financial sector. Locally, we were recently awarded rating agency CANNEX and Money Magazine’s inaugural Climate Leadership Award. Our New Zealand business has promoted its sustainability activities to encourage New Zealanders to join the journey in a major brand advertising campaign highlighting the challenges of becoming more sustainable. Westpac has also adopted a prominent position in bringing liquidity and market participants into the emerging New Zealand Emissions Trading Scheme. As discussed our current campaign in Australia 'We're a bank you can bank on' campaigns focuses on broader sustainability messages around thinking about the big issues and acting responsibly as well as being part of local communities. We include information on our sustainability performance in our graduate recruitment activities and have conducted climate change workshops with leading youth membership organisations. As mentioned in 5.3 we continue to develop green retail offerings including discounts on green products for mortgage customers and green reward offerings for credit card customers in Australia and New Zealand. We also offered an interest free loan product which ran in conjunction with the Australian Federal Government.

All employees are also expected to consider the potential reputation implications of individual transactions and where required refer these to the Group Conflicts and Ethics Committee. Work around reputation risk is being undertaken in an aligned manner with the extended Environment, Social and Governance Risk framework. All potential reputational risks for our company and our brand, are carefully monitored and identified emerging or current potential reputational risks are managed through the governance and oversight processes detailed in our response to question 2.1. Westpac also has a strong and well established track record in leadership for the development and delivery practical customer solutions to promote positive environmental outcomes and we continue to engage with high risk customer segments to help them transition to a low carbon economy. The Westpac Group Sustainability Strategy, as well as specific strategies for renewables, agriculture, carbon risk, sustainable supply chain management together with other activities detailed within this submission are examples of the Group actively pursuing a strong customer focus around carbon issues and impacts and sustainability leadership more broadly. Our approach is focused on embedding the management of carbon issues and impacts within our business as usual systems and processes. As previously outlined this approach has made it difficult to extract specific investment costs.
5.7
Explain why you do not consider your company to be exposed to other significant risks - current and/or anticipated.
5.8
Please explain why not.
Further Information
Attachments
Page: Regulatory Opportunities
6.1
Do current and/or anticipated regulatory requirements related to climate change present significant opportunities for your company? Yes
Do you want to answer using: The table below

6.2A
What are the current and/or anticipated significant regulatory opportunities and their associated countries/regions and timescales?
Opportunities
Region/Country
Timescale in Years
Comment
International agreements
Other: all areas of operation 0 -- 5
The delay of a post-Kyoto agreement was previously disclosed in ques 3 as a potential risk in that it may delay action locally. Conversely the finalisation of an agreement has the potential to lead to greater clarity in national legislation and policy.
Cap and trade schemes
Other: Australia and New Zealand
Current
By far the most significant area of regulatory risk and opportunity for the Group. A number of significant events have occurred over the last 12 months which continue to generate significant regulatory uncertainty, most notably the defeat of the Carbon Pollution Reduction Scheme (CPRS) which is likely to delay opportunities. However the commencement of the scheme in New Zealand has led to opportunities described in 6.5 & 6.6.
Emission reporting obligations
Australia Current
Greater standardisation in reporting is likely to improve the quality of information for benchmarking and investment purposes. This is also anticipated to be an emerging area in New Zealand.
Product labeling regulations and standard
Australia Current
The compulsory disclosure of NABERS ratings discussed in the risks section provides an opportunity to more easily factor environmental performance into building selection when leasing new premises as well as promote the value of assets in property trusts.
Voluntary agreements
Other: all areas of operaton Current
As described in 6.7 the National Carbon Offset in Australia has potential benefits for our agribusiness customers.
General environmental regulations, including planning
Australia Current
Progress in building standards and planning requirements occurring in our areas of operation have the potential to improve our ability to price risk in this area.
Indirect exposure through suppliers and clients
Other: all areas of operation Current
The majority of regulatory impacts are indirect and therefore both risks and opportunties to our business are greatest via our customers. Examples are detailed throughout the responses to this section.
6.2B
What are the current and/or anticipated significant regulatory opportunities and their associated countries/regions and timescales?
6.3
Describe the ways in which the identified opportunities affect or could affect your business and your value chain. As outlined in 3 a number of regulatory and policy developments provide key opportunities for Westpac, namely:

• Consistency in national greenhouse & energy reporting frameworks • Emissions trading regimes • Renewable energy investment • Energy efficiency & additional tranches of regulatory reform Reporting frameworks - The move towards mandatory reporting of emissions data in Australia (see 3.1 for details) has provided a common framework for calculating & reporting Scope 1 & 2 emissions for large emitters. This has improved data quality & coverage which can be factored into lending & investment decisions. It also has the potential to improve our understanding & management of our own Scope 3 impacts through suppliers. The release of data has provided for qualitative & quantitative analysis on the energy efficiency opportunities companies are identifying & implementing. This allows us to better manage carbon risk embedded in our own client portfolio & pursue investment opportunities with a clearer understanding of the financial & environmental implications. Emissions trading regimes – We expect that market-based carbon pricing mechanisms will consolidate their position as the preferred policy response globally post-2012. We are pursuing a strong focus on carbon market & carbon finance opportunities and continue to grow our expertise & knowledge of the market, increasing our ability to work with our customers to develop & deliver practical solutions. Ongoing uncertainty around the proposed Australian emissions trading scheme (CPRS) has not diminished awareness amongst business of the need to manage carbon exposure as part of longer-term business strategy. In response we are working with customers to help them manage ongoing short term regulatory risk, future carbon risk impacting the viability of investment decisions (both negatively & positively) & carbon market risk implications. Within New Zealand, the commencement of emissions trading has more immediate impacts for our business. Forestry companies have begun to receive their permit allocation as part of the implementation of the scheme during the current transitional phase. The development of the NZETS extends our capabilities, and cements our commitment to help manage the risks and opportunities our clients will be presented with. Renewable Energy - In the absence of the CPRS the Australian Government has strongly signalled a focus on alternative policy measures for at least the next 18 months at least, in particular, renewable energy & energy efficiency. The extension of the Renewable Energy Target (RET) will provide significant investment & finance opportunities for renewable energy generation as discussed in 6.5. It will also generate significant opportunities within our commercial banking division, focusing on household & small business renewable energy installation & clean energy technology. Additional government funding allocated in the 2010/11 Federal Budget to a new renewable energy fund, as well as the Government Solar Flagships program, are also expected to provide additional support for investment. Feed in tariffs are now in place in a number of Australian states & are being proposed in others. These have significantly improved the ROI on small scale solar units and bring with them opportunities for new funding models. Energy efficiency & additional tranches of regulatory reform –A suite of policy measures is required to ensure that long-term ongoing emission reductions are achieved. We continue to see numerous policy and regulatory measures aimed particularly at clean technology deployment and energy efficiency which have the potential to generate commercial opportunities for our customers. For instance, the Building Energy Efficiency Disclosure Bill 2010 proposes mandatory disclosure legislation and changes to the Building Code of Australia to reduce emissions in the built environment sector. The Australian Government has commenced the implementation of a National Strategy on Energy Efficiency, and released a Discussion Paper identifying opportunities for government support and intervention to incentivise increased investment in energy efficiency measures within business. This continues the work of the National Framework for Energy Efficiency, under the Commonwealth, State and Territory Governments (COAG) Ministerial Council on Energy. In addition, the Australian Carbon Trust continues to gear up, with funding for investment in energy efficiency opportunities, aimed particularly at the commercial property sector. As a major lender to this sector changes are a source of indirect impact to our credit assessment and product development activities.
6.4
Are there financial implications associated with the identified opportunities? Yes
6.5

Please describe them. The major potential financial opportunities for Westpac resulting from regulatory clarity and other policy measures are in enhancing our ability to more effectively price carbon risk and to provide support for emerging industries in which we invest. Greater reporting disclosure provides us with greater, more comparable insight into the emissions liabilities of customers and suppliers and therefore has the potential to improve our pricing of this risk. Cap and trade schemes provide an additional revenue source for the organisation as already evidenced by our role in the New Zealand ETS described in 6.6. Legislative and policy measures also have the potential to support emerging markets which will require investment. For instance, the extension of the Australian Renewable Energy Target (RET) will provide significant investment and finance opportunities for renewable energy generation. The RET scheme includes a legislated target of slightly more than 45 000 GWH by 2020, up from 9,000 GWH previously and is expected to drive approximately $25 billion worth of new investment in the period up to 2020. It will also generate significant opportunities within our commercial banking division, focusing on household and small business renewable energy installation and clean energy technology. The compulsory disclosure of NABERs rating for commercial property again assists in pricing the risk to this sector as well as the market value of our own property trusts. Similarly is increased clarity on local planning approaches to sea level rise. All of which feed through to our ability to reduce our indirect exposure via our customer base. Whilst not directly related to mandatory reporting, given our early action in this area, our environmental efficiency activities have achieved both financial and environmental savings. For instance, the first year of our target period $1,540,400 was invested in a range of activities across the Westpac portfolio that resulted in per annum savings of $1,724,900 representing a reduction of over 5,000MWh and 4,503 tonnes CO2e. $507,460 was also invested in a range of activities across the St George Bank portfolio that resulted in per annum savings of $284,094 representing a reduction of 2,905MWh and 2,617 tonnes CO2e. Further detail is provided in 9.9.
6.6
Describe any actions the company has taken or plans to take to exploit the opportunities that have been identified, including the investment needed to take those actions. Westpac is systematically identifying & responding to the broad range of emerging carbon finance & retail banking opportunities through our Group-wide Climate Change strategy. This has a particular focus on developing customer products & services to respond to new policy frameworks. Our commercial response is led by the Westpac Institutional Bank (WIB). WIB has worked to leverage the Group’s sustainability credentials & ensure that carbon fluency is developed across related business segments across the bank. WIB’s Carbon & Water Strategy focuses on four key areas of Carbon Trading, Renewable Energy Investment, Carbon & Water Risk & Client Solutions. We continue to organically grow our carbon trading business in line with developments in the regions where we operate, expanding our teams in both Australia & New Zealand. We were the first major financial institution to enter the New Zealand Emissions Trading Scheme (NZ ETS). Since early 2010, we have played a role as a market maker, buying parcels of credits (New Zealand Units or NZUs) from forestry companies, aggregating and selling to large liable entities. We believe this will help to build confidence, price transparency and liquidity in the early stages of the NZ ETS. In April 2010, we also wrote to over 600 forestry companies to discuss the carbon implications for their business. A Renewable Energy Strategy has been developed focused on increasing our involvement in local renewable projects. Despite ongoing regulatory uncertainty (see ques 3), we have been involved in the biggest renewable energy deals in Australia over the last 18 months. Recent deals include the AGL Hallet 4 wind farm in South Australia and Investec Collgar wind farm in Western Australia. Westpac’s involvement in the renewable energy market includes: • Financial relationships with energy retailers likely to have significant liabilities to acquit Small-scale Renewable Energy Certificate (SRECs) and Large-scale Renewable Energy Certificates (RECs)

• Financial relationships with Energy Intensive Trade Exposed entities (EITEs) with residual liability to acquit SRECs and RECs • Financing for large scale renewable energy projects • Small businesses involved in the installation of small generation and solar hot water units that will benefit from SRECs • Portfolio trading in electricity, RECs, commodities and carbon markets Currently an estimated 50% of our infrastructure & utilities financing is directed towards renewables (incl hydro), totalling $1,110m. We also work with business customers in the small scale renewable energy sector. Our wealth management division, BT Financial Group (BT), is a member of the Investor Group on Climate Change Australia / New Zealand (IGCC), and is a signatory to the Carbon Disclosure Project and the UN Principles for Responsible Investment (PRI). In January, BT owned Ascalon Capital Managers purchased a 30% stake in the Australian specialist carbon fund Arkx. Arkx is a clean energy fund which invests in companies that derive at least half their revenues from businesses that reduce emissions, have proven technology, a strong balance sheet, a large market capitalisation and high market liquidity. In December 2009, a Carbon Deal Team was established to accelerate the delivery of vertically integrated client service/product offerings incorporating carbon. The team works across all areas of the bank to provide the finance component of fully integrated carbon solutions. This includes debt & equity funding for emerging business opportunities in the domestic offset sector (forestry & agriculture), energy efficiency & other internal abatement financing requirements & carbon off-take, price risk management or origination activities. We are implementing an agribusiness and regional business strategy around managing carbon & water impacts for our customers, establishing a network of Carbon Champions for each state. This follows the exclusion of the agricultural sector from compliance obligations but the expansion of opportunities to generate domestic offset credits within the amended Carbon Pollution Reduction Scheme (CPRS). While the Australian scheme remains in limbo, the ability for additional offset credits under the National Carbon Offset Scheme (NCOS) remains an opportunity for this sector, particularly around the development of a market framework for Soil Carbon farming activities. The Agribusiness carbon network is now focused on managing emerging climate & water impacts in credit risk, identifying & managing customer impacts, pursuing lending and investment opportunities for new forestry and agricultural domestic offset business opportunities and working with our customers to understand and manage voluntary and compliance carbon market impacts. We continue to engage with government on emerging regulatory frameworks, see 9.11.
6.7
Explain why you do not consider your company to be presented with significant opportunities - current and/or anticipated.
6.8
Please explain why not.
Further Information
Attachments

Page: Physical Opportunities
7.1
Do current and/or anticipated physical impacts of climate change present significant opportunities for your company? Yes
Do you want to answer using: The table below
7.2A
What are the current and/or anticipated significant physical opportunities and their associated countries/regions and timescales?
Opportunities
Region/Country
Timescale in Years
Comment
Induced changes in supply chain and/or customers
Other: all areas of operation Current
We are already seeing new markets emerge to help individuals and businesses mitigate and adapt to the physical consequences of climate change and expect that this trend will continue over time driven by both natural demand and government policy. We feel that this opportunity is derived as a result of the other potential risks listed as options in this section and therefore have nominated this option as the only perceived opportunity.
7.2B
What are the current and/or anticipated significant physical opportunities and their associated countries/regions and timescales?
7.3
Describe the ways in which the identified opportunities affect or could affect your business and your value chain. At this stage, it is difficult to predict how changing physical and climatic conditions will create additional opportunities for the industry sectors in which the Group lends and invests, independent to the policy and regulatory response. There may be some short term increases in the productive value of agricultural land over the short-term in some regions but this is not anticipated to be consistent or long-term. However, what is becoming clearer is that how physical impacts play out across the jurisdictions in which Westpac operates will likely create new dynamics across key industry sectors which will need to be managed on an ongoing basis. In particular the rise of emerging markets to assist in adaptation and mitigation activities whether they be major renewable energy deals through to small business offerings. In industry sectors where weather impacts are a substantial component of the overall assessment of commercial viability, Westpac is increasingly integrating climate change considerations into our

standard risk assessment process. Probably the single biggest area of potential opportunity arising from physical risks in the short term emerges as a result of increasing water scarcity as a result of climate change impacts within Australia. Australia has always had significant resource constraints on fresh water availability and significant issues with increasing salinity. In particular, desalination plants have emerged as key government response to increasing demand and decreasing availability of fresh water within capital city locations. As the physical impacts of climate change become clearer, closer industry analysis is likely to reveal new strategic finance and investment opportunities. The Group is continuing to investigate these opportunities through its Client Engagement strategy, discussed in earlier responses, as managed through the Carbon Risk Committee.
7.4
Are there financial implications associated with the identified opportunities? Yes
7.5
Please describe them. Similar to those described in the regulatory options section the main financial opportunities are in funding the emergence of new markets engaged in climate change mitigation and adaptation activities. In essence funding structural changes in our economies away from fossil fuel.
7.6
Describe any actions the company has taken or plans to take to exploit the opportunities that have been identified, including the investment needed to take those actions. To date, Westpac has sought to incorporate physical risk considerations into our standard carbon risk management framework and processes, as discussed in earlier responses. The WIB Carbon Risk Committee has sought to explicitly address physical risk within the carbon risk amendments incorporated into BAU credit risk systems and processes. In late 2009, the WIB Carbon Risk Committee ran a specific two-hour session on physical risk and likely impacts within Australia, delivered to credit and risk officers across the Westpac Group. Over 150 employees attended the presentation, developed by Tony Coleman, former Chief Risk Officer of Insurance Australia Group and recently appointed member of the Australian Carbon Trust Board of Directors. In 2010, Westpac has committed to developing an Adaption Risk Strategy which will more effectively coordinate activity across the group in this area. This is discussed further in our response to question 4.1. Probably the most significant risk arising from climate change within Australia, also presents the biggest overt opportunity – namely the impact of climate change on water availability. Many State and Territory governments have committed to the construction of desalination plants across Australia, to meet growing demand for fresh water in capital cities. Westpac has supported the financing of a number of these projects, where they meet the environmental and social risk provisions of the Equator Principles. In 2010, Westpac has also explicitly incorporated water risk considerations into our Business Credit Manual, dealing particularly with the agribusiness sector and the implications of recent changes to the regulatory framework around water licensing. Westpac is participating in a number of multi-party workgroups to examine climate and water impacts and the integration of specific risk considerations into business-as-usual credit risk assessment processes. These include the CEO Water Mandate, the Water Stewardship Initiative, UNEP FI working group on water risk and the UN Global Compact work on environmental stewardship. In 2009,

the UNEPFI working group on water risk published a report examining issues specific to water risk and the agricultural sector, across a number of key geographies, including Australia. Locally we are also active in the Agricultural Alliance and undertake research in partnership with a range of expert organisations including the Climate Institute and the Australian Conservation Foundation. In addition is the likely growth of industries to support the management of climate change as potential new customers segments. Westpac has already developed strategies in the renewable energy area and are looking at further opportunities via our sector review processes.
7.7
Explain why you do not consider your company to be presented with significant opportunities - current and/or anticipated.
7.8
Please explain why not.
Further Information
Attachments
Page: Other Opportunities
8.1
Does climate change present other significant opportunities - current and/or anticipated - for your company? Yes
Do you want to answer using: The table below
8.2A
What are the current and/or anticipated other significant opportunities and their associated countries/regions and timescales?
Opportunities
Region/Country
Timescale in Years
Comment
Reputational Other: all Current During 2009 we formally measured current

Opportunities
Region/Country
Timescale in Years
Comment
opportunities and increased ability to attract and retain talent
countries of operations
awareness and engagement of our sustainability priorities. Importantly the research established a link between awareness and engagement on sustainability and other strategic objectives, for example, the extent to which employees act as advocates for the company.
Financial opportunities
Other: all countries of operation
Current
Specific financial opportunities may arise as a direct result of corporate performance in relation to their management of climate change. Much of the work described in the previous two questions has been in part successful because of early acknowledgement of the need for action on climate change and our reputation for environmental and sustainability performance more generally.
New services and/or product market opportunities
Other: all countries of operation
Current
New funding models and products are already in market, often due to regulatory changes and discussed in detail in this section. But also due to changes in customer interest and demand for products and financing solutions that helps customers reduce their climate change impacts.
8.2B
What are the current and/or anticipated other significant opportunities and their associated countries/regions and timescales?
8.3
Describe the ways in which the identified opportunities affect or could affect your business and your value chain. During 2009 we formally measured current awareness and engagement of our sustainability priorities. Importantly the research established a link between awareness and engagement on sustainability and other strategic objectives, for example, the extent to which employees act as advocates for the company. We have undertaken sustainability related advertising campaigns in all our major areas of operation to promote our sustainability credentials and first mover status and have built a reputation locally for our climate change response. This has links to our ability to attract and retain employees and customers. Understanding this demand brings with it opportunities to bring to market new services and to identify new markets and opportunities. In addition our engagement work has strengthened relationships with customers and other key stakeholders in this area.
8.4
Are there financial implications associated with the identified opportunities? Yes
8.5
Please describe them.

There are three main financial benefits. The first stemming from reduced recruitment costs and likely increase in productivity given the links between awareness of our sustainability programs and engagement more broadly. Secondly is the potential increase in reputation and brand value and attraction of new customers. For instance during 2009/10 a green loan was offered in conjunction with the Australian Federal Government to householders. Over a quarter of the customers taking up this offer were new to Westpac. Thirdly is revenue directly generated for developing new markets to assist in the management and mitigation of climate change and helping customers transition to lower carbon options.
8.6
Describe any actions the company has taken or plans to take to exploit the opportunities that have been identified, including the investment needed to take those actions. Westpac has been implementing an ongoing education, awareness and engagement program. More than 200 employees, including the CEO and Board, have undertaken formal carbon training supported by online materials and a dedicated intranet site. More informally we launched a champions program, known as Our Tomorrow, across the Group to help individual employees become more engaged and actively involved in our sustainability activities. We have also included details of our sustainability practices and credentials in our graduate recruitment campaigns and run a Graduate Sustainability Program upon commencement to provide practical experience of working on sustainability issues, most often this will include a climate change related activity We have incorporated sustainability messaging into our customer communication in all our major geographies. Again this has not required additional investment as it is has been undertaken using existing marketing budgets. Our Group-wide customer focused strategy has led us to make our sustainability activities more relevant to the customer (see 9.1 for further detail). Many of the customer initiatives have been detailed in previous sections of this submission and include a focus on the renewable energy market, carbon trading and energy efficiency financing. In addition our retail offers include 'green' credit card redemption items, discounts for green products for eligible mortgage customers and an interest free green loan.
8.7
Explain why you do not consider your company to be presented with significant opportunities - current and/or anticipated.
8.8
Please explain why not.
Further Information
Attachments
Module: Strategy
Page: Strategy

9.1
Please describe how your overall group business strategy links with actions taken on risks and opportunities (identified in questions 3 to 8), including any emissions reduction targets or achievements, public policy engagement and external communications. The actions described in the risk and opportunities section of this submission are linked to our overall business strategy in two ways. (see also attached diagram and links below) 1. Explicit inclusion of sustainability leadership, including our response to climate change, as a strategic goal for the business. 2. Aligning our climate change response to our overall customer centric strategy. 1. Sustainability as a core strategic objective Sustainability has been identified as a discreet area of strategic focus and five of the six areas of focus within our sustainability strategy directly link to our climate change responses: 1.Going mainstream – including developing products and services to assist customers in transitioning to a low carbon environment 2.People and places 3.Tread Lightly – reducing our direct environmental footprint, including our 5 year target to reduce Scope 1 and 2 emissions by 30% 4.Carbon & Water – understanding carbon risk and embedding into credit policy, developing trading products and building internal capacity to assess and discuss our clients climate risks, renewable energy strategy 5.Speaking Out – advocating for sustainable business practice, including action on climate change 6.Solid Foundations – includes supplier assessment and lending and investment criteria. Further discussion of current progress against this strategy is outlined in our 2009 Annual Review and Sustainability Report. This year we combined our sustainability report and annual review (financial and non-financial reporting) reflecting the strategic importance of our sustainability activities. In addition the Group released a public statement on climate change (see previously attached) which includes specific objectives in five main areas, reinforcing the themes of our broader sustainability strategy. - reducing our own footprint - risk management and capacity building - employee engagement - products and services - advocacy within the community These strategic areas are also integrated into business decision making processes, including major project funding. Project submissions must detail contributions to the overall business strategy, including the Group’s sustainability strategy. For instance proposed data centres must be able to help contribute to the achievement of our emissions reduction target. 2. Alignment to customer centric strategy As articulated by our CEO Gail Kelly “Just as sustainability has moved to the centre of the business agenda, we have placed customers at the heart of our sustainability priorities.” This is evidenced by our work to help business and retail customers reduce their own emissions. We have been assisting institutional customers in managing their carbon liabilities, including funding for transitional and diversification activities. In addition is our support for renewable projects and the establishment of a renewables strategy and carbon deal team and our involvement in supporting customers impacted by the New Zealand Emissions Trading Scheme. Our approach has also included support for retail customers through the provision of an interest-free green loan in conjunction with the Federal Government, as well as interest free loans to our own employees to undertake energy and water saving activities. We have also made improvements to our e-statement offering to reduce Scope 3 impacts and are incorporating green design principles into the refurbishment of our branches. Most recently we have taken a stake in clean energy fund Arkx and supported New Zealand Government initiatives to reduce household emissions. Many of these activities are detailed in the opportunities section of this submission.
Further Information
Westpac Group Business Strategy http://westpac.online-ar2009.com/index.php?option=com_content&view=article&id=4&Itemid=9 2009 Annual Review and Sustainability Report http://westpac.online-ar2009.com/index.php?option=com_content&view=article&id=1&Itemid=6 Climate Change Position Statement http://westpac.online-ar2009.com/index.php?option=com_content&view=article&id=1&Itemid=6
Attachments
https://www.cdproject.net/Sites/2010/51/19051/Investor CDP 2010/Shared Documents/Attachments/InvestorCDP2010/Strategy-Strategy/Corporate strategy WBC 2010.pdf
Page: Strategy - Targets
9.2
Do you have a current emissions reduction target? Yes
9.3
Please explain why not and forecast how your Scope 1 and Scope 2 emissions will change over the next 5 years. (If you do not have a target)
9.4
Please give details of the target(s) you are developing and when you expect to announce it/them. (If you are in the process of developing a target)
9.5
Please explain if you intend to set a new target. (If you have had a target and the date for completing it fell within your reporting year, please answer questions 9.5 and 9.6)
9.6
Please complete the table. (If you have a current emissions reduction target or have a recently completed target)

Target Type
Value of
Target
Unit
Base year
Emissions in base year
(metric tonnes CO2-
e)
Target Year
GHGs and GHG
sources to
which the
target applies
Target
met?
Comment
Absolute emissions reduction
5.00
% reduction from base year
2008 191521.00000 2009 Scope 1 + 2 Yes
Total emissions for 2009 were 190,900. This included 8,082 metric tonnes CO2~e emissions not previously accounted. These emissions were included due to inclusion of additional sites under mandatory reporting legislation (6,382 tonnes), the removal of Fringe Benefits Tax allowance for fleet in Australia (1,327 tonnes) (previously only 72% of total fleet emissions have been included in the baseline) and the inclusion of additional emissions categories for air conditioning and back up diesel generators (373 tonnes). Therefore on a like for like basis an emissions reduction of 5% was

Target Type
Value of
Target
Unit
Base year
Emissions in base year
(metric tonnes CO2-
e)
Target Year
GHGs and GHG
sources to
which the
target applies
Target
met?
Comment
achieved. In future years these additional emissions will be absorbed into the existing targets against the current baseline. Please refer to attached waterfall chart for a pictorial depiction of the changes.
Absolute emissions reduction
12.50
% reduction from base year
2008 191521.00000 2010 Scope 1 + 2
Target ongoing
Absolute emissions reduction
30.00
% reduction from base year
2008 191521.00000 2013 Scope 1 + 2
Target ongoing
Further Information
Full details of both our footprint and other climate change targets can be found at the following links http://westpac.online-ar2009.com/index.php?option=com_content&view=article&id=15&Itemid=21 http://westpac.online-ar2009.com/index.php?option=com_content&view=article&id=15&Itemid=21&limitstart=1 Note that emissions associated with our property trusts have been excluded from this baseline and separate targets are being established for this area of the business.
Attachments
Page: Strategy - Emission Reduction Activities
¿
Is question 9.7 relevant for your company? Yes

9.7
Please use the table below to describe your company’s actions to reduce its GHG emissions.
1. Actions - please
describe
2. Annu
al energy
saving
3. Annual energy savings
- nu
mber
4. Annual
energy
saving - unit
s
5. Annual
emission reduction
in metr
ic tonnes
CO2-e
6. Reduction
- achieved or
anticipated
7. Investment
- numb
er
8. Investment
- currency
9. Monetar
y savings - number
10. Monetar
y savings - currency
11. Monetary
savings
12. Timescale of
actions &
associated
investments
(if releva
nt)
New Zealand Vehicle use New fleet roll out to hybrid diesel and vehicles Vehicle/communication strategy – fuel efficiency, competition for most fuel efficient driver
Anticipated
120953
Other: Litres
350 Achieved 0 NZD
($) 219188
NZD ($)
Anticipated
Year one - $350,000 contract saving + $219,188 fuel consumption savings Saves $2.2m over four years Implemented between 2008 and 2011 BAU investment
New Zealand Energy Branch – air conditioning replacement program. Considerable number of branches have 15-20 year old HVAC plant. Insulation programme – Aligned with Repairs
Achieved
3134166
kWh (kilowatt-hour)
724 Achieved
1000000
NZD ($) NZD
($) Achieved
Saved approx 10% of all Scope 2 emission in NZ and have yielded savings in excess of 10%

1. Actions - please
describe
2. Annu
al energy
saving
3. Annual energy savings
- nu
mber
4. Annual
energy
saving - unit
s
5. Annual
emission reduction
in metr
ic tonnes
CO2-e
6. Reduction
- achieved or
anticipated
7. Investment
- numb
er
8. Investment
- currency
9. Monetar
y savings - number
10. Monetar
y savings - currency
11. Monetary
savings
12. Timescale of
actions &
associated
investments
(if releva
nt)
& Maintenance Programme. New buildings – Building works completed under revised Building Code will support higher efficiencies overtime. Energy corporate – 3 sites – replacing 30 year old HVAC technology.
of the energy budget Savings figures are per annum
New Zealand Nightwatchman rollout (computer shut down)
Achieved
1270000
kWh (kilowatt-hour)
200 Achieved
500000
NZD ($)
140000
NZD ($)
Savings figures are per annum
Australia Accommodation planning
Achieved
4632550
kWh (kilowatt-hour)
4723 Achieved 0 AUD
($) 506580
AUD ($)
Achieved
BAU investment Implemented in 2008/09 and reresents 2.5% of Scope 2 emissions Savings figures are per

1. Actions - please
describe
2. Annu
al energy
saving
3. Annual energy savings
- nu
mber
4. Annual
energy
saving - unit
s
5. Annual
emission reduction
in metr
ic tonnes
CO2-e
6. Reduction
- achieved or
anticipated
7. Investment
- numb
er
8. Investment
- currency
9. Monetar
y savings - number
10. Monetar
y savings - currency
11. Monetary
savings
12. Timescale of
actions &
associated
investments
(if releva
nt)
annum
Australia HVAC - Timers - Controls
Achieved
3042168
kWh (kilowatt-hour)
3286 Achieved 98571 AUD
($) 11621
AUD ($)
Achieved
Implemented during 2008/09 Savings figures are per annum
Australia HVAC - upgrades - Optimisation - timers - seasonal temperature adjustments
Anticipated
6604228
kWh (kilowatt-hour)
6119 726465
Being implemented during 2009/10 Savings figures are per annum and are equivalent to 3.5% of Scope 3 emissions
9.8
Please explain why not.
9.9

Please provide any other information you consider necessary to describe your emission reduction activities. The activities listed above form part of a five-year reduction program across the Group. Detailed costings have been disclosed for a number of items undertaken during the first two years of the program and have been approved based on our review of a combination of the organisations cost curve for abatement and areas identified with substantial savings or that could built into business as usual activities, for instance re-leasing of fleet ,and data centre upgrades. In summary the first year of our target period $1,540,400 was invested in a range of activities across the Westpac portfolio that resulted in per annum savings of $1,724,900 representing a reduction of over 5,000MWh and 4,503 tonnes CO2e. $507,460 was also invested in a range of activities across the St George Bank portfolio that resulted in per annum savings of $284,094 representing a reduction of 2,905MWh and 2,617 tonnes CO2e. Further detail is provided in the attached charts. The emissions reduction activities listed above refer exclusively to Scope 1 and 2 emissions. There is also much work underway to reduce our Scope 3 impacts. For instance, air travel has been reduced by 20% through changes to the sign-off delegations for work-related travel, reductions in travel budget and the roll out of improved video conferencing facilities. Similarly, we have reduced paper consumption (including all stationery, marketing materials and copying paper) by over 10% over the last two years. Many of these savings came from process changes that removed duplication and did not require additional investment. Our major investment item has been the improvement to our e-statements offering which is expected to deliver $2m in savings in year one. More recently waste management programs have been implemented in Westpac New Zealand and St.George Bank to improve recycling rates and reduce our Scope 3 emissions associated with waste.
9.10
Do you engage with policy makers on possible responses to climate change including taxation, regulation and carbon trading? Yes
9.11
Please describe. The Westpac Group was one of the first Australian companies to call for early action on climate change. Together with 6 other Australian businesses and the Australian Conservation Foundation, we were involved in the Australian Business Roundtable on Climate Change. Since then we have publicly advocated for a range of policy actions on both the mitigation and adaptation fronts in relation to climate change. These centre around: • The establishment of a long-term aspirational goal to reduce greenhouse gas emissions, supported by a short term binding target • A national emissions trading scheme, incorporating appropriate international linkages & protections • A practical strategy supporting the development & deployment of low-emission technology • Demand management & behavioural change, facilitated through appropriate education & awareness raising • A strategic response to adaptation requirements across impacted communities, natural habitats & industry sectors As a financial institution, Westpac’s contribution to the policy debate has been its investment, risk assessment & financial market expertise aimed at ensuring that any legislation promotes a deep, liquid & effective market environment in which Australian business can adapt efficiently to a carbon constrained economy. Accordingly, we have been heavily involved in consultation over the CPRS on multiple fronts. In May 2010, Westpac launched a major new partnership initiative, committing to become Lead Climate Partner with the Climate Institute, a local not-for-profit which promotes policy, market & business solutions to climate change. The Climate Institute approach incorporates policy advocacy & business engagement based on well regarded research, rather than the direct or grassroots campaigning activity. As part of the launch, Westpac & the Climate Institute commissioned research by Bloomberg/New Energy Finance on the impact the Renewable Energy Target will have on clean energy investment in Australia, &our ability to meet agreed national emission reduction targets of 5-15-25% by 2020.

Specific egs of recent policy engagement related activities in our countries of operation follow: 2008 • Member of the AFMA Carbon Markets Committee (which includes the majority of Australian energy companies) • Member of the Australian Bankers’ Association Climate Change Working Group • Member of the Government-Insurance & Finance Industry Partnership on Climate Change, focusing on adaptation issues • Instigated & hosted the inaugural meeting of the Climate Change – Banking and Financial Markets Working Group with financial services representation and the Department of Climate Change focusing on emissions trading • Provided a submission on the Government's Green Paper on emissions trading • Attended a meeting with the Minister for Climate Change Senator Penny Wong prior to the release of the Green Paper to discuss scheme design implications for financial markets • Provided multiple submissions to the Garnaut Review, both directly & through our participation in AFMA, ABA & the Agricultural Alliance on Climate Change • Provided a submission to the Senate Inquiry on climate change & the agricultural sector 2009 • Member of the AFMA Carbon Markets Committee • Member of the AFMA Carbon Documentation Working Group resulting the in the release of ISDA trading documentation for carbon credits • Member of the Australian Bankers’ Association Climate Change Working Group • Member of the NSW Government Carbon Markets Taskforce • Submission provided and participated in the Government working group on deferred payment options for the CPRS Auction process • Submission provided and participated in the Government working group on the treatment of eligible units as financial products • Participated in ABA working group and provided submission on the tax treatment of carbon credits under the CPRS • Submission provided to the Senate Economics Committee Inquiry on the Exposure Draft of the Carbon Pollution Reduction Scheme Bill and appeared before the Committee to give evidence • Submission provided to the Senate Select Committee on Climate Policy and appeared before the Committee to give evidence • Submission and additional feedback provided directly to the Government on the draft CPRS legislation. • Submission also provided through both the ABA and the AFMA Carbon markets Committee • Submission provided and provided evidence before the New Zealand Emissions Trading Scheme Review Committee 2010 • Submission on the Government’s Discussion Paper on proposed amendments to the Renewable Energy target (RET) framework. In addition we have been involved in a number of international advocacy activities and encouraged our suppliers and customers to do the same, including: • Signing the Bali, Poznan and Copenhagen Communiques • Signing the Investor Statement on Climate Change
Further Information
Copies of many of our submissions are available on our website at http://www.westpac.com.au/about-westpac/sustainability-and-community/environment/climate-change/communication-and-advocacy/
Attachments
https://www.cdproject.net/Sites/2010/51/19051/Investor CDP 2010/Shared Documents/Attachments/InvestorCDP2010/Strategy-EmissionReductionActivities/Identified emissions savings Westpac Group.pdf
Module: GHG Emissions Accounting, Energy and Fuel Use, and Trading

Page: Emissions Boundary - (1 Jul 2008 - 30 Jun 2009)
10.1
Please indicate the category that describes the company, entities, or group for which Scope 1 and Scope 2 GHG emissions are reported. Companies over which operational control is exercised
10.2
Are there are any sources (e.g. facilities, specific GHGs, activities, geographies, etc.) of Scope 1 and Scope 2 emissions within this boundary which are not included in your disclosure? Yes
10.3
Please complete the following table.
Source
Scope Explain why the source is excluded
Various minor tenancies in the US and Asia
Scope 1 and 2
Data is not currently available from landlords and is not deemed be of in material size.
Refrigerant gases
Scope 1
This is not reportable to the Australian government under mandatory reporting legislation and is excluded to maintain a single set of figures. Refrigerant gas leakage is reported in New Zealand.
Incidentals – fire suppressants, fuel for lawn mowers etc
Scope 1
These are deemed to be of immaterial volumes in all Westpac geographies.
Further Information
Attachments
Page: Methodology - (1 Jul 2008 - 30 Jun 2009)
11.1a
Please give the name of the standard, protocol or methodology you have used to collect activity data and calculate Scope 1 and Scope 2 emissions and/or describe the procedure you have used (in the text box in 11.1b below).
Please select the published methodologies that you use.
Australia - National Greenhouse and Energy Reporting Act The Greenhouse Gas Protocol: A Corporate Accounting and Reporting Standard (Revised Edition)

Please select the published methodologies that you use.
Other: Certified Emissions Measurement and Reduction Scheme (CEMARS) New Zealand
11.1b
Please describe the procedure that you use. The Greenhouse Gas Protocol serves as the foundation framework for our reporting and is supported by the appropriate local standard as described below. Data is collected across the Group using an online sustainability reporting tool to ensure data integrity. All data is externally verified before publication in our annual public reporting. Australia: In Australia Scope 1 and 2 emissions reporting is prepared in line with the requirements of the National Greenhouse Energy and Reporting (NGER) system. Calculations are based on the National Greenhouse Factors, released by the Australian Federal Government. The version used for the 2008/09 reporting year is available at http://www.climatechange.gov.au/publications/greenhouse-acctg/national-greenhouse-factors.aspx. Full details of our calculation methodology is detailed in Westpac NGER Policy and Procedures document attached and is elaborated on below in the commentary regarding data collection. New Zealand: Emissions of all scopes from Westpac New Zealand have been prepared and certified under CEMARS (Certified Emissions Measurement and Reduction Scheme) or the past two years. CEMARS is the world's first accredited greenhouse gas certification scheme as part of Landcare Research's carboNZero program. The accreditation was awarded by the Joint Accreditation System - Australia and New Zealand (JAS-ANZ) which comes under the auspices of the International Accreditation Forum (IAF). To achieve CEMARS certification accurate quantification of the amount of GHG emissions that can be directly attributed to Westpac New Zealand’s operations for the reporting period June-July required the preparation of a GHG inventory in accordance with The Greenhouse Gas Protocol and ISO14064-1:2006 standards as well as the preparation of an emissions reduction plan and verification of both the GHG report and reduction plan. Data is calculated using Landcare Research carboNZero strategic business unit (SBU) resources and tools (such as E-Manage) and GHG emissions factors. A calculation methodology was used for quantifying the GHG emissions inventory using emissions source activity data multiplied by GHG emissions or removal factors United Kingdom and Pacific Banking: The Greenhouse Gas Protocol is used as the standard for data gathering and calculation in the UK and Pacific Islands (Fiji, Tonga, Samoa, Solomon Islands, PNG, Vanuatu and Cook Islands). Data collection Input data is taken from a combination of supplier invoices, summary reports and metred data extracted from property management, travel and other systems and uploaded into our web based information management system for sustainability-related data. Where electricity bills for properties in which we are a tenant are paid as outgoings and consumption information is not provided extrapolations are made based on the consumption per metres squared of similar sites. This occurs for less than 8% of our locations in Australia and 16% in NZ. No extrapolations are made in Pacific Banking and UK. Extrapolations are also undertaken for non-metered ATMs or cash points. For instance in New Zealand ATMs are assumed to use 3,000kWh per annum. Fleet vehicle calculations are based on fuel consumption data. However we are currently transitioning the methodology used for calculating emissions associated with fleet vehicles in our Pacific Banking businesses from calculations based on fuel expenditure to log book records to improve data accuracy. This should be completed for all countries by the end of 2010 reporting year. From this input, data emissions are calculated using the appropriate local emissions factors as described above and detailed in 11.4. In the absence of relevant national factors the greenhouse gas protocol methodology is applied.
11.2
Please also provide the names of and links to any calculation tools used.
Please select the calculation tools used.
NGER Calculator: Oscar Extension GHG Protocol - GHG emissions from purchased electricity, heat of steam 2.1 June 2009 GHG Protocol - CO2 emissions from business travel 1.2 August 2005 Other: Landcare Research carboNZero SBU E-Manage

11.3
Please give the global warming potentials you have applied and their origin.
Gas
Reference
GWP
Carbon dioxide IPCC Second Assessment Report (SAR - 100 year) 1
Nitrous oxide IPCC Second Assessment Report (SAR - 100 year) 310
Methane IPCC Second Assessment Report (SAR - 100 year) 21
11.4
Please give the emission factors you have applied and their origin.
Fuel/Material
Emission Factor
Unit
Reference
Natural gas 51.33 Other: kg CO2e/GJ NGER calculator
Natural gas 0.19 Other: kg CO2e/kWh CEMARS e-manage
Liquefied petroleum gas (LPG) 60.80 Other: kg
CO2e/kWh NGER calculator
Liquefied petroleum gas (LPG) 1.60 kg CO2-e per litre CEMARS e-manage
Motor gasoline 69.60 Other: kg CO2e/GJ NGER calculator
Motor gasoline 2.30 Other: kg CO2e/kL GHG Protocol
Other: Unleaded petrol - regular 2.28 kg CO2-e per litre CEMARS e-manage
Other: Unleaded petrol - premium 2.54 kg CO2-e per litre CEMARS e-manage
Other: Diesel 69.90 Other: kg CO2e/GJ NGER calculator
Other: Diesel 2.54 kg CO2-e per litre CEMARS e-manage
Other: Diesel 2.63 Other: kg CO2e/kL GHG Protocol
Other: Diesel stationary 69.50 Other: kg
CO2e/GJ NGER calculator
Further Information
Note that motor gasoline is assumed to be the same as unleaded petrol. Please see attached for full list of emissions factors used for Scope 1 and 2 emissions.
Attachments
Page: Emissions Scope 1 - (1 Jul 2008 - 30 Jun 2009)
12.1

Please give your total gross global Scope 1 GHG emissions in metric tonnes of CO2-e. 10963
¿
Is question 12.2 relevant to your company? Yes
12.2
Please break down your total gross global Scope 1 emissions in metric tonnes CO2-e by country/region.
Country
Scope 1 Metric tonnes CO2-e
Australia 8556 New Zealand 2029 United Kingdom 50 Other: Pacific Islands 328
12.3
Please explain why not.
12.4
Where it will facilitate a better understanding of your business, please also break down your total gross global Scope 1 emissions by business division. (Only data for the current reporting year requested.)
Business Division
Scope 1 Metric tonnes CO2-e
Westpac Australia 5236 StGeorge Bank 3038 Property Trusts 282 refer comments below 0
12.5
Where it will facilitate a better understanding of your business, please also break down your total gross global Scope 1 emissions by facility. (Only data for the current reporting year requested.)
Facilities
Scope 1 Metric tonnes CO2-e
see comments below 0
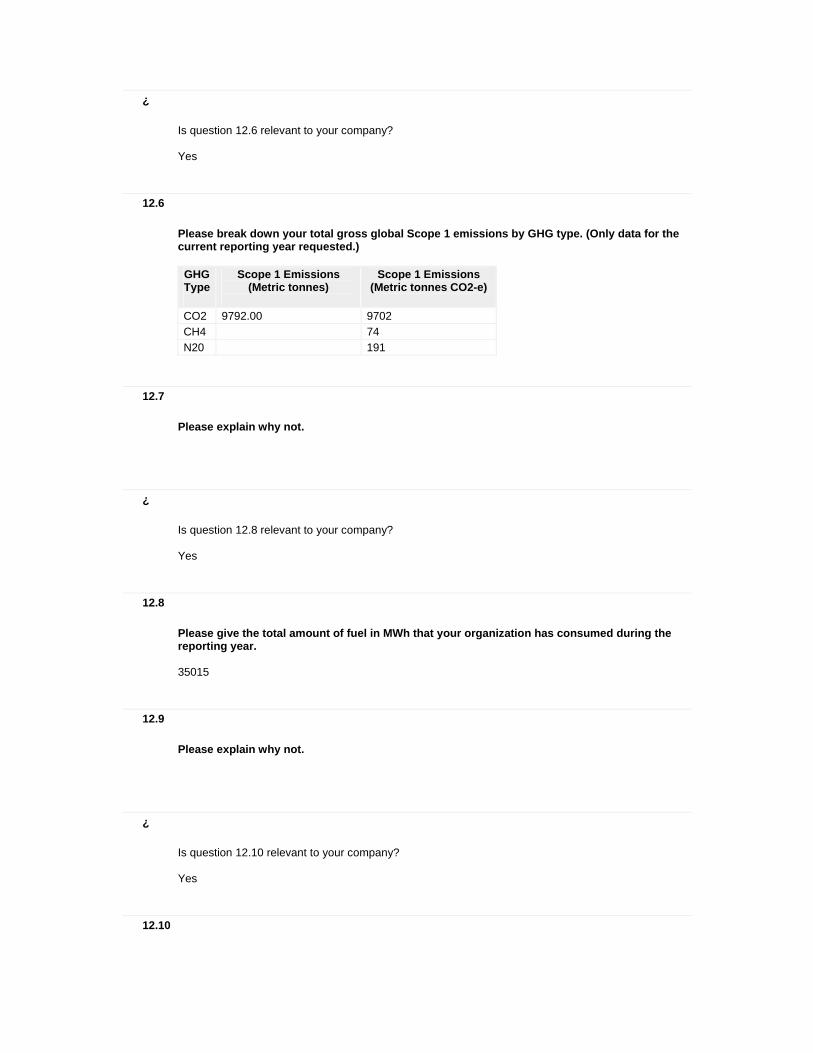
¿
Is question 12.6 relevant to your company? Yes
12.6
Please break down your total gross global Scope 1 emissions by GHG type. (Only data for the current reporting year requested.) GHG Type
Scope 1 Emissions (Metric tonnes)
Scope 1 Emissions (Metric tonnes CO2-e)
CO2 9792.00 9702 CH4 74 N20 191
12.7
Please explain why not.
¿
Is question 12.8 relevant to your company? Yes
12.8
Please give the total amount of fuel in MWh that your organization has consumed during the reporting year. 35015
12.9
Please explain why not.
¿
Is question 12.10 relevant to your company? Yes
12.10

Please complete the table by breaking down the total figure by fuel type.
Fuels
MWh
Liquefied petroleum gas (LPG) 9752.00 Motor gasoline 24738.00 Other: Diesel 525.00
12.11
Please explain why not.
12.12
Please estimate the level of uncertainty of the total gross global Scope 1 figure that you have supplied in answer to question 12.1 and specify the sources of uncertainty in your data gathering, handling, and calculations. Uncertainty
Range
Main sources of uncertainty
Please expand on the uncertainty in your data
More than 2% but less than or equal to 5%
AssumptionsExtrapolationData Management
Assumptions 1. All fuel purchased is captured by accounts and correctly coded 2. Invoices from energy provider are an accurate reflection of gas used. 3. A site audit of all Westpac owned HVAC systems in New Zealand has been undertaken. From the Maintenance Audit information there is 3136 kgs of HFC on Westpac property. The amount of top-ups and therefore leakages is estimated at 245 kgs. We have not included chillers, as there are very few that are the responsibility of Westpac. We have not included sites that are not within the HVAC audit scope, landlord care or the new head office building in Auckland (Takutai Square).
Further Information
Given that many of our business divisions operate out of shared premises (ie with other divisions) and undertake similar emissions activity, predominately electricity consumption, there is little value in breaking down emissions by business division. The only emissions separately tracked are those from facilities held in property trusts and are quite separate to our banking operations. An exception this year has been the addition of the St George banking business. This has been separately tracked during 2009 to assist in comparing pre and post merger performance. However over time these will be combined to an aggregate national figure. Regarding facilities data it is broken down for internal performance benchmarking is available for over 1500 sites. However given that Scope 1 emissions represent only 5.5% of emissions it is not considered material enough to break down for this submission.
Attachments
Page: Emissions Scope 2 - (1 Jul 2008 - 30 Jun 2009)

13.1
Please give your total gross global Scope 2 GHG emissions in metric tonnes of CO2-e. 190728
¿
Is question 13.2 relevant to your company? Yes
13.2
Please break down your total gross global Scope 2 emissions in metric tonnes of CO2-e by country/region.
Country
Metric tonnes CO2-e
Australia 183495 New Zealand 3951 Other: Pacific Islands 2841 United Kingdom 442
13.3
Please explain why not.
13.4
Where it will facilitate a better understanding of your business, please also break down your total gross global Scope 2 emissions by business division. (Only data for the current reporting year requested.)
Business division name
Metric tonnes CO2-e
Westpac Australia 116555 St George Bank 56430 Property Trusts 10509 refer comment below 0
13.5
Where it will facilitate a better understanding of your business, please also break down your total gross global Scope 2 emissions by facility. (Only data for the current reporting year requested.)
Facility name
Metric tonnes CO2-e
NZ Retail 2088

Facility name
Metric tonnes CO2-e
NZ ATMS 138 NZ Corporate sites 2141 St George Retail 19483 St George ATMS 2070 St George Corporate sites (incl data centres) 34876 Westpac Aust Data Centres 23879 Westpac Aust Retail 47899 Westpac Aust ATMS 3739 Westpac Aust Corporate sites 41039
¿
Is question 13.6 relevant to your company? Yes
13.6
How much electricity, heat, steam, and cooling in MWh has your organization purchased for its own consumption during the reporting year?
Please supply data for these energy types.
MWh
Electricity 232000
13.7
Please explain why not.
13.8
Please estimate the level of uncertainty of the total gross global Scope 2 figure that you have supplied in answer to question 13.1 and specify the sources of uncertainty in your data gathering, handling, and calculations. Uncertainty
range
Main sources of uncertainty in your data
Please expand on the uncertainty in your data.
More than 2% but less than or equal to 5%
Data GapsExtrapolationMetering/ Measurement Constraints
New Zealand Westpac accounts and where no information available assumptions. Invoices from energy providers are an accurate reflection of electricity used. However some gaps in documentation existed. Where this was the case Westpac staff made the following assumptions • After hours air conditioning costs have been established by converting costs paid to kWh at a rate of 10c/kWh. • Where there are sites that Westpac are subtenants in, the energy consumption is unknown and a separate energy invoice is not provided. Energy is paid

Uncertainty range
Main sources of uncertainty in your data
Please expand on the uncertainty in your data.
for via rent (OPEX). In these cases 170 kWh / m2 has been used to estimate electricity use for for all those sites, (This will be reviewed prior to next years report). • If consumption data is missing then an assessment has been made for that period ATMs - Where ATMs are part of a gross Lease ATM's assumed 292 ATM's at 3,000 kWh per annum. Australia Invoices from energy providers are assumed to be an accurate reflection of consumption. Where site data is not available a kWh/m2 is applied based on state averages for that building type. Where consumption data is not provided in time for year end an average is applied based on historical use.
Further Information
Given that many of our business divisions operate out of shared premises (ie with other divisions) and undertake similar emissions activity, predominately electricity consumption, there is little value in breaking down emissions by business division. The only emissions separately tracked are those from facilities held in property trusts and are quite separate to our banking operations. An exception this year has been the addition of the St George banking business. This has been separately tracked during 2009 to assist in comparing pre and post merger performance. However over time these will be combined to an aggregated national figure. Data is broken down by facility for internal performance benchmarking. Data is available for over 1,500 sites. Rather than provide facility level data in this submission data is grouped by facility type for operations in Australia and New Zealand (the majority of our emissions profile).
Attachments
Page: Emissions Scope 2 Contractual
14.1
Do you consider that the grid average factors used to report Scope 2 emissions in question 13 reflect the contractual arrangements you have with electricity suppliers? No
14.2
You may report a total contractual Scope 2 figure in response to this question. Please provide your total global contractual Scope 2 GHG emissions figure in metric tonnes CO2-e. 186278
14.3
Explain the origin of the alternative figure including information about the emission factors used and the tariffs.

The figure reported is based on applying the emissions factor for NSW (detailed in 11.4) and refers to Scope 2 emissions only and is not used in our calculation of transmission line losses. It is based on our current energy contract which includes 5,000 MWh purchase of accredited Greenpower (http://www.greenpower.gov.au/home.aspx) was purchased for our operations in NSW. This is equivalent to an emissions reduction of 4,450 tonnes above our reported figure. We do not count this figure in our reduction target in line with best practice local reporting and no longer include it as a reduction from our emissions total but as a separate line item in our reporting of electricity consumption. Whilst renewable energy is not specifically purchased in NZ approximately 60% of the national energy profile is hydro and geothermal. As such it can be assumed that a significant proportion of our electricity consumption in New Zealand is from renewable sources. The Emissions Factor used for electricity in New Zealand is based on a grid average. There is no green electricity option available in New Zealand.
14.4
Has your organization retired any certificates, e.g. Renewable Energy Certificates, associated with zero or low carbon electricity within the reporting year or has this been done on your behalf? No
14.5
Please provide details including the number and type of certificates.
Type of certificate
Number of certificates
Comments
Further Information
Attachments
Page: Emissions Scope 3
¿
Is question 15.1 relevant to your company? Yes
15.1
Please provide data on sources of Scope 3 emissions that are relevant to your organization.

Sources of Scope 3
emissions
Metric tonnes of
CO2-e
Methodology
If you cannot provide a figure for a
relevant source of Scope 3 emissions, please describe the
emissions.
Energy-related activities not included in scope 2
9842
Base building emissions calculated using the Scope 1 and 2 responses for electricity, gas and diesel generator methodologies (refer 11.4)
Energy-related activities not included in scope 2
28972
Transmission line losses- See methodology for electricity calculations outlined in 11.4. Emissions factors for the calculation of transmission line losses are: NSW/ACT – 0.18 VIC – 0.12 QLD – 0.12 SA – 0.14 WA – 0.10 TAS – 0.02 NT – 0.11 NZ – 0.02
Available for Australia & New Zealand only
Waste generated in operations
9944
Paper - Total tonnes purchased less recycled (Total tonnes includes stationery and other paper office products (eg paper towel, copying paper, marketing materials). Recycling includes office recycling and archive recycling. An emission factor of 2.5 is applied in Australia and 1.09 in New Zealand.
Business travel 9992
Air travel - In the absence of national standards the GHG Protocol Standards are applied in Australia. An emissions factor of 0.12 for domestic and 0.11 for international are used. Domestic flights include all internal and trans Tasman flights. Calculated in New Zealand using CarboNZero methodology and Emanage tool -. Data on passenger kilometres travelled is provided from our travel provider. Distances (kms) were supplied by the provider and are assumed to be an accurate reflection of the direct distance between flight points. Data is separated into domestic and international travel. All domestic travel is within New Zealand and flights to Australia are classified as International. The emission factors used are sourced from the New Zealand MfE. Guidance for voluntary, corporate greenhouse gas reporting. An aviation multiplier of 1.9 is applied to reflect the global warming potential of oxides of nitrogen that are emitted into the lower and upper atmospheres. Emission factor for Domestic – 0.336748219 International -0.222293425
Business travel 575
Fleet - See methodology for fleet described in 11.1 applying the Scope 3 emission factor outlined in the National Greenhouse Factors.
Waste generated in operations
1563 Waste to landfill - Emissions factor of 2.5 is applied to Total waste net of recycling for corporate centres. Due
Australian and New Zealand data only (excludes St.George)

Sources of Scope 3
emissions
Metric tonnes of
CO2-e
Methodology
If you cannot provide a figure for a
relevant source of Scope 3 emissions, please describe the
emissions.
to a lack of waste audit data at Westpac a generic carboNZero programme office waste emissions factor has been used. This is based on an estimate of food waste and paper waste sent to landfill by each FTE.
Business travel 285
Rental cars and use of personal vehicles - Calculated using CarboNZero methodology and Emanage tool - emissions factors were based on engine size/distance travelled.
Available for New Zealand only
Business travel 487
Taxis - Calculated using a methodology developed in house based on the average flag fall and mileage rates in each state and applying the National Greenhouse Factors for vehicle type according to the fleet proportions for each provider.
Available for Australia only
Business travel 42
Domestic hotel stays - Accommodation is recorded by the travel provider. Calculated using CarboNZero methodology
Available for New Zealand only
15.2
Please explain why not.
Further Information
Attachments
Page: Emissions 7
16.1
Does the use of your goods and/or services enable GHG emissions to be avoided by a third party? Yes
16.2

Please provide details including the anticipated timescale over which the emissions are avoided, in which sector of the economy they might help to avoid emissions and their potential to avoid emissions. Since re-invigorating our renewable energy strategy in 2008, Westpac has been involved in almost every large scale renewable energy infrastructure project undertaken. Currently an estimated 50% of our infrastructure and utilities financing is directed towards renewables (including hydro), totalling $1,110m and publicly reported in our 2009 Annual Review & Sustainability Report. As at September 2009, 700,000 retail customers have elected to receive their statements electronically since 2006, resulting in an emissions reduction of 310 tonnes. Since then an improved e-statements solutions has been rolled out to retail customers of Westpac Australia and New Zealand, St.George and BankSA results of which will be reported in our 2010 reporting. This is in addition to our internet banking offering currently used by 3.4 million customers. In December 2008, Westpac New Zealand launched an online ecoshop shopping site offering Westpac online banking customers exclusive savings on eco-conscious products. In October 2009, we merged ecoshop with our credit card reward programme, hotpoints®, to offer eco-conscious rewards. Green redemptions are also available to Australian Westpac customers. Westpac New Zealand Ltd is replacing customer ATM/EFTPOS cards with a product using plastic that is 100% recycled, manufactured by Earthworks System, Ohio USA, and printed by ABnote New Zealand. Westpac is currently investigating opportunities for customers to recycle expired financial cards in New Zealand and hopes to overcome issues such as security and the removal of the magnetic strip in the production process. In Australia, we have also worked with the Australian Federal Government to offer an interest free green loan for household energy and water efficiency activities. Although only in market for a few months take up was pleasing during this period.
¿
Is question 17.1 relevant to your company? Yes
17.1
Please provide your total carbon dioxide emissions in metric tonnes CO2 from the combustion of biologically sequestered carbon i.e. carbon dioxide emissions from burning biomass/biofuels. 0
17.2
Please explain why not.
Further Information
Attachments
Page: Emissions 8
18.1a

Please describe a financial intensity measurement for the reporting year for your gross combined Scope 1 and Scope 2 emissions. If you do not consider a financial intensity measurement to be relevant to your company, select "Not relevant" in column 5 and explain why in column 6.
Figure for Scope 1
and Scope 2
emissions
GHG units
Multiple of
currency unit
Currency unit
Financial intensity metrics
Please explain if not relevant. Alternatively provide
any contextual details that you consider relevant to
understand the units or figures you have provided.
5.45 Metric tonnes CO2-e
Thousand AUD ($) Revenue
Given that the established targets are absolute the focus of the Group has been on gross rather than intensity reductions. Intensity measures are primarily used for internal communication and benchmarking purposes and are linked to activity rather than financials. Consistent with previous submissions we have included a measure for tones CO2e per $ total segment revenue to assist those seeking to make comparisons on this basis. Note this does not include emissions associated with Property Trusts.
18.1b
Please describe an activity-related intensity measurement for the reporting year for your gross combined Scope 1 and Scope 2 emissions. Oil and gas sector companies are also asked to report activity-related intensity metrics in answer to table O&G1.3. If you do not consider an activity-related intensity measurement to be relevant to your company, select "Not relevant" in column 3 and explain why in column 4.
Figure for Scope 1
and Scope 2
emissions
GHG units
Activity-related metrics
Please explain if not relevant. Alternatively provide any contextual details that you consider relevant to understand the units or figures you have provided.
5.70 Metric tonnes CO2-e
per full-time equivalent employee
This measure is used primarily for internal employee engagement and context. Similar data is also provided for other areas of environmental performance, for instance paper consumption per employee. Note does not include emissions associated with Property Trusts.
0.30 Metric tonnes CO2-e
Other: per square metre
This figure is for our Australian operations and is primarily used for internal benchmarking and is typically reported by building type for the purposes of data extrapolation for the small number of sites for which data is unavailable and to benchmark individual sites. Note this does not include emissions associated with Property Trusts.
0.04 Metric tonnes CO2-e
Other: per square metre
This figure is for our New Zealand operations and is primarily used for internal benchmarking and is typically reported by building type for the purposes of data extrapolation for the small number of sites for which data is unavailable and to benchmark individual sites.

Figure for Scope 1
and Scope 2
emissions
GHG units
Activity-related metrics
Please explain if not relevant. Alternatively provide any contextual details that you consider relevant to understand the units or figures you have provided.
0.00 Metric tonnes CO2-e
Other: per active customer
This figure is 0.005 and is used by our New Zealand business and is reported here for NZ only. This is based on their customer acquisition strategy but does not hold the same relevance in Australia where the focus is on building relationships with existing customers and therefore changes may not accurately reflect increased activity in the business.
19.1
Do the absolute emissions (Scope 1 and Scope 2 combined) for the reporting year vary significantly compared to the previous year? Yes
19.2
Please explain why they have varied and why the variation is significant. The variation is described below and depicted in the waterfall chart attached. During the reporting year (2008/09) Westpac merged with St.George Bank Limited. With a branch network of almost 400 branches together with head office and operations centres this saw an additional 59,468 tonnes of Scope 1 and 2 emissions added to the Group profile during 2009. In light of this merger our 2008 baseline year was adjusted to include St.George emissions during this period also (64,097 tonnes) and our 5 year reduction target of 30% was extended and achieved across the combined Group. For a number of major sites within the St.George portfolio control has been retained for the base building as well as tenancy within the lease agreement. This has resulted in an increase in emissions per square metre and per employee (4.7 to 5.7 tonnes per employee). The finalisation of the National Greenhouse and Energy Reporting Act (2007) discussed in question 3.1 also resulted in changes to our boundary. This saw the inclusion of emissions from our property trusts for the first time. These emissions have been treated as a separate line item in our carbon accounts and we will be developing suitable targets to reduce these emissions. These totalled 10, 791 metric tonnes of CO2~e. There were a number of further changes that resulted in the reporting of 8,082 metric tonnes of CO2~e in additional emissions. These have not impacted the 2008 baseline and will be absorbed within existing targets for years 2 to 5 of our reduction program. This included the reporting of some small sites not previously included in our emissions profile and the inclusion of ATMs that are not attached to a branch or individually metered. We also changed our methodology for calculating fleet emissions. Previously 72% of fleet emissions were attributed to the business, in line with the taxation treatment of tool of trade work vehicles. We have changed to report 100% of these emissions to bring our reporting in line with local peers. Finally has been the inclusion of new categories of Scope 1 emissions to account for the emissions from backup diesel generators in Australia and refrigerant leakage in New Zealand. Refrigerant leakage is not reported in Australia as the threshold reporting requirements under the Act were not triggered and we seek to only have one set of figures in publication.
20.1A
Please complete the following table indicating the percentage of reported emissions that have been verified/assured and attach the relevant statement.
Scope 1 (Q12.1)
Scope 2 (Q13.1)
Scope 3 (Q15.1)
More than 80% but less than or equal to 100%
More than 80% but less than or equal to 100%
More than 80% but less than or equal to 100%

20.1B
I have attached an external verification statement that covers the following scopes: Scope 1 Scope 2 Scope 3
Further Information
Actual figures for 20.1A are in excess of 98%. Verification statements can be found at: Australia http://www.westpac.online-ar2009.com/index.php?option=com_content&view=article&id=96&Itemid=112 New Zealand http://www.carbonzero.co.nz/members/cemarscertified.asp#westpac New Zealand
Attachments
Page: Emissions 9 Trading
21.1
Do you participate in any emission trading schemes? No, we don't participate nor do we currently anticipate participating in any emissions trading scheme within the next two years.
21.2
Please complete the following table for each of the emission trading schemes in which you participate.
Scheme name
Period for
which data is
supplied.
Allowances allocated
Allowances purchased
Verified emissions - number
Verified emissions
- units
Details of ownership
Mon 01 Jan 0001 - Mon 01 Jan 0001
21.3
What is your strategy for complying with the schemes in which you participate or anticipate participating?
21.4

Has your company originated any project-based carbon credits or purchased any within the reporting period? Yes
21.5
Please complete the following table.
Credit originati
on or credit
purchase?
Project identificat
ion
URL link to project documentation
Verified to
which standar
d?
Number of
credits
(metric
tonnes of
CO2-e)
Credits
retired?
Purpose e.g.
compliance
Credit Purchase
Renewable energy – Micro Hydro China
http://www.originenergy.com.au/2704/Carbon-reduction-scheme VCS 1648 Yes Voluntary
Offsetting
Further Information
Offsets were purchased to offset a number of internal and external events as well as our annual reporting.
Attachments
Module: Climate Change Communications
Page: Communications 1
22.1
Have you published information about your company’s response to climate change/GHG emissions in other places than in your CDP response? Yes
22.2
In your Annual Reports or other mainstream filing? (If so, please attach your latest publication(s).) Yes
22.3

Through voluntary communications such as CSR reports? (If so, please attach your latest publication(s).) Yes
Further Information
Mainstream filings Half and Full Year Announcements Emissions data and performance against key aspects of our sustainability strategy, including climate change are included in our annual results submission to the Australian Securities Exchange. 2009 Full Year Profit Announcement refer page 54 http://www.westpac.com.au/about-westpac/investor-centre/presentations-webcasts/2009/full-year-results/ 2010 Half Year Profit Announcement refer page 49 http://www.westpac.com.au/about-westpac/investor-centre/presentations-webcasts/018-2010-presentations-and-webcasts/2010-half-year-results/ Investor Discussion Pack Also lodged with the ASX our investor discussion pack includes details of our emissions reduction targets and key elements of our climate change strategy. Refer slide 19 http://www.westpac.com.au/about-westpac/investor-centre/presentations-webcasts/018-2010-presentations-and-webcasts/2010-half-year-results/ Annual Report The roles and responsibilities of the Board in considering environmental risk, together with monitoring of environmental policy and our broader business principles. http://westpac.online-ar2009.com/index.php?option=com_content&view=article&id=112:5-environmental-disclosure&catid=21:directors-report&Itemid=249 http://westpac.online-ar2009.com/index.php?option=com_content&view=article&id=33&Itemid=42&limitstart=7 CSR Reporting This year our Annual Review and Sustainability Reports were combined reflecting the increasingly embedded nature of our sustainability strategy and our belief that sustainability is material to our business. A copy of the printed version is attached to this submission with more detailed emissions data available in our online report accessible at http://www.westpac.online-ar2009.com/index.php?option=com_content&view=frontpage&Itemid=1 Position Statement and Strategy In 2008 The Westpac Group launched a five year climate change strategy, the second iteration in our organisation response to climate change. This announcement included the release of a position paper on climate change and an overview of the five-year strategy. This document is available at http://www.westpac.com.au/docs/pdf/aw/Transit_to_low_carbon_econo1.pdf Online Further details on how we are progressing against this strategy, together with more general information on our environmental performance can be accessed at http://www.westpac.com.au/about-westpac/sustainability-and-community/environment/ Government submissions As outlined in question 9.11, our government submissions on climate change related issues, including emerging regulation on emissions trading, voluntary carbon markets, impacts on agriculture and water can be found at http://www.westpac.com.au/about-westpac/sustainability-and-community/environment/climate-change/communication-and-advocacy/ Newsletters and customer updates During the reporting period we reported our performance and position in a number of editions of our regular stakeholder newsletter, PACT (see http://us1.campaign-archive.com/?u=7a63f3a082e1f43269ae54acb&id=9b33027145&e=9177299ac2 for an example) In addition, in line with our value chain approach a number of customer publications were distributed during the year, particularly to customers likely to be impacted by the proposed emission trading schemes in Australia and New Zealand. A number of forums were also held with suppliers outlining our position. These also featured a presentation by a Westpac employee who has completed the Al Gore Climate Ambassador program. Since then a number of further presentations have also been undertaken at the request of suppliers for their broader employee audiences.
Attachments
CDP 2010 Investor CDP 2010 Information Request