
Program Evaluation: Effectiveness of Juvenile Justice ... · Program Evaluation: Effectiveness of...
91
Program Evaluation: Effectiveness of Juvenile Justice Facilities and Community- Based Services August 24, 2016 Report #16-06
Transcript of Program Evaluation: Effectiveness of Juvenile Justice ... · Program Evaluation: Effectiveness of...
Program Evaluation: Effectiveness of
Juvenile Justice Facilities and Community-
Based Services
August 24, 2016 Report #16-06
LEGISLATIVE FINANCE COMMITTEE
Senator John Arthur Smith, Chairman, Chairman Representative Jimmie C. Hall, Vice-Chairman
Representative Paul C. Bandy Senator Sue Wilson Beffort
Senator Pete Campos Senator Carlos R. Cisneros
Representative George Dodge, Jr. Representative Jason C. Harper
Representative Larry A. Larrañaga Senator Carroll H. Leavell
Representative Patricia A. Lundstrom Senator Howie C. Morales Senator George K. Muñoz Senator Steven P. Neville
Representative Nick L. Salazar Representative Luciano "Lucky" Varela
DIRECTOR
David Abbey
DEPUTY DIRECTOR FOR PROGRAM EVALUATION
Charles Sallee
PROGRAM EVALUATION TEAM
Michelle Aubel, CGFM Jon R. Courtney, Ph.D. Sarah M. Dinces, Ph.D. Nathan Eckberg, Esq. Jenny Felmley, Ph.D.
Brenda Fresquez, CICA Maria D. Griego
Brian Hoffmeister Christopher D. Jaramillo, J.D.
Travis McIntyre, Ph.D. Madelyn Serna Mármol, Ed.D.

EXECUTIVE SUMMARY ..................................................................................................................................... 1
KEY FINDINGS AND RECOMMENDATIONS ................................................................................................. 2
BACKGROUND ...................................................................................................................................................... 7
FINDINGS AND RECOMMENDATIONS ......................................................................................................... 13
CYFD Has Made Positive Gains in Client Outcomes Since Implementing a
Rehabilitative Model for Juvenile Justice Facilities........…………………………………………………13
CYFD Should Better Align Resources to the Changing Demands on Juvenile Justice Facilities….……..19
CYFD Is Improving Its Tracking of Facility Performance, but More Work is
Needed to Achieve Key Outcomes……………………………………………….……………………….27
The Structure of Juvenile Probation Field Offices Contributes to Inefficiencies in the System…...……..32
Community-Based Programs Require Better Oversight and
Data Collection to Ensure Outcomes Are Met…………………………………………………………….39
Multisystemic Therapy Provides Effective Treatment for its Target Population, but
Issues with Access Have Impacted Outcomes……………………….……………………………………47
Understanding the Drivers of Juvenile Justice Involvement Is Imperative to
Designing Effective Programs to Reduce Recidivism…….………………………………………………52
AGENCY RESPONSES ........................................................................................................................................ 59
APPENDICES ........................................................................................................................................................ 71
Appendix A: Evaluation Scope and Methodology………………………………………..………...........71
Appendix B: JJS Spending History by Program Area..............…………………………………………..72
Appendix C: New Mexico Juvenile Justice Client Referral Pathway…………...……………………….73
Appendix D: Missouri DYS Organizational Beliefs……………………………………………………..74
Appendix E: Elements of the Cambiar Model……………………………………………………………75
Appendix F: JJS Educational Facilities…………………………………………………………………..76
Appendix G: JJS Reintegration Centers…………………………….……………………………………77
Appendix H: Reintegration Center Client Recidivism……………………...……………………………78
Appendix I: Comparison of Selected Facility Performance…...…………………………………………79
Table of Contents

Appendix J: JJS Community Supervision Level Matrix...……………………………………………….80
Appendix K: List of Juvenile Justice Continuum Sites and Programs.........……………………………..81
Appendix L: FY15-FY17 Juvenile Justice Continuum Grant Awards………..………………………….82
Appendix M: Juvenile Community Corrections Discharge Criteria…….……………………………….83
Appendix N: Additional MST Information………………………………...…………………………….84
Appendix O: Facility and Probation Risk and Needs Assessments………..…………………………….85
Appendix P: Structured Decision Making Risk and Needs Assessment Scoring Criteria...……………..86
Effectiveness of Juvenile Justice Facilities and Community-Based Services | Report # 16-06 | August 24, 2016 1
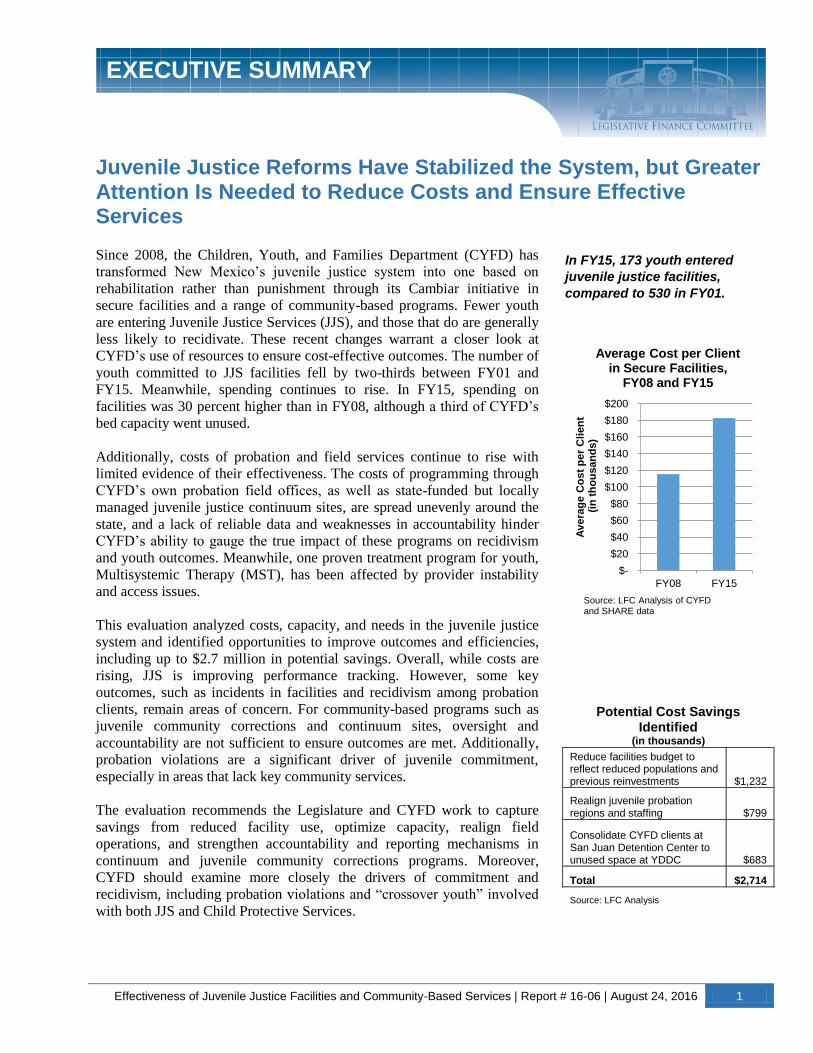
Juvenile Justice Reforms Have Stabilized the System, but Greater Attention Is Needed to Reduce Costs and Ensure Effective Services
Since 2008, the Children, Youth, and Families Department (CYFD) has
transformed New Mexico’s juvenile justice system into one based on
rehabilitation rather than punishment through its Cambiar initiative in
secure facilities and a range of community-based programs. Fewer youth
are entering Juvenile Justice Services (JJS), and those that do are generally
less likely to recidivate. These recent changes warrant a closer look at
CYFD’s use of resources to ensure cost-effective outcomes. The number of
youth committed to JJS facilities fell by two-thirds between FY01 and
FY15. Meanwhile, spending continues to rise. In FY15, spending on
facilities was 30 percent higher than in FY08, although a third of CYFD’s
bed capacity went unused.
Additionally, costs of probation and field services continue to rise with
limited evidence of their effectiveness. The costs of programming through
CYFD’s own probation field offices, as well as state-funded but locally
managed juvenile justice continuum sites, are spread unevenly around the
state, and a lack of reliable data and weaknesses in accountability hinder
CYFD’s ability to gauge the true impact of these programs on recidivism
and youth outcomes. Meanwhile, one proven treatment program for youth,
Multisystemic Therapy (MST), has been affected by provider instability
and access issues.
This evaluation analyzed costs, capacity, and needs in the juvenile justice
system and identified opportunities to improve outcomes and efficiencies,
including up to $2.7 million in potential savings. Overall, while costs are
rising, JJS is improving performance tracking. However, some key
outcomes, such as incidents in facilities and recidivism among probation
clients, remain areas of concern. For community-based programs such as
juvenile community corrections and continuum sites, oversight and
accountability are not sufficient to ensure outcomes are met. Additionally,
probation violations are a significant driver of juvenile commitment,
especially in areas that lack key community services.
The evaluation recommends the Legislature and CYFD work to capture
savings from reduced facility use, optimize capacity, realign field
operations, and strengthen accountability and reporting mechanisms in
continuum and juvenile community corrections programs. Moreover,
CYFD should examine more closely the drivers of commitment and
recidivism, including probation violations and “crossover youth” involved
with both JJS and Child Protective Services.
EXECUTIVE SUMMARY
In FY15, 173 youth entered
juvenile justice facilities,
compared to 530 in FY01.
$-
$20
$40
$60
$80
$100
$120
$140
$160
$180
$200
FY08 FY15 A
vera
ge
Co
st
pe
r C
lien
t (
in t
ho
us
an
ds
)
Average Cost per Client in Secure Facilities,
FY08 and FY15
Source: LFC Analysis of CYFD and SHARE data
Potential Cost Savings Identified
(in thousands)
Reduce facilities budget to reflect reduced populations and previous reinvestments $1,232
Realign juvenile probation regions and staffing $799
Consolidate CYFD clients at San Juan Detention Center to unused space at YDDC $683
Total $2,714
Source: LFC Analysis

2 Effectiveness of Juvenile Justice Facilities and Community-Based Services | Report # 16-06 | August 24, 2016
CYFD invested $3.3 million between FY07 and FY13 to implement a
customized version of the Missouri Model for juvenile justice facilities
emphasizing treatment over incarceration known as Cambiar New Mexico.
The Missouri Model, and by extension New Mexico’s Cambiar model,
emphasizes rehabilitation over incarceration in a humane environment
which has shown improved outcomes for committed youth. Programming
in New Mexico’s juvenile justice facilities is based on a group treatment
approach with an emphasis on therapeutic programs and educational
attainment.
LFC staff analysis of data from CYFD shows that, for youth released from
New Mexico’s facilities in FY05, 79 percent did not recidivate within three
years. For youth released in FY10, this number fell to 70 percent, but grew
again to 82 percent for youth released in FY13. These results compare
favorably to a 2010 study of results from Missouri. However, LFC staff
found that juvenile probation clients in New Mexico consistently
recidivated into the juvenile system at higher rates than those released from
facilities. Additionally, current methods of measuring juvenile recidivism
in New Mexico do not provide a full picture of what is driving youth to
recidivate.
Implementation of Cambiar has not proven successful in generating cost
savings for facilities. The average daily population in facilities has been
steadily decreasing, leading to excess capacity and higher costs per client.
CYFD spent $35.7 million on secure facilities in FY15, 30 percent higher
than the amount spent in FY08, at the beginning of Cambiar
implementation. A key element of Cambiar is smaller, less institutional
facilities, but any new facilities would be cost prohibitive at this time. New
Mexico also has not captured savings from the closure of the New Mexico
Boys’ School and Lincoln Pines Youth Center.
Youth care specialists perform a critical security function in facilities, but
also mentor clients and serve as case managers alongside behavioral health
and education staff. While CYFD’s facilities are in compliance with
federal staffing requirements, LFC analysis suggests they may be
overstaffed relative to population as vacancy rates for youth care specialists
have decreased.
Reintegration centers offer positive results, but CYFD is not maximizing
use of this resource. A juvenile may be approved to reside in a
reintegration center as part of supervised release or the terms of probation
in order to gain work experience, life skills, and education in a less secure
but structured environment. Youth who entered reintegration centers after
exiting commitment represented a significantly lower proportion of total
recidivism than those who did not, but these centers have only operated at
slightly over half of capacity since FY13.
KEY FINDINGS AND RECOMMENDATIONS
CYFD has made positive gains in client outcomes
since implementing a rehabilitative model for
juvenile justice facilities.
CYFD should better align resources to the changing demands on
juvenile justice facilities.
0%
10%
20%
30%
40%
50%
60%
70%
80%
90%
FY13 FY14 FY15
Average Daily Population as
Percentage of Secure Facility Capacity, FY13-
FY15
Source: LFC Analysis
Effectiveness of Juvenile Justice Facilities and Community-Based Services | Report # 16-06 | August 24, 2016 3
The performance of New Mexico’s secure juvenile commitment facilities
is improving relative to other states on national outcome standards. CYFD
contracts with Performance-Based Standards (PbS) to track and measure
performance in secure facilities. CYFD has shown improvement on these
measures relative to the national average in several domains. However,
PbS is not a national accrediting organization like the American
Correctional Association, and none of CYFD’s facilities are accredited.
Additionally, CYFD certifies local youth detention centers for compliance
with state standards, but does not have comparable requirements for its
own facilities.
The rate of incidents in secure facilities has doubled since FY11, despite
decreases in facility population. There were an average of 20 incidents per
client in secure facilities in FY15, compared to 11 in FY11. Additionally,
CYFD’s reporting of incidents does not adequately address safety, and the
Department could not locate a previous evaluation of incidents resulting in
youth room confinement.
Juvenile probation officers perform a multifaceted role as a youth’s main
point of contact with the juvenile justice system, from risk assessments to
supervised release and transition services. Despite fewer referrals to JJS,
probation and field services costs continue to rise and workloads are
unevenly distributed, with top-heavy management in some areas.
Variations in caseloads also suggest a need for more balanced allocation of
staff and resources.
The juvenile justice continuum model serves approximately eight thousand
youth through community-based prevention, diversion, and treatment
programming. Roughly 32 thousand youth, including those in counties
with high rates of referred charges, remain unserved by continuum sites.
Meanwhile, the costs of continuum-funded services are rising as demand
grows, but resources are distributed unevenly around the state, with large
variation in cost per client.
CYFD faces significant issues with the reliability of data from continuum
sites, making it difficult to determine program effectiveness and fidelity.
Required performance measures do not track long-term outcomes, and
programs do not collect and report data to CYFD in a uniform and
consistent manner.
Oversight of juvenile community corrections (JCC) is not sufficient to
ensure desired outcomes are met. Fewer than half of clients discharged
from JCC since FY13 have successfully completed the program, and
discharge criteria may lead to undercounting of clients who do not
successfully complete goals or requirements. Requirements for the use of
evidence-based programming by JCC providers are weak, and instability in
the provider network has contributed to the discharge of clients before they
can complete the program.
Multisystemic Therapy (MST) is an evidence-based treatment with a
proven track record in reducing recidivism and improving outcomes for
juveniles. However, the number of MST clients served in New Mexico has
declined in recent years due to provider availability. About half the state’s
counties do not have access to this evidence-based program, although an
CYFD is improving its tracking of facility performance, but more work is needed to achieve key outcomes.
The structure of juvenile probation field offices contributes to inefficiencies in the system.
Community-based programs require better oversight and data collection to ensure outcomes are met.
Multisystemic Therapy provides effective treatment for its target population, but issues with access have impacted outcomes.
4 Effectiveness of Juvenile Justice Facilities and Community-Based Services | Report # 16-06 | August 24, 2016
ongoing evaluation shows results in reducing both costs and recidivism in
the state.
While New Mexico has experienced positive gains from MST, progress
diminished in recent years in various areas, including re-arrests and out-of-
home placements. However, continued investment in MST could be
beneficial in New Mexico, as it has been shown to reduce recidivism and
improve functionality, especially among Hispanic youth.
Between FY13 and FY15, on average, 59 percent of commitments to
juvenile facilities were related to probation violations. Counties with the
highest rates of commitment due to juvenile probation violations often lack
key services in the community.
Children involved in the child welfare system are at higher risk of entering
the juvenile justice system, offering a prime opportunity for CYFD to
target services to this population. A 2016 New Mexico Sentencing
Commission report found a significant majority of committed youth had
experienced four or more adverse childhood experiences, and CYFD
analysis shows 46 percent of youth who recidivated within 12 months had
a previous history of substantiated involvement with Child Protective
Services. CYFD is uniquely positioned to work with these “crossover
youth,” but faces limitations such as the inability to easily track clients
between JJS and Child Protective Services on an aggregate level.
Between FY07 and FY15, over 80 percent of juvenile justice clients in
facilities were assessed as high risk and high or moderate need through
CYFD’s risk and needs assessment tool. Juveniles committed to facilities
exhibited higher risk and needs, whereas those on probation were more
likely to be assessed as having moderate or low risk and need.
Understanding the drivers of juvenile
justice involvement is imperative to designing
effective programs to reduce recidivism.

Effectiveness of Juvenile Justice Facilities and Community-Based Services | Report # 16-06 | August 24, 2016 5
Key Recommendations
The Legislature should consider:
Reducing the JJS facilities budget by $1.2 million to reflect declining
facility populations net of reinvestments that have already occurred and
consider further reinvestment opportunities, including evidence-based field
services.
CYFD should:
Continue to perform cohort-specific recidivism analysis, including what
offenses are most closely linked to recidivism, and report results to the
Legislature;
Update the 2010 Facilities Master Plan to address issues of excess capacity
and reduce fixed costs associated with lower committed populations,
including identifying ways to better align facilities with the Cambiar Model
in a cost effective manner, and present the updated plan to the Legislature;
As part of the annual appropriations process, evaluate the JJS budget and
and identify opportunities to achieve efficiencies and cost reductions by
reallocating resources and optimizing unused space, such as by reassigning
youth from the San Juan County Detention Center to empty units at the
Youth Diagnostic and Development Center (YDDC) and shifting funds
from facilities to evidence-based field programming that better aligns with
the proportion of the juvenile justice population receiving these services,
and clearly document any savings associated with identified efficiencies
and requests to reinvest savings in other JJS programs or programs at
CYFD;
Re-evaluate criteria for reintegration center admission to ensure they are
operating at capacity, or consider consolidating these facilities;
Work with Legislative Finance Committee and Department of Finance and
Administration (DFA) staff to fine tune performance measures for assault
and battery on staff and peers in facilities to better report safety concerns;
Create reporting and performance measures to track incidents where
facility clients are placed in isolation and report this data to the Legislature;
Continually assess juvenile probation officer (JPO) staffing needs relative
to referral and caseload patterns and consider reorganizing the existing
regional and district structure to flatten disparities in management span of
control;
Align the recidivism performance measure for continuum grant recipients
to be consistent with CYFD’s existing performance measures for tracking
recidivism within two years rather than 90 days;
Work with LFC and DFA staff to create a common set of Accountability in
Government Act (AGA) performance measures for continuum sites and
juvenile community corrections to allow for the tracking of youth success
in these community-based interventions;

6 Effectiveness of Juvenile Justice Facilities and Community-Based Services | Report # 16-06 | August 24, 2016
Strengthen requirements for evidence-based programming in JCC contracts
and consider promulgating rules containing requirements similar to those
for continuum programs;
Increase the emphasis on provider performance, including rates of
successful JCC completion, when soliciting, extending, and renewing JCC
provider contracts;
Work with the Human Services Department (HSD) to identify providers,
build MST teams in high-risk areas, and collaborate on tracking referrals,
utilization, and spending as part of a strategy to prioritize evidence-based
behavioral health services;
Further study the causes for high commitment rates for juvenile probation
violations;
Formalize policy coordination between Child Protective Services (CPS)
and Juvenile Justice Services (JJS) for dually-involved youth; and
Identify data reporting needs for working with crossover youth and design
services to address the needs of this population.
Effectiveness of Juvenile Justice Facilities and Community-Based Services | Report # 16-06 | August 24, 2016 7
Fewer Youth Are Entering New Mexico’s Juvenile Justice System
Overview of JJS
The Juvenile Justice Services (JJS) Division of the Children, Youth, and
Families Department (CYFD) is responsible for administering New
Mexico’s system of juvenile correction, supervision, and rehabilitation,
with the goal of helping youth become contributing members of society.
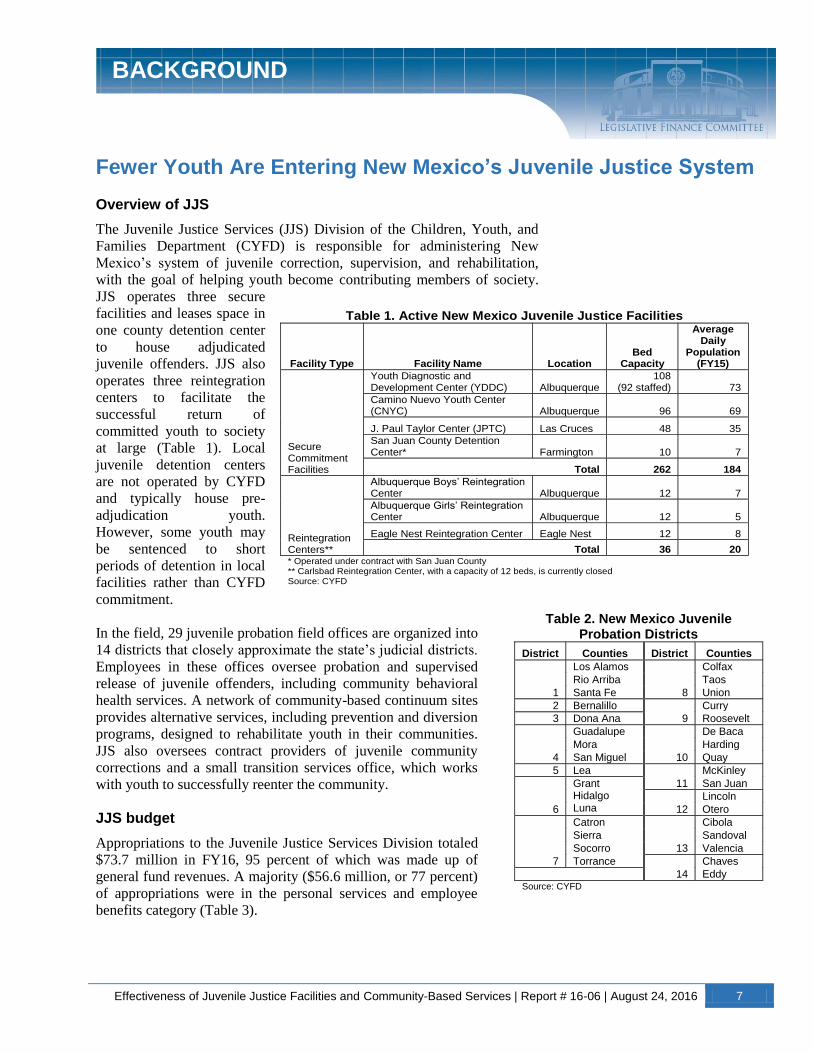
JJS operates three secure
facilities and leases space in
one county detention center
to house adjudicated
juvenile offenders. JJS also
operates three reintegration
centers to facilitate the
successful return of
committed youth to society
at large (Table 1). Local
juvenile detention centers
are not operated by CYFD
and typically house pre-
adjudication youth.
However, some youth may
be sentenced to short
periods of detention in local
facilities rather than CYFD
commitment.
In the field, 29 juvenile probation field offices are organized into
14 districts that closely approximate the state’s judicial districts.
Employees in these offices oversee probation and supervised
release of juvenile offenders, including community behavioral
health services. A network of community-based continuum sites
provides alternative services, including prevention and diversion
programs, designed to rehabilitate youth in their communities.
JJS also oversees contract providers of juvenile community
corrections and a small transition services office, which works
with youth to successfully reenter the community.
JJS budget
Appropriations to the Juvenile Justice Services Division totaled
$73.7 million in FY16, 95 percent of which was made up of
general fund revenues. A majority ($56.6 million, or 77 percent)
of appropriations were in the personal services and employee
benefits category (Table 3).
BACKGROUND
Table 2. New Mexico Juvenile
Probation Districts
District Counties District Counties
1
Los Alamos
8
Colfax
Rio Arriba Taos
Santa Fe Union
2 Bernalillo
9
Curry
3 Dona Ana Roosevelt
4
Guadalupe
10
De Baca
Mora Harding
San Miguel Quay
5 Lea
11
McKinley
6
Grant Hidalgo Luna
San Juan
12
Lincoln
Otero
7
Catron
13
Cibola
Sierra Sandoval
Socorro Valencia
Torrance
14
Chaves
Eddy Source: CYFD
Table 1. Active New Mexico Juvenile Justice Facilities
Facility Type Facility Name Location Bed
Capacity
Average Daily
Population (FY15)
Secure Commitment Facilities
Youth Diagnostic and Development Center (YDDC) Albuquerque
108 (92 staffed) 73
Camino Nuevo Youth Center (CNYC) Albuquerque 96 69
J. Paul Taylor Center (JPTC) Las Cruces 48 35
San Juan County Detention Center* Farmington 10 7
Total 262 184
Reintegration Centers**
Albuquerque Boys’ Reintegration Center Albuquerque 12 7
Albuquerque Girls’ Reintegration Center Albuquerque 12 5
Eagle Nest Reintegration Center Eagle Nest 12 8
Total 36 20 * Operated under contract with San Juan County ** Carlsbad Reintegration Center, with a capacity of 12 beds, is currently closed Source: CYFD
8 Effectiveness of Juvenile Justice Facilities and Community-Based Services | Report # 16-06 | August 24, 2016
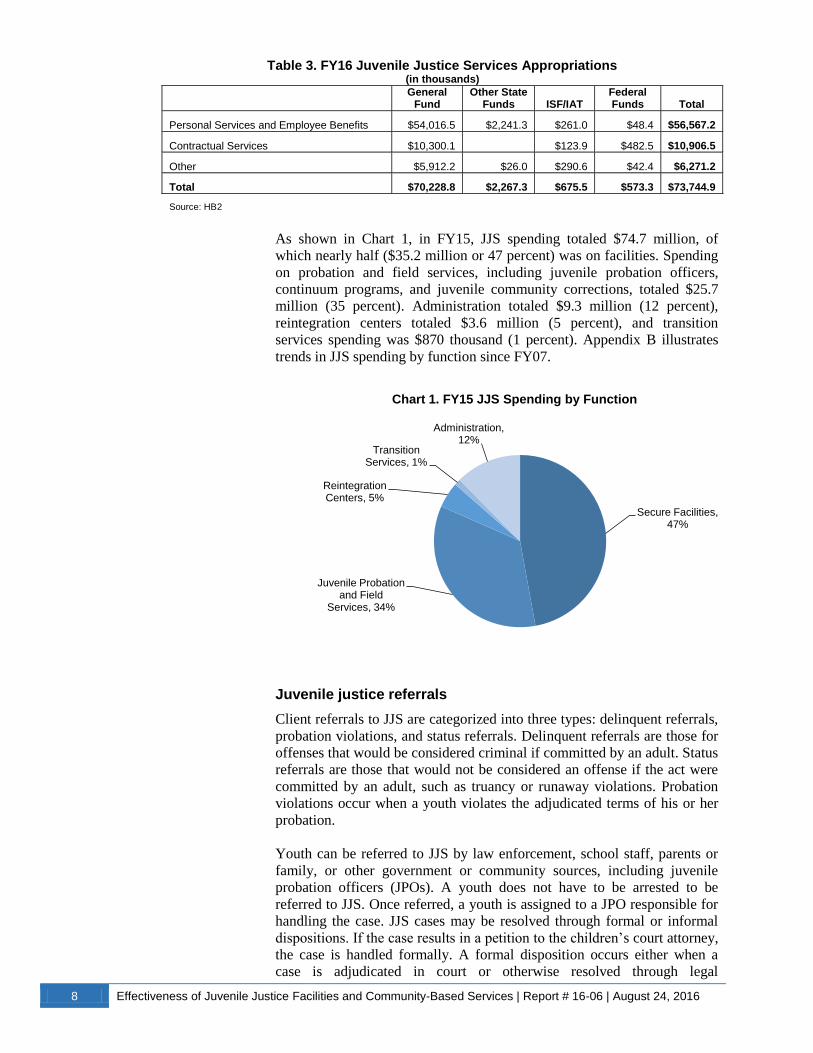
As shown in Chart 1, in FY15, JJS spending totaled $74.7 million, of
which nearly half ($35.2 million or 47 percent) was on facilities. Spending
on probation and field services, including juvenile probation officers,
continuum programs, and juvenile community corrections, totaled $25.7
million (35 percent). Administration totaled $9.3 million (12 percent),
reintegration centers totaled $3.6 million (5 percent), and transition
services spending was $870 thousand (1 percent). Appendix B illustrates
trends in JJS spending by function since FY07.
Juvenile justice referrals
Client referrals to JJS are categorized into three types: delinquent referrals,
probation violations, and status referrals. Delinquent referrals are those for
offenses that would be considered criminal if committed by an adult. Status
referrals are those that would not be considered an offense if the act were
committed by an adult, such as truancy or runaway violations. Probation
violations occur when a youth violates the adjudicated terms of his or her
probation.
Youth can be referred to JJS by law enforcement, school staff, parents or
family, or other government or community sources, including juvenile
probation officers (JPOs). A youth does not have to be arrested to be
referred to JJS. Once referred, a youth is assigned to a JPO responsible for
handling the case. JJS cases may be resolved through formal or informal
dispositions. If the case results in a petition to the children’s court attorney,
the case is handled formally. A formal disposition occurs either when a
case is adjudicated in court or otherwise resolved through legal
Secure Facilities, 47%
Juvenile Probation and Field
Services, 34%
Reintegration Centers, 5%
Transition Services, 1%
Administration, 12%
Chart 1. FY15 JJS Spending by Function
Table 3. FY16 Juvenile Justice Services Appropriations (in thousands)
General
Fund Other State
Funds ISF/IAT Federal Funds Total
Personal Services and Employee Benefits $54,016.5 $2,241.3 $261.0 $48.4 $56,567.2
Contractual Services $10,300.1 $123.9 $482.5 $10,906.5
Other $5,912.2 $26.0 $290.6 $42.4 $6,271.2
Total $70,228.8 $2,267.3 $675.5 $573.3 $73,744.9
Source: HB2

Effectiveness of Juvenile Justice Facilities and Community-Based Services | Report # 16-06 | August 24, 2016 9
proceedings such as dismissal or a consent decree. Adjudicated cases may
result in probation or commitment to a CYFD facility. Cases that do not
involve a children’s court petition are handled informally, and may result
in informal probation or referral to other services such as diversion
programming. Appendix C contains a diagram showing the JJS client
referral pathway.
The number of charges referred to JJS has
been steadily decreasing, with a decline of
41 percent between FY09 and FY15. While
all types of charges have seen reductions, the
overall decrease is primarily driven by
declines in delinquent referrals, the most
common type, which fell by 44 percent
during the same period. There were roughly
24 thousand total charges referred to JJS in
FY09, of which 20 thousand, or 84 percent,
were delinquent. In FY15, there were 14
thousand charges referred, of which 11
thousand, or around 80 percent, were
delinquent (Chart 2).
The number of status offense charges referred fell by 25 percent and
probation violations fell by 18 percent during the FY09-FY15 However,
with the decline in delinquent referrals, status referrals and probation
violations make up a growing portion of all referred charges. In FY09, 11
percent of all referred charges were for status offenses and 6 percent were
for probation violations. In FY15, 13 percent were for status offenses and 8
percent were for probation violations.
Similarly, the number of individual clients
referred has decreased by 39 percent
between FY09 and FY15, from roughly 18
thousand to about 11 thousand. A single
client may have multiple charges referred.
The number of clients receiving a delinquent
referral fell from just under 15 thousand, or
about 82 percent of all clients, in FY09 to
under nine thousand, or about 77 percent of
all clients, in FY15 (Chart 3). Clients
receiving status referrals made up 13 percent
of clients referred to JJS in FY09, compared
to 15 percent in FY15. The number of clients
receiving probation violation referrals grew
from 6 percent of referred clients in FY09 to
8 percent in FY15.
0
5,000
10,000
15,000
20,000
25,000
FY09 FY10 FY11 FY12 FY13 FY14 FY15
Chart 2. Total Charges Referred to JJS by Type, FY09-FY15
Delinquent Probation Violation Status
Source: CYFD
0
2,000
4,000
6,000
8,000
10,000
12,000
14,000
16,000
18,000
20,000
FY09 FY10 FY11 FY12 FY13 FY14 FY15
Chart 3. Number of Clients Referred to JJS by Referral Type, FY09-FY15
Delinquent Probation Violation Status Source: CYFD
10 Effectiveness of Juvenile Justice Facilities and Community-Based Services | Report # 16-06 | August 24, 2016
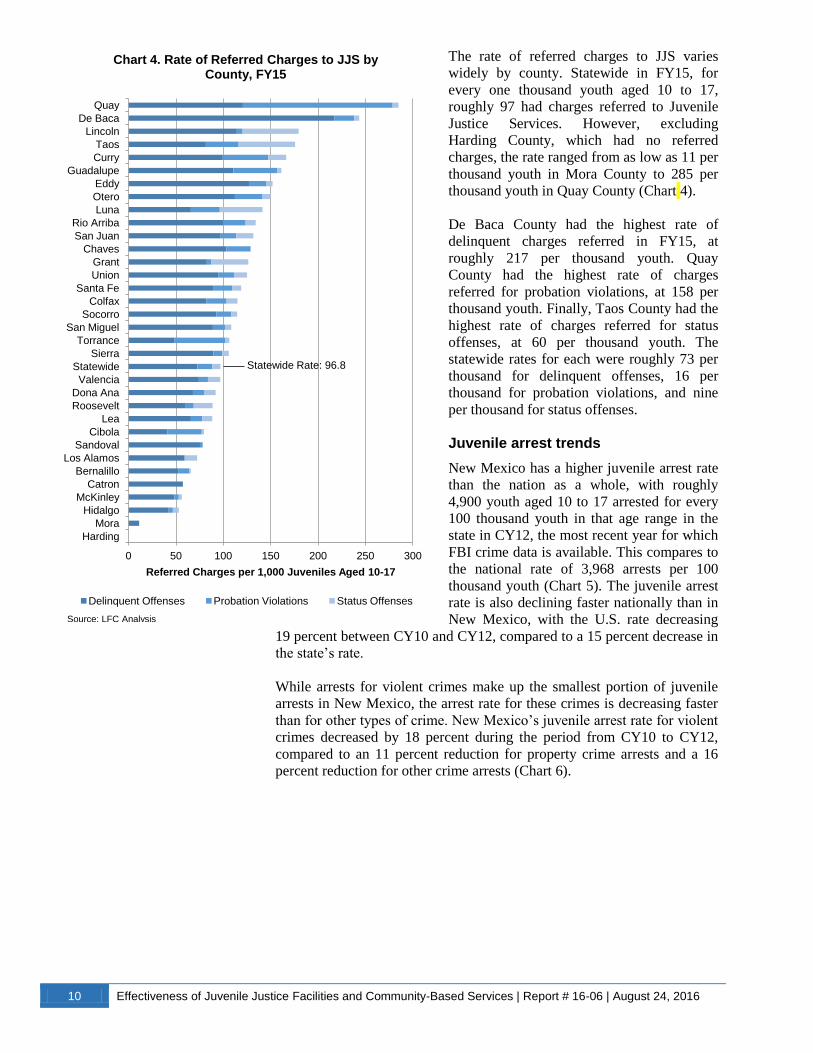
The rate of referred charges to JJS varies
widely by county. Statewide in FY15, for
every one thousand youth aged 10 to 17,
roughly 97 had charges referred to Juvenile
Justice Services. However, excluding
Harding County, which had no referred
charges, the rate ranged from as low as 11 per
thousand youth in Mora County to 285 per
thousand youth in Quay County (Chart 4).
De Baca County had the highest rate of
delinquent charges referred in FY15, at
roughly 217 per thousand youth. Quay
County had the highest rate of charges
referred for probation violations, at 158 per
thousand youth. Finally, Taos County had the
highest rate of charges referred for status
offenses, at 60 per thousand youth. The
statewide rates for each were roughly 73 per
thousand for delinquent offenses, 16 per
thousand for probation violations, and nine
per thousand for status offenses.
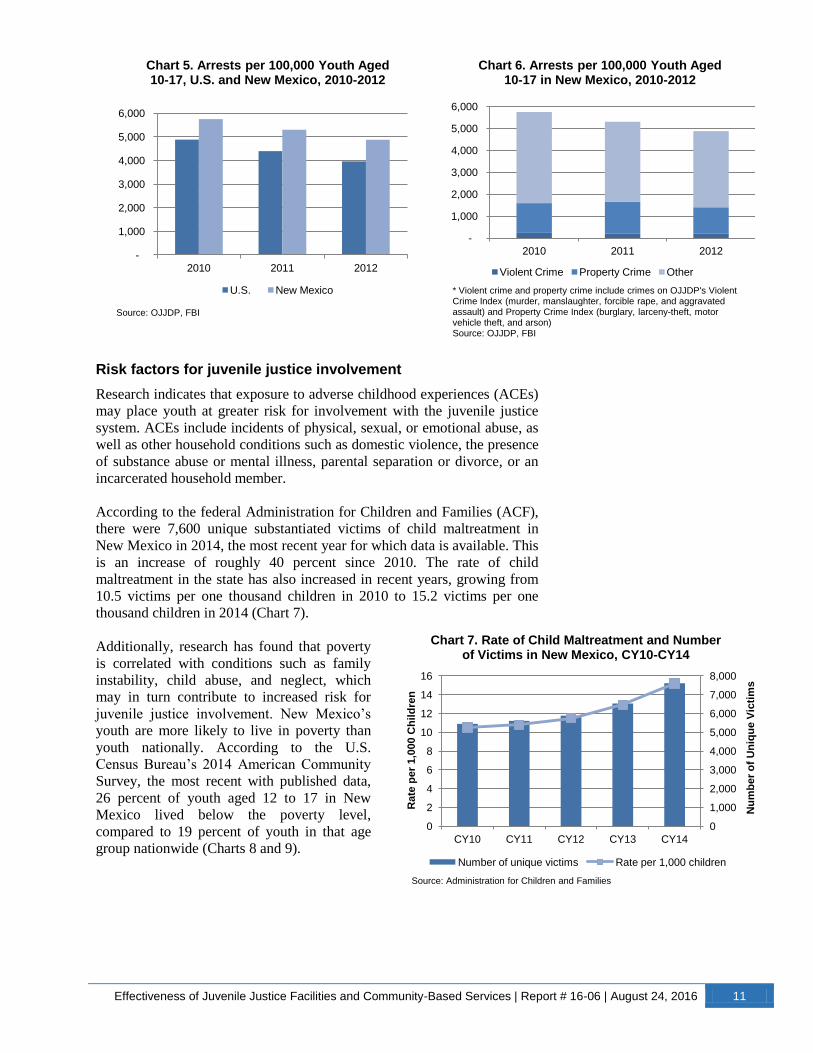
Juvenile arrest trends
New Mexico has a higher juvenile arrest rate
than the nation as a whole, with roughly
4,900 youth aged 10 to 17 arrested for every
100 thousand youth in that age range in the
state in CY12, the most recent year for which
FBI crime data is available. This compares to
the national rate of 3,968 arrests per 100
thousand youth (Chart 5). The juvenile arrest
rate is also declining faster nationally than in
New Mexico, with the U.S. rate decreasing
19 percent between CY10 and CY12, compared to a 15 percent decrease in
the state’s rate.
While arrests for violent crimes make up the smallest portion of juvenile
arrests in New Mexico, the arrest rate for these crimes is decreasing faster
than for other types of crime. New Mexico’s juvenile arrest rate for violent
crimes decreased by 18 percent during the period from CY10 to CY12,
compared to an 11 percent reduction for property crime arrests and a 16
percent reduction for other crime arrests (Chart 6).
0 50 100 150 200 250 300
Harding
Mora
Hidalgo
McKinley
Catron
Bernalillo
Los Alamos
Sandoval
Cibola
Lea
Roosevelt
Dona Ana
Valencia
Statewide
Sierra
Torrance
San Miguel
Socorro
Colfax
Santa Fe
Union
Grant
Chaves
San Juan
Rio Arriba
Luna
Otero
Eddy
Guadalupe
Curry
Taos
Lincoln
De Baca
Quay
Referred Charges per 1,000 Juveniles Aged 10-17
Chart 4. Rate of Referred Charges to JJS by County, FY15
Delinquent Offenses Probation Violations Status Offenses
Source: LFC Analysis
Statewide Rate: 96.8
Effectiveness of Juvenile Justice Facilities and Community-Based Services | Report # 16-06 | August 24, 2016 11
Risk factors for juvenile justice involvement
Research indicates that exposure to adverse childhood experiences (ACEs)
may place youth at greater risk for involvement with the juvenile justice
system. ACEs include incidents of physical, sexual, or emotional abuse, as
well as other household conditions such as domestic violence, the presence
of substance abuse or mental illness, parental separation or divorce, or an
incarcerated household member.
According to the federal Administration for Children and Families (ACF),
there were 7,600 unique substantiated victims of child maltreatment in
New Mexico in 2014, the most recent year for which data is available. This
is an increase of roughly 40 percent since 2010. The rate of child
maltreatment in the state has also increased in recent years, growing from
10.5 victims per one thousand children in 2010 to 15.2 victims per one
thousand children in 2014 (Chart 7).
Additionally, research has found that poverty
is correlated with conditions such as family
instability, child abuse, and neglect, which
may in turn contribute to increased risk for
juvenile justice involvement. New Mexico’s
youth are more likely to live in poverty than
youth nationally. According to the U.S.
Census Bureau’s 2014 American Community
Survey, the most recent with published data,
26 percent of youth aged 12 to 17 in New
Mexico lived below the poverty level,
compared to 19 percent of youth in that age
group nationwide (Charts 8 and 9).
-
1,000
2,000
3,000
4,000
5,000
6,000
2010 2011 2012
Chart 5. Arrests per 100,000 Youth Aged 10-17, U.S. and New Mexico, 2010-2012
U.S. New Mexico
Source: OJJDP, FBI
-
1,000
2,000
3,000
4,000
5,000
6,000
2010 2011 2012
Chart 6. Arrests per 100,000 Youth Aged 10-17 in New Mexico, 2010-2012
Violent Crime Property Crime Other
* Violent crime and property crime include crimes on OJJDP's Violent Crime Index (murder, manslaughter, forcible rape, and aggravated assault) and Property Crime Index (burglary, larceny-theft, motor vehicle theft, and arson) Source: OJJDP, FBI
0
1,000
2,000
3,000
4,000
5,000
6,000
7,000
8,000
0
2
4
6
8
10
12
14
16
CY10 CY11 CY12 CY13 CY14
Nu
mb
er
of
Un
iqu
e V
icti
ms
Rate
pe
r 1,0
00 C
hil
dre
n
Chart 7. Rate of Child Maltreatment and Number of Victims in New Mexico, CY10-CY14
Number of unique victims Rate per 1,000 children
Source: Administration for Children and Families

12 Effectiveness of Juvenile Justice Facilities and Community-Based Services | Report # 16-06 | August 24, 2016
Recent Juvenile Justice Services performance
Through FY16, JJS has reported mixed outcomes on certain key
performance measures. While the percentage of clients readjudicated
within two years has remained steady, the percentage of clients
recommitted to a CYFD facility after being discharged from a CYFD
facility grew after decreasing in FY15. Moreover, the percentage of
discharged clients entering adult corrections within two years is steadily
increasing. Use-of-force incidents in JJS facilities remained relatively
stable, but the number of physical assaults through Q4 of FY16 is well
above the two preceding years.
Disputes and agreements with the ACLU
In 2006, CYFD entered into the first of a series of agreements with the
American Civil Liberties Union of New Mexico (ACLU) in response to
complaints of inadequate care and safety conditions in JJS facilities. CYFD
and the ACLU entered into the most recent of these agreements in 2014,
under which CYFD agreed to implement a telephone reporting system for
grievances and allegations of abuse or neglect, as well as hire independent
evaluators to review the grievance system and instances of room
confinement of youth. Under previous agreements, CYFD implemented
steps such as creating the JJS Office of Quality Assurance to monitor
compliance with the agreements and CYFD’s policies and procedures,
including the use of room confinement, and the use of the Performance-
Based Standards (PbS) data monitoring system, a national model that
allows CYFD to track performance of a variety of safety, health, and other
indicators against the field of facilities nationwide. Currently, the ACLU
continues to contest CYFD’s compliance with the 2014 agreement, and
discussions remain ongoing.
Table 4. Key JJS Performance Measures, FY14-FY16
Measure FY14 FY15 FY16 (Q4)
Clients who successfully complete formal probation 82% 83% 85%
Clients re-adjudicated within 2 years 6% 6% 6%
Clients recommitted to a CYFD facility within 2 years 10% 8% 10%
Clients who enter adult corrections within 2 years of JJS facility discharge 7% 12% 13%
Incidents in JJS facilities requiring use of force resulting in injury 2% 2% 2%
Number of physical assaults in JJS facilities 346 374 448 Source: CYFD FY16 Q3 Performance Report
Below Poverty Level, 26%
At or Above Poverty Level, 74%
Chart 8. Poverty Status of New Mexico Youth Aged 12-17, 2014
(N=166,749)
Source: American Community Survey
Below Poverty Level, 19%
At or Above Poverty Level, 81%
Chart 9. Poverty Status of U.S. Youth Aged 12-17, 2014
(N=24,656,881)
Source: American Community Survey
Effectiveness of Juvenile Justice Facilities and Community-Based Services | Report # 16-06 | August 24, 2016 13
CYFD Has Made Positive Gains in Client Outcomes Since Implementing a Rehabilitative Model for Juvenile Justice Facilities
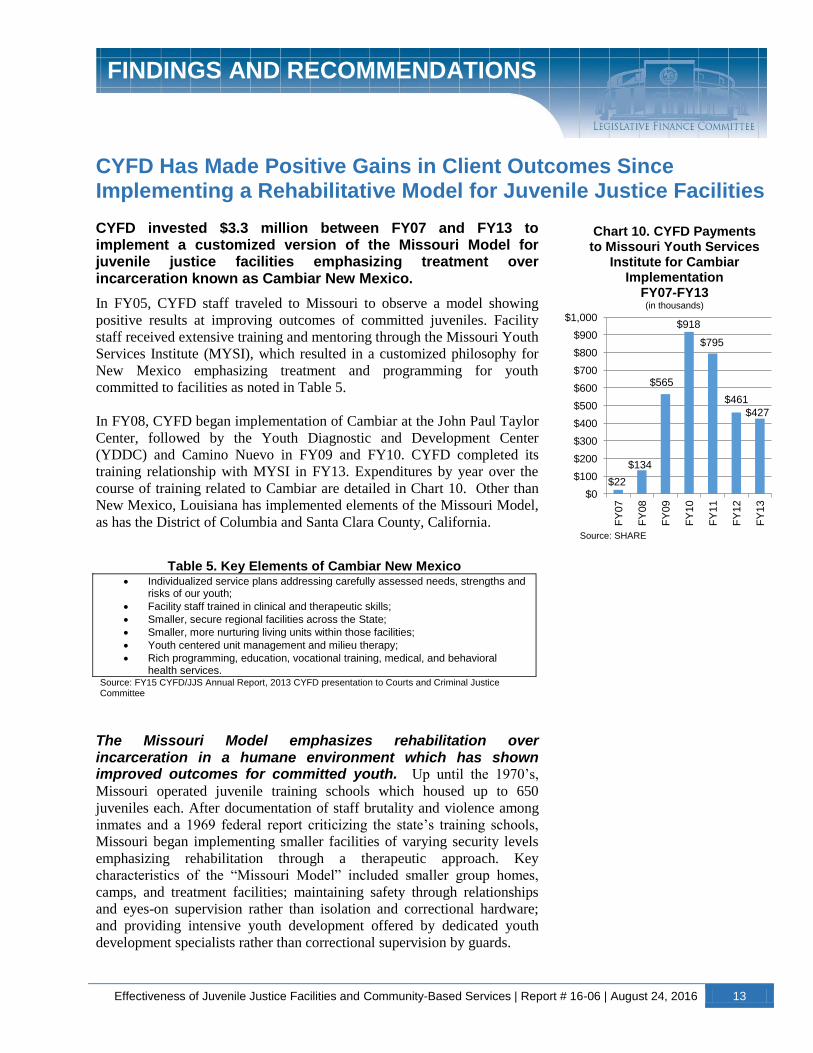
CYFD invested $3.3 million between FY07 and FY13 to implement a customized version of the Missouri Model for juvenile justice facilities emphasizing treatment over incarceration known as Cambiar New Mexico.
In FY05, CYFD staff traveled to Missouri to observe a model showing
positive results at improving outcomes of committed juveniles. Facility
staff received extensive training and mentoring through the Missouri Youth
Services Institute (MYSI), which resulted in a customized philosophy for
New Mexico emphasizing treatment and programming for youth
committed to facilities as noted in Table 5.
In FY08, CYFD began implementation of Cambiar at the John Paul Taylor
Center, followed by the Youth Diagnostic and Development Center
(YDDC) and Camino Nuevo in FY09 and FY10. CYFD completed its
training relationship with MYSI in FY13. Expenditures by year over the
course of training related to Cambiar are detailed in Chart 10. Other than
New Mexico, Louisiana has implemented elements of the Missouri Model,
as has the District of Columbia and Santa Clara County, California.
The Missouri Model emphasizes rehabilitation over incarceration in a humane environment which has shown improved outcomes for committed youth. Up until the 1970’s,
Missouri operated juvenile training schools which housed up to 650
juveniles each. After documentation of staff brutality and violence among
inmates and a 1969 federal report criticizing the state’s training schools,
Missouri began implementing smaller facilities of varying security levels
emphasizing rehabilitation through a therapeutic approach. Key
characteristics of the “Missouri Model” included smaller group homes,
camps, and treatment facilities; maintaining safety through relationships
and eyes-on supervision rather than isolation and correctional hardware;
and providing intensive youth development offered by dedicated youth
development specialists rather than correctional supervision by guards.
FINDINGS AND RECOMMENDATIONS
$22
$134
$565
$918
$795
$461
$427
$0
$100
$200
$300
$400
$500
$600
$700
$800
$900
$1,000
FY
07
FY
08
FY
09
FY
10
FY
11
FY
12
FY
13
Chart 10. CYFD Payments to Missouri Youth Services
Institute for Cambiar Implementation
FY07-FY13 (in thousands)
Source: SHARE
Table 5. Key Elements of Cambiar New Mexico Individualized service plans addressing carefully assessed needs, strengths and
risks of our youth;
Facility staff trained in clinical and therapeutic skills;
Smaller, secure regional facilities across the State;
Smaller, more nurturing living units within those facilities;
Youth centered unit management and milieu therapy;
Rich programming, education, vocational training, medical, and behavioral health services.
Source: FY15 CYFD/JJS Annual Report, 2013 CYFD presentation to Courts and Criminal Justice Committee
14 Effectiveness of Juvenile Justice Facilities and Community-Based Services | Report # 16-06 | August 24, 2016
Missouri’s Department of Youth Services (DYS) fine tuned a series of
organizational beliefs that serve as the model’s foundation. These beliefs
focus on individualized service plans which are designed from thorough
assessment of underlying causes of behavior. A full list of DYS’s
organizational beliefs is located in Appendix D.
It is important to note that there are differences in the youth population
between New Mexico and Missouri, largely due to differences in juvenile
sentencing laws. In FY15, 69 percent of youth admitted to CYFD facilities
were aged 16 or 17, compared with 49 percent in Missouri. Twelve percent
of New Mexico’s admissions were aged 14 or 15, compared to 42 percent
in Missouri (Chart 11). Missouri also does not commit any youth over 18
to a DYS facility, while in New Mexico a youth aged 18 or over may be
admitted if the offense was committed prior to the youth turning 18.
CYFD implemented various components of the Missouri Model as part of Cambiar including therapeutic and educational programming.
CYFD enacted various standards related to create a group treatment
approach also focusing on education. Juveniles are assigned to a group
ranging in size from eight to 12 people, who are together at all times,
including during the school day. Some of the processes implemented for
these groups are described in Appendix E.
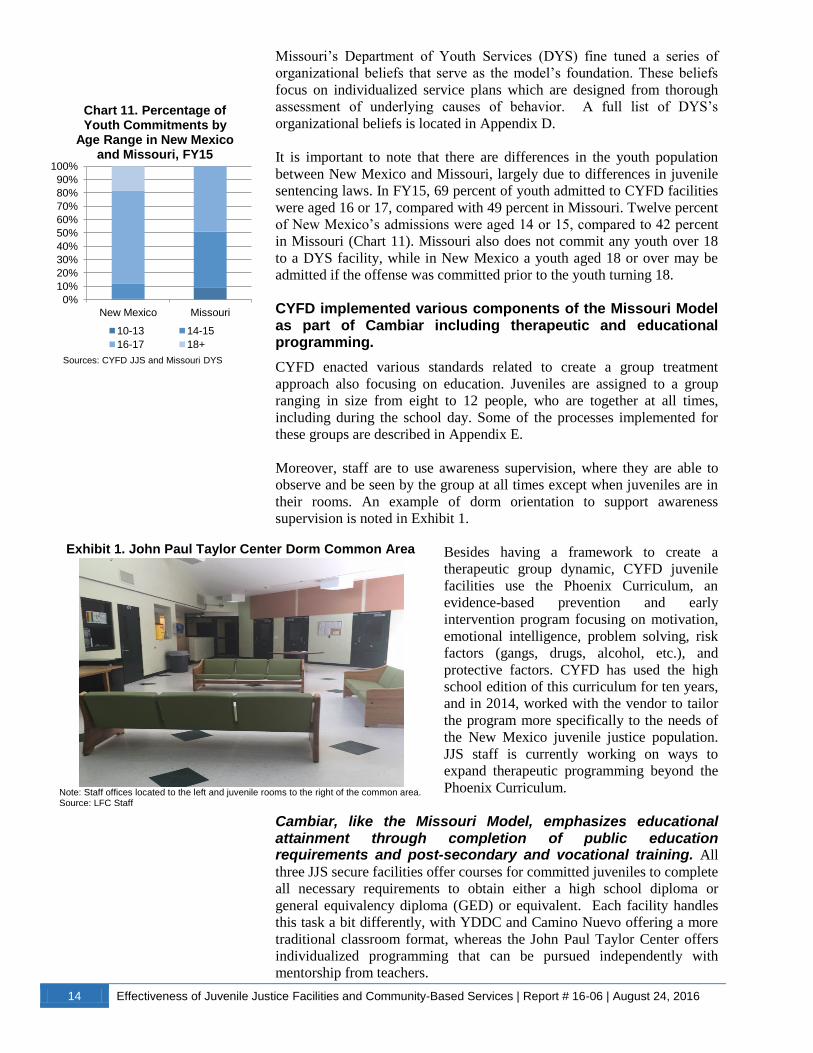
Moreover, staff are to use awareness supervision, where they are able to
observe and be seen by the group at all times except when juveniles are in
their rooms. An example of dorm orientation to support awareness
supervision is noted in Exhibit 1.
Besides having a framework to create a
therapeutic group dynamic, CYFD juvenile
facilities use the Phoenix Curriculum, an
evidence-based prevention and early
intervention program focusing on motivation,
emotional intelligence, problem solving, risk
factors (gangs, drugs, alcohol, etc.), and
protective factors. CYFD has used the high
school edition of this curriculum for ten years,
and in 2014, worked with the vendor to tailor
the program more specifically to the needs of
the New Mexico juvenile justice population.
JJS staff is currently working on ways to
expand therapeutic programming beyond the
Phoenix Curriculum.
Cambiar, like the Missouri Model, emphasizes educational attainment through completion of public education requirements and post-secondary and vocational training. All
three JJS secure facilities offer courses for committed juveniles to complete
all necessary requirements to obtain either a high school diploma or
general equivalency diploma (GED) or equivalent. Each facility handles
this task a bit differently, with YDDC and Camino Nuevo offering a more
traditional classroom format, whereas the John Paul Taylor Center offers
individualized programming that can be pursued independently with
mentorship from teachers.
Exhibit 1. John Paul Taylor Center Dorm Common Area
Note: Staff offices located to the left and juvenile rooms to the right of the common area. Source: LFC Staff
0%
10%
20%
30%
40%
50%
60%
70%
80%
90%
100%
New Mexico Missouri
Chart 11. Percentage of Youth Commitments by
Age Range in New Mexico and Missouri, FY15
10-13 14-15
16-17 18+
Sources: CYFD JJS and Missouri DYS
Effectiveness of Juvenile Justice Facilities and Community-Based Services | Report # 16-06 | August 24, 2016 15
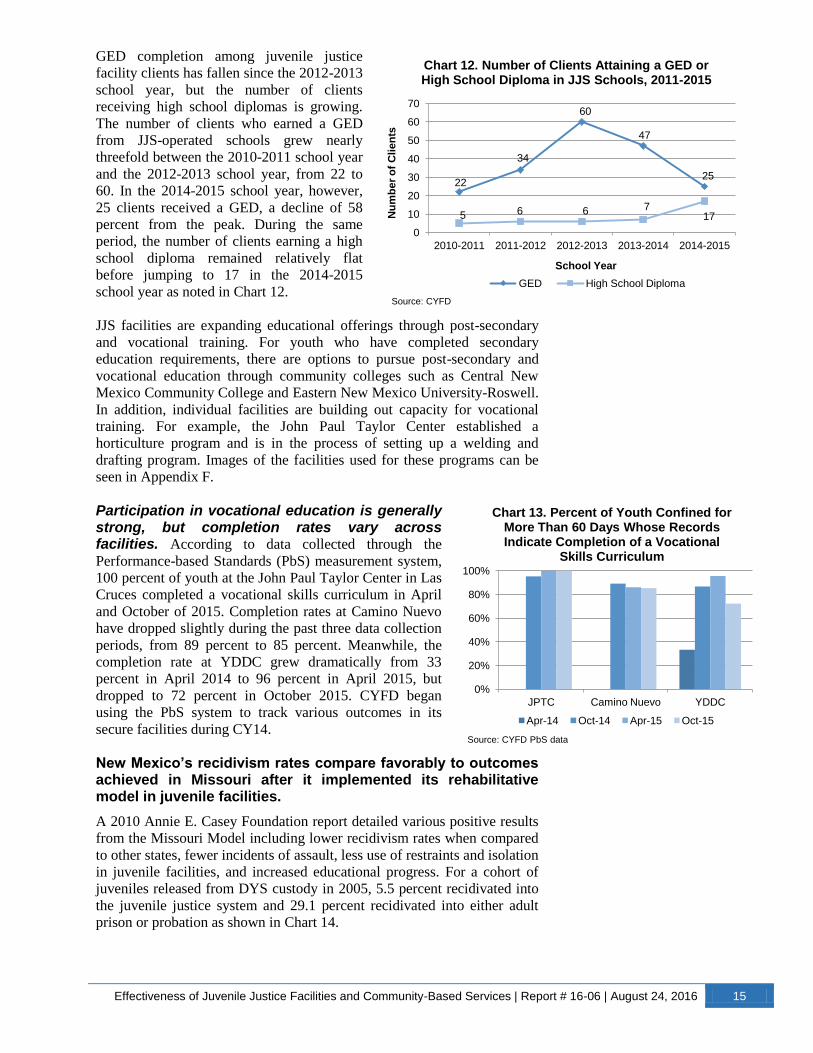
GED completion among juvenile justice
facility clients has fallen since the 2012-2013
school year, but the number of clients
receiving high school diplomas is growing.
The number of clients who earned a GED
from JJS-operated schools grew nearly
threefold between the 2010-2011 school year
and the 2012-2013 school year, from 22 to
60. In the 2014-2015 school year, however,
25 clients received a GED, a decline of 58
percent from the peak. During the same
period, the number of clients earning a high
school diploma remained relatively flat
before jumping to 17 in the 2014-2015
school year as noted in Chart 12.
JJS facilities are expanding educational offerings through post-secondary
and vocational training. For youth who have completed secondary
education requirements, there are options to pursue post-secondary and
vocational education through community colleges such as Central New
Mexico Community College and Eastern New Mexico University-Roswell.
In addition, individual facilities are building out capacity for vocational
training. For example, the John Paul Taylor Center established a
horticulture program and is in the process of setting up a welding and
drafting program. Images of the facilities used for these programs can be
seen in Appendix F.
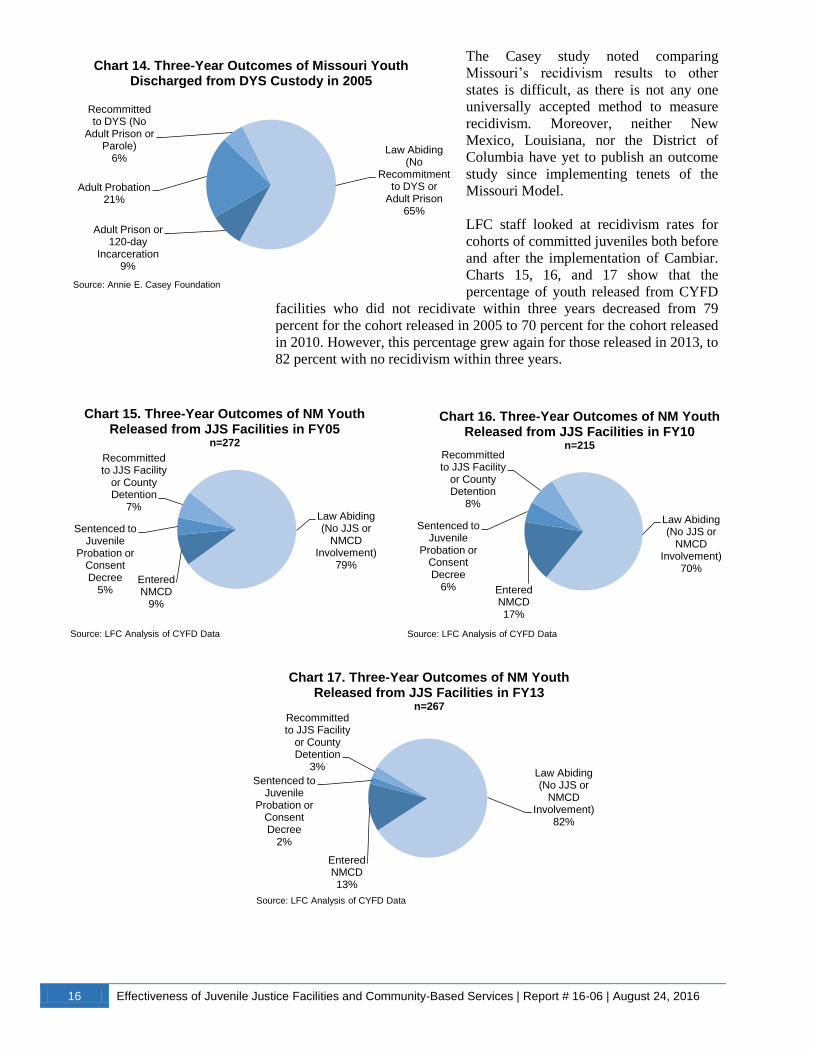
Participation in vocational education is generally strong, but completion rates vary across facilities. According to data collected through the
Performance-based Standards (PbS) measurement system,
100 percent of youth at the John Paul Taylor Center in Las
Cruces completed a vocational skills curriculum in April
and October of 2015. Completion rates at Camino Nuevo
have dropped slightly during the past three data collection
periods, from 89 percent to 85 percent. Meanwhile, the
completion rate at YDDC grew dramatically from 33
percent in April 2014 to 96 percent in April 2015, but
dropped to 72 percent in October 2015. CYFD began
using the PbS system to track various outcomes in its
secure facilities during CY14.
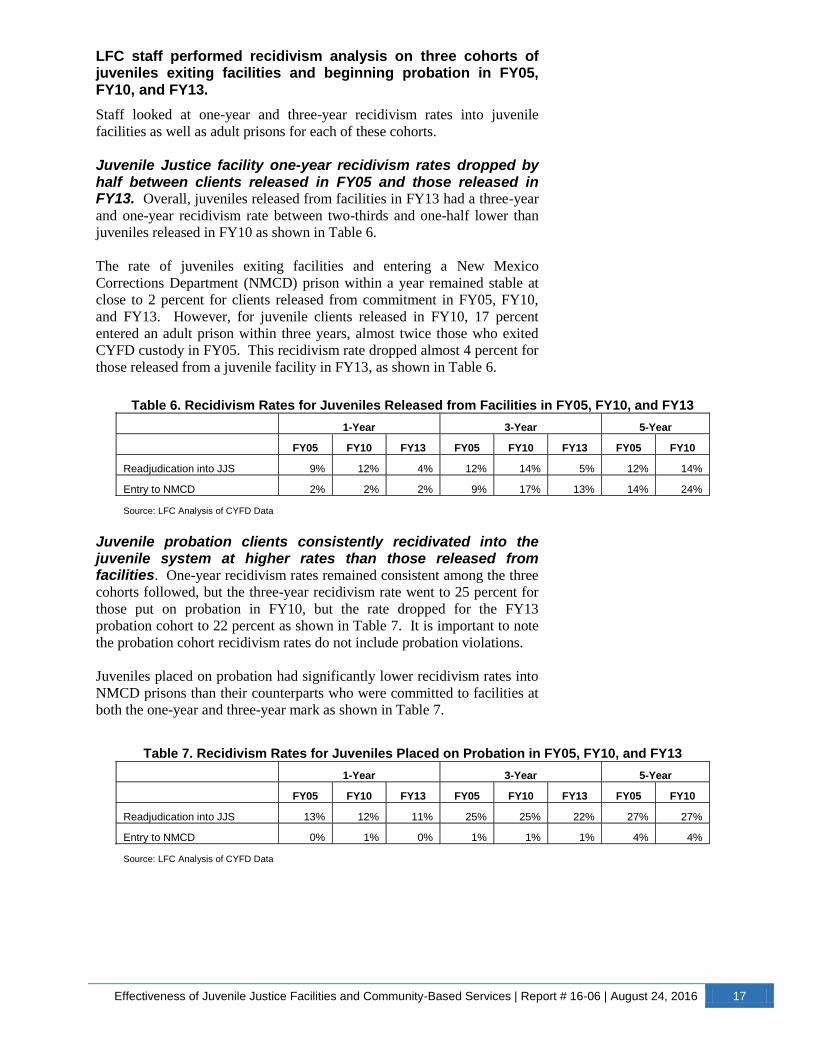
New Mexico’s recidivism rates compare favorably to outcomes achieved in Missouri after it implemented its rehabilitative model in juvenile facilities.
A 2010 Annie E. Casey Foundation report detailed various positive results
from the Missouri Model including lower recidivism rates when compared
to other states, fewer incidents of assault, less use of restraints and isolation
in juvenile facilities, and increased educational progress. For a cohort of
juveniles released from DYS custody in 2005, 5.5 percent recidivated into
the juvenile justice system and 29.1 percent recidivated into either adult
prison or probation as shown in Chart 14.
22
34
60
47
25
5 6 6 7 17
0
10
20
30
40
50
60
70
2010-2011 2011-2012 2012-2013 2013-2014 2014-2015
Nu
mb
er
of
Cli
en
ts
School Year
Chart 12. Number of Clients Attaining a GED or High School Diploma in JJS Schools, 2011-2015
GED High School Diploma
Source: CYFD
0%
20%
40%
60%
80%
100%
JPTC Camino Nuevo YDDC
Chart 13. Percent of Youth Confined for More Than 60 Days Whose Records Indicate Completion of a Vocational
Skills Curriculum
Apr-14 Oct-14 Apr-15 Oct-15
Source: CYFD PbS data
16 Effectiveness of Juvenile Justice Facilities and Community-Based Services | Report # 16-06 | August 24, 2016
The Casey study noted comparing
Missouri’s recidivism results to other
states is difficult, as there is not any one
universally accepted method to measure
recidivism. Moreover, neither New
Mexico, Louisiana, nor the District of
Columbia have yet to publish an outcome
study since implementing tenets of the
Missouri Model.
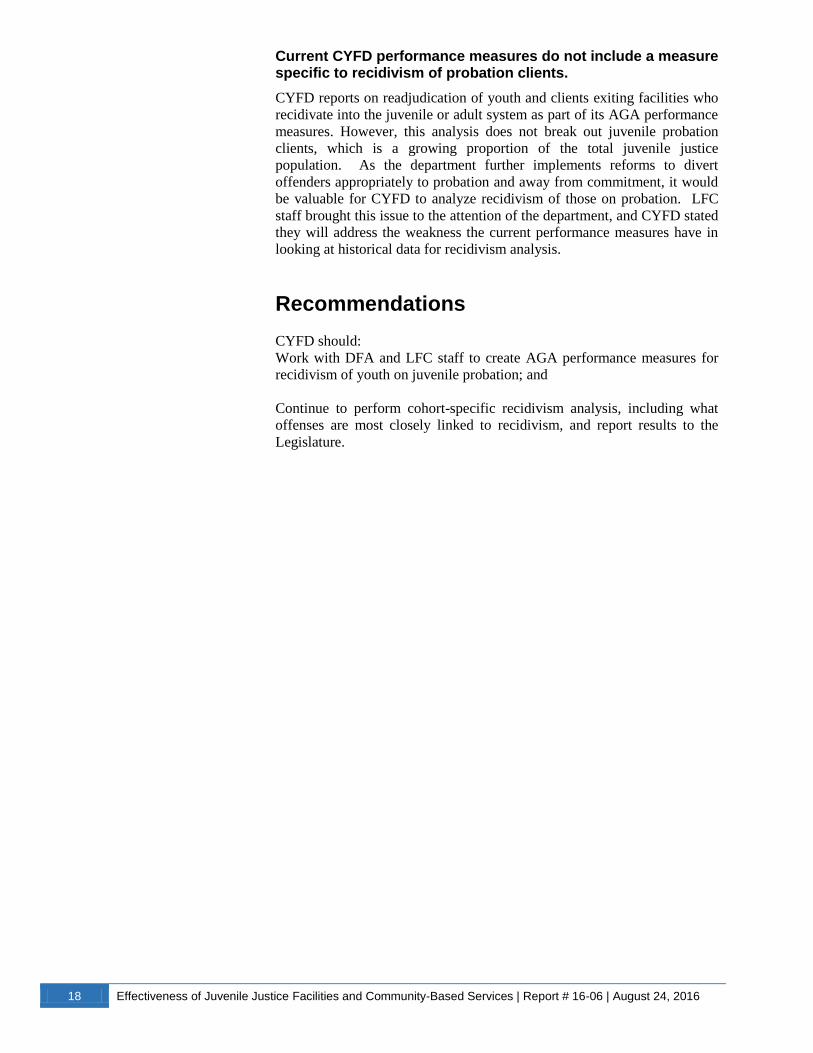
LFC staff looked at recidivism rates for
cohorts of committed juveniles both before
and after the implementation of Cambiar.
Charts 15, 16, and 17 show that the
percentage of youth released from CYFD
facilities who did not recidivate within three years decreased from 79
percent for the cohort released in 2005 to 70 percent for the cohort released
in 2010. However, this percentage grew again for those released in 2013, to
82 percent with no recidivism within three years.
Adult Prison or 120-day
Incarceration 9%
Adult Probation 21%
Recommitted to DYS (No
Adult Prison or Parole)
6% Law Abiding
(No Recommitment
to DYS or Adult Prison
65%
Chart 14. Three-Year Outcomes of Missouri Youth Discharged from DYS Custody in 2005
Source: Annie E. Casey Foundation
Entered NMCD
9%
Sentenced to Juvenile
Probation or Consent Decree
5%
Recommitted to JJS Facility
or County Detention
7% Law Abiding (No JJS or
NMCD Involvement)
79%
Chart 15. Three-Year Outcomes of NM Youth Released from JJS Facilities in FY05
n=272
Source: LFC Analysis of CYFD Data
Entered NMCD 17%
Sentenced to Juvenile
Probation or Consent Decree
6%
Recommitted to JJS Facility
or County Detention
8%
Law Abiding (No JJS or
NMCD Involvement)
70%
Chart 16. Three-Year Outcomes of NM Youth Released from JJS Facilities in FY10
n=215
Source: LFC Analysis of CYFD Data
Entered NMCD 13%
Sentenced to Juvenile
Probation or Consent Decree
2%
Recommitted to JJS Facility
or County Detention
3% Law Abiding (No JJS or
NMCD Involvement)
82%
Chart 17. Three-Year Outcomes of NM Youth Released from JJS Facilities in FY13
n=267
Source: LFC Analysis of CYFD Data
Effectiveness of Juvenile Justice Facilities and Community-Based Services | Report # 16-06 | August 24, 2016 17
LFC staff performed recidivism analysis on three cohorts of juveniles exiting facilities and beginning probation in FY05, FY10, and FY13.
Staff looked at one-year and three-year recidivism rates into juvenile
facilities as well as adult prisons for each of these cohorts.
Juvenile Justice facility one-year recidivism rates dropped by half between clients released in FY05 and those released in FY13. Overall, juveniles released from facilities in FY13 had a three-year
and one-year recidivism rate between two-thirds and one-half lower than
juveniles released in FY10 as shown in Table 6.
The rate of juveniles exiting facilities and entering a New Mexico
Corrections Department (NMCD) prison within a year remained stable at
close to 2 percent for clients released from commitment in FY05, FY10,
and FY13. However, for juvenile clients released in FY10, 17 percent
entered an adult prison within three years, almost twice those who exited
CYFD custody in FY05. This recidivism rate dropped almost 4 percent for
those released from a juvenile facility in FY13, as shown in Table 6.
Juvenile probation clients consistently recidivated into the juvenile system at higher rates than those released from facilities. One-year recidivism rates remained consistent among the three
cohorts followed, but the three-year recidivism rate went to 25 percent for
those put on probation in FY10, but the rate dropped for the FY13
probation cohort to 22 percent as shown in Table 7. It is important to note
the probation cohort recidivism rates do not include probation violations.
Juveniles placed on probation had significantly lower recidivism rates into
NMCD prisons than their counterparts who were committed to facilities at
both the one-year and three-year mark as shown in Table 7.
Table 7. Recidivism Rates for Juveniles Placed on Probation in FY05, FY10, and FY13
1-Year 3-Year 5-Year
FY05 FY10 FY13 FY05 FY10 FY13 FY05 FY10
Readjudication into JJS 13% 12% 11% 25% 25% 22% 27% 27%
Entry to NMCD 0% 1% 0% 1% 1% 1% 4% 4%
Source: LFC Analysis of CYFD Data
Table 6. Recidivism Rates for Juveniles Released from Facilities in FY05, FY10, and FY13
1-Year 3-Year 5-Year
FY05 FY10 FY13 FY05 FY10 FY13 FY05 FY10
Readjudication into JJS 9% 12% 4% 12% 14% 5% 12% 14%
Entry to NMCD 2% 2% 2% 9% 17% 13% 14% 24%
Source: LFC Analysis of CYFD Data
18 Effectiveness of Juvenile Justice Facilities and Community-Based Services | Report # 16-06 | August 24, 2016
Current CYFD performance measures do not include a measure specific to recidivism of probation clients.
CYFD reports on readjudication of youth and clients exiting facilities who
recidivate into the juvenile or adult system as part of its AGA performance
measures. However, this analysis does not break out juvenile probation
clients, which is a growing proportion of the total juvenile justice
population. As the department further implements reforms to divert
offenders appropriately to probation and away from commitment, it would
be valuable for CYFD to analyze recidivism of those on probation. LFC
staff brought this issue to the attention of the department, and CYFD stated
they will address the weakness the current performance measures have in
looking at historical data for recidivism analysis.
Recommendations
CYFD should:
Work with DFA and LFC staff to create AGA performance measures for
recidivism of youth on juvenile probation; and
Continue to perform cohort-specific recidivism analysis, including what
offenses are most closely linked to recidivism, and report results to the
Legislature.

Effectiveness of Juvenile Justice Facilities and Community-Based Services | Report # 16-06 | August 24, 2016 19
CYFD Should Better Align Resources to the Changing Demands on Juvenile Justice Facilities
Implementation of New Mexico’s Cambiar model has not proven successful in generating cost savings for facilities.
Cambiar was phased into facilities starting with the John Paul Taylor
Center in FY08 and concluding with Camino Nuevo in FY11. Chart 18.
below shows costs have continued to increase after Cambiar
implementation, with the exception of FY12.
CYFD spent $35.7 million on
secure facilities in FY15,
including the costs of direct care
staffing, educational, medical,
and behavioral health services,
and back-office services at
CYFD’s own facilities, as well
as contractual payments to San
Juan County to house up to 10
youth at the San Juan County
Detention Center. This total is
up 30 percent from the $27.4
million spent in FY08, at the
beginning of Cambiar
implementation.
Despite fewer committed youth, the state still operates high-capacity facilities not in alignment with the Cambiar philosophy as originally envisioned.
The average daily population of youth held in CYFD’s secure facilities
decreased from 529 to 193 between FY02 and FY15, as shown in Chart 19.
Most of the decrease occurred between FY03 and FY04, when the average
daily population fell by 36 percent due to changes in the Children’s Code
resulting in increased use of risk assessment instruments designed to
reduce commitment of youth with lower risk and needs levels. Moreover,
term commitments into secure facilities decreased 67 percent, from 530 to
173, between FY01 and FY15 as noted in Chart 20. Overall, commitments
to secure facilities made up about 1 percent of all juvenile justice
dispositions in FY15, compared to nearly 5 percent in FY11.
120
140
160
180
200
220
240
260
280
$20,000
$22,000
$24,000
$26,000
$28,000
$30,000
$32,000
$34,000
$36,000
FY08 FY09 FY10 FY11 FY12 FY13 FY14 FY15
Avera
ge
Dail
y P
op
ula
tio
n
Sp
en
din
g
($ in
Th
ou
san
ds
)
Chart 18. Secure Facilities Spending and Average Daily Population Since Implementation of Cambiar Model
Average Daily Population Total Secure Facility Spending
Sources: SHARE, CYFD
0
100
200
300
400
500
600
FY
01
FY
02
FY
03
FY
04
FY
05
FY
06
FY
07
FY
08
FY
09
FY
10
FY
11
FY
12
FY
13
FY
14
FY
15
Chart 20. Term Admissions into Secure Juvenile Justice Facilities
FY01-FY15
Source: CYFD
0
100
200
300
400
500
600
FY
02
FY
03
FY
04
FY
05
FY
06
FY
07
FY
08
FY
09
FY
10
FY
11
FY
12
FY
13
FY
14
FY
15
Chart 19. Average Daily Population in Secure CYFD Facilities FY02-FY15
Source: CYFD
20 Effectiveness of Juvenile Justice Facilities and Community-Based Services | Report # 16-06 | August 24, 2016
Cambiar requires smaller, less institutional facilities as one of its key elements, but any new facilities would be cost prohibitive at this time. While declining committed populations
warrant smaller juvenile facilities, the department has consolidated the
majority of secure facility functions in Albuquerque and Las Cruces due to
cost considerations. The only exception is 10 beds contracted at the San
Juan County Juvenile Detention Center. At the same time as Cambiar was
being rolled out, CYFD closed the New Mexico Boys School in Springer.
The agency did open the Lincoln Pines facility in Fort Stanton in FY14.
However, it never operated at capacity, and was closed in FY15 due to
fiscal conditions. Moreover, two of three operational reintegration centers
are based in Albuquerque. A primary tenet of the Missouri Model, on
which Cambiar is based, recommends smaller regionalized facilities with a
maximum capacity of 50 beds, to maximize family involvement during the
commitment and rehabilitation process. Of the three CYFD secure
facilities, only the smallest facility, J. Paul Taylor, meets this size
recommendation with 48 beds. Lincoln Pines, when it was operational, had
a capacity of 24 beds.
While bed capacity at the Youth Diagnostic and Development Center
(YDDC) was reduced from 152 beds in 2004 to the current capacity of 108
beds, the facility’s housing units remain at odds with a 2010 facilities
master plan and feasibility study suggesting 12 beds per unit under the
Cambiar model. Currently, there are 20 beds per unit at YDDC and 28 beds
in the intake unit. Moreover, YDDC’s average daily population was 73
clients in FY15, or about two-thirds of total capacity.
Additionally, the same feasibility study and master plan classified the
Camino Nuevo facility (CNYC) as being in “poor alignment” with
Cambiar. Moreover, CYFD stated to a meeting of the New Mexico
Sentencing Commission in December 2013 CNYC is “not a good fit for the
Cambiar philosophy.” While YDDC’s housing units are arranged into
cottages that are physically separate from each other and from other
structures, such as educational and cafeteria facilities, CNYC is more
closely modeled after secure adult correctional facilities. It is a single,
consolidated structure that contains a network of
secure corridors between housing units and
central education and medical units. In FY15,
Camino Nuevo operated at 72 percent of
capacity based on average daily population.
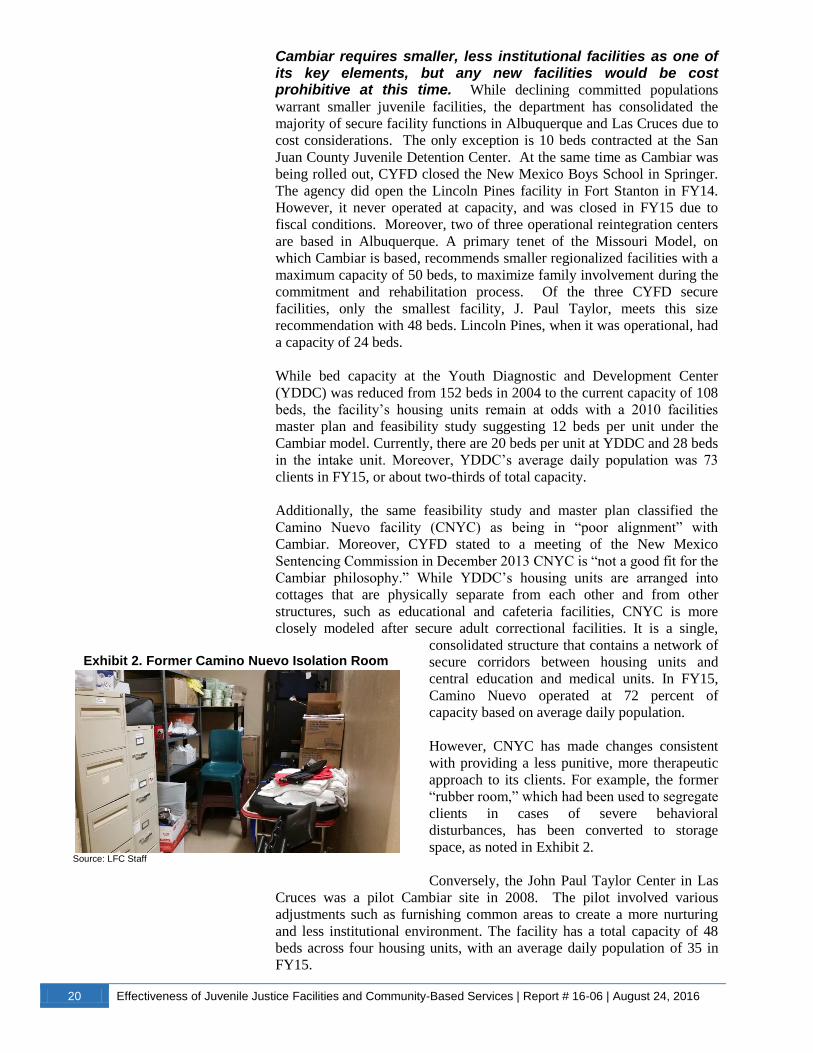
However, CNYC has made changes consistent
with providing a less punitive, more therapeutic
approach to its clients. For example, the former
“rubber room,” which had been used to segregate
clients in cases of severe behavioral
disturbances, has been converted to storage
space, as noted in Exhibit 2.
Conversely, the John Paul Taylor Center in Las
Cruces was a pilot Cambiar site in 2008. The pilot involved various
adjustments such as furnishing common areas to create a more nurturing
and less institutional environment. The facility has a total capacity of 48
beds across four housing units, with an average daily population of 35 in
FY15.
Exhibit 2. Former Camino Nuevo Isolation Room
Source: LFC Staff
Effectiveness of Juvenile Justice Facilities and Community-Based Services | Report # 16-06 | August 24, 2016 21
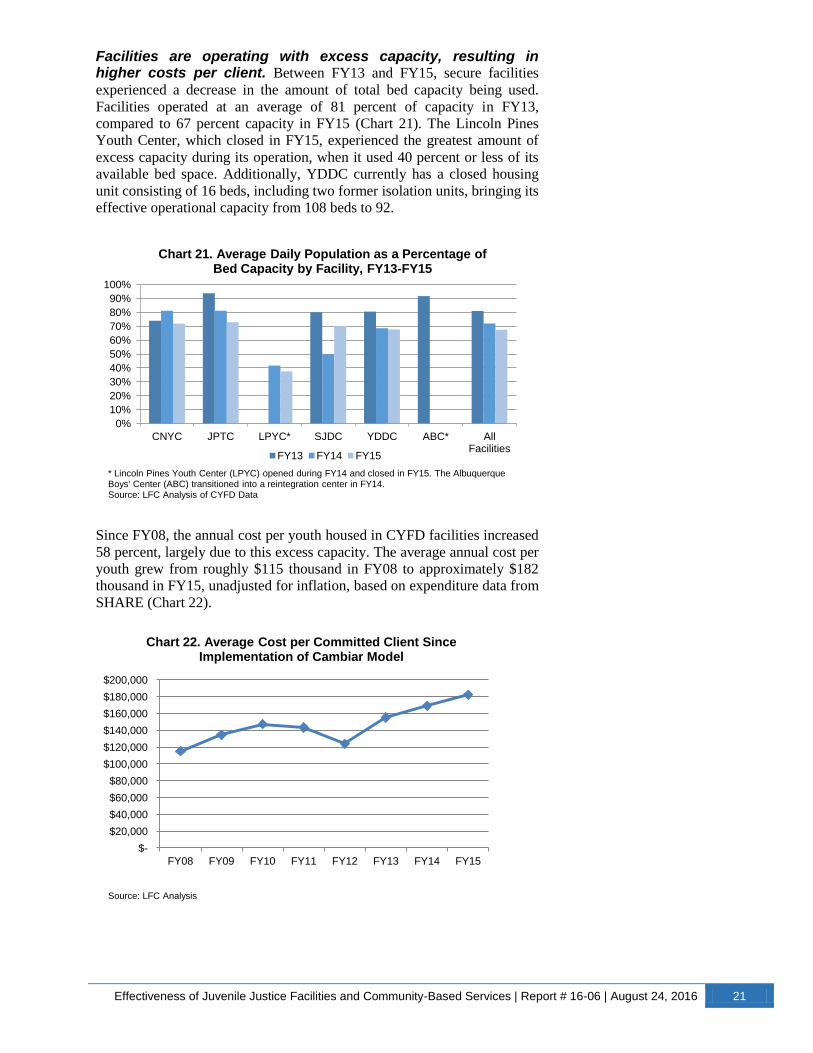
Facilities are operating with excess capacity, resulting in higher costs per client. Between FY13 and FY15, secure facilities
experienced a decrease in the amount of total bed capacity being used.
Facilities operated at an average of 81 percent of capacity in FY13,
compared to 67 percent capacity in FY15 (Chart 21). The Lincoln Pines
Youth Center, which closed in FY15, experienced the greatest amount of
excess capacity during its operation, when it used 40 percent or less of its
available bed space. Additionally, YDDC currently has a closed housing
unit consisting of 16 beds, including two former isolation units, bringing its
effective operational capacity from 108 beds to 92.
Since FY08, the annual cost per youth housed in CYFD facilities increased
58 percent, largely due to this excess capacity. The average annual cost per
youth grew from roughly $115 thousand in FY08 to approximately $182
thousand in FY15, unadjusted for inflation, based on expenditure data from
SHARE (Chart 22).
0%
10%
20%
30%
40%
50%
60%
70%
80%
90%
100%
CNYC JPTC LPYC* SJDC YDDC ABC* All Facilities
Chart 21. Average Daily Population as a Percentage of Bed Capacity by Facility, FY13-FY15
FY13 FY14 FY15
* Lincoln Pines Youth Center (LPYC) opened during FY14 and closed in FY15. The Albuquerque Boys' Center (ABC) transitioned into a reintegration center in FY14. Source: LFC Analysis of CYFD Data
$-
$20,000
$40,000
$60,000
$80,000
$100,000
$120,000
$140,000
$160,000
$180,000
$200,000
FY08 FY09 FY10 FY11 FY12 FY13 FY14 FY15
Chart 22. Average Cost per Committed Client Since Implementation of Cambiar Model
Source: LFC Analysis
22 Effectiveness of Juvenile Justice Facilities and Community-Based Services | Report # 16-06 | August 24, 2016
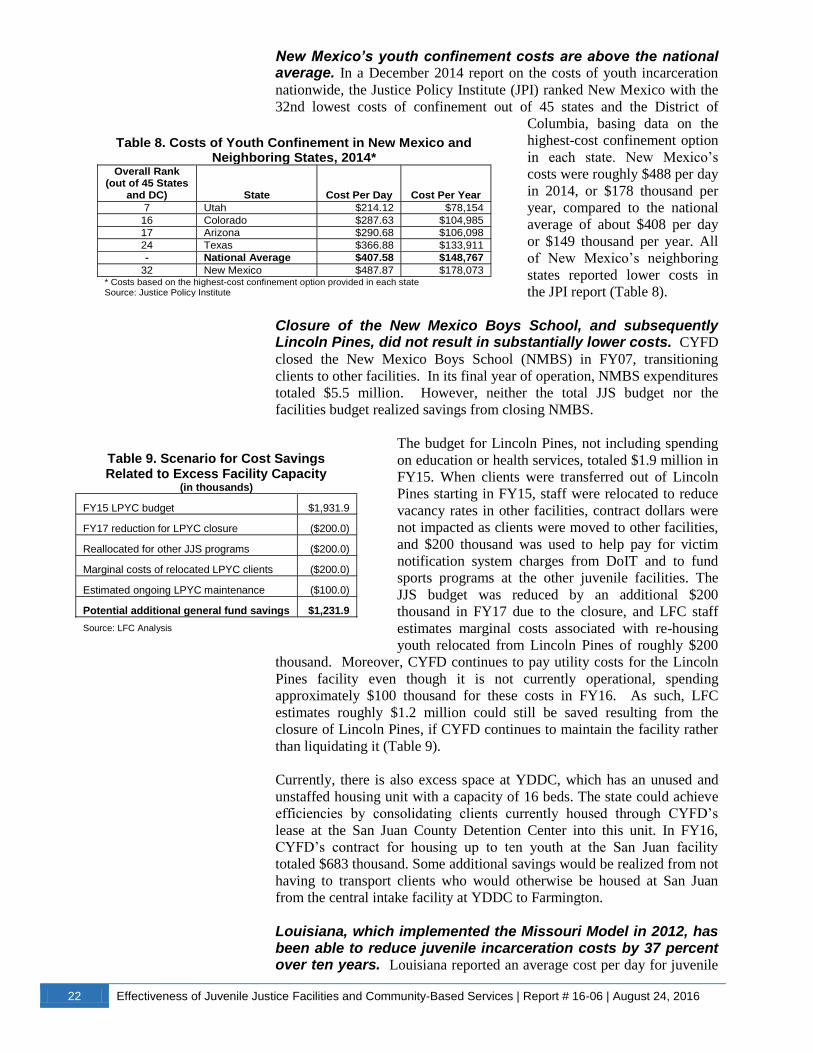
New Mexico’s youth confinement costs are above the national average. In a December 2014 report on the costs of youth incarceration
nationwide, the Justice Policy Institute (JPI) ranked New Mexico with the
32nd lowest costs of confinement out of 45 states and the District of
Columbia, basing data on the
highest-cost confinement option
in each state. New Mexico’s
costs were roughly $488 per day
in 2014, or $178 thousand per
year, compared to the national
average of about $408 per day
or $149 thousand per year. All
of New Mexico’s neighboring
states reported lower costs in
the JPI report (Table 8).
Closure of the New Mexico Boys School, and subsequently Lincoln Pines, did not result in substantially lower costs. CYFD
closed the New Mexico Boys School (NMBS) in FY07, transitioning
clients to other facilities. In its final year of operation, NMBS expenditures
totaled $5.5 million. However, neither the total JJS budget nor the
facilities budget realized savings from closing NMBS.
The budget for Lincoln Pines, not including spending
on education or health services, totaled $1.9 million in
FY15. When clients were transferred out of Lincoln
Pines starting in FY15, staff were relocated to reduce
vacancy rates in other facilities, contract dollars were
not impacted as clients were moved to other facilities,
and $200 thousand was used to help pay for victim
notification system charges from DoIT and to fund
sports programs at the other juvenile facilities. The
JJS budget was reduced by an additional $200
thousand in FY17 due to the closure, and LFC staff
estimates marginal costs associated with re-housing
youth relocated from Lincoln Pines of roughly $200
thousand. Moreover, CYFD continues to pay utility costs for the Lincoln
Pines facility even though it is not currently operational, spending
approximately $100 thousand for these costs in FY16. As such, LFC
estimates roughly $1.2 million could still be saved resulting from the
closure of Lincoln Pines, if CYFD continues to maintain the facility rather
than liquidating it (Table 9).
Currently, there is also excess space at YDDC, which has an unused and
unstaffed housing unit with a capacity of 16 beds. The state could achieve
efficiencies by consolidating clients currently housed through CYFD’s
lease at the San Juan County Detention Center into this unit. In FY16,
CYFD’s contract for housing up to ten youth at the San Juan facility
totaled $683 thousand. Some additional savings would be realized from not
having to transport clients who would otherwise be housed at San Juan
from the central intake facility at YDDC to Farmington.
Louisiana, which implemented the Missouri Model in 2012, has been able to reduce juvenile incarceration costs by 37 percent over ten years. Louisiana reported an average cost per day for juvenile
Table 8. Costs of Youth Confinement in New Mexico and
Neighboring States, 2014* Overall Rank
(out of 45 States and DC) State Cost Per Day Cost Per Year
7 Utah $214.12 $78,154
16 Colorado $287.63 $104,985
17 Arizona $290.68 $106,098
24 Texas $366.88 $133,911
- National Average $407.58 $148,767
32 New Mexico $487.87 $178,073 * Costs based on the highest-cost confinement option provided in each state Source: Justice Policy Institute
Table 9. Scenario for Cost Savings Related to Excess Facility Capacity
(in thousands)
FY15 LPYC budget $1,931.9
FY17 reduction for LPYC closure ($200.0)
Reallocated for other JJS programs ($200.0)
Marginal costs of relocated LPYC clients ($200.0)
Estimated ongoing LPYC maintenance ($100.0)
Potential additional general fund savings $1,231.9
Source: LFC Analysis
Effectiveness of Juvenile Justice Facilities and Community-Based Services | Report # 16-06 | August 24, 2016 23
incarceration of $127.84 in 2014. A report to the Louisiana Joint
Legislative Juvenile Justice Commission noted the state spent $157 per day
to incarcerate youth in 2003, which would be equal to $202 in 2014
dollars. The report made various recommendations to reduce juvenile
incarceration costs in Louisiana including eliminating administrative
delays for short-term offenders, reducing incarceration for misdemeanor
offenses and shortening the length of stay for drug offenses and other
minor felonies.
Moreover, the report recommended closing one of the state’s four juvenile
facilities, which would generate savings by eliminating fixed costs such as
property maintenance and utilities. These funds could then be reinvested in
alternatives to incarceration. Savings were estimated to be between $10
million and $18 million if a facility was closed and replaced with
alternatives to incarceration for 350 juveniles. This recommendation aligns
with a 2010 Annie E. Casey study of the Missouri Model which
emphasized the need to invest proportionately to create full-scale out-of-
incarceration interventions. Louisiana now operates three male juvenile
facilities and contracts for female facility services.
Youth care specialists have a vital and expansive role in facilities, but analysis of available data suggests potential overstaffing.
The youth care specialist (YCS) is the staff member with primary
responsibility for monitoring and caring for clients committed to secure
CYFD facilities. While a YCS performs a critical security function in
CYFD facilities, his or her role extends beyond that to include
mentoring and case management functions alongside facility
behavioral health and education staff and juvenile probation
officers to ensure clients are adhering to and making progress
with their plan of care. Under CYFD policy, each housing unit
in a facility is assigned a YCS unit supervisor as well as one or
more line staff, depending on the number of youth housed in
the unit. A YCS manager may oversee multiple housing units.
There are two levels of line staff, classified by the State
Personnel Office as a Juvenile Correctional Officer I or II.
Under federal Prison Rape Elimination Act (PREA)
regulations, facilities must maintain a minimum staff-to-client
ratio of 1:8 during waking hours and 1:16 during sleeping hours
(28 CFR 115.313). These regulations specify that the ratio
pertains to security staff, defined as “employees primarily
responsible for the supervision and control of inmates,
detainees, or residents in housing units, recreational areas,
dining areas, and other program areas of the facility.” This
primarily includes Youth Care Specialists, but could also be
construed to include behavioral health therapists, educators, and
medical staff during times when they are interacting with
clients.
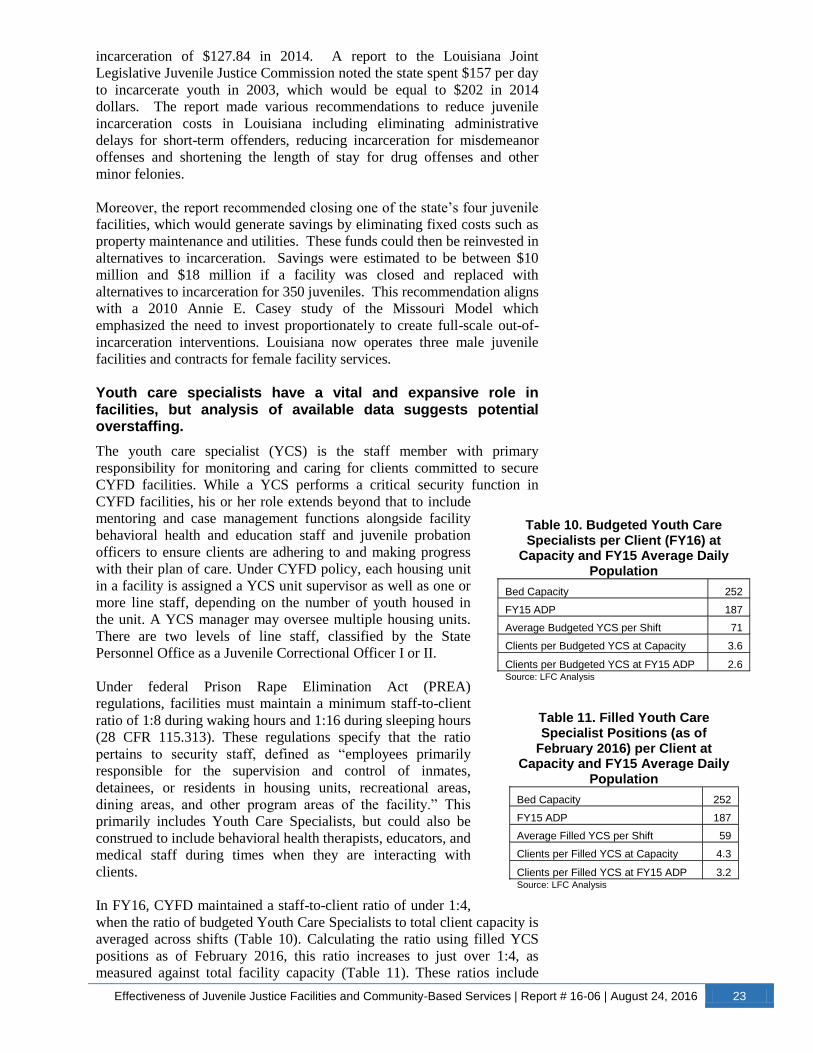
In FY16, CYFD maintained a staff-to-client ratio of under 1:4,
when the ratio of budgeted Youth Care Specialists to total client capacity is
averaged across shifts (Table 10). Calculating the ratio using filled YCS
positions as of February 2016, this ratio increases to just over 1:4, as
measured against total facility capacity (Table 11). These ratios include
Table 10. Budgeted Youth Care Specialists per Client (FY16) at
Capacity and FY15 Average Daily Population
Bed Capacity 252
FY15 ADP 187
Average Budgeted YCS per Shift 71
Clients per Budgeted YCS at Capacity 3.6
Clients per Budgeted YCS at FY15 ADP 2.6 Source: LFC Analysis
Table 11. Filled Youth Care Specialist Positions (as of
February 2016) per Client at Capacity and FY15 Average Daily
Population
Bed Capacity 252
FY15 ADP 187
Average Filled YCS per Shift 59
Clients per Filled YCS at Capacity 4.3
Clients per Filled YCS at FY15 ADP 3.2 Source: LFC Analysis

24 Effectiveness of Juvenile Justice Facilities and Community-Based Services | Report # 16-06 | August 24, 2016
YCS staff assigned to housing units as well as roving YCS staff and
supervisors. This analysis does not account for staff out on leave,
disability, or workers’ compensation.
Currently, there is no standard in New Mexico statute or rule specifying
required staffing ratios for the state’s secure commitment facilities. A
staffing plan for Camino Nuevo Youth Center prepared in advance of a
planned PREA audit attests that the facility is in compliance with JJS
policy of ratios of 1:8 during daylight hours and 1:12 during sleeping
hours, but neither current policies and procedures manuals for CYFD
facilities nor state regulations include these ratios.
Vacancy rates among Youth Care Specialists at secure facilities have decreased. A year-over-year analysis of Youth Care
Specialist staffing levels at CYFD’s secure juvenile justice facilities shows
that vacancy rates increased significantly from July 2013 (the first month
of FY14) and July 2014 (the first month of FY15). The Lincoln Pines
Youth Center, formerly known as Camp Sierra Blanca, reopened in 2013
and closed in 2015, and appears to have had very high vacancy rates during
its tenure, at 44 percent in July 2014 and 39 percent in July 2015. The
closure of this facility and reassignment of its remaining staff during 2015,
combined with a downward trend in average daily populations across all
secure facilities, has likely contributed to fewer vacancies at CYFD’s other
facilities in FY16. This analysis does not include the staffing of 10 beds at
the San Juan County Detention Center that are used by CYFD under
contract.
The Youth Diagnostic and Development Center (YDDC), located in
Albuquerque, has consistently had the lowest vacancy rates of all secure
facilities in the months analyzed, averaging about 10 percent year-over-
year between July 2011 and February 2016. Meanwhile, the Camino
Nuevo Youth Center, a separate facility for higher-risk youth located on
the same campus as YDDC, averaged about 15 percent vacancy rate and
the John Paul Taylor Center in Las Cruces averaged about 14 percent.
Reintegration centers offer positive results for those participating prior to returning to the community, however CYFD is not maximizing use of this resource.
0%
5%
10%
15%
20%
25%
30%
35%
40%
45%
50%
Jul-11 Jul-12 Jul-13 Jul-14 Jul-15 Feb-16
Chart 23. Youth Care Specialist Vacancy Rates at CYFD Secure Facilities, July 2011-Present
Camino Nuevo Youth Center John Paul Taylor Center
Youth Diagnostic and Development Center Lincoln Pines Youth Center*
* Lincoln Pines (formerly Camp Sierra Blanca) reopened in FY14 and closed in FY15 Source: SPO reports, LFC analysis
Effectiveness of Juvenile Justice Facilities and Community-Based Services | Report # 16-06 | August 24, 2016 25
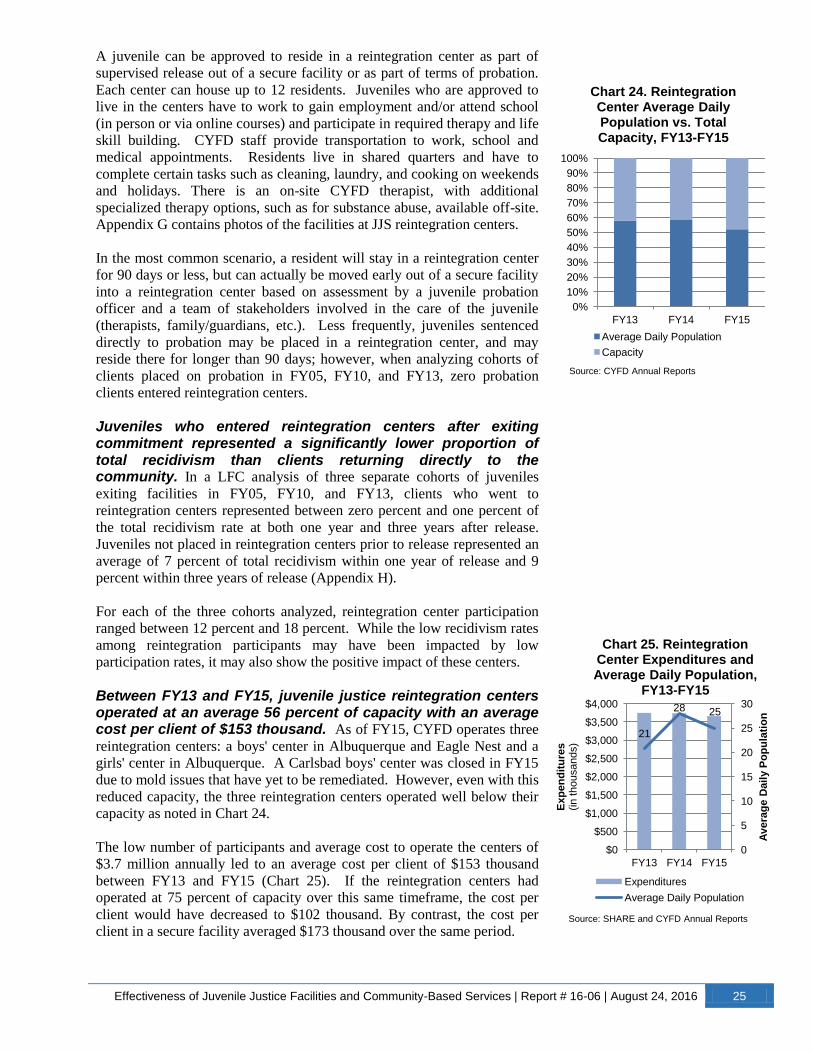
A juvenile can be approved to reside in a reintegration center as part of
supervised release out of a secure facility or as part of terms of probation.
Each center can house up to 12 residents. Juveniles who are approved to
live in the centers have to work to gain employment and/or attend school
(in person or via online courses) and participate in required therapy and life
skill building. CYFD staff provide transportation to work, school and
medical appointments. Residents live in shared quarters and have to
complete certain tasks such as cleaning, laundry, and cooking on weekends
and holidays. There is an on-site CYFD therapist, with additional
specialized therapy options, such as for substance abuse, available off-site.
Appendix G contains photos of the facilities at JJS reintegration centers.
In the most common scenario, a resident will stay in a reintegration center
for 90 days or less, but can actually be moved early out of a secure facility
into a reintegration center based on assessment by a juvenile probation
officer and a team of stakeholders involved in the care of the juvenile
(therapists, family/guardians, etc.). Less frequently, juveniles sentenced
directly to probation may be placed in a reintegration center, and may
reside there for longer than 90 days; however, when analyzing cohorts of
clients placed on probation in FY05, FY10, and FY13, zero probation
clients entered reintegration centers.
Juveniles who entered reintegration centers after exiting commitment represented a significantly lower proportion of total recidivism than clients returning directly to the community. In a LFC analysis of three separate cohorts of juveniles
exiting facilities in FY05, FY10, and FY13, clients who went to
reintegration centers represented between zero percent and one percent of
the total recidivism rate at both one year and three years after release.
Juveniles not placed in reintegration centers prior to release represented an
average of 7 percent of total recidivism within one year of release and 9
percent within three years of release (Appendix H).
For each of the three cohorts analyzed, reintegration center participation
ranged between 12 percent and 18 percent. While the low recidivism rates
among reintegration participants may have been impacted by low
participation rates, it may also show the positive impact of these centers.
Between FY13 and FY15, juvenile justice reintegration centers operated at an average 56 percent of capacity with an average cost per client of $153 thousand. As of FY15, CYFD operates three
reintegration centers: a boys' center in Albuquerque and Eagle Nest and a
girls' center in Albuquerque. A Carlsbad boys' center was closed in FY15
due to mold issues that have yet to be remediated. However, even with this
reduced capacity, the three reintegration centers operated well below their
capacity as noted in Chart 24.
The low number of participants and average cost to operate the centers of
$3.7 million annually led to an average cost per client of $153 thousand
between FY13 and FY15 (Chart 25). If the reintegration centers had
operated at 75 percent of capacity over this same timeframe, the cost per
client would have decreased to $102 thousand. By contrast, the cost per
client in a secure facility averaged $173 thousand over the same period.
21
28 25
0
5
10
15
20
25
30
$0
$500
$1,000
$1,500
$2,000
$2,500
$3,000
$3,500
$4,000
FY13 FY14 FY15
Avera
ge
Dail
y P
op
ula
tio
n
Exp
en
dit
ure
s
(in
thousands)
Chart 25. Reintegration Center Expenditures and Average Daily Population,
FY13-FY15
Expenditures
Average Daily Population
Source: SHARE and CYFD Annual Reports
0%
10%
20%
30%
40%
50%
60%
70%
80%
90%
100%
FY13 FY14 FY15
Chart 24. Reintegration Center Average Daily Population vs. Total Capacity, FY13-FY15
Average Daily Population
Capacity
Source: CYFD Annual Reports
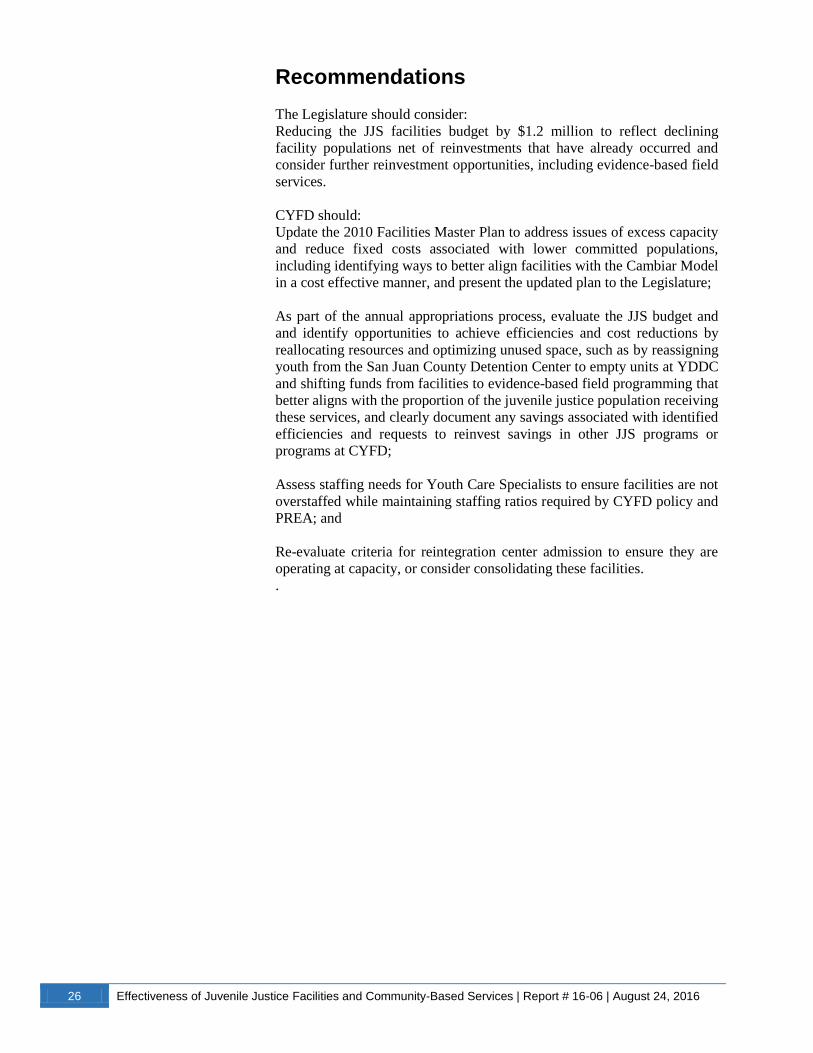
26 Effectiveness of Juvenile Justice Facilities and Community-Based Services | Report # 16-06 | August 24, 2016
Recommendations
The Legislature should consider:
Reducing the JJS facilities budget by $1.2 million to reflect declining
facility populations net of reinvestments that have already occurred and
consider further reinvestment opportunities, including evidence-based field
services.
CYFD should:
Update the 2010 Facilities Master Plan to address issues of excess capacity
and reduce fixed costs associated with lower committed populations,
including identifying ways to better align facilities with the Cambiar Model
in a cost effective manner, and present the updated plan to the Legislature;
As part of the annual appropriations process, evaluate the JJS budget and
and identify opportunities to achieve efficiencies and cost reductions by
reallocating resources and optimizing unused space, such as by reassigning
youth from the San Juan County Detention Center to empty units at YDDC
and shifting funds from facilities to evidence-based field programming that
better aligns with the proportion of the juvenile justice population receiving
these services, and clearly document any savings associated with identified
efficiencies and requests to reinvest savings in other JJS programs or
programs at CYFD;
Assess staffing needs for Youth Care Specialists to ensure facilities are not
overstaffed while maintaining staffing ratios required by CYFD policy and
PREA; and
Re-evaluate criteria for reintegration center admission to ensure they are
operating at capacity, or consider consolidating these facilities.
.
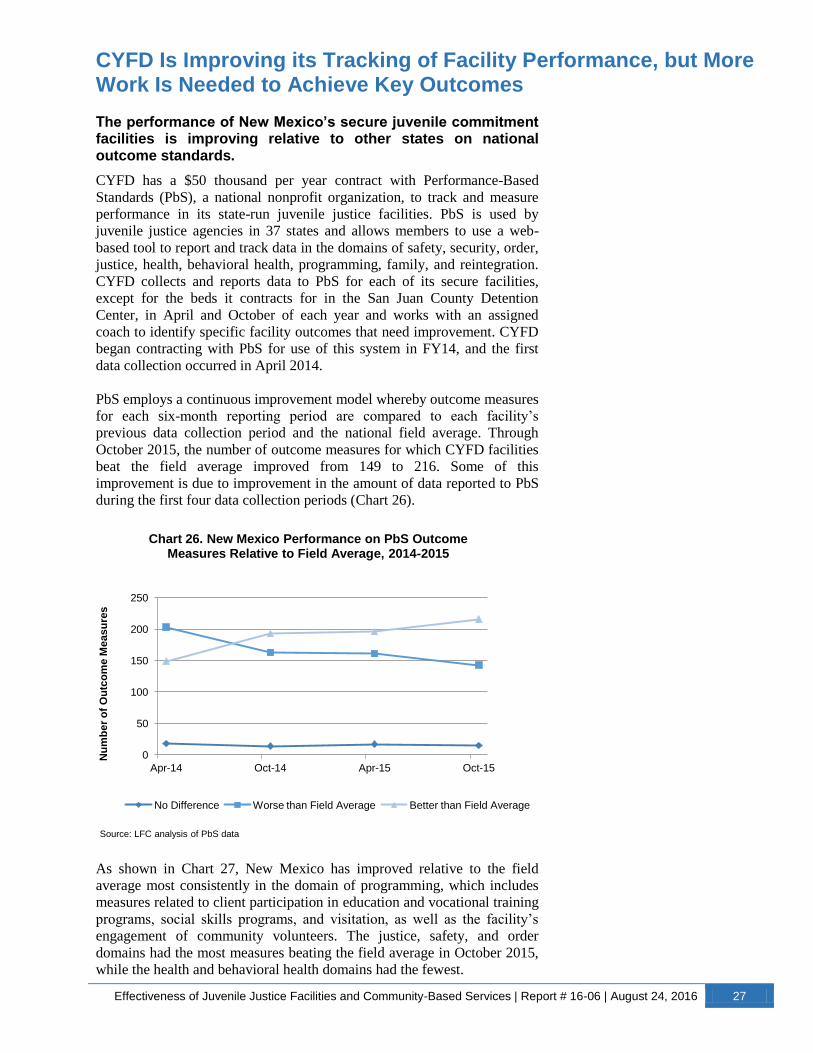
Effectiveness of Juvenile Justice Facilities and Community-Based Services | Report # 16-06 | August 24, 2016 27
CYFD Is Improving its Tracking of Facility Performance, but More Work Is Needed to Achieve Key Outcomes
The performance of New Mexico’s secure juvenile commitment facilities is improving relative to other states on national outcome standards.
CYFD has a $50 thousand per year contract with Performance-Based
Standards (PbS), a national nonprofit organization, to track and measure
performance in its state-run juvenile justice facilities. PbS is used by
juvenile justice agencies in 37 states and allows members to use a web-
based tool to report and track data in the domains of safety, security, order,
justice, health, behavioral health, programming, family, and reintegration.
CYFD collects and reports data to PbS for each of its secure facilities,
except for the beds it contracts for in the San Juan County Detention
Center, in April and October of each year and works with an assigned
coach to identify specific facility outcomes that need improvement. CYFD
began contracting with PbS for use of this system in FY14, and the first
data collection occurred in April 2014.
PbS employs a continuous improvement model whereby outcome measures
for each six-month reporting period are compared to each facility’s
previous data collection period and the national field average. Through
October 2015, the number of outcome measures for which CYFD facilities
beat the field average improved from 149 to 216. Some of this
improvement is due to improvement in the amount of data reported to PbS
during the first four data collection periods (Chart 26).
As shown in Chart 27, New Mexico has improved relative to the field
average most consistently in the domain of programming, which includes
measures related to client participation in education and vocational training
programs, social skills programs, and visitation, as well as the facility’s
engagement of community volunteers. The justice, safety, and order
domains had the most measures beating the field average in October 2015,
while the health and behavioral health domains had the fewest.
0
50
100
150
200
250
Apr-14 Oct-14 Apr-15 Oct-15
Nu
mb
er
of
Ou
tco
me M
easu
res
Chart 26. New Mexico Performance on PbS Outcome Measures Relative to Field Average, 2014-2015
No Difference Worse than Field Average Better than Field Average
Source: LFC analysis of PbS data
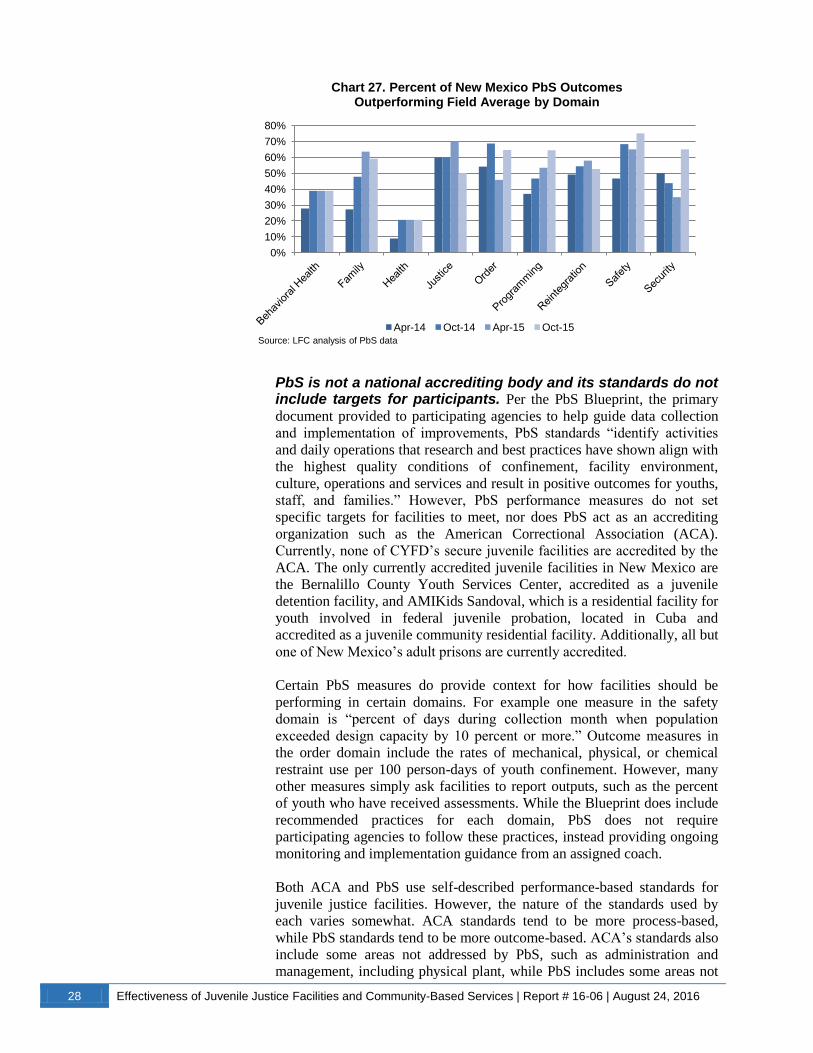
28 Effectiveness of Juvenile Justice Facilities and Community-Based Services | Report # 16-06 | August 24, 2016
PbS is not a national accrediting body and its standards do not include targets for participants. Per the PbS Blueprint, the primary
document provided to participating agencies to help guide data collection
and implementation of improvements, PbS standards “identify activities
and daily operations that research and best practices have shown align with
the highest quality conditions of confinement, facility environment,
culture, operations and services and result in positive outcomes for youths,
staff, and families.” However, PbS performance measures do not set
specific targets for facilities to meet, nor does PbS act as an accrediting
organization such as the American Correctional Association (ACA).
Currently, none of CYFD’s secure juvenile facilities are accredited by the
ACA. The only currently accredited juvenile facilities in New Mexico are
the Bernalillo County Youth Services Center, accredited as a juvenile
detention facility, and AMIKids Sandoval, which is a residential facility for
youth involved in federal juvenile probation, located in Cuba and
accredited as a juvenile community residential facility. Additionally, all but
one of New Mexico’s adult prisons are currently accredited.
Certain PbS measures do provide context for how facilities should be
performing in certain domains. For example one measure in the safety
domain is “percent of days during collection month when population
exceeded design capacity by 10 percent or more.” Outcome measures in
the order domain include the rates of mechanical, physical, or chemical
restraint use per 100 person-days of youth confinement. However, many
other measures simply ask facilities to report outputs, such as the percent
of youth who have received assessments. While the Blueprint does include
recommended practices for each domain, PbS does not require
participating agencies to follow these practices, instead providing ongoing
monitoring and implementation guidance from an assigned coach.
Both ACA and PbS use self-described performance-based standards for
juvenile justice facilities. However, the nature of the standards used by
each varies somewhat. ACA standards tend to be more process-based,
while PbS standards tend to be more outcome-based. ACA’s standards also
include some areas not addressed by PbS, such as administration and
management, including physical plant, while PbS includes some areas not
0%
10%
20%
30%
40%
50%
60%
70%
80%
Chart 27. Percent of New Mexico PbS Outcomes Outperforming Field Average by Domain
Apr-14 Oct-14 Apr-15 Oct-15
Source: LFC analysis of PbS data

Effectiveness of Juvenile Justice Facilities and Community-Based Services | Report # 16-06 | August 24, 2016 29
addressed by ACA, such as family and reintegration. Appendix I shows a
selection of comparable performance measures for each system, including
examples of measures that are unique to each.
CYFD certifies local youth detention facilities for compliance with state standards, but its own facilities are not subject to comparable oversight. CYFD has responsibility for certifying New
Mexico’s 12 local juvenile detention centers for compliance with state
detention standards. A detention facility is defined in the Children’s Code
as “a place where a child may be detained…pending court hearing and
does not include a facility for the care and rehabilitation of an adjudicated
delinquent child” (Section 32A-2-3 NMSA 1978). Adjudicated youth who
have been sentenced to term commitment are housed in CYFD’s secure
facilities.
Statute further requires CYFD to promulgate standards for these facilities,
including standards for “site, design, construction, equipment, care,
program, personnel and clinical services” (Section 32A-2-4 NMSA 1978).
These standards are laid out in the New Mexico Administrative Code and
require CYFD to inspect all local detention facilities at least annually for
compliance. However, there are no comparable requirements in statute or
rule for regular outside inspection or certification of CYFD’s secure
commitment facilities. Currently, regulations only require CYFD to
perform regular self-inspections of its facilities’ physical plant.
The rate of incidents in secure facilities has doubled since FY11.
Incidents can range from graffiti to possession of banned or illegal
substances, such as alcohol or drugs, to assault and battery. In FY11-FY13,
incidents averaged 11 per year per juvenile across all facilities based on
average daily population. However, there is a significant increase in FY14
and again in FY15, as noted in Chart 28.
Average daily population across juvenile secure facilities dropped 30
percent between FY13 and FY15, however overall incidents increased 40
percent. All facilities except J. Paul Taylor experienced increases in
incidents between FY13 and FY15 as noted in Chart 30.
11 11 10
15
20
0
5
10
15
20
25
FY11 FY12 FY13 FY14 FY15
Chart 28. Average Rate of Secure Facility Incidents per Client,
FY11-FY15
Source: LFC Analysis of CYFD data
0
50
100
150
200
250
300
0
500
1,000
1,500
2,000
2,500
3,000
3,500
4,000
FY11 FY12 FY13 FY14 FY15
Chart 29. Total Secure Facility Incidents and Average Daily
Population, FY11-FY15
Incidents Average Daily Population
Source: CYFD
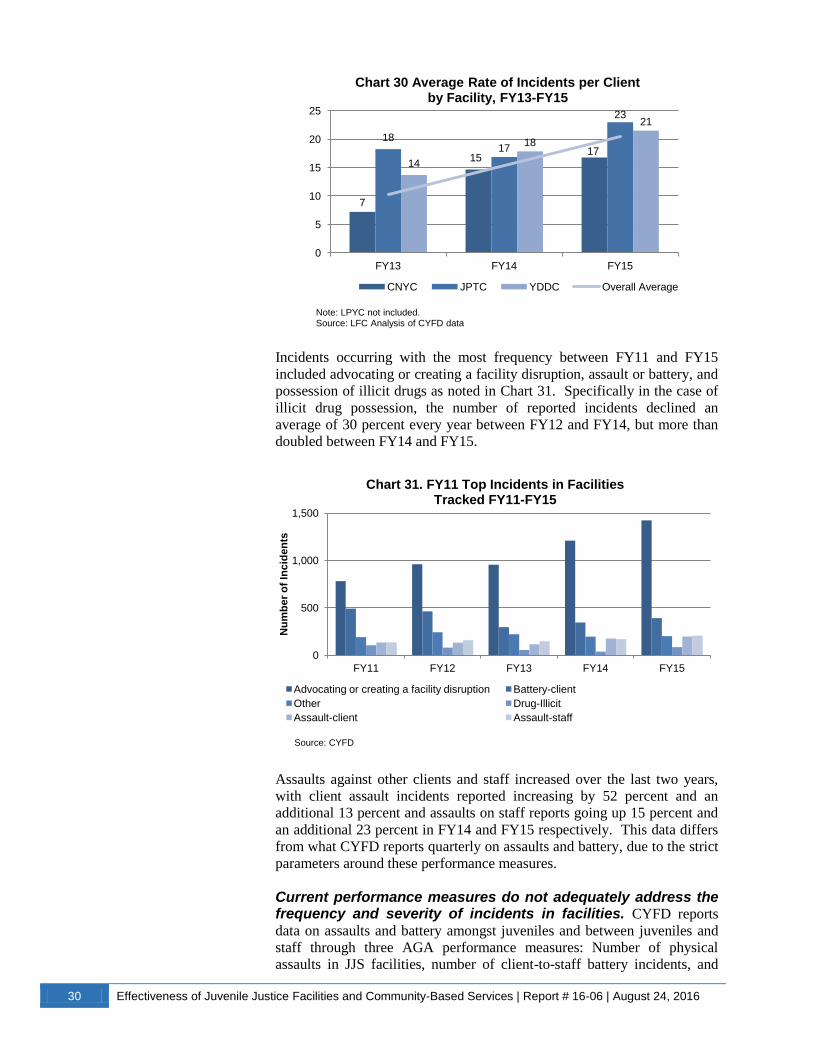
30 Effectiveness of Juvenile Justice Facilities and Community-Based Services | Report # 16-06 | August 24, 2016
Incidents occurring with the most frequency between FY11 and FY15
included advocating or creating a facility disruption, assault or battery, and
possession of illicit drugs as noted in Chart 31. Specifically in the case of
illicit drug possession, the number of reported incidents declined an
average of 30 percent every year between FY12 and FY14, but more than
doubled between FY14 and FY15.
Assaults against other clients and staff increased over the last two years,
with client assault incidents reported increasing by 52 percent and an
additional 13 percent and assaults on staff reports going up 15 percent and
an additional 23 percent in FY14 and FY15 respectively. This data differs
from what CYFD reports quarterly on assaults and battery, due to the strict
parameters around these performance measures.
Current performance measures do not adequately address the frequency and severity of incidents in facilities. CYFD reports
data on assaults and battery amongst juveniles and between juveniles and
staff through three AGA performance measures: Number of physical
assaults in JJS facilities, number of client-to-staff battery incidents, and
7
15 17
18 17
23
14
18
21
0
5
10
15
20
25
FY13 FY14 FY15
Chart 30 Average Rate of Incidents per Client by Facility, FY13-FY15
CNYC JPTC YDDC Overall Average
Note: LPYC not included. Source: LFC Analysis of CYFD data
0
500
1,000
1,500
FY11 FY12 FY13 FY14 FY15
Nu
mb
er
of
Inc
iden
ts
Chart 31. FY11 Top Incidents in Facilities Tracked FY11-FY15
Advocating or creating a facility disruption Battery-client
Other Drug-Illicit
Assault-client Assault-staff
Source: CYFD
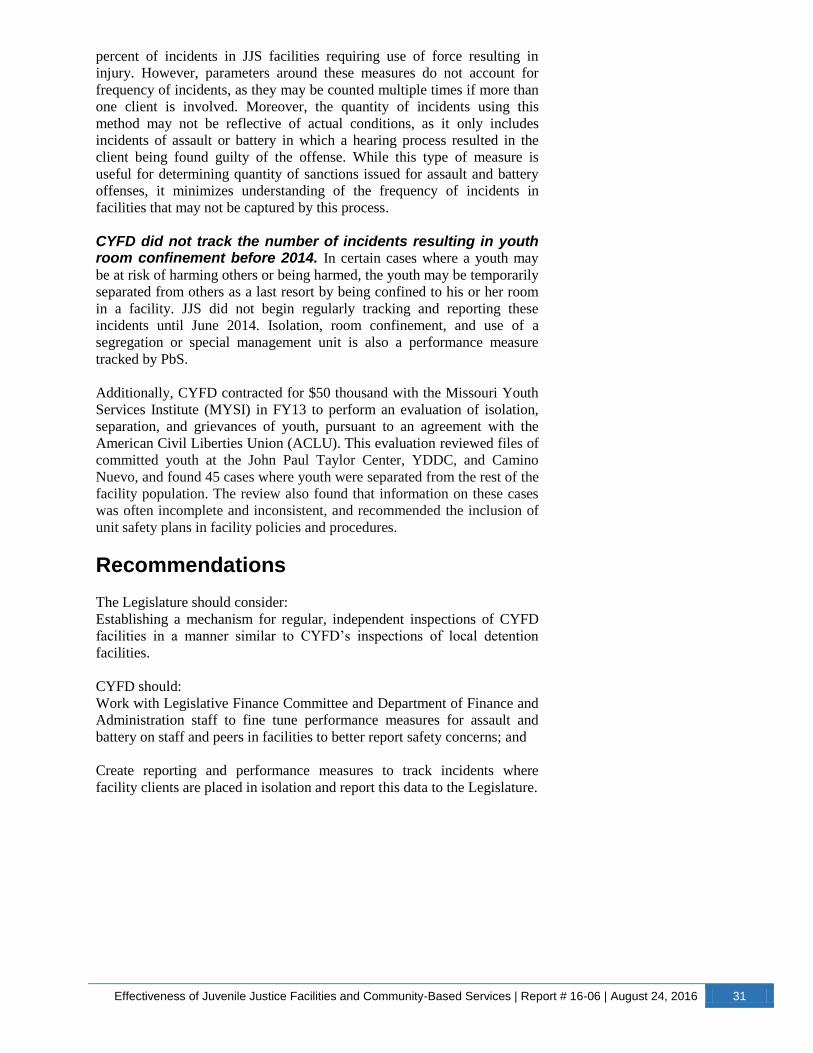
Effectiveness of Juvenile Justice Facilities and Community-Based Services | Report # 16-06 | August 24, 2016 31
percent of incidents in JJS facilities requiring use of force resulting in
injury. However, parameters around these measures do not account for
frequency of incidents, as they may be counted multiple times if more than
one client is involved. Moreover, the quantity of incidents using this
method may not be reflective of actual conditions, as it only includes
incidents of assault or battery in which a hearing process resulted in the
client being found guilty of the offense. While this type of measure is
useful for determining quantity of sanctions issued for assault and battery
offenses, it minimizes understanding of the frequency of incidents in
facilities that may not be captured by this process.
CYFD did not track the number of incidents resulting in youth room confinement before 2014. In certain cases where a youth may
be at risk of harming others or being harmed, the youth may be temporarily
separated from others as a last resort by being confined to his or her room
in a facility. JJS did not begin regularly tracking and reporting these
incidents until June 2014. Isolation, room confinement, and use of a
segregation or special management unit is also a performance measure
tracked by PbS.
Additionally, CYFD contracted for $50 thousand with the Missouri Youth
Services Institute (MYSI) in FY13 to perform an evaluation of isolation,
separation, and grievances of youth, pursuant to an agreement with the
American Civil Liberties Union (ACLU). This evaluation reviewed files of
committed youth at the John Paul Taylor Center, YDDC, and Camino
Nuevo, and found 45 cases where youth were separated from the rest of the
facility population. The review also found that information on these cases
was often incomplete and inconsistent, and recommended the inclusion of
unit safety plans in facility policies and procedures.
Recommendations
The Legislature should consider:
Establishing a mechanism for regular, independent inspections of CYFD
facilities in a manner similar to CYFD’s inspections of local detention
facilities.
CYFD should:
Work with Legislative Finance Committee and Department of Finance and
Administration staff to fine tune performance measures for assault and
battery on staff and peers in facilities to better report safety concerns; and
Create reporting and performance measures to track incidents where
facility clients are placed in isolation and report this data to the Legislature.

32 Effectiveness of Juvenile Justice Facilities and Community-Based Services | Report # 16-06 | August 24, 2016
The Structure of Juvenile Probation Field Offices Contributes to Inefficiencies in the System
Juvenile probation officers perform a multifaceted role as a youth’s main point of contact with the juvenile justice system.
Every youth referred to JJS interacts with a juvenile probation officer
(JPO) regardless of whether or not that youth is eventually committed to a
facility. The vast majority of JJS clients, roughly 98 percent in FY15, are
not committed and instead receive formal or informal dispositions whereby
they have varying levels of interaction with JPOs, CYFD field behavioral
health therapists, and community providers such as continuum sites or
juvenile community corrections (JCC).
A JPO’s role is not confined strictly to probation and supervised release.
The JPO is responsible for shepherding the case through the system on
behalf of CYFD, from an initial risk assessment to determine whether or
not the client should be held in detention to, if necessary, facility
commitment, supervised release, and transition services. Regular duties
include conducting preliminary inquiries and client and family interviews,
referring cases to the Children’s Court and appearing at hearings,
recommending specific services or dispositions, participating in and
facilitating regular multidisciplinary team (MDT) meetings, and
monitoring a client’s compliance with conditions of probation or
supervised release.
Map 1 illustrates the configuration of each of the three juvenile probation
regions (north, central, and south). The JPO hierarchy includes a deputy
director of field services, an associate deputy director over each region, a
chief JPO for each of the 14 districts, and
JPO supervisors who oversee two levels of
line staff.
A JPO I typically acts as a community
support officer (CSO), making visits to
clients in the field and directly monitoring
compliance with conditions of probation or
supervised release in the home and
community. The role of a JPO II focuses on
managing a client’s case and developing and
implementing a plan of care, coordinating
field information gathered by the JPO I, and
facilitating multi-disciplinary teams that
may involve several stakeholders, from the
client’s family to community providers.
A Community Supervision Level Matrix
specifies the level and type of monitoring a
client should receive, depending on the
youth’s risk and needs levels. The matrix
lays out the minimum levels of contact a
client should receive, including the
frequency of contact in the field by the
assigned CSO. The full matrix can be seen
in Appendix J.
Map 1. Juvenile Probation Regions
Source: CYFD

Effectiveness of Juvenile Justice Facilities and Community-Based Services | Report # 16-06 | August 24, 2016 33
Despite fewer referrals to JJS, probation and field services costs continue to rise and workloads are unevenly distributed.
The number of clients referred to JJS fell by 19 percent between FY13 and
FY15. However, as shown in Chart 32, overall spending on probation and
field services, encompassing the costs of formal and informal probation,
behavioral health services, and state funding provided to JCC and
continuum service providers, grew by 7 percent during the same period. As
illustrated in Chart 33, The average cost per client grew by 31 percent,
from about $1,750 in FY13 to about $2,300 in FY15.
Counting only spending on direct JPO activities, the statewide average cost
per referred client averaged approximately $1,500 in FY15, as shown in
Chart 34. Two districts had notably higher costs. District 4 (Guadalupe,
Mora, and San Miguel counties) had an average cost of over $4,300 per
referred client, while District 7 (Catron, Sierra, Socorro, and Torrance
counties) had a cost of $2,800 per referred client. This excludes continuum
and juvenile community corrections programs, and field behavioral health
services, which are accounted for separately from field offices.
0
2,000
4,000
6,000
8,000
10,000
12,000
14,000
16,000
$19,000
$20,000
$21,000
$22,000
$23,000
$24,000
$25,000
$26,000
$27,000
FY13 FY14 FY15 Nu
mb
er
of
Cli
en
ts R
efe
rred
Ju
ven
ile P
rob
ati
on
an
d F
ield
S
pe
nd
ing
($ i
n T
ho
us
an
ds
)
Chart 32. Juvenile Probation and Field Spending and Clients Referred,
FY13-FY15
Number of Clients Referred to JJS
Juvenile Probation and Field Services Spending
Source: LFC Analysis
0
2,000
4,000
6,000
8,000
10,000
12,000
14,000
16,000
$800
$1,000
$1,200
$1,400
$1,600
$1,800
$2,000
$2,200
$2,400
FY13 FY14 FY15
Nu
mb
er
of
Cli
en
ts R
efe
rred
Avera
ge
Pro
ba
tio
n a
nd
Fie
ld C
os
t p
er
Cli
en
t
Chart 33. Juvenile Probation and Field Cost per Referred Client,
FY13-FY15
Number of Clients Referred to JJS
Cost per Client Referred
Source: LFC Analysis
$- $2,000 $4,000 $6,000
Statewide
14 (Chaves, Eddy)
13 (Cibola, Sandoval, Valencia)
12 (Lincoln, Otero)
11 (McKinley, San Juan)
9 & 10* (Curry, Roosevelt, De Baca, Harding, Quay)
8 (Colfax, Taos, Union)
7 (Catron, Sierra, Socorro, Torrance)
6 (Grant, Hidalgo, Luna)
5 (Lea)
4 (Guadalupe, Mora, San Miguel)
3 (Doña Ana)
2 (Bernalillo)
1 (Los Alamos, Rio Arriba, Santa Fe)
Chart 34. Average Field Office Cost per Referred Client, FY15
* Districts 9 and 10 are combined administratively for staffing purposes Source: LFC Analysis
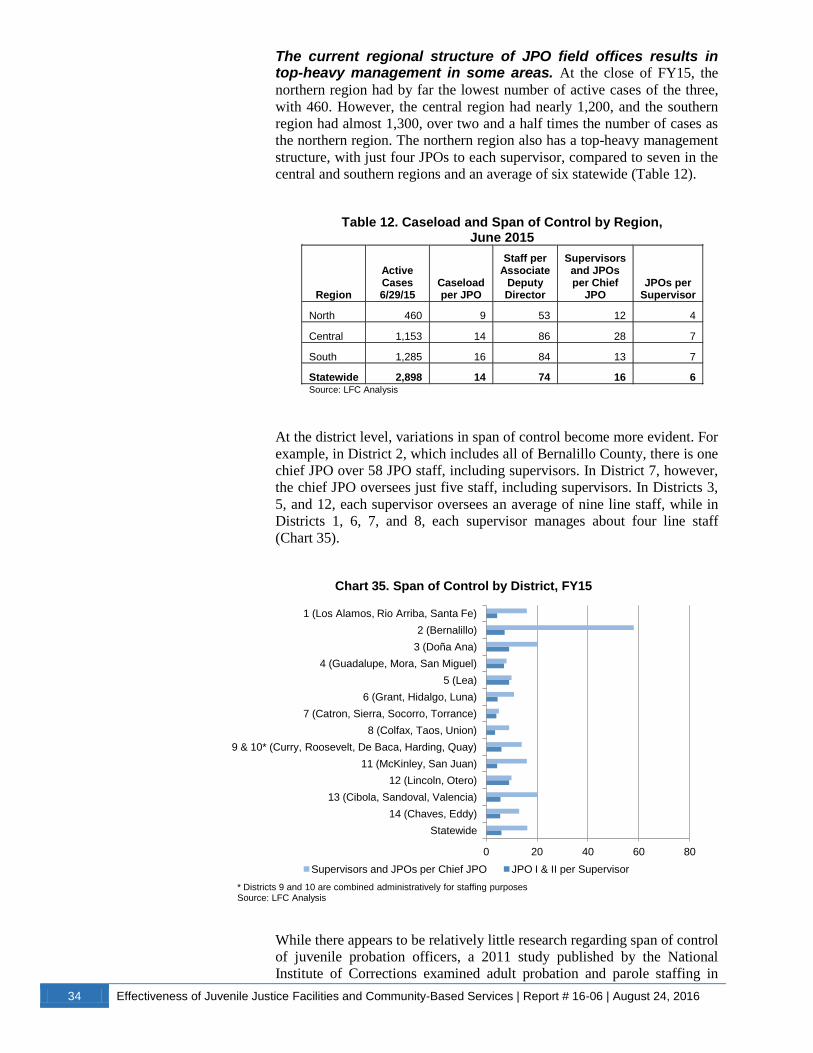
34 Effectiveness of Juvenile Justice Facilities and Community-Based Services | Report # 16-06 | August 24, 2016
The current regional structure of JPO field offices results in top-heavy management in some areas. At the close of FY15, the
northern region had by far the lowest number of active cases of the three,
with 460. However, the central region had nearly 1,200, and the southern
region had almost 1,300, over two and a half times the number of cases as
the northern region. The northern region also has a top-heavy management
structure, with just four JPOs to each supervisor, compared to seven in the
central and southern regions and an average of six statewide (Table 12).
Table 12. Caseload and Span of Control by Region, June 2015
Region
Active Cases 6/29/15
Caseload per JPO
Staff per Associate
Deputy Director
Supervisors and JPOs per Chief
JPO JPOs per
Supervisor
North 460 9 53 12 4
Central 1,153 14 86 28 7
South 1,285 16 84 13 7
Statewide 2,898 14 74 16 6 Source: LFC Analysis
At the district level, variations in span of control become more evident. For
example, in District 2, which includes all of Bernalillo County, there is one
chief JPO over 58 JPO staff, including supervisors. In District 7, however,
the chief JPO oversees just five staff, including supervisors. In Districts 3,
5, and 12, each supervisor oversees an average of nine line staff, while in
Districts 1, 6, 7, and 8, each supervisor manages about four line staff
(Chart 35).
While there appears to be relatively little research regarding span of control
of juvenile probation officers, a 2011 study published by the National
Institute of Corrections examined adult probation and parole staffing in
0 20 40 60 80
Statewide
14 (Chaves, Eddy)
13 (Cibola, Sandoval, Valencia)
12 (Lincoln, Otero)
11 (McKinley, San Juan)
9 & 10* (Curry, Roosevelt, De Baca, Harding, Quay)
8 (Colfax, Taos, Union)
7 (Catron, Sierra, Socorro, Torrance)
6 (Grant, Hidalgo, Luna)
5 (Lea)
4 (Guadalupe, Mora, San Miguel)
3 (Doña Ana)
2 (Bernalillo)
1 (Los Alamos, Rio Arriba, Santa Fe)
Chart 35. Span of Control by District, FY15
Supervisors and JPOs per Chief JPO JPO I & II per Supervisor
* Districts 9 and 10 are combined administratively for staffing purposes Source: LFC Analysis
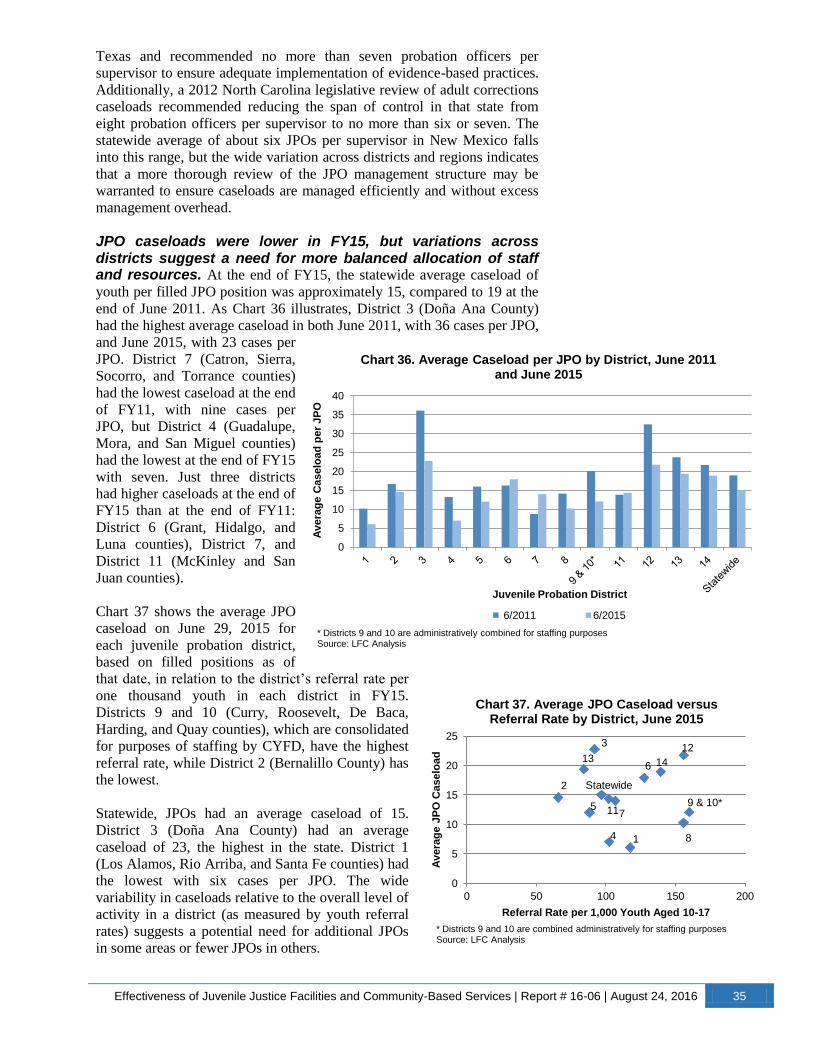
Effectiveness of Juvenile Justice Facilities and Community-Based Services | Report # 16-06 | August 24, 2016 35
Texas and recommended no more than seven probation officers per
supervisor to ensure adequate implementation of evidence-based practices.
Additionally, a 2012 North Carolina legislative review of adult corrections
caseloads recommended reducing the span of control in that state from
eight probation officers per supervisor to no more than six or seven. The
statewide average of about six JPOs per supervisor in New Mexico falls
into this range, but the wide variation across districts and regions indicates
that a more thorough review of the JPO management structure may be
warranted to ensure caseloads are managed efficiently and without excess
management overhead.
JPO caseloads were lower in FY15, but variations across districts suggest a need for more balanced allocation of staff and resources. At the end of FY15, the statewide average caseload of
youth per filled JPO position was approximately 15, compared to 19 at the
end of June 2011. As Chart 36 illustrates, District 3 (Doña Ana County)
had the highest average caseload in both June 2011, with 36 cases per JPO,
and June 2015, with 23 cases per
JPO. District 7 (Catron, Sierra,
Socorro, and Torrance counties)
had the lowest caseload at the end
of FY11, with nine cases per
JPO, but District 4 (Guadalupe,
Mora, and San Miguel counties)
had the lowest at the end of FY15
with seven. Just three districts
had higher caseloads at the end of
FY15 than at the end of FY11:
District 6 (Grant, Hidalgo, and
Luna counties), District 7, and
District 11 (McKinley and San
Juan counties).
Chart 37 shows the average JPO
caseload on June 29, 2015 for
each juvenile probation district,
based on filled positions as of
that date, in relation to the district’s referral rate per
one thousand youth in each district in FY15.
Districts 9 and 10 (Curry, Roosevelt, De Baca,
Harding, and Quay counties), which are consolidated
for purposes of staffing by CYFD, have the highest
referral rate, while District 2 (Bernalillo County) has
the lowest.
Statewide, JPOs had an average caseload of 15.
District 3 (Doña Ana County) had an average
caseload of 23, the highest in the state. District 1
(Los Alamos, Rio Arriba, and Santa Fe counties) had
the lowest with six cases per JPO. The wide
variability in caseloads relative to the overall level of
activity in a district (as measured by youth referral
rates) suggests a potential need for additional JPOs
in some areas or fewer JPOs in others.
1
2
3
4
5
6
7
8
9 & 10* 11
12 13 14
Statewide
0
5
10
15
20
25
0 50 100 150 200
Avera
ge
JP
O C
aselo
ad
Referral Rate per 1,000 Youth Aged 10-17
Chart 37. Average JPO Caseload versus Referral Rate by District, June 2015
* Districts 9 and 10 are combined administratively for staffing purposes Source: LFC Analysis
0
5
10
15
20
25
30
35
40
Avera
ge
Caselo
ad
pe
r JP
O
Juvenile Probation District
Chart 36. Average Caseload per JPO by District, June 2011 and June 2015
6/2011 6/2015
* Districts 9 and 10 are administratively combined for staffing purposes Source: LFC Analysis
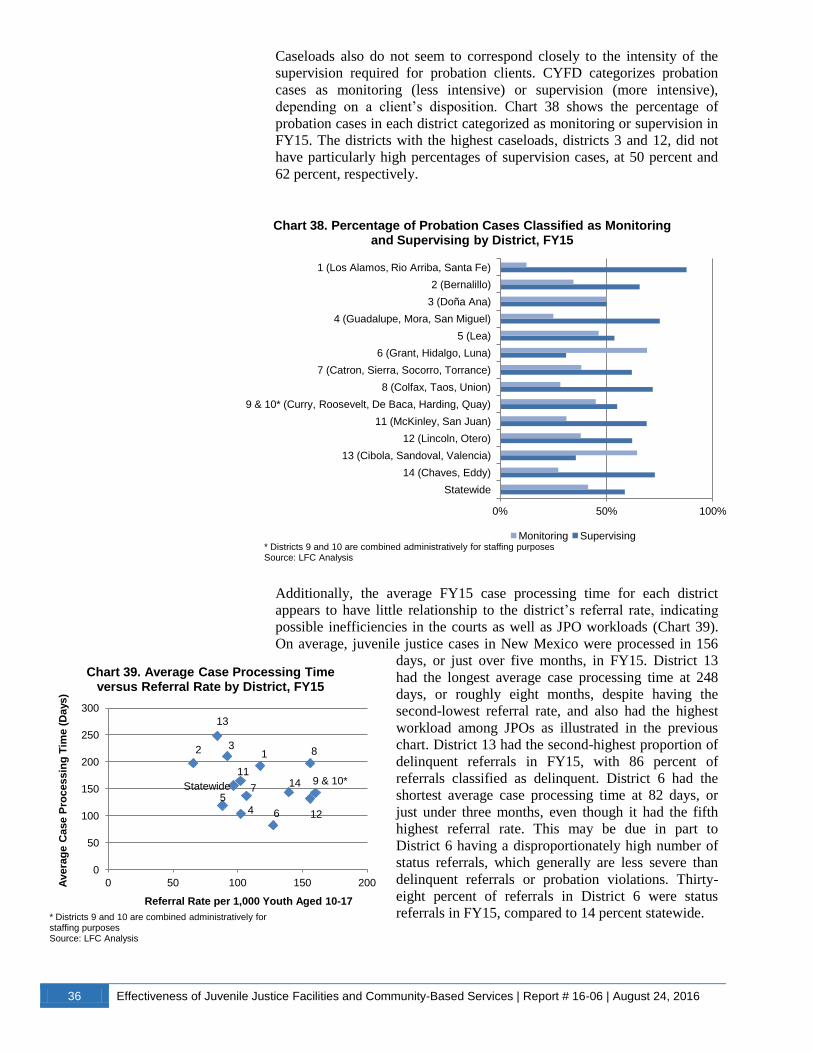
36 Effectiveness of Juvenile Justice Facilities and Community-Based Services | Report # 16-06 | August 24, 2016
Caseloads also do not seem to correspond closely to the intensity of the
supervision required for probation clients. CYFD categorizes probation
cases as monitoring (less intensive) or supervision (more intensive),
depending on a client’s disposition. Chart 38 shows the percentage of
probation cases in each district categorized as monitoring or supervision in
FY15. The districts with the highest caseloads, districts 3 and 12, did not
have particularly high percentages of supervision cases, at 50 percent and
62 percent, respectively.
Additionally, the average FY15 case processing time for each district
appears to have little relationship to the district’s referral rate, indicating
possible inefficiencies in the courts as well as JPO workloads (Chart 39).
On average, juvenile justice cases in New Mexico were processed in 156
days, or just over five months, in FY15. District 13
had the longest average case processing time at 248
days, or roughly eight months, despite having the
second-lowest referral rate, and also had the highest
workload among JPOs as illustrated in the previous
chart. District 13 had the second-highest proportion of
delinquent referrals in FY15, with 86 percent of
referrals classified as delinquent. District 6 had the
shortest average case processing time at 82 days, or
just under three months, even though it had the fifth
highest referral rate. This may be due in part to
District 6 having a disproportionately high number of
status referrals, which generally are less severe than
delinquent referrals or probation violations. Thirty-
eight percent of referrals in District 6 were status
referrals in FY15, compared to 14 percent statewide.
2
13
5
3
Statewide
11
4
7
1
6
14
8
12
9 & 10*
0
50
100
150
200
250
300
0 50 100 150 200 Avera
ge
Case P
rocessin
g T
ime (
Days)
Referral Rate per 1,000 Youth Aged 10-17
Chart 39. Average Case Processing Time versus Referral Rate by District, FY15
* Districts 9 and 10 are combined administratively for staffing purposes Source: LFC Analysis
0% 50% 100%
Statewide
14 (Chaves, Eddy)
13 (Cibola, Sandoval, Valencia)
12 (Lincoln, Otero)
11 (McKinley, San Juan)
9 & 10* (Curry, Roosevelt, De Baca, Harding, Quay)
8 (Colfax, Taos, Union)
7 (Catron, Sierra, Socorro, Torrance)
6 (Grant, Hidalgo, Luna)
5 (Lea)
4 (Guadalupe, Mora, San Miguel)
3 (Doña Ana)
2 (Bernalillo)
1 (Los Alamos, Rio Arriba, Santa Fe)
Chart 38. Percentage of Probation Cases Classified as Monitoring and Supervising by District, FY15
Monitoring Supervising * Districts 9 and 10 are combined administratively for staffing purposes Source: LFC Analysis

Effectiveness of Juvenile Justice Facilities and Community-Based Services | Report # 16-06 | August 24, 2016 37
New Mexico may be able to realize savings by realigning juvenile probation regions similarly to the adult probation system.
New Mexico’s adult probation system has four regions, each with a
regional manager, and probation supervisors reporting to those managers,
without the layer of chiefs that exists in the juvenile system. CYFD could
realign its own regions to more closely match the adult probation system,
creating four regions (Central, North, Southeast, and Southwest) instead of
the current three. Analysis by LFC staff suggests realigning the JPO
regions in this manner, eliminating
the level of chief JPOs, and
reallocating supervisors and front-
line staff across regions to even
out caseloads and create a span of
control of roughly six JPOs per
supervisor could result in net
savings of $799 thousand
compared to FY16 levels (Table
13).
Other states may offer examples of ways CYFD could further examine its JPO workload to ensure resources are optimized across the state. The Oregon Youth Authority conducted a study in
2011 of its own juvenile probation workload, including a random moment
study and focus groups designed to determine how much time JPOs were
spending on direct supervision versus planning, management, and other
tasks. This study also took into consideration the impact of client risk
levels on the amount of time an officer spends on a particular case, and
found that although JPOs were expected to spend more time working with
higher risk youth, this was not always the case. Alaska conducted a similar
time study in 2009 that broke down the time JPOs spent on formal and
informal cases and assessed where additional staff may be needed to
alleviate burdensome workloads. CYFD may wish to consider undertaking
similar analyses of its staffing needs in probation offices to examine why
some areas experience higher caseloads and processing times than others.
Juvenile probation officer staffing has stabilized in recent years, although filling entry level vacancies remains a challenge. Vacancy rates for JPOs are reflective of higher turnover
among entry level officers, who hire in under the JPO I classification. A
year-over-year analysis from July 2011 to February 2016 shows JPO
vacancies peaking in July 2013 at 38 percent, and reaching about 22
percent and 24 percent, respectively, in July 2015 and February 2016.
Entry level JPO I positions tend to experience higher turnover either due to
promotion to JPO II or because employees leave the JPO classification
entirely. In interviews with LFC staff, CYFD probation staff indicated that
filling JPO I positions can be challenging due to some hires being
unprepared for the nature of the work, but the lower vacancy rates of JPO
II’s are indicative of employees tending to stay on once they have reached
that level. The vacancy rate for JPO II’s was 5 percent in both July 2015
and February 2016, down from 8 percent in July 2014 and 10 percent in
July 2013 (Chart 40).
Table 13. Estimated Fiscal Impact of Realigning JPO Regions to
Adult Probation Model
Estimated Cost of Additional Associate Deputy Director/Regional Manager $78,000
Estimated Cost of Additional JPO I (to balance caseloads in Southwest) $39,000
Estimated Savings from Eliminating Chief JPO Level ($916,000)
Net Savings ($799,000) Source: LFC Analysis
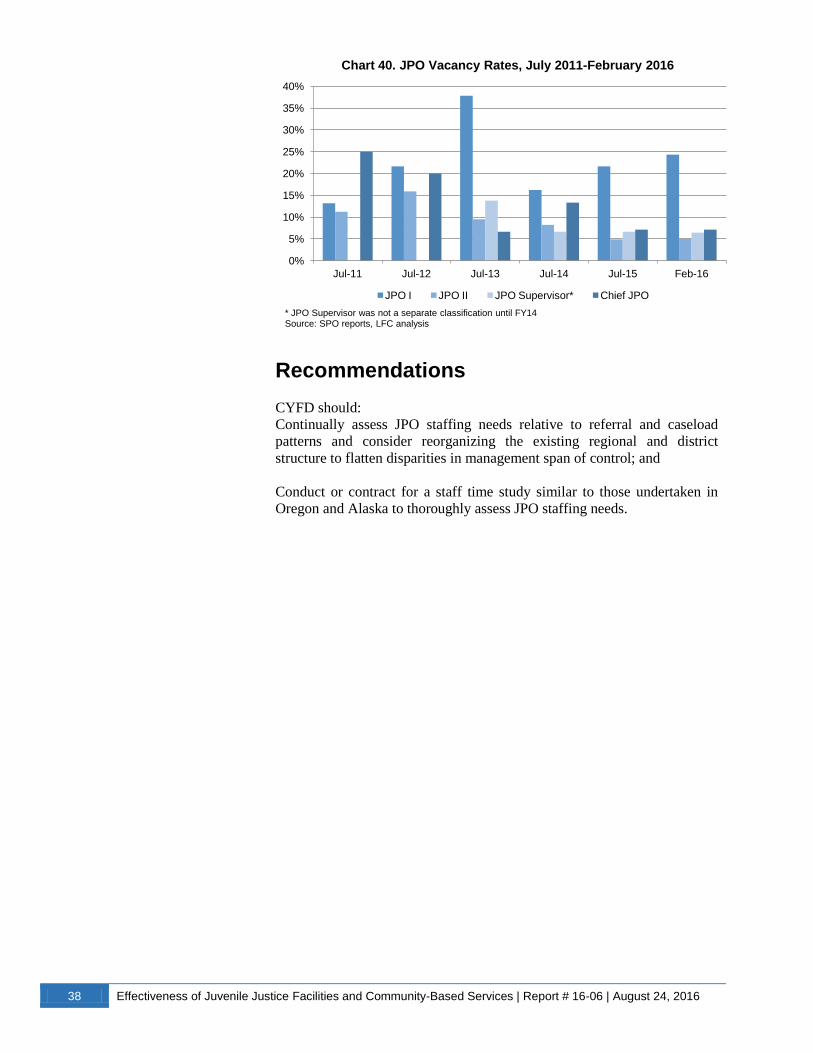
38 Effectiveness of Juvenile Justice Facilities and Community-Based Services | Report # 16-06 | August 24, 2016
Recommendations
CYFD should:
Continually assess JPO staffing needs relative to referral and caseload
patterns and consider reorganizing the existing regional and district
structure to flatten disparities in management span of control; and
Conduct or contract for a staff time study similar to those undertaken in
Oregon and Alaska to thoroughly assess JPO staffing needs.
0%
5%
10%
15%
20%
25%
30%
35%
40%
Jul-11 Jul-12 Jul-13 Jul-14 Jul-15 Feb-16
Chart 40. JPO Vacancy Rates, July 2011-February 2016
JPO I JPO II JPO Supervisor* Chief JPO
* JPO Supervisor was not a separate classification until FY14 Source: SPO reports, LFC analysis
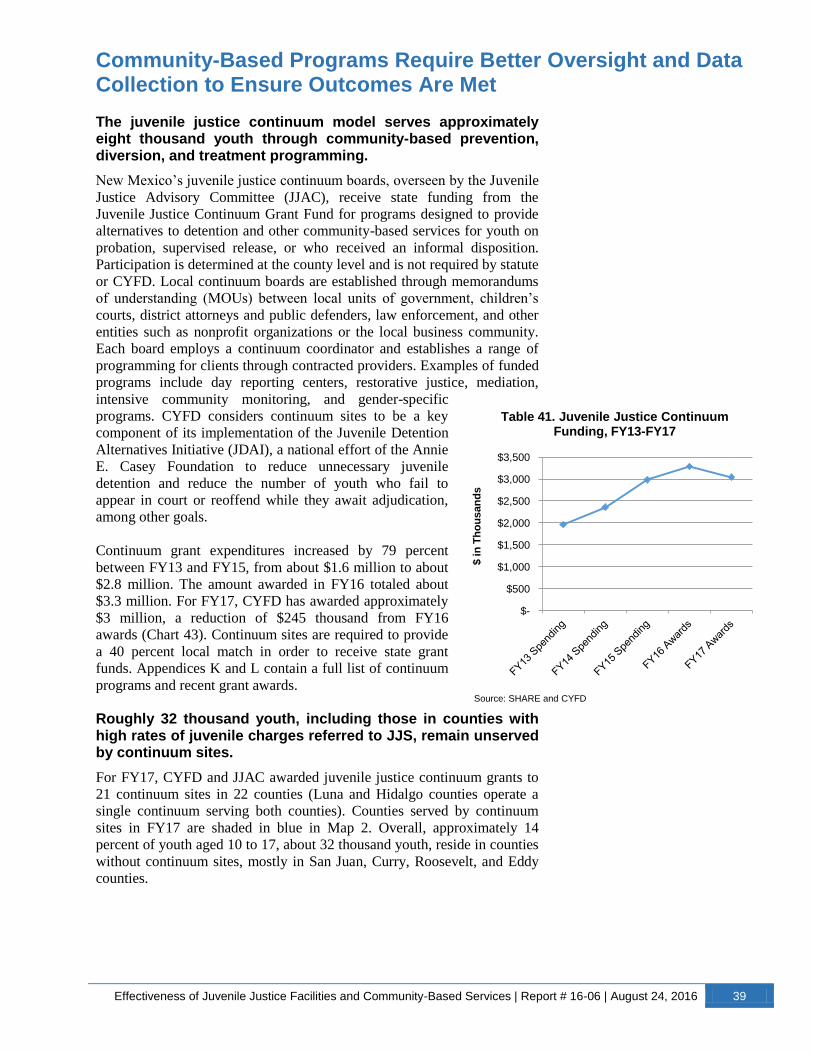
Effectiveness of Juvenile Justice Facilities and Community-Based Services | Report # 16-06 | August 24, 2016 39
Community-Based Programs Require Better Oversight and Data Collection to Ensure Outcomes Are Met
The juvenile justice continuum model serves approximately eight thousand youth through community-based prevention, diversion, and treatment programming.
New Mexico’s juvenile justice continuum boards, overseen by the Juvenile
Justice Advisory Committee (JJAC), receive state funding from the
Juvenile Justice Continuum Grant Fund for programs designed to provide
alternatives to detention and other community-based services for youth on
probation, supervised release, or who received an informal disposition.
Participation is determined at the county level and is not required by statute
or CYFD. Local continuum boards are established through memorandums
of understanding (MOUs) between local units of government, children’s
courts, district attorneys and public defenders, law enforcement, and other
entities such as nonprofit organizations or the local business community.
Each board employs a continuum coordinator and establishes a range of
programming for clients through contracted providers. Examples of funded
programs include day reporting centers, restorative justice, mediation,
intensive community monitoring, and gender-specific
programs. CYFD considers continuum sites to be a key
component of its implementation of the Juvenile Detention
Alternatives Initiative (JDAI), a national effort of the Annie
E. Casey Foundation to reduce unnecessary juvenile
detention and reduce the number of youth who fail to
appear in court or reoffend while they await adjudication,
among other goals.
Continuum grant expenditures increased by 79 percent
between FY13 and FY15, from about $1.6 million to about
$2.8 million. The amount awarded in FY16 totaled about
$3.3 million. For FY17, CYFD has awarded approximately
$3 million, a reduction of $245 thousand from FY16
awards (Chart 43). Continuum sites are required to provide
a 40 percent local match in order to receive state grant
funds. Appendices K and L contain a full list of continuum
programs and recent grant awards.
Roughly 32 thousand youth, including those in counties with high rates of juvenile charges referred to JJS, remain unserved by continuum sites.
For FY17, CYFD and JJAC awarded juvenile justice continuum grants to
21 continuum sites in 22 counties (Luna and Hidalgo counties operate a
single continuum serving both counties). Counties served by continuum
sites in FY17 are shaded in blue in Map 2. Overall, approximately 14
percent of youth aged 10 to 17, about 32 thousand youth, reside in counties
without continuum sites, mostly in San Juan, Curry, Roosevelt, and Eddy
counties.
$-
$500
$1,000
$1,500
$2,000
$2,500
$3,000
$3,500
$ in
Th
ou
san
ds
Table 41. Juvenile Justice Continuum Funding, FY13-FY17
Source: SHARE and CYFD
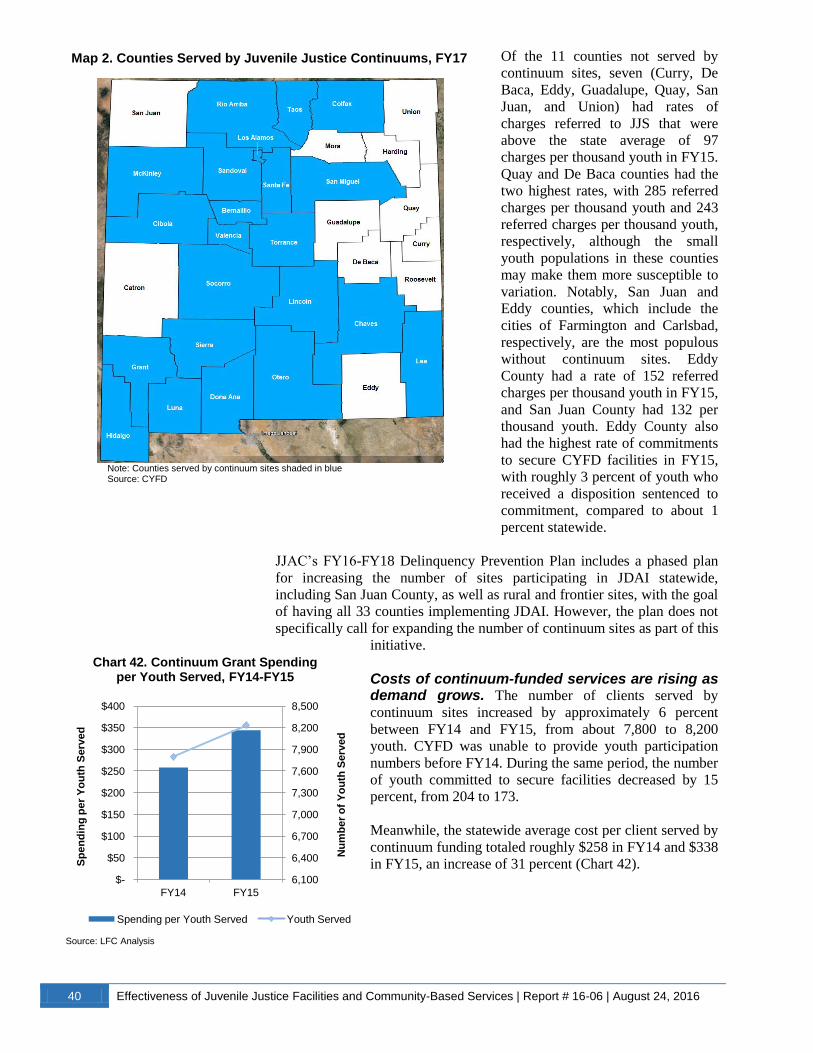
40 Effectiveness of Juvenile Justice Facilities and Community-Based Services | Report # 16-06 | August 24, 2016
Of the 11 counties not served by
continuum sites, seven (Curry, De
Baca, Eddy, Guadalupe, Quay, San
Juan, and Union) had rates of
charges referred to JJS that were
above the state average of 97
charges per thousand youth in FY15.
Quay and De Baca counties had the
two highest rates, with 285 referred
charges per thousand youth and 243
referred charges per thousand youth,
respectively, although the small
youth populations in these counties
may make them more susceptible to
variation. Notably, San Juan and
Eddy counties, which include the
cities of Farmington and Carlsbad,
respectively, are the most populous
without continuum sites. Eddy
County had a rate of 152 referred
charges per thousand youth in FY15,
and San Juan County had 132 per
thousand youth. Eddy County also
had the highest rate of commitments
to secure CYFD facilities in FY15,
with roughly 3 percent of youth who
received a disposition sentenced to
commitment, compared to about 1
percent statewide.
JJAC’s FY16-FY18 Delinquency Prevention Plan includes a phased plan
for increasing the number of sites participating in JDAI statewide,
including San Juan County, as well as rural and frontier sites, with the goal
of having all 33 counties implementing JDAI. However, the plan does not
specifically call for expanding the number of continuum sites as part of this
initiative.
Costs of continuum-funded services are rising as demand grows. The number of clients served by
continuum sites increased by approximately 6 percent
between FY14 and FY15, from about 7,800 to 8,200
youth. CYFD was unable to provide youth participation
numbers before FY14. During the same period, the number
of youth committed to secure facilities decreased by 15
percent, from 204 to 173.
Meanwhile, the statewide average cost per client served by
continuum funding totaled roughly $258 in FY14 and $338
in FY15, an increase of 31 percent (Chart 42).
6,100
6,400
6,700
7,000
7,300
7,600
7,900
8,200
8,500
$-
$50
$100
$150
$200
$250
$300
$350
$400
FY14 FY15
Nu
mb
er
of
Yo
uth
Serv
ed
Sp
en
din
g p
er
Yo
uth
Serv
ed
Chart 42. Continuum Grant Spending per Youth Served, FY14-FY15
Spending per Youth Served Youth Served
Source: LFC Analysis
Map 2. Counties Served by Juvenile Justice Continuums, FY17
Note: Counties served by continuum sites shaded in blue Source: CYFD
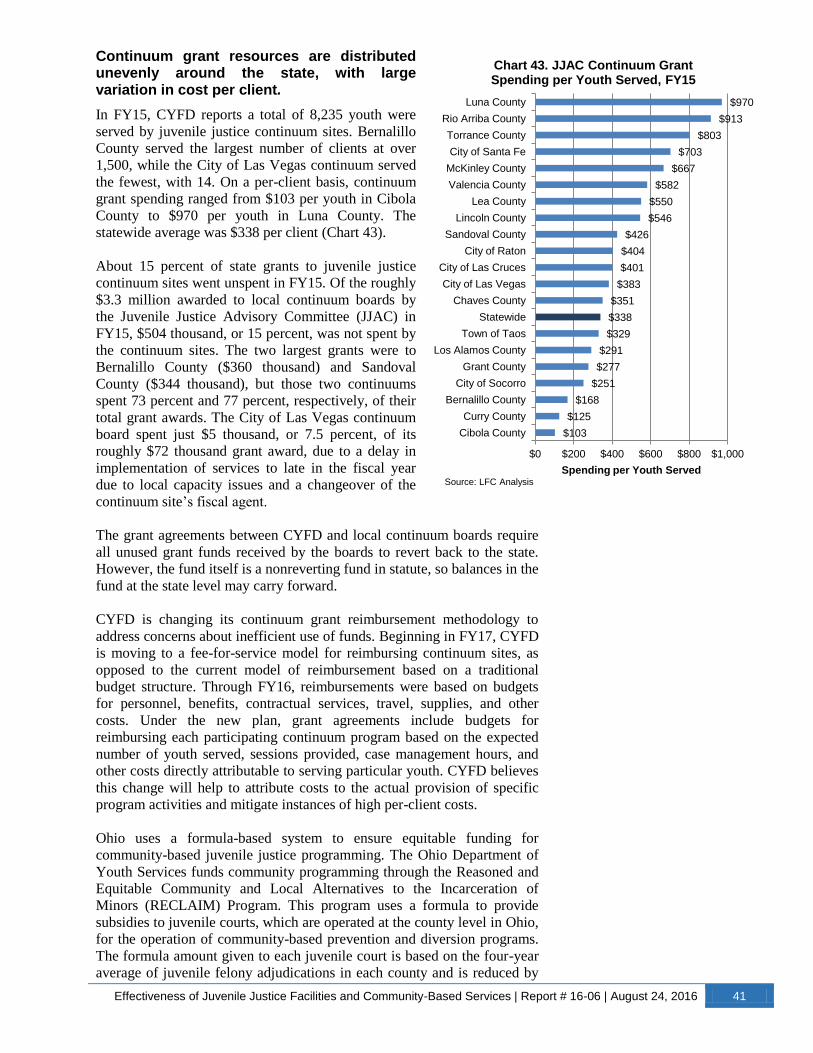
Effectiveness of Juvenile Justice Facilities and Community-Based Services | Report # 16-06 | August 24, 2016 41
Continuum grant resources are distributed unevenly around the state, with large variation in cost per client.
In FY15, CYFD reports a total of 8,235 youth were
served by juvenile justice continuum sites. Bernalillo
County served the largest number of clients at over
1,500, while the City of Las Vegas continuum served
the fewest, with 14. On a per-client basis, continuum
grant spending ranged from $103 per youth in Cibola
County to $970 per youth in Luna County. The
statewide average was $338 per client (Chart 43).
About 15 percent of state grants to juvenile justice
continuum sites went unspent in FY15. Of the roughly
$3.3 million awarded to local continuum boards by
the Juvenile Justice Advisory Committee (JJAC) in
FY15, $504 thousand, or 15 percent, was not spent by
the continuum sites. The two largest grants were to
Bernalillo County ($360 thousand) and Sandoval
County ($344 thousand), but those two continuums
spent 73 percent and 77 percent, respectively, of their
total grant awards. The City of Las Vegas continuum
board spent just $5 thousand, or 7.5 percent, of its
roughly $72 thousand grant award, due to a delay in
implementation of services to late in the fiscal year
due to local capacity issues and a changeover of the
continuum site’s fiscal agent.
The grant agreements between CYFD and local continuum boards require
all unused grant funds received by the boards to revert back to the state.
However, the fund itself is a nonreverting fund in statute, so balances in the
fund at the state level may carry forward.
CYFD is changing its continuum grant reimbursement methodology to
address concerns about inefficient use of funds. Beginning in FY17, CYFD
is moving to a fee-for-service model for reimbursing continuum sites, as
opposed to the current model of reimbursement based on a traditional
budget structure. Through FY16, reimbursements were based on budgets
for personnel, benefits, contractual services, travel, supplies, and other
costs. Under the new plan, grant agreements include budgets for
reimbursing each participating continuum program based on the expected
number of youth served, sessions provided, case management hours, and
other costs directly attributable to serving particular youth. CYFD believes
this change will help to attribute costs to the actual provision of specific
program activities and mitigate instances of high per-client costs.
Ohio uses a formula-based system to ensure equitable funding for
community-based juvenile justice programming. The Ohio Department of
Youth Services funds community programming through the Reasoned and
Equitable Community and Local Alternatives to the Incarceration of
Minors (RECLAIM) Program. This program uses a formula to provide
subsidies to juvenile courts, which are operated at the county level in Ohio,
for the operation of community-based prevention and diversion programs.
The formula amount given to each juvenile court is based on the four-year
average of juvenile felony adjudications in each county and is reduced by
$103
$125
$168
$251
$277
$291
$329
$338
$351
$383
$401
$404
$426
$546
$550
$582
$667
$703
$803
$913
$970
$0 $200 $400 $600 $800 $1,000
Cibola County
Curry County
Bernalillo County
City of Socorro
Grant County
Los Alamos County
Town of Taos
Statewide
Chaves County
City of Las Vegas
City of Las Cruces
City of Raton
Sandoval County
Lincoln County
Lea County
Valencia County
McKinley County
City of Santa Fe
Torrance County
Rio Arriba County
Luna County
Spending per Youth Served
Chart 43. JJAC Continuum Grant Spending per Youth Served, FY15
Source: LFC Analysis
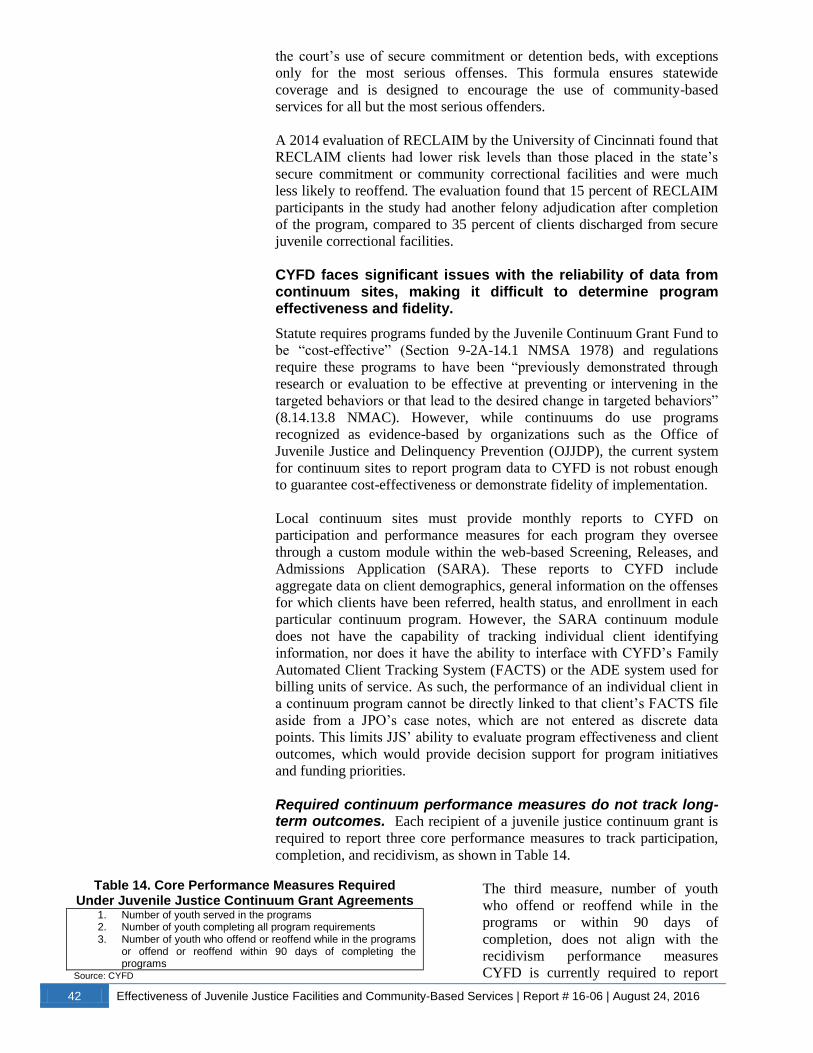
42 Effectiveness of Juvenile Justice Facilities and Community-Based Services | Report # 16-06 | August 24, 2016
the court’s use of secure commitment or detention beds, with exceptions
only for the most serious offenses. This formula ensures statewide
coverage and is designed to encourage the use of community-based
services for all but the most serious offenders.
A 2014 evaluation of RECLAIM by the University of Cincinnati found that
RECLAIM clients had lower risk levels than those placed in the state’s
secure commitment or community correctional facilities and were much
less likely to reoffend. The evaluation found that 15 percent of RECLAIM
participants in the study had another felony adjudication after completion
of the program, compared to 35 percent of clients discharged from secure
juvenile correctional facilities.
CYFD faces significant issues with the reliability of data from continuum sites, making it difficult to determine program effectiveness and fidelity.
Statute requires programs funded by the Juvenile Continuum Grant Fund to
be “cost-effective” (Section 9-2A-14.1 NMSA 1978) and regulations
require these programs to have been “previously demonstrated through
research or evaluation to be effective at preventing or intervening in the
targeted behaviors or that lead to the desired change in targeted behaviors”
(8.14.13.8 NMAC). However, while continuums do use programs
recognized as evidence-based by organizations such as the Office of
Juvenile Justice and Delinquency Prevention (OJJDP), the current system
for continuum sites to report program data to CYFD is not robust enough
to guarantee cost-effectiveness or demonstrate fidelity of implementation.
Local continuum sites must provide monthly reports to CYFD on
participation and performance measures for each program they oversee
through a custom module within the web-based Screening, Releases, and
Admissions Application (SARA). These reports to CYFD include
aggregate data on client demographics, general information on the offenses
for which clients have been referred, health status, and enrollment in each
particular continuum program. However, the SARA continuum module
does not have the capability of tracking individual client identifying
information, nor does it have the ability to interface with CYFD’s Family
Automated Client Tracking System (FACTS) or the ADE system used for
billing units of service. As such, the performance of an individual client in
a continuum program cannot be directly linked to that client’s FACTS file
aside from a JPO’s case notes, which are not entered as discrete data
points. This limits JJS’ ability to evaluate program effectiveness and client
outcomes, which would provide decision support for program initiatives
and funding priorities.
Required continuum performance measures do not track long-term outcomes. Each recipient of a juvenile justice continuum grant is
required to report three core performance measures to track participation,
completion, and recidivism, as shown in Table 14.
The third measure, number of youth
who offend or reoffend while in the
programs or within 90 days of
completion, does not align with the
recidivism performance measures
CYFD is currently required to report
Table 14. Core Performance Measures Required Under Juvenile Justice Continuum Grant Agreements
1. Number of youth served in the programs 2. Number of youth completing all program requirements 3. Number of youth who offend or reoffend while in the programs
or offend or reoffend within 90 days of completing the programs
Source: CYFD
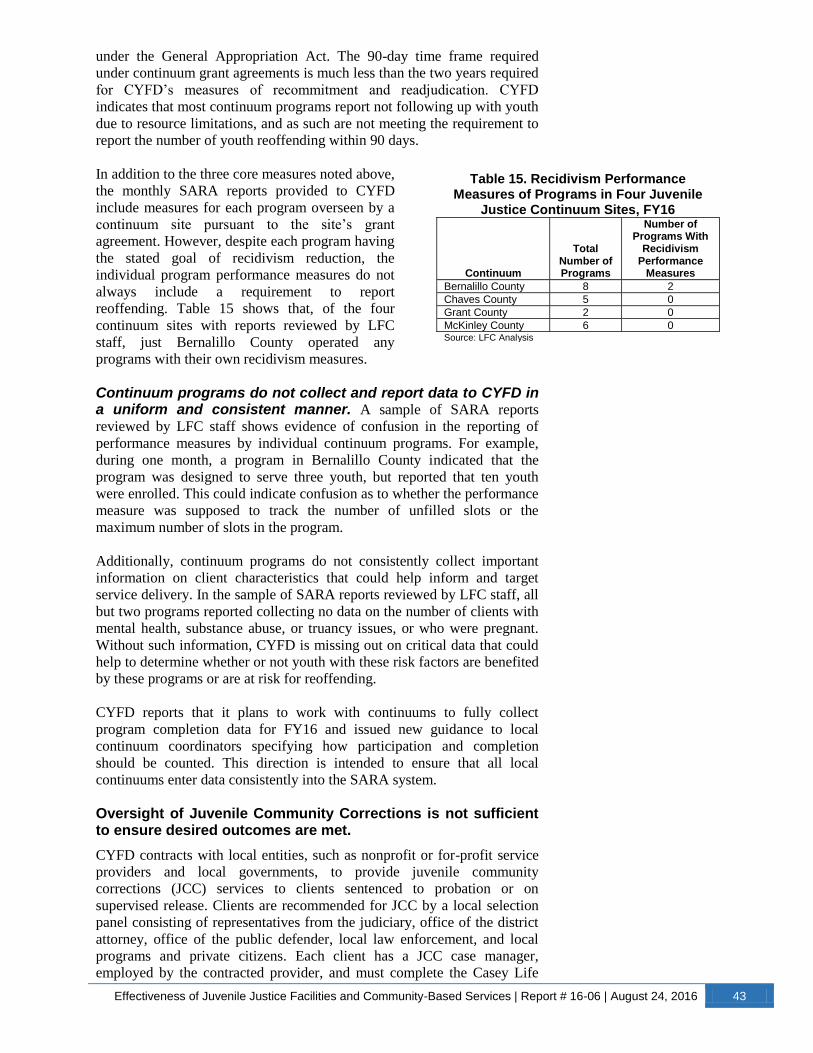
Effectiveness of Juvenile Justice Facilities and Community-Based Services | Report # 16-06 | August 24, 2016 43
under the General Appropriation Act. The 90-day time frame required
under continuum grant agreements is much less than the two years required
for CYFD’s measures of recommitment and readjudication. CYFD
indicates that most continuum programs report not following up with youth
due to resource limitations, and as such are not meeting the requirement to
report the number of youth reoffending within 90 days.
In addition to the three core measures noted above,
the monthly SARA reports provided to CYFD
include measures for each program overseen by a
continuum site pursuant to the site’s grant
agreement. However, despite each program having
the stated goal of recidivism reduction, the
individual program performance measures do not
always include a requirement to report
reoffending. Table 15 shows that, of the four
continuum sites with reports reviewed by LFC
staff, just Bernalillo County operated any
programs with their own recidivism measures.
Continuum programs do not collect and report data to CYFD in a uniform and consistent manner. A sample of SARA reports
reviewed by LFC staff shows evidence of confusion in the reporting of
performance measures by individual continuum programs. For example,
during one month, a program in Bernalillo County indicated that the
program was designed to serve three youth, but reported that ten youth
were enrolled. This could indicate confusion as to whether the performance
measure was supposed to track the number of unfilled slots or the
maximum number of slots in the program.
Additionally, continuum programs do not consistently collect important
information on client characteristics that could help inform and target
service delivery. In the sample of SARA reports reviewed by LFC staff, all
but two programs reported collecting no data on the number of clients with
mental health, substance abuse, or truancy issues, or who were pregnant.
Without such information, CYFD is missing out on critical data that could
help to determine whether or not youth with these risk factors are benefited
by these programs or are at risk for reoffending.
CYFD reports that it plans to work with continuums to fully collect
program completion data for FY16 and issued new guidance to local
continuum coordinators specifying how participation and completion
should be counted. This direction is intended to ensure that all local
continuums enter data consistently into the SARA system.
Oversight of Juvenile Community Corrections is not sufficient to ensure desired outcomes are met.
CYFD contracts with local entities, such as nonprofit or for-profit service
providers and local governments, to provide juvenile community
corrections (JCC) services to clients sentenced to probation or on
supervised release. Clients are recommended for JCC by a local selection
panel consisting of representatives from the judiciary, office of the district
attorney, office of the public defender, local law enforcement, and local
programs and private citizens. Each client has a JCC case manager,
employed by the contracted provider, and must complete the Casey Life
Table 15. Recidivism Performance Measures of Programs in Four Juvenile
Justice Continuum Sites, FY16
Continuum
Total Number of Programs
Number of Programs With
Recidivism Performance
Measures
Bernalillo County 8 2
Chaves County 5 0
Grant County 2 0
McKinley County 6 0 Source: LFC Analysis

44 Effectiveness of Juvenile Justice Facilities and Community-Based Services | Report # 16-06 | August 24, 2016
Skills Assessment and a client service plan specifying the services to be
received and the client’s specific goals for each. Components under which
a client can specify goals for the service plan include case management,
community services, education, facility
transitional services, family support services,
financial assistance, innovative services (defined
in the JCC Program Manual as including such
programs as gender-based programming or gang
intervention), job preparation, life skills, and
transportation.
JCC spending has decreased 28 percent between
FY11 and FY15, from $2.9 million to $2.1
million (Chart 46). The vast majority of this
total, about 98 percent in FY15, is in the
contractual services category, which includes
payments to JCC providers. One CYFD
employee serves as the program manager.
Fewer than half of clients discharged from Juvenile Community Corrections since FY13 have successfully completed the program. Between FY13 and FY15, there were about 1,900 total referrals
to JCC, and providers discharged just under 1,200 clients. Of that total, just
46 percent, or 543 clients, were considered successful discharges. Nineteen
percent, or 223 clients, were discharged
unsuccessfully, and 36 percent, or 426
clients, were discharged administratively
(Chart 45).
While the number of successful
discharges increased by 27 percent from
FY13 to FY15, from 163 to 207 clients,
the number of clients discharged without
successfully completing the program
jumped from 66 to 91 in FY15, an
increase of 38 percent. Unsuccessful
discharges made up 21 percent of
discharges in FY15, compared to 17
percent in FY14 and 18 percent in FY13.
JCC discharge criteria may lead to undercounting clients who do not successfully complete program goals or requirements. Clients participating in Juvenile Community Corrections may be
discharged successfully, unsuccessfully, or administratively. The JCC
Program Manual lays out guidelines for how JCC providers are to
determine each type of discharge. The criteria for administrative discharge
from JCC includes a client’s term of probation or supervised release
expiring before the client can successfully complete his or her service plan
goals. In these cases, under the current criteria, a client would not have
successfully completed the JCC program, nor would he or she be
considered to have been unsuccessful, despite not having achieved the
goals set out in the client’s service plan at the time of discharge.
Providers do not report the reasons for administrative discharges in their
quarterly or annual reports to CYFD. The forms for these reports only
$-
$500
$1,000
$1,500
$2,000
$2,500
$3,000
$3,500
FY11 FY12 FY13 FY14 FY15
$ in
Th
ou
san
ds
Chart 44. JCC Expenditures, FY11-FY15
Source: SHARE
Successful, 46%
Unsuccessful, 19%
Administrative, 36%
Chart 45. JCC Discharges by Type, FY13-FY15 (N=1,192)
Source: CYFD, LFC Analysis
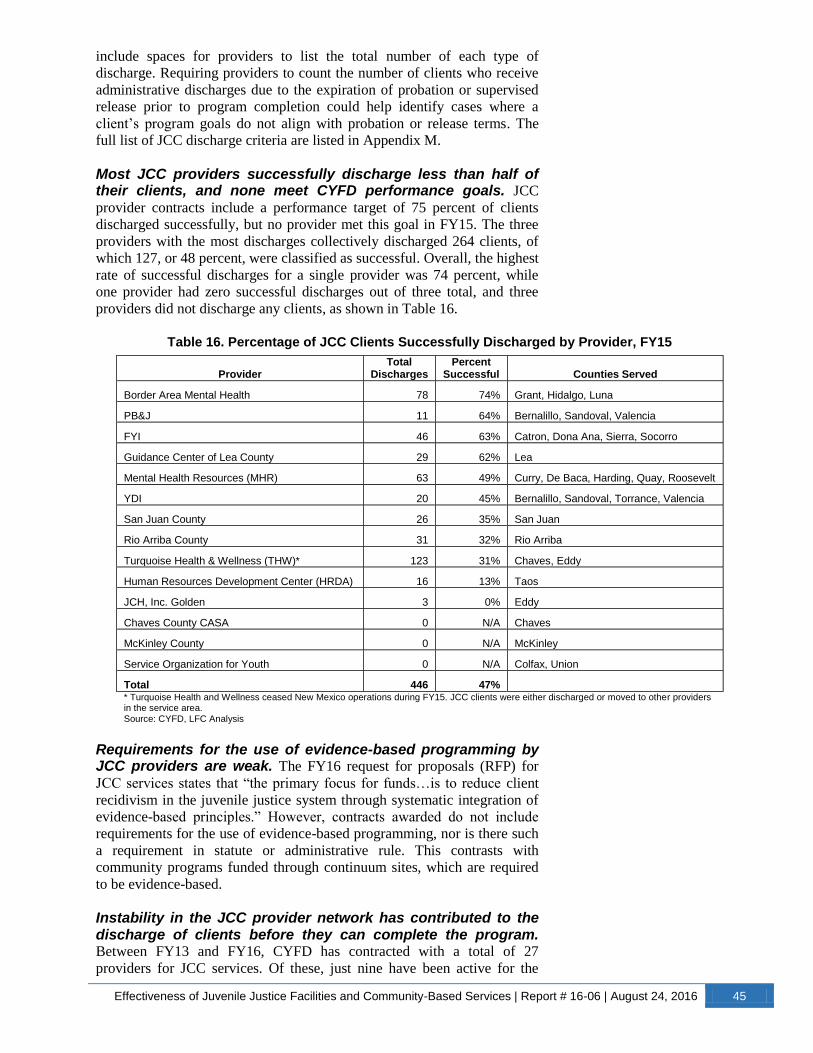
Effectiveness of Juvenile Justice Facilities and Community-Based Services | Report # 16-06 | August 24, 2016 45
include spaces for providers to list the total number of each type of
discharge. Requiring providers to count the number of clients who receive
administrative discharges due to the expiration of probation or supervised
release prior to program completion could help identify cases where a
client’s program goals do not align with probation or release terms. The
full list of JCC discharge criteria are listed in Appendix M.
Most JCC providers successfully discharge less than half of their clients, and none meet CYFD performance goals. JCC
provider contracts include a performance target of 75 percent of clients
discharged successfully, but no provider met this goal in FY15. The three
providers with the most discharges collectively discharged 264 clients, of
which 127, or 48 percent, were classified as successful. Overall, the highest
rate of successful discharges for a single provider was 74 percent, while
one provider had zero successful discharges out of three total, and three
providers did not discharge any clients, as shown in Table 16.
Requirements for the use of evidence-based programming by JCC providers are weak. The FY16 request for proposals (RFP) for
JCC services states that “the primary focus for funds…is to reduce client
recidivism in the juvenile justice system through systematic integration of
evidence-based principles.” However, contracts awarded do not include
requirements for the use of evidence-based programming, nor is there such
a requirement in statute or administrative rule. This contrasts with
community programs funded through continuum sites, which are required
to be evidence-based.
Instability in the JCC provider network has contributed to the discharge of clients before they can complete the program. Between FY13 and FY16, CYFD has contracted with a total of 27
providers for JCC services. Of these, just nine have been active for the
Table 16. Percentage of JCC Clients Successfully Discharged by Provider, FY15
Provider Total
Discharges Percent
Successful Counties Served
Border Area Mental Health 78 74% Grant, Hidalgo, Luna
PB&J 11 64% Bernalillo, Sandoval, Valencia
FYI 46 63% Catron, Dona Ana, Sierra, Socorro
Guidance Center of Lea County 29 62% Lea
Mental Health Resources (MHR) 63 49% Curry, De Baca, Harding, Quay, Roosevelt
YDI 20 45% Bernalillo, Sandoval, Torrance, Valencia
San Juan County 26 35% San Juan
Rio Arriba County 31 32% Rio Arriba
Turquoise Health & Wellness (THW)* 123 31% Chaves, Eddy
Human Resources Development Center (HRDA) 16 13% Taos
JCH, Inc. Golden 3 0% Eddy
Chaves County CASA 0 N/A Chaves
McKinley County 0 N/A McKinley
Service Organization for Youth 0 N/A Colfax, Union
Total 446 47% * Turquoise Health and Wellness ceased New Mexico operations during FY15. JCC clients were either discharged or moved to other providers
in the service area. Source: CYFD, LFC Analysis
46 Effectiveness of Juvenile Justice Facilities and Community-Based Services | Report # 16-06 | August 24, 2016
entire period. A number of JCC providers were also behavioral health
providers that closed or left the state during that period, contributing to
turnover in the provider pool. In some cases, such as in Chaves and Eddy
counties, a departing provider was immediately replaced with a new
provider, ensuring some continuity for clients. However, in other areas
where providers left and there was no replacement, clients were discharged
administratively.
In FY16, the JCC provider network has expanded in geographical reach
over the previous year. Currently, there are 18 providers serving 30 of 33
counties, up from 14 providers serving 26 counties in FY15. The only
counties not served by JCC in FY16 are Guadalupe, Mora, and San
Miguel.
Recommendations
CYFD should:
Consider cost-per-client calculations as a factor in continuum grant
applications and awards;
Align the recidivism performance measure for continuum grant recipients
to be consistent with CYFD’s existing performance measures for tracking
recidivism within two years rather than 90 days;
Continue development of information systems to facilitate tracking of
participation, risk, needs, outcomes, and recidivism of individual youth in
continuum programs;
Work with LFC and DFA staff to create a common set of AGA
performance measures for continuum sites and juvenile community
corrections to allow for the tracking of youth success in these community-
based interventions;
Continue working to expand JDAI statewide, incorporating new and
existing continuum sites;
Reclassify JCC administrative discharges due to expiration of a probation
or supervised release term as unsuccessful or create a new type of
discharge to reflect those clients who are unable to complete JCC before
expiration;
Require JCC providers to report the reasons for administrative discharges
in quarterly and annual reports to the Department;
Strengthen requirements for evidence-based programming in JCC contracts
and consider promulgating rules containing requirements similar to those
for continuum programs; and
Increase the emphasis on provider performance, including rates of
successful JCC completion, when soliciting, extending, and renewing JCC
provider contracts.

Effectiveness of Juvenile Justice Facilities and Community-Based Services | Report # 16-06 | August 24, 2016 47
Multisystemic Therapy Provides Effective Treatment for its Target Population, but Issues with Access Have Impacted Outcomes
Multisystemic Therapy is an evidence-based treatment used in New Mexico with a proven track record in reducing recidivism and improving outcomes for juveniles.
Multisystemic Therapy (MST) is an intensive treatment model focusing on
youth with serious antisocial behaviors by involving stakeholders including
their families, schools, peers, and other members of the community. MST
is typically provided in a client’s home, school, or other locations within
the community, using the client’s family, peer, school, neighborhood, and
other support networks to facilitate positive behavioral change. JJS clients
who enroll in MST are typically on probation or supervised release.
The number of MST clients served declined in recent years due to provider availability. MST is almost completely funded through
Medicaid, however the proportion of MST spending from other funding
sources increased in 2014 and 2015, including federal behavioral health
block grant funds and state general fund for those not eligible for
Medicaid, as noted in Chart 46. However, no state general fund dollars
were used for MST in FY16.
A 2015 LFC evaluation of Centennial Care found both spending and
utilization of MST through Medicaid declined in conjunction with the
suspension of 15 behavioral health providers in 2013. Moreover, while
MST spending through Medicaid rebounded back to 2013 levels in 2015,
clients served declined further to 869, a 39 percent decrease from 2013
(Chart 47). This has resulted in a higher cost per client, increasing 50
percent from about $4,700 in CY13 to just over $7 thousand in CY15
(Table 17). A 2001 Washington State Institute of Public Policy (WSIPP)
report found MST returned between $12.40 and $28.33 for every dollar
invested at a cost of about $4,700 per client. When adjusted for inflation,
this equates to roughly $6,300 in 2015 dollars.
While various MST service providers operate in New Mexico, half of the state’s counties do not have access to this evidence-based program. As of 2015, six organizations in the state
provided either traditional MST or MST targeted for problem sexual
behavior (MST-PSB), as noted in Appendix N. Of note, La Clinica de
Familia and Mental Health Resources started providing MST services in
2015, and Southwest Family Guidance Center expanded services into Doña
Ana County.
$5,600
$5,800
$6,000
$6,200
$6,400
$6,600
$6,800
$7,000
$7,200
2013 2014 2015
Chart 46. MST Spending by Source
2013-2015 (in thousands)
Medicaid
Federal Block Grant
State General Fund
Note: Medicaid spending based on a calendar year and other sources based on state fiscal year. Source: HSD & CYFD
1,421
986
869
0
200
400
600
800
1,000
1,200
1,400
1,600
$0
$1
$2
$3
$4
$5
$6
$7
$8
CY13 CY14 CY15
Un
iqu
e C
lien
ts S
erv
ed
To
tal S
pe
nt
(in
mll
ion
s)
Chart 47. Multisystemic Therapy Total Spent and Clients Served Through Medicaid,
Ages 0-20
Total Spent
Unique Members Served
Source: HSD via OptumHealth CI-09 and Centennial Care MCOs
Table 17. MST Cost per Client, CY13-CY15
CY13 CY14 CY15
NM Cost Per Client $4,695 $6,301 $7,024
WSIPP Cost per Client $7,569 $7,692 $7,701
Note: WSIPP cost per client based on costs to implement MST in WA.
Source: LFC Analysis of HSD Data, WSIPP
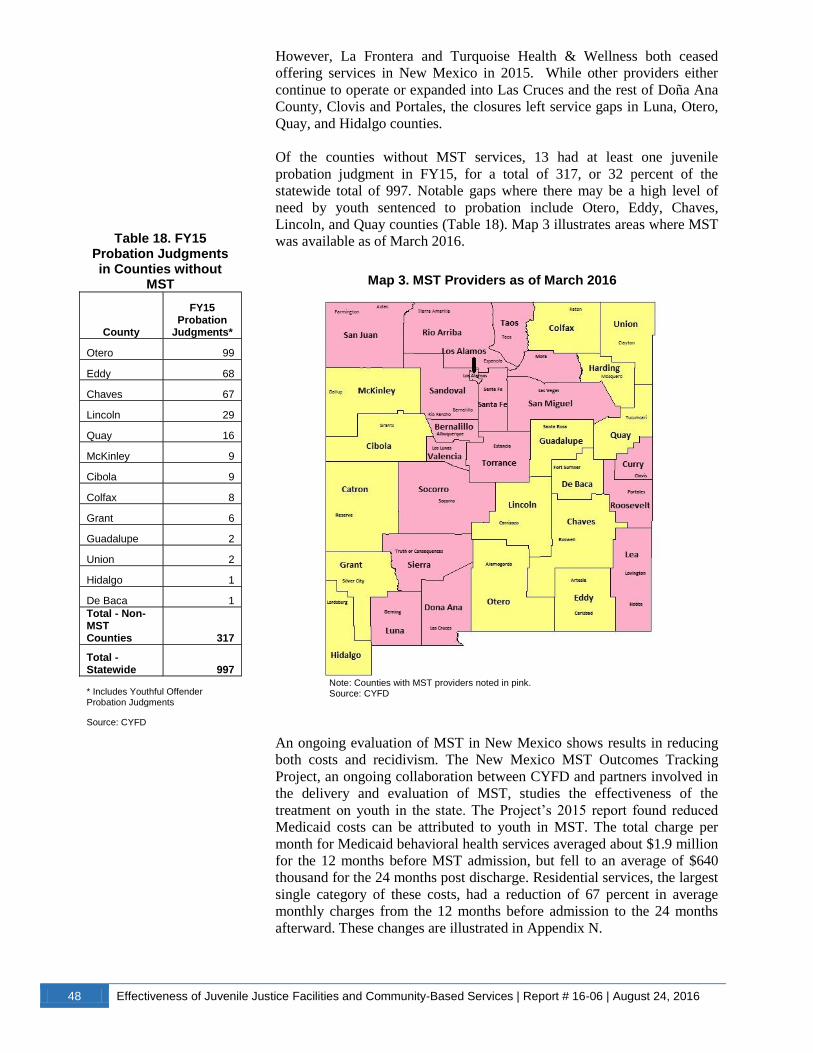
48 Effectiveness of Juvenile Justice Facilities and Community-Based Services | Report # 16-06 | August 24, 2016
However, La Frontera and Turquoise Health & Wellness both ceased
offering services in New Mexico in 2015. While other providers either
continue to operate or expanded into Las Cruces and the rest of Doña Ana
County, Clovis and Portales, the closures left service gaps in Luna, Otero,
Quay, and Hidalgo counties.
Of the counties without MST services, 13 had at least one juvenile
probation judgment in FY15, for a total of 317, or 32 percent of the
statewide total of 997. Notable gaps where there may be a high level of
need by youth sentenced to probation include Otero, Eddy, Chaves,
Lincoln, and Quay counties (Table 18). Map 3 illustrates areas where MST
was available as of March 2016.
An ongoing evaluation of MST in New Mexico shows results in reducing
both costs and recidivism. The New Mexico MST Outcomes Tracking
Project, an ongoing collaboration between CYFD and partners involved in
the delivery and evaluation of MST, studies the effectiveness of the
treatment on youth in the state. The Project’s 2015 report found reduced
Medicaid costs can be attributed to youth in MST. The total charge per
month for Medicaid behavioral health services averaged about $1.9 million
for the 12 months before MST admission, but fell to an average of $640
thousand for the 24 months post discharge. Residential services, the largest
single category of these costs, had a reduction of 67 percent in average
monthly charges from the 12 months before admission to the 24 months
afterward. These changes are illustrated in Appendix N.
Map 3. MST Providers as of March 2016
Note: Counties with MST providers noted in pink. Source: CYFD
Table 18. FY15 Probation Judgments in Counties without
MST
County
FY15 Probation
Judgments*
Otero 99
Eddy 68
Chaves 67
Lincoln 29
Quay 16
McKinley 9
Cibola 9
Colfax 8
Grant 6
Guadalupe 2
Union 2
Hidalgo 1
De Baca 1
Total - Non-MST Counties 317
Total - Statewide 997
* Includes Youthful Offender Probation Judgments
Source: CYFD

Effectiveness of Juvenile Justice Facilities and Community-Based Services | Report # 16-06 | August 24, 2016 49
Additionally, the Project’s analysis of
roughly 2,900 youth who completed
MST through June 2015 found youth
who completed MST had a 76 percent
likelihood of not having charges filed
by the District Attorney during the 12
months following discharge, and a 66
percent likelihood of no charges within
24 months.
Table 19 shows other outcomes
reported by the Project, including
reduced arrests, reduced mental health
problems, reduced substance abuse
problems, and greater educational or
work participation.
While New Mexico has experienced positive gains from Multisystemic Therapy, progress diminished in recent years in various areas including re-arrests and out-of-home placement.
The MST Institute releases annual data on various performance measures
in areas including client outcomes, adherence to the model (fidelity), and
length of and successful completion of treatment. LFC staff reviewed a
selection of these measures with New Mexico and national results as noted
in Appendix N.
New Mexico performed well in various measures in 2012 including percent
of youth completing treatment and percent of youth with no new arrests.
However, while gains continued through 2015 nationally in both of these
measures, New Mexico showed declines as noted in Charts 48 and 49.
These measures declined around the same time instability in the behavioral
health system occurred with the suspension of various providers.
However, it appears progress is being made in both measures in 2014.
When looking for specifically at Hispanic youth receiving MST, 85 percent
in New Mexico completed treatment when compared to 84 percent
nationally. For 2014, Eighty-four percent of Hispanic MST youth had no
84.9%
81.3%
85.0% 84.4%
85.0%
85.5%
79%
80%
81%
82%
83%
84%
85%
86%
2012 2013 2014
Chart 48. Percent of Youth Completing MST Treatment
2012-2014
NM US
Source: MST Institute
86.3%
83.5%
84.3%
85.1%
85.6%
86.9%
81%
82%
83%
84%
85%
86%
87%
88%
2012 2013 2014
Chart 49. Percent of Youth Who Completed MST with No New Arrests,
2012-2014
NM US
Source: MST Institute
Table 19. Selected Outcomes for Youth Who Completed
MST Between July 2005 and June 2015
Measure
Result at MST
Admission
Result 12 Months After
MST Completion
Average number of different crimes for which youth was arrested 1.1 0.2
Average number of mental health problems 2.9 1.6
Average number of substance abuse problems 0.7 0.1
Percent of youth who were enrolled in an educational program and were passing most classes or were working 20+ hours per week 40% 74% Source: New Mexico MST Outcomes Tracking Project

50 Effectiveness of Juvenile Justice Facilities and Community-Based Services | Report # 16-06 | August 24, 2016
new arrests, whereas nationally 85 percent of Hispanic MST youth
experienced no new arrests during the follow-up period.
When looking at youth placed during treatment, New Mexico performed
below the national average, with out-of-home placements increasing 21
percent between 2012 and 2014. Nationally, placements declined 11
percent over the same time period. Percent of cases closed due to lack of
engagement were well above the national average in 2012, but this measure
has shown substantial improvement over the two most recent data
collection years. When looking specifically at Hispanic MST participants
for both of these measures for 2014, New Mexico Hispanic participants
performed within one percentage point of this same population nationally.
In the case of education or employment, New Mexico performed below the
national average between 2012 and 2014, but improved 2 percentage points
over this timeframe (Chart 52). When controlling for ethnicity, White
Non-Hispanic MST participants lagged national benchmarks by almost five
percent. Conversely, Hispanic MST participants in New Mexico
outperformed by one percent on this performance measure when compared
to national results in 2014.
The New Mexico MST Tracking Project does not
currently report state-specific results for the above
benchmarks, which does not afford for comparison with
other MST states or national results on a regular basis.
Pennsylvania released an analysis of its MST results for
FY12-FY14, which did include data that could be
compared to national benchmarks. Instead, New
Mexico’s 2014 and 2015 MST evaluation reports
measured success as a rate of arrests, court events, and
mental health or substance abuse problems. While this
can be useful information, the New Mexico data does
not provide a context for the rates reported. For
example, the number of different crimes metric does
not shed light on the recidivism rate for MST
participants in New Mexico. Also, problems, as
referenced in the measures for mental health and
substance abuse, are not defined in the report.
7.0%
11.6%
8.5%
10.0% 10.0% 8.9%
0%
2%
4%
6%
8%
10%
12%
14%
2012 2013 2014
Chart 50. Percent of Youth Placed During MST Treatment
2012-2014
NM US Source: MST Institute
8.1% 7.2%
6.5%
5.5% 5.1%
5.6%
0%
1%
2%
3%
4%
5%
6%
7%
8%
9%
2012 2013 2014
Chart 51. Percent of MST Cases Closed Due to Lack of Engagement
2012-2014
NM US Source: MST Institute
83.8% 83.7%
86.0% 86.0% 86.2%
87.8%
81%
82%
83%
84%
85%
86%
87%
88%
89%
2012 2013 2014
Chart 52. Percent of Youth in School and/or Working After MST Completion,
2012-2014
NM US Source: MST Institute
Effectiveness of Juvenile Justice Facilities and Community-Based Services | Report # 16-06 | August 24, 2016 51
New Mexico should continue to invest in Multisystemic Therapy, as it is proven to reduce recidivism and improve functionality, especially among Hispanic youth participants. A
2014 RAND study looked at Los Angeles County youth probationers
participating in MST with a large sample of MST participants (757), where
77 percent of the sample was Hispanic. For comparison, 66 percent of
juvenile probation clients receiving MST services in New Mexico between
2005 and 2015 identified as Hispanic. Both overall and within the
Hispanic population of MST participants, researchers found significantly
lower arrest and incarceration rates for the MST recipients. Moreover,
MST participants showed significant improvement in areas such as family
relations, educational and vocational success, and involvement with
beneficial peers.
Recommendations
CYFD should:
Work with HSD to identify providers, build MST teams in high-risk areas,
and collaborate on tracking referrals, utilization, and spending as part of a
strategy to prioritize evidence-based behavioral health services; and
In collaboration with the MST Tracking Project, expand the data reported
annually on outcomes to include key performance measures tracked by the
MST Institute, comparing New Mexico results to national benchmarks.
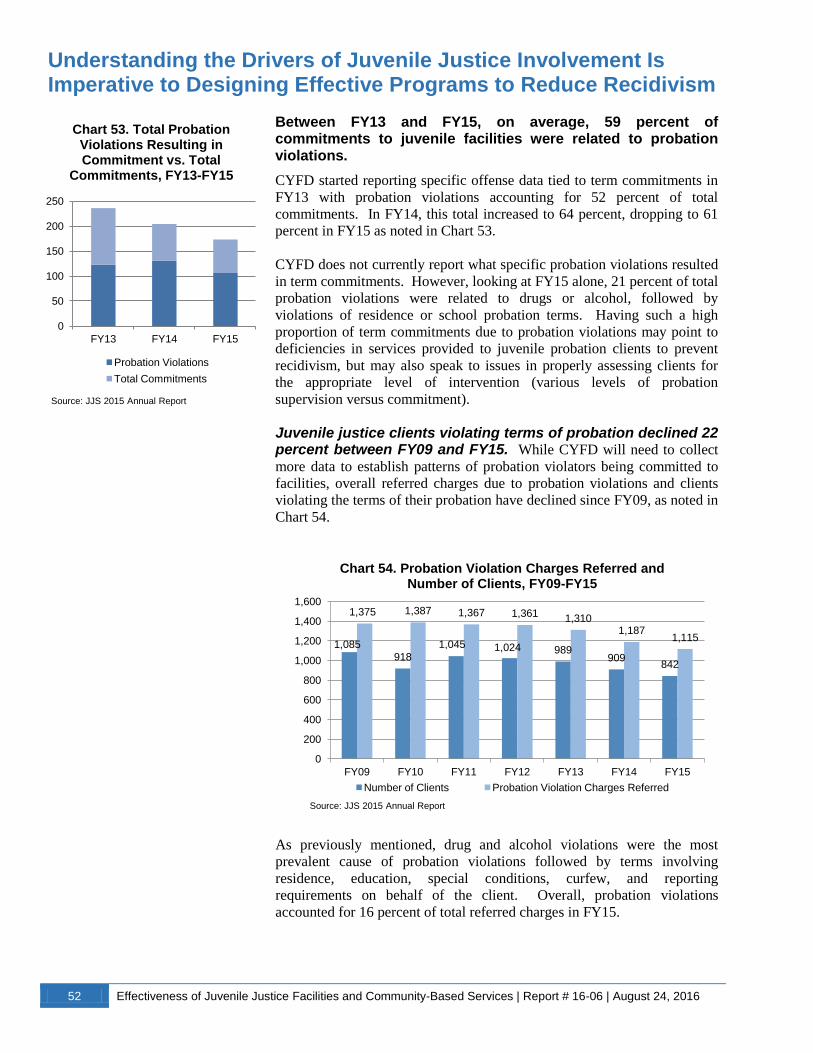
52 Effectiveness of Juvenile Justice Facilities and Community-Based Services | Report # 16-06 | August 24, 2016
Understanding the Drivers of Juvenile Justice Involvement Is Imperative to Designing Effective Programs to Reduce Recidivism
Between FY13 and FY15, on average, 59 percent of commitments to juvenile facilities were related to probation violations.
CYFD started reporting specific offense data tied to term commitments in
FY13 with probation violations accounting for 52 percent of total
commitments. In FY14, this total increased to 64 percent, dropping to 61
percent in FY15 as noted in Chart 53.
CYFD does not currently report what specific probation violations resulted
in term commitments. However, looking at FY15 alone, 21 percent of total
probation violations were related to drugs or alcohol, followed by
violations of residence or school probation terms. Having such a high
proportion of term commitments due to probation violations may point to
deficiencies in services provided to juvenile probation clients to prevent
recidivism, but may also speak to issues in properly assessing clients for
the appropriate level of intervention (various levels of probation
supervision versus commitment).
Juvenile justice clients violating terms of probation declined 22 percent between FY09 and FY15. While CYFD will need to collect
more data to establish patterns of probation violators being committed to
facilities, overall referred charges due to probation violations and clients
violating the terms of their probation have declined since FY09, as noted in
Chart 54.
As previously mentioned, drug and alcohol violations were the most
prevalent cause of probation violations followed by terms involving
residence, education, special conditions, curfew, and reporting
requirements on behalf of the client. Overall, probation violations
accounted for 16 percent of total referred charges in FY15.
0
50
100
150
200
250
FY13 FY14 FY15
Chart 53. Total Probation Violations Resulting in Commitment vs. Total
Commitments, FY13-FY15
Probation Violations
Total Commitments
Source: JJS 2015 Annual Report
1,085 918
1,045 1,024 989 909
842
1,375 1,387 1,367 1,361 1,310
1,187 1,115
0
200
400
600
800
1,000
1,200
1,400
1,600
FY09 FY10 FY11 FY12 FY13 FY14 FY15
Chart 54. Probation Violation Charges Referred and Number of Clients, FY09-FY15
Number of Clients Probation Violation Charges Referred
Source: JJS 2015 Annual Report
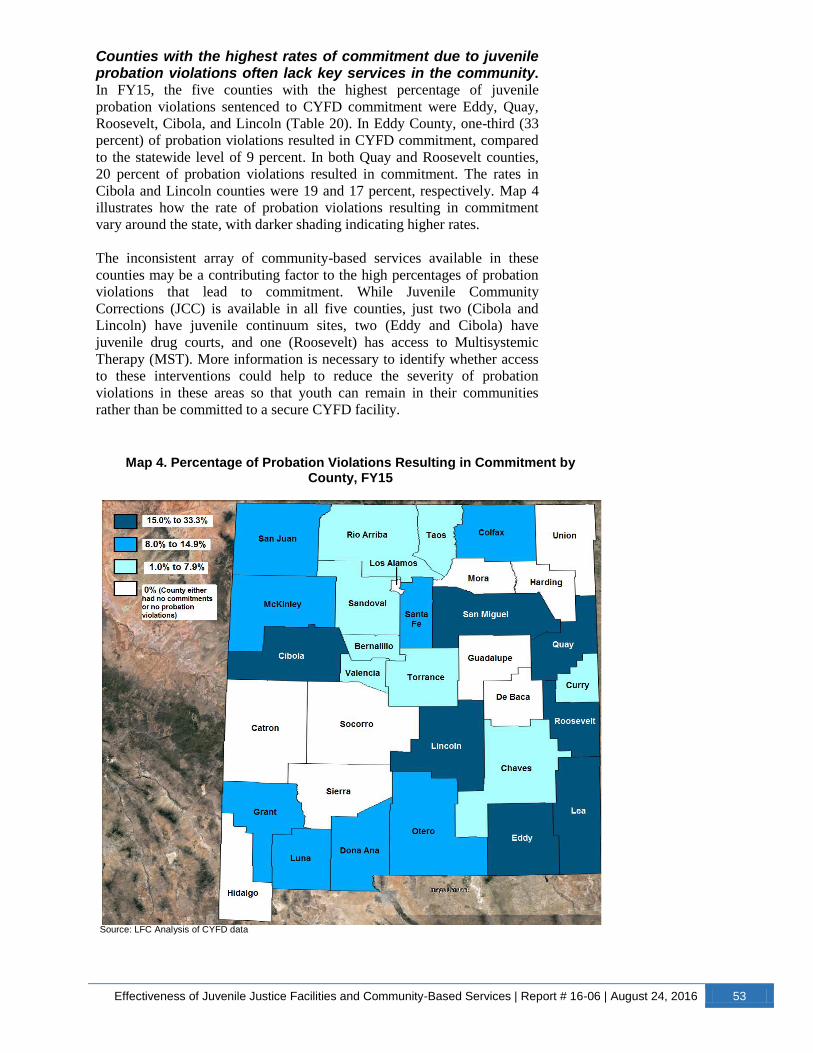
Effectiveness of Juvenile Justice Facilities and Community-Based Services | Report # 16-06 | August 24, 2016 53
Counties with the highest rates of commitment due to juvenile probation violations often lack key services in the community. In FY15, the five counties with the highest percentage of juvenile
probation violations sentenced to CYFD commitment were Eddy, Quay,
Roosevelt, Cibola, and Lincoln (Table 20). In Eddy County, one-third (33
percent) of probation violations resulted in CYFD commitment, compared
to the statewide level of 9 percent. In both Quay and Roosevelt counties,
20 percent of probation violations resulted in commitment. The rates in
Cibola and Lincoln counties were 19 and 17 percent, respectively. Map 4
illustrates how the rate of probation violations resulting in commitment
vary around the state, with darker shading indicating higher rates.
The inconsistent array of community-based services available in these
counties may be a contributing factor to the high percentages of probation
violations that lead to commitment. While Juvenile Community
Corrections (JCC) is available in all five counties, just two (Cibola and
Lincoln) have juvenile continuum sites, two (Eddy and Cibola) have
juvenile drug courts, and one (Roosevelt) has access to Multisystemic
Therapy (MST). More information is necessary to identify whether access
to these interventions could help to reduce the severity of probation
violations in these areas so that youth can remain in their communities
rather than be committed to a secure CYFD facility.
Map 4. Percentage of Probation Violations Resulting in Commitment by County, FY15
Source: LFC Analysis of CYFD data
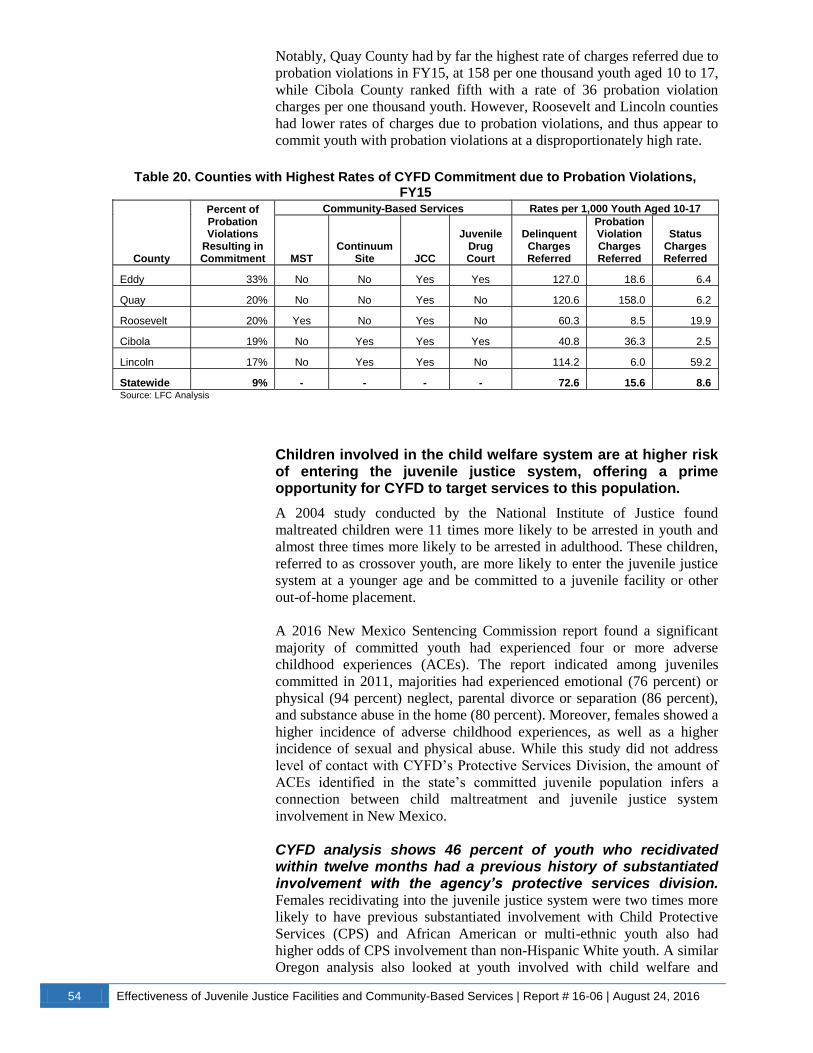
54 Effectiveness of Juvenile Justice Facilities and Community-Based Services | Report # 16-06 | August 24, 2016
Notably, Quay County had by far the highest rate of charges referred due to
probation violations in FY15, at 158 per one thousand youth aged 10 to 17,
while Cibola County ranked fifth with a rate of 36 probation violation
charges per one thousand youth. However, Roosevelt and Lincoln counties
had lower rates of charges due to probation violations, and thus appear to
commit youth with probation violations at a disproportionately high rate.
Children involved in the child welfare system are at higher risk of entering the juvenile justice system, offering a prime opportunity for CYFD to target services to this population.
A 2004 study conducted by the National Institute of Justice found
maltreated children were 11 times more likely to be arrested in youth and
almost three times more likely to be arrested in adulthood. These children,
referred to as crossover youth, are more likely to enter the juvenile justice
system at a younger age and be committed to a juvenile facility or other
out-of-home placement.
A 2016 New Mexico Sentencing Commission report found a significant
majority of committed youth had experienced four or more adverse
childhood experiences (ACEs). The report indicated among juveniles
committed in 2011, majorities had experienced emotional (76 percent) or
physical (94 percent) neglect, parental divorce or separation (86 percent),
and substance abuse in the home (80 percent). Moreover, females showed a
higher incidence of adverse childhood experiences, as well as a higher
incidence of sexual and physical abuse. While this study did not address
level of contact with CYFD’s Protective Services Division, the amount of
ACEs identified in the state’s committed juvenile population infers a
connection between child maltreatment and juvenile justice system
involvement in New Mexico.
CYFD analysis shows 46 percent of youth who recidivated within twelve months had a previous history of substantiated involvement with the agency’s protective services division. Females recidivating into the juvenile justice system were two times more
likely to have previous substantiated involvement with Child Protective
Services (CPS) and African American or multi-ethnic youth also had
higher odds of CPS involvement than non-Hispanic White youth. A similar
Oregon analysis also looked at youth involved with child welfare and
Table 20. Counties with Highest Rates of CYFD Commitment due to Probation Violations, FY15
County
Percent of Probation Violations
Resulting in Commitment
Community-Based Services Rates per 1,000 Youth Aged 10-17
MST Continuum
Site JCC
Juvenile Drug Court
DelinquentCharges Referred
Probation Violation Charges Referred
Status Charges Referred
Eddy 33% No No Yes Yes 127.0 18.6 6.4
Quay 20% No No Yes No 120.6 158.0 6.2
Roosevelt 20% Yes No Yes No 60.3 8.5 19.9
Cibola 19% No Yes Yes Yes 40.8 36.3 2.5
Lincoln 17% No Yes Yes No 114.2 6.0 59.2
Statewide 9% - - - - 72.6 15.6 8.6 Source: LFC Analysis

Effectiveness of Juvenile Justice Facilities and Community-Based Services | Report # 16-06 | August 24, 2016 55
juvenile justice simultaneously, finding these children enter the juvenile
justice system two years earlier, with 92 percent having juvenile justice
contact before age 16. Dually-involved youth also had higher proportions
of assault allegations and dispositions resulting in loss of liberty.
Los Angeles County is piloting targeted interventions for child welfare-
involved youth with high risk of future delinquency with positive early
results. In collaboration with the National Council on Crime &
Delinquency, the county developed an assessment tool to identify youth
involved with the child welfare system at higher risk for future juvenile
justice involvement then targeting this population for services. Preliminary
pilot results show for a cohort of participants tracked for six months, none
had been arrested and 92 percent were still receiving services after the first
six months. Of the thirty-two percent identified as having a history with
substance abuse, two-thirds were substance-free at the six-month mark.
CYFD is uniquely positioned to work with crossover youth to reduce their involvement with the juvenile justice system, but faces limitations in effectively working with these youth.
In their analysis of crossover youth, states such as Oregon have expressed
concern around the challenge of unifying efforts of child welfare and
juvenile justice agencies which operate independent of each other. Yet with
both Protective Services and Juvenile Justice Services housed at CYFD,
the agency is well positioned to work with youth either at greater risk for
juvenile justice involvement or concurrently involved in both systems.
However, limitations of the FACTS system and a lack of clear policies and
procedures for cross-divisional interaction hinder this collaboration.
FACTS does not permit easy tracking of clients between Juvenile Justice
and Child Protective Services on an aggregate level. While juvenile
probation officers and other users of the FACTS system are able to search
for individual clients involved CPS, there is not currently a way for the
system to generate a “canned” report showing all clients who are
simultaneously involved with both JJS and CPS. At this time, CYFD uses
the National Child Abuse and Neglect Data System (NCANDS) to analyze
Child Protective Services data, manually matching this information to JJS
records in FACTS. While the Department uses FACTS to generate the data
furnished to NCANDS, the data must be extensively cleaned and is not
readily usable. The ability to regularly monitor the crossover youth
population would assist CYFD in better tailoring services to prevent future
delinquency and reduce recidivism in this population.
Between FY07 and FY15, over 80 percent of juvenile justice clients in facilities were assessed as high risk and high or moderate need through CYFD’s risk and needs assessment tool.
CYFD uses the Structured Decision Making risk and needs assessment to
identify areas of concern related to a client’s offense history, education,
family relationships, and emotional stability, for example. This results in a
combined risk and needs score. The vast majority of clients assessed
between FY07 and FY15 received a score of either high risk/high need or
high risk/moderate need, as shown in Chart 55.
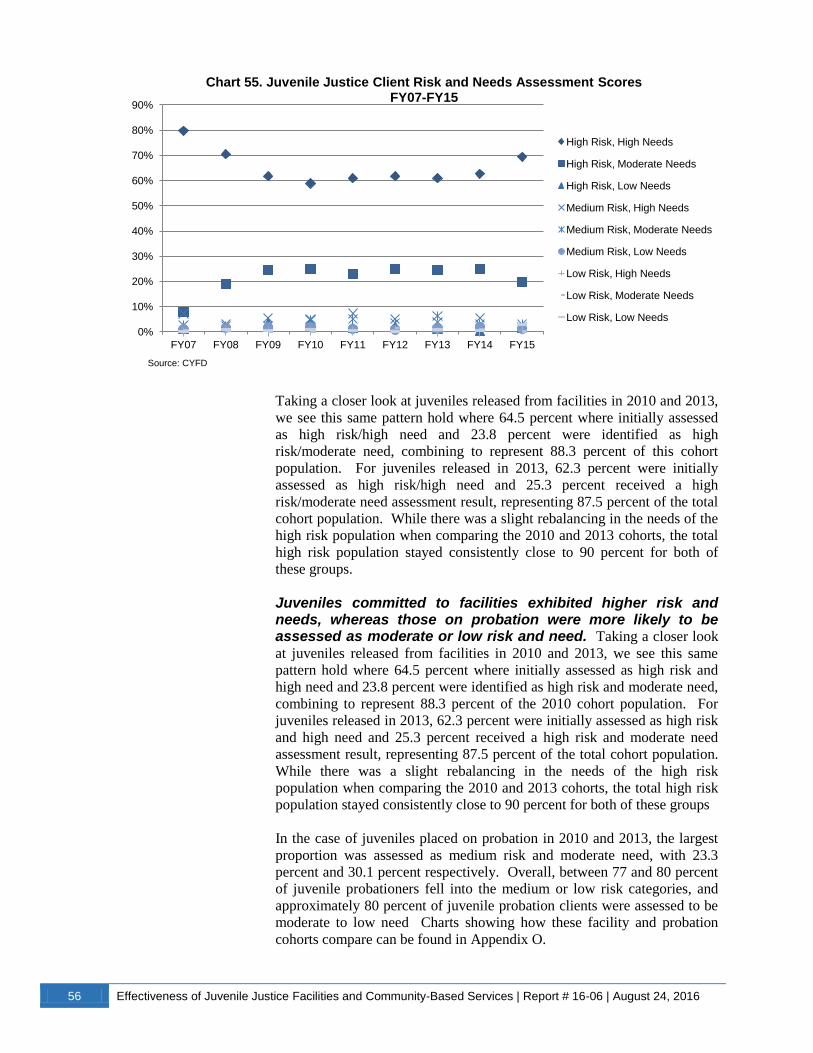
56 Effectiveness of Juvenile Justice Facilities and Community-Based Services | Report # 16-06 | August 24, 2016
Taking a closer look at juveniles released from facilities in 2010 and 2013,
we see this same pattern hold where 64.5 percent where initially assessed
as high risk/high need and 23.8 percent were identified as high
risk/moderate need, combining to represent 88.3 percent of this cohort
population. For juveniles released in 2013, 62.3 percent were initially
assessed as high risk/high need and 25.3 percent received a high
risk/moderate need assessment result, representing 87.5 percent of the total
cohort population. While there was a slight rebalancing in the needs of the
high risk population when comparing the 2010 and 2013 cohorts, the total
high risk population stayed consistently close to 90 percent for both of
these groups.
Juveniles committed to facilities exhibited higher risk and needs, whereas those on probation were more likely to be assessed as moderate or low risk and need. Taking a closer look
at juveniles released from facilities in 2010 and 2013, we see this same
pattern hold where 64.5 percent where initially assessed as high risk and
high need and 23.8 percent were identified as high risk and moderate need,
combining to represent 88.3 percent of the 2010 cohort population. For
juveniles released in 2013, 62.3 percent were initially assessed as high risk
and high need and 25.3 percent received a high risk and moderate need
assessment result, representing 87.5 percent of the total cohort population.
While there was a slight rebalancing in the needs of the high risk
population when comparing the 2010 and 2013 cohorts, the total high risk
population stayed consistently close to 90 percent for both of these groups
In the case of juveniles placed on probation in 2010 and 2013, the largest
proportion was assessed as medium risk and moderate need, with 23.3
percent and 30.1 percent respectively. Overall, between 77 and 80 percent
of juvenile probationers fell into the medium or low risk categories, and
approximately 80 percent of juvenile probation clients were assessed to be
moderate to low need Charts showing how these facility and probation
cohorts compare can be found in Appendix O.
0%
10%
20%
30%
40%
50%
60%
70%
80%
90%
FY07 FY08 FY09 FY10 FY11 FY12 FY13 FY14 FY15
Chart 55. Juvenile Justice Client Risk and Needs Assessment Scores FY07-FY15
High Risk, High Needs
High Risk, Moderate Needs
High Risk, Low Needs
Medium Risk, High Needs
Medium Risk, Moderate Needs
Medium Risk, Low Needs
Low Risk, High Needs
Low Risk, Moderate Needs
Low Risk, Low Needs
Source: CYFD
Effectiveness of Juvenile Justice Facilities and Community-Based Services | Report # 16-06 | August 24, 2016 57
It is worth noting various components of the risk score are specifically tied
to factors more likely to be present with juveniles committed to facilities
such as number of referrals, offense history, a client’s ability to adjust to
commitment, and any history of assault or battery on facility staff or peers.
Therefore, it stands to reason juveniles in facilities would have a higher
likelihood of scoring as high risk when assessed than probation clients. A
full list of scoring metrics for the needs and risk assessment is located in
Appendix P.
Recommendations
CYFD should:
Further study the causes for high commitment rates for juvenile probation
violations;
Formalize policy coordination between Child Protective Services and
Juvenile Justice Services for dually-involved youth; and
Identify data reporting needs for working with crossover youth and design
services to address the needs of this population.


Effectiveness of Juvenile Justice Facilities and Community-Based Services | Report # 16-06 | August 24, 2016 59
Agency Responses
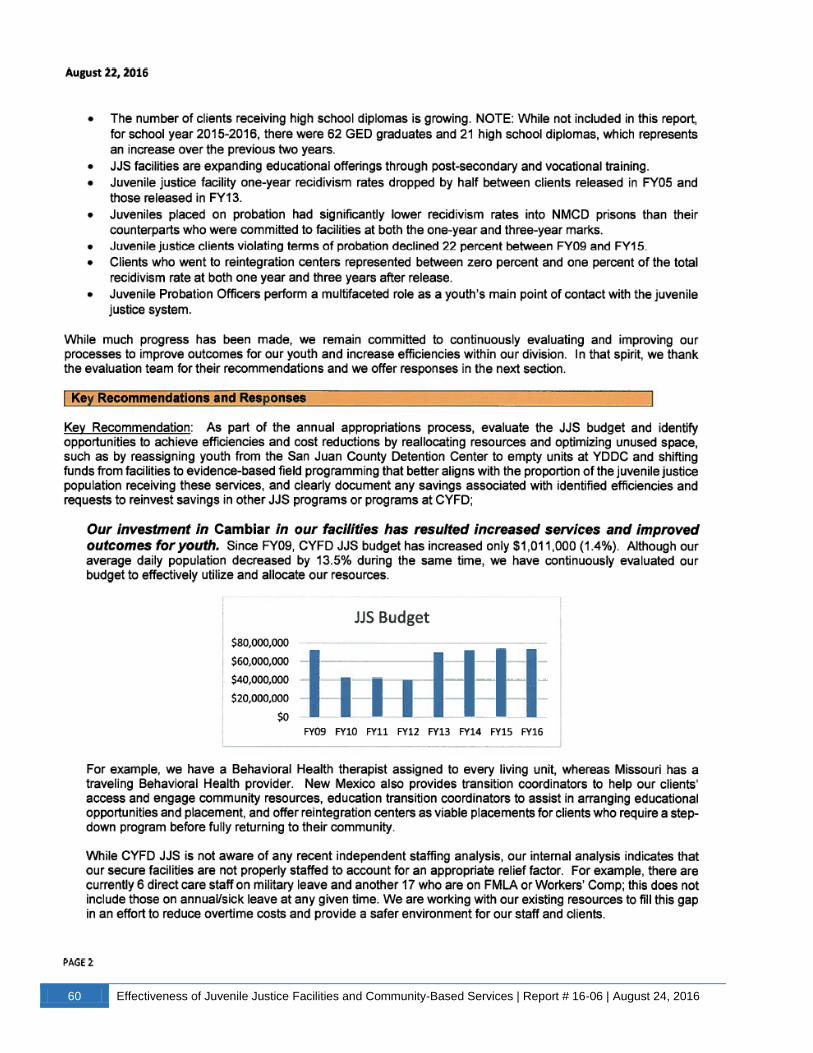
60 Effectiveness of Juvenile Justice Facilities and Community-Based Services | Report # 16-06 | August 24, 2016

Effectiveness of Juvenile Justice Facilities and Community-Based Services | Report # 16-06 | August 24, 2016 61
62 Effectiveness of Juvenile Justice Facilities and Community-Based Services | Report # 16-06 | August 24, 2016
Effectiveness of Juvenile Justice Facilities and Community-Based Services | Report # 16-06 | August 24, 2016 63
64 Effectiveness of Juvenile Justice Facilities and Community-Based Services | Report # 16-06 | August 24, 2016

Effectiveness of Juvenile Justice Facilities and Community-Based Services | Report # 16-06 | August 24, 2016 65
66 Effectiveness of Juvenile Justice Facilities and Community-Based Services | Report # 16-06 | August 24, 2016
Effectiveness of Juvenile Justice Facilities and Community-Based Services | Report # 16-06 | August 24, 2016 67

68 Effectiveness of Juvenile Justice Facilities and Community-Based Services | Report # 16-06 | August 24, 2016
Effectiveness of Juvenile Justice Facilities and Community-Based Services | Report # 16-06 | August 24, 2016 69

Effectiveness of Juvenile Justice Facilities and Community-Based Services | Report # 16-06 | August 24, 2016 71
Appendix A: Evaluation Scope and Methodology
Evaluation Objectives.
Review front-end juvenile justice services and assess capacity, needs, and cost effectiveness;
Evaluate costs, capacity, needs, and performance in secure juvenile justice facilities in relation to current
conditions and standards; and
Evaluate costs, capacity, needs, and performance in aftercare and supervised release services.
Scope and Methodology.
Interview agency staff and visit juvenile justice facilities, field offices, and community programs;
Review state and federal laws, regulations and policies;
Review previous LFC evaluations of juvenile justice facilities and programs;
Review relevant contracts, CYFD JJS annual reports, strategic plans, and other related documents;
Review existing research on juvenile justice programming from other states or institutions;
Review and analyze cohort datasets from CYFD for recidivism rates.
Evaluation Team.
Brian Hoffmeister, Lead Program Evaluator
Maria D. Griego, Program Evaluator
Pam Galbraith, Program Evaluator
Authority for Evaluation. LFC is authorized under the provisions of Section 2-5-3 NMSA 1978 to examine
laws governing the finances and operations of departments, agencies, and institutions of New Mexico and all of
its political subdivisions; the effects of laws on the proper functioning of these governmental units; and the
policies and costs. LFC is also authorized to make recommendations for change to the Legislature. In
furtherance of its statutory responsibility, LFC may conduct inquiries into specific transactions affecting the
operating policies and cost of governmental units and their compliance with state laws.
Exit Conferences. The contents of this report were discussed with the Secretary of the Children, Youth, and
Families Department and her staff on August 15, 2016.
Report Distribution. This report is intended for the information of the Office of the Governor, the Children,
Youth, and Families Department, the Office of the State Auditor, and the Legislative Finance Committee. This
restriction is not intended to limit distribution of this report, which is a matter of public record.
Charles Sallee
Deputy Director for Program Evaluation
Appendices
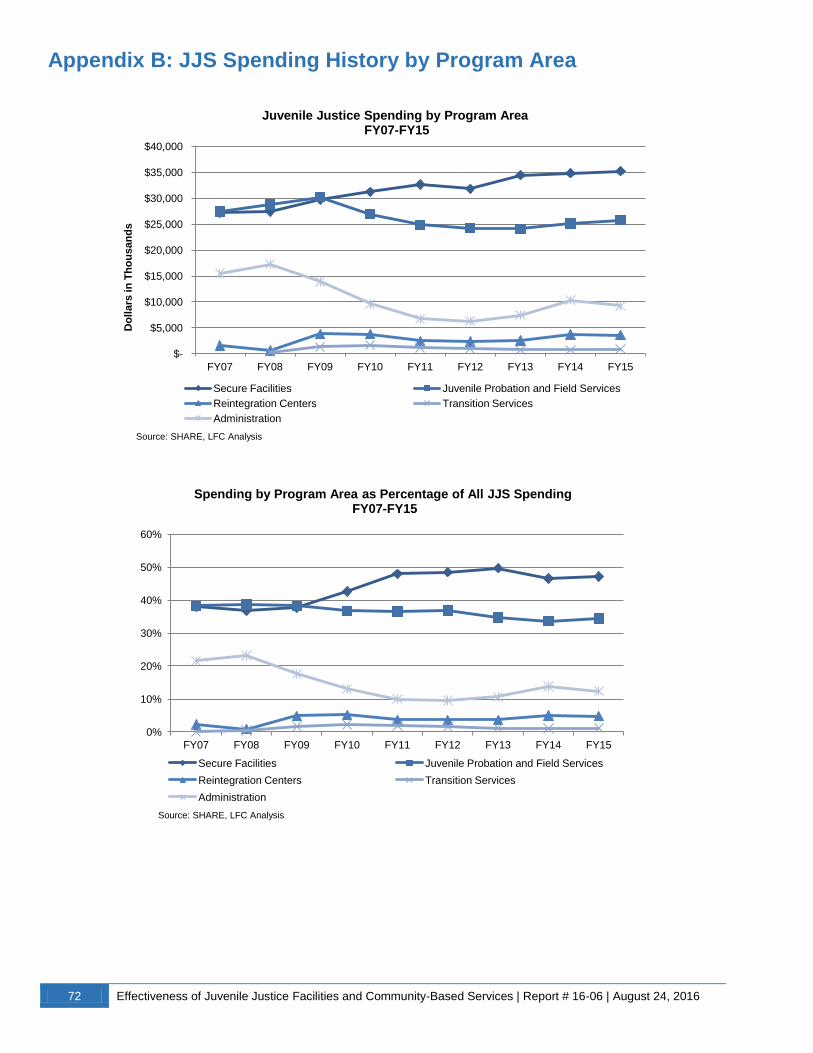
72 Effectiveness of Juvenile Justice Facilities and Community-Based Services | Report # 16-06 | August 24, 2016
Appendix B: JJS Spending History by Program Area
$-
$5,000
$10,000
$15,000
$20,000
$25,000
$30,000
$35,000
$40,000
FY07 FY08 FY09 FY10 FY11 FY12 FY13 FY14 FY15
Do
llars
in
Th
ou
san
ds
Juvenile Justice Spending by Program Area
FY07-FY15
Secure Facilities Juvenile Probation and Field Services
Reintegration Centers Transition Services
Administration
Source: SHARE, LFC Analysis
0%
10%
20%
30%
40%
50%
60%
FY07 FY08 FY09 FY10 FY11 FY12 FY13 FY14 FY15
Spending by Program Area as Percentage of All JJS Spending FY07-FY15
Secure Facilities Juvenile Probation and Field Services
Reintegration Centers Transition Services
Administration
Source: SHARE, LFC Analysis

Effectiveness of Juvenile Justice Facilities and Community-Based Services | Report # 16-06 | August 24, 2016 73
Appendix C: New Mexico Juvenile Justice Client Referral Pathway
Source: CYFD JJS FY15 Annual Report
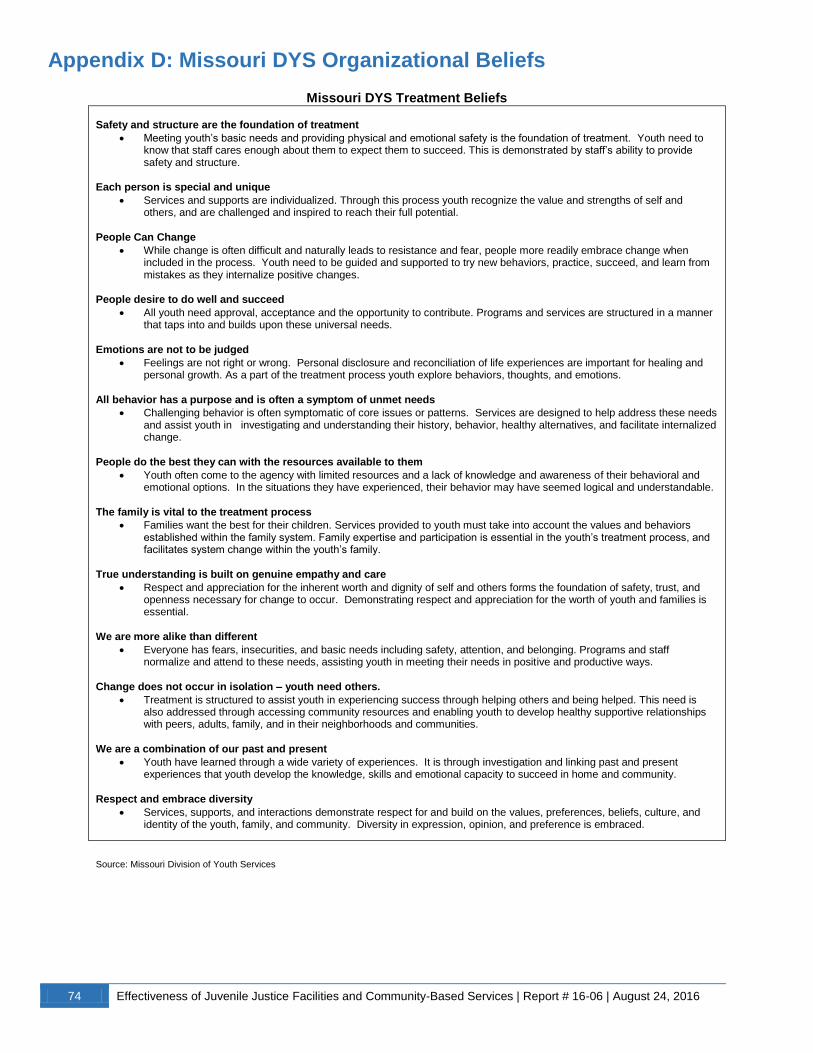
74 Effectiveness of Juvenile Justice Facilities and Community-Based Services | Report # 16-06 | August 24, 2016
Appendix D: Missouri DYS Organizational Beliefs
Missouri DYS Treatment Beliefs
Safety and structure are the foundation of treatment
Meeting youth’s basic needs and providing physical and emotional safety is the foundation of treatment. Youth need to know that staff cares enough about them to expect them to succeed. This is demonstrated by staff’s ability to provide safety and structure.
Each person is special and unique
Services and supports are individualized. Through this process youth recognize the value and strengths of self and others, and are challenged and inspired to reach their full potential.
People Can Change
While change is often difficult and naturally leads to resistance and fear, people more readily embrace change when included in the process. Youth need to be guided and supported to try new behaviors, practice, succeed, and learn from mistakes as they internalize positive changes.
People desire to do well and succeed
All youth need approval, acceptance and the opportunity to contribute. Programs and services are structured in a manner that taps into and builds upon these universal needs.
Emotions are not to be judged
Feelings are not right or wrong. Personal disclosure and reconciliation of life experiences are important for healing and personal growth. As a part of the treatment process youth explore behaviors, thoughts, and emotions.
All behavior has a purpose and is often a symptom of unmet needs
Challenging behavior is often symptomatic of core issues or patterns. Services are designed to help address these needs and assist youth in investigating and understanding their history, behavior, healthy alternatives, and facilitate internalized change.
People do the best they can with the resources available to them
Youth often come to the agency with limited resources and a lack of knowledge and awareness of their behavioral and emotional options. In the situations they have experienced, their behavior may have seemed logical and understandable.
The family is vital to the treatment process
Families want the best for their children. Services provided to youth must take into account the values and behaviors established within the family system. Family expertise and participation is essential in the youth’s treatment process, and facilitates system change within the youth’s family.
True understanding is built on genuine empathy and care
Respect and appreciation for the inherent worth and dignity of self and others forms the foundation of safety, trust, and openness necessary for change to occur. Demonstrating respect and appreciation for the worth of youth and families is essential.
We are more alike than different
Everyone has fears, insecurities, and basic needs including safety, attention, and belonging. Programs and staff normalize and attend to these needs, assisting youth in meeting their needs in positive and productive ways.
Change does not occur in isolation – youth need others.
Treatment is structured to assist youth in experiencing success through helping others and being helped. This need is also addressed through accessing community resources and enabling youth to develop healthy supportive relationships with peers, adults, family, and in their neighborhoods and communities.
We are a combination of our past and present
Youth have learned through a wide variety of experiences. It is through investigation and linking past and present experiences that youth develop the knowledge, skills and emotional capacity to succeed in home and community.
Respect and embrace diversity
Services, supports, and interactions demonstrate respect for and build on the values, preferences, beliefs, culture, and identity of the youth, family, and community. Diversity in expression, opinion, and preference is embraced.
Source: Missouri Division of Youth Services
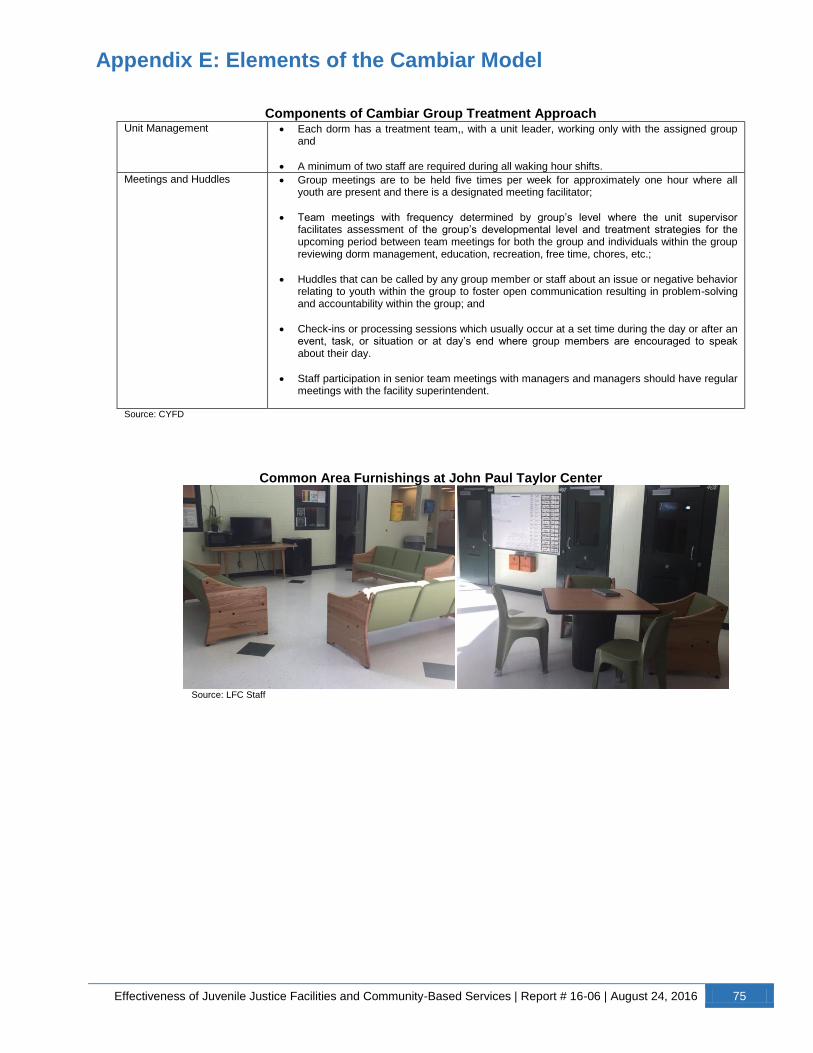
Effectiveness of Juvenile Justice Facilities and Community-Based Services | Report # 16-06 | August 24, 2016 75
Appendix E: Elements of the Cambiar Model
Components of Cambiar Group Treatment Approach
Unit Management Each dorm has a treatment team,, with a unit leader, working only with the assigned group and
A minimum of two staff are required during all waking hour shifts.
Meetings and Huddles
Group meetings are to be held five times per week for approximately one hour where all youth are present and there is a designated meeting facilitator;
Team meetings with frequency determined by group’s level where the unit supervisor facilitates assessment of the group’s developmental level and treatment strategies for the upcoming period between team meetings for both the group and individuals within the group reviewing dorm management, education, recreation, free time, chores, etc.;
Huddles that can be called by any group member or staff about an issue or negative behavior relating to youth within the group to foster open communication resulting in problem-solving and accountability within the group; and
Check-ins or processing sessions which usually occur at a set time during the day or after an event, task, or situation or at day’s end where group members are encouraged to speak about their day.
Staff participation in senior team meetings with managers and managers should have regular meetings with the facility superintendent.
Source: CYFD
Common Area Furnishings at John Paul Taylor Center
Source: LFC Staff

76 Effectiveness of Juvenile Justice Facilities and Community-Based Services | Report # 16-06 | August 24, 2016
Appendix F: JJS Educational Facilities
JJS Facility Classrooms
YDDC Classroom JPTC Classroom
CNYC Classroom
JPTC Vocational Training Facilities
Greenhouse for Horticulture Program Computer Lab for Drafting Program
Source: LFC Staff Cage and Equipment for Forthcoming Welding Program
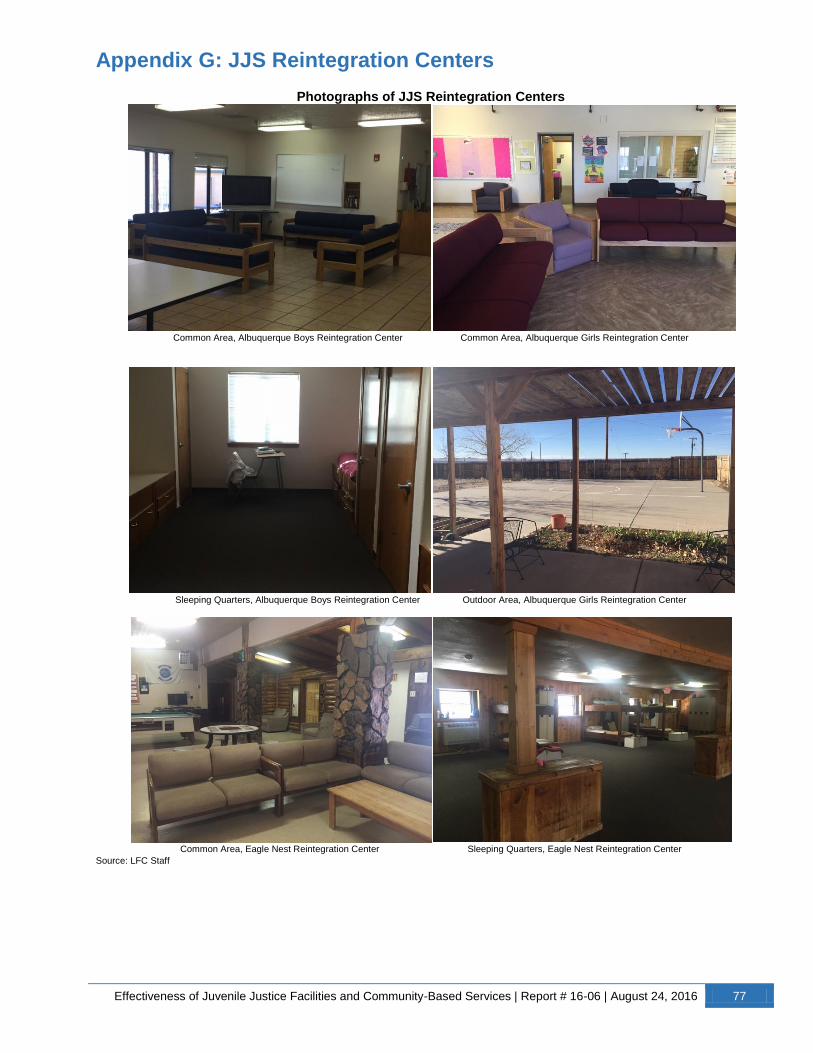
Effectiveness of Juvenile Justice Facilities and Community-Based Services | Report # 16-06 | August 24, 2016 77
Appendix G: JJS Reintegration Centers
Photographs of JJS Reintegration Centers
Common Area, Albuquerque Boys Reintegration Center Common Area, Albuquerque Girls Reintegration Center
Sleeping Quarters, Albuquerque Boys Reintegration Center Outdoor Area, Albuquerque Girls Reintegration Center
Common Area, Eagle Nest Reintegration Center Sleeping Quarters, Eagle Nest Reintegration Center
Source: LFC Staff
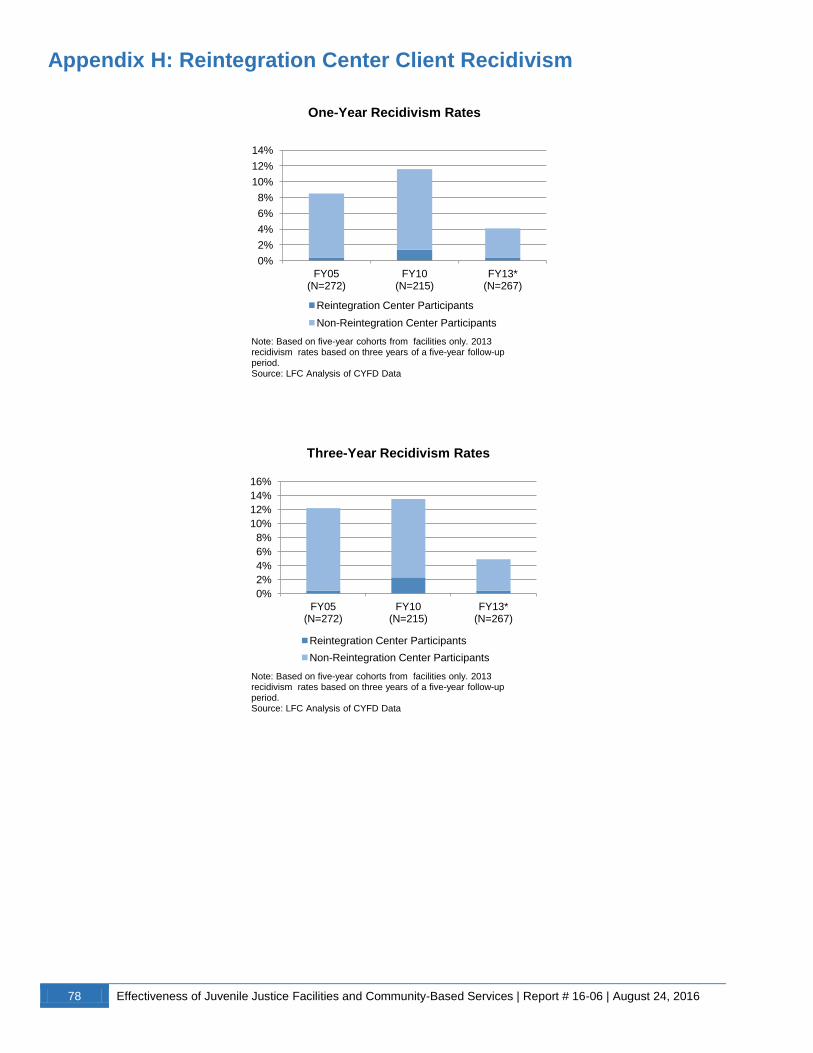
78 Effectiveness of Juvenile Justice Facilities and Community-Based Services | Report # 16-06 | August 24, 2016
Appendix H: Reintegration Center Client Recidivism
0%
2%
4%
6%
8%
10%
12%
14%
FY05 (N=272)
FY10 (N=215)
FY13* (N=267)
One-Year Recidivism Rates
Reintegration Center Participants
Non-Reintegration Center Participants
Note: Based on five-year cohorts from facilities only. 2013 recidivism rates based on three years of a five-year follow-up period. Source: LFC Analysis of CYFD Data
0%
2%
4%
6%
8%
10%
12%
14%
16%
FY05 (N=272)
FY10 (N=215)
FY13* (N=267)
Three-Year Recidivism Rates
Reintegration Center Participants
Non-Reintegration Center Participants
Note: Based on five-year cohorts from facilities only. 2013 recidivism rates based on three years of a five-year follow-up period. Source: LFC Analysis of CYFD Data
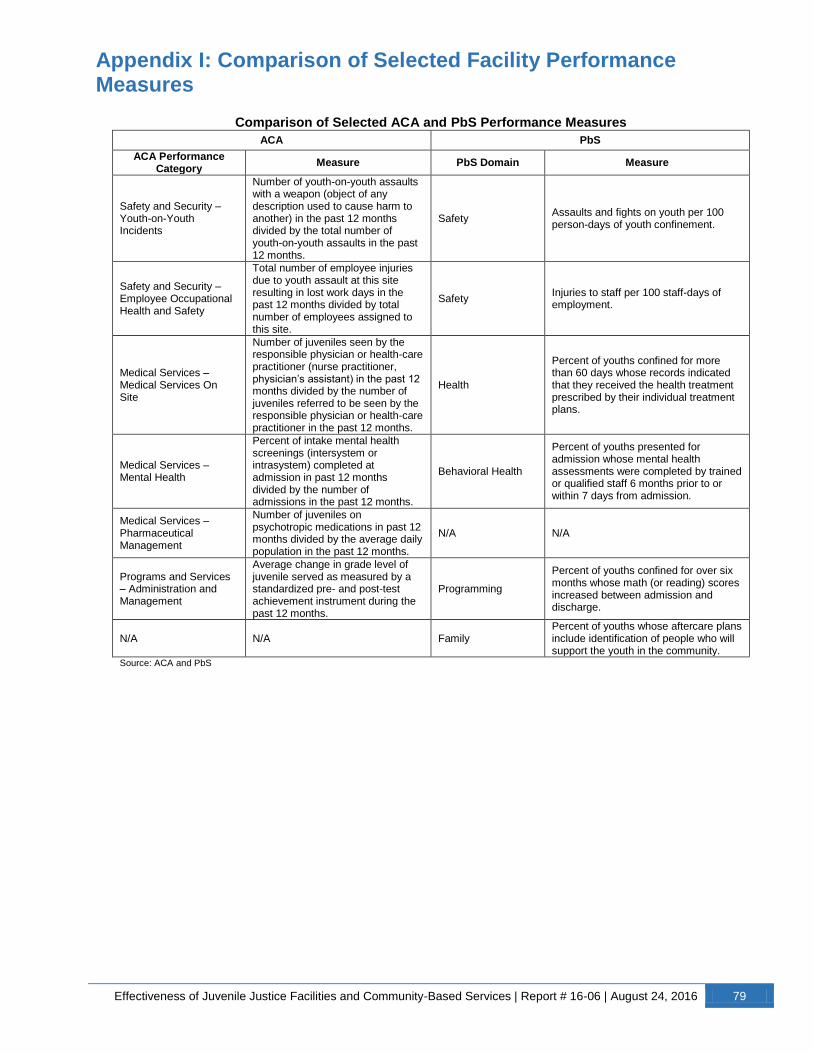
Effectiveness of Juvenile Justice Facilities and Community-Based Services | Report # 16-06 | August 24, 2016 79
Appendix I: Comparison of Selected Facility Performance Measures
Comparison of Selected ACA and PbS Performance Measures
ACA PbS
ACA Performance Category
Measure PbS Domain Measure
Safety and Security – Youth-on-Youth Incidents
Number of youth-on-youth assaults with a weapon (object of any description used to cause harm to another) in the past 12 months divided by the total number of youth-on-youth assaults in the past 12 months.
Safety Assaults and fights on youth per 100 person-days of youth confinement.
Safety and Security – Employee Occupational Health and Safety
Total number of employee injuries due to youth assault at this site resulting in lost work days in the past 12 months divided by total number of employees assigned to this site.
Safety Injuries to staff per 100 staff-days of employment.
Medical Services – Medical Services On Site
Number of juveniles seen by the responsible physician or health-care practitioner (nurse practitioner, physician’s assistant) in the past 12 months divided by the number of juveniles referred to be seen by the responsible physician or health-care practitioner in the past 12 months.
Health
Percent of youths confined for more than 60 days whose records indicated that they received the health treatment prescribed by their individual treatment plans.
Medical Services – Mental Health
Percent of intake mental health screenings (intersystem or intrasystem) completed at admission in past 12 months divided by the number of admissions in the past 12 months.
Behavioral Health
Percent of youths presented for admission whose mental health assessments were completed by trained or qualified staff 6 months prior to or within 7 days from admission.
Medical Services – Pharmaceutical Management
Number of juveniles on psychotropic medications in past 12 months divided by the average daily population in the past 12 months.
N/A N/A
Programs and Services – Administration and Management
Average change in grade level of juvenile served as measured by a standardized pre- and post-test achievement instrument during the past 12 months.
Programming
Percent of youths confined for over six months whose math (or reading) scores increased between admission and discharge.
N/A N/A Family Percent of youths whose aftercare plans include identification of people who will support the youth in the community.
Source: ACA and PbS
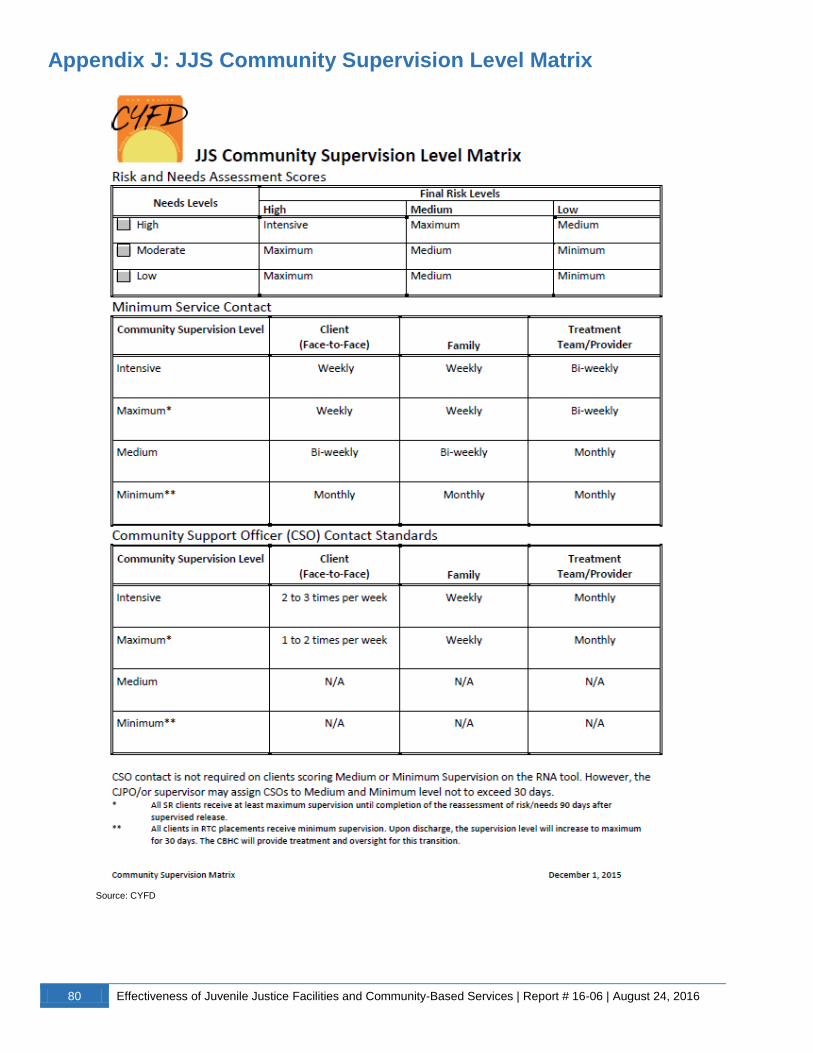
80 Effectiveness of Juvenile Justice Facilities and Community-Based Services | Report # 16-06 | August 24, 2016
Appendix J: JJS Community Supervision Level Matrix
Source: CYFD

Effectiveness of Juvenile Justice Facilities and Community-Based Services | Report # 16-06 | August 24, 2016 81
Appendix K: List of Juvenile Justice Continuum Sites and Programs
Continuum Sites and Funded Programs, FY16
Continuum Site Funded Programs Continuum Site Funded Programs
Bernalillo County
Circles of Justice
Luna & Hidalgo Counties
Adolescent Literacy Program
Community Custody Program Continuum Funds
Continuum Funds
McKinley County
Botvin Life Skills
New Day Reception & Assessment Center Boy's Council
Outcome, Inc. Case Management
Parenting Project Continuum Funds
South Valley Reporting Center Crisis Center
Victim Offender Mediation Girl's Circle
Youth Services Center Venture Program
Chaves County
Alternative Education
City of Raton
Boy's Council
Continuum Funds Continuum Funds
Girl's Circle Girl's Circle
Roswell Refuge Juvenile Violence Program Restorative Justice
WINGS for Life
Rio Arriba County
Academic Skills Enhancement
Youth Advocacy Continuum Funds
Cibola County
Continuum Funds Girl's Circle & Boy's Council
Mentoring Anti-Bullying Program Intensive Community Monitoring
Saturday School PASS Program
Student Resource Officer YMCA Day Monitoring
Substance Abuse Prevention
Sandoval County
Alternative Education Setting
Curry County
Boy's Council Continuum Funds
Citation Program Learning Lab - Bernalillo
Continuum Funds Learning Lab - Cuba
Girl's Circle New Day Reception & Assessment Center
Truancy Program
City of Santa Fe
Communities in Schools
Grant County
Continuum Funds Continuum Funds
Restorative Justice Day Reporting Center
Strengthening Families Program Girl's Circle & Boy's Council
City of Las Cruces
Continuum Funds Intensive Community Monitoring
Juvenile Assessment & Reporting Center Restorative Justice
Juvenile Citation Program Strengthening Families Program
City of Las Vegas
Continuum Funds
City of Socorro
Continuum Funds
Girl's Circle & Boy's Council Substance Abuse & Awareness Education
Restorative Justice Teen Multi-Purpose Center
Substance & Violence Prevention Youth Diversion Court
Youth Sports Program
Town of Taos
Continuum Funds
Lea County
Continuum Funds Girl's Circle
Youth Reporting Center Intensive Community Monitoring
Lincoln County
Boy's Council Learning Lab
Citation Program Non-Violence Works Program
Continuum Funds Restorative Justice
Girl's Circle
Torrance County
Continuum Funds
Intensive Community Monitoring Reception & Assessment Center
Restorative Justice ScOutreach Program
Trauma Program
Valencia County
Continuum Funds
Los Alamos
County
Continuum Funds Girl's Circle & Boy's Council
Girl's Circle & Boy's Council Reception & Assessment Center
Life Skills ScOutreach Program
Truancy Program
Youth & Family Advocacy
Source: CYFD
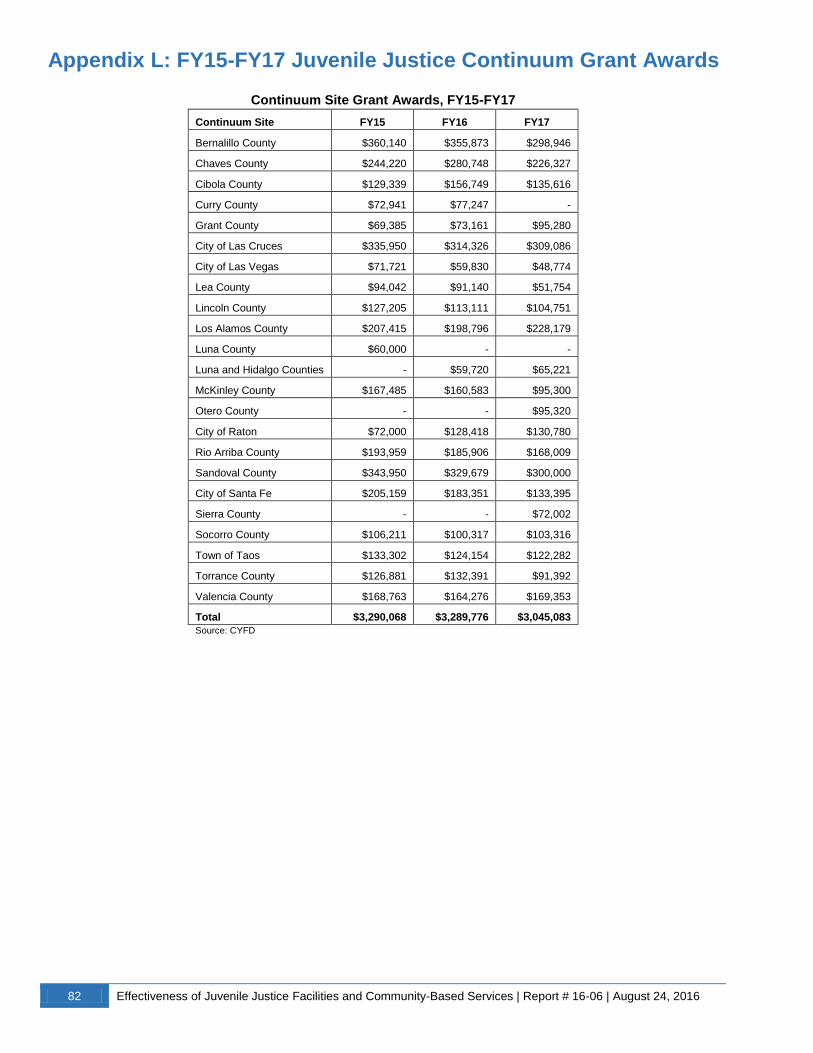
82 Effectiveness of Juvenile Justice Facilities and Community-Based Services | Report # 16-06 | August 24, 2016
Appendix L: FY15-FY17 Juvenile Justice Continuum Grant Awards
Continuum Site Grant Awards, FY15-FY17
Continuum Site FY15 FY16 FY17
Bernalillo County $360,140 $355,873 $298,946
Chaves County $244,220 $280,748 $226,327
Cibola County $129,339 $156,749 $135,616
Curry County $72,941 $77,247 -
Grant County $69,385 $73,161 $95,280
City of Las Cruces $335,950 $314,326 $309,086
City of Las Vegas $71,721 $59,830 $48,774
Lea County $94,042 $91,140 $51,754
Lincoln County $127,205 $113,111 $104,751
Los Alamos County $207,415 $198,796 $228,179
Luna County $60,000 - -
Luna and Hidalgo Counties - $59,720 $65,221
McKinley County $167,485 $160,583 $95,300
Otero County - - $95,320
City of Raton $72,000 $128,418 $130,780
Rio Arriba County $193,959 $185,906 $168,009
Sandoval County $343,950 $329,679 $300,000
City of Santa Fe $205,159 $183,351 $133,395
Sierra County - - $72,002
Socorro County $106,211 $100,317 $103,316
Town of Taos $133,302 $124,154 $122,282
Torrance County $126,881 $132,391 $91,392
Valencia County $168,763 $164,276 $169,353
Total $3,290,068 $3,289,776 $3,045,083
Source: CYFD
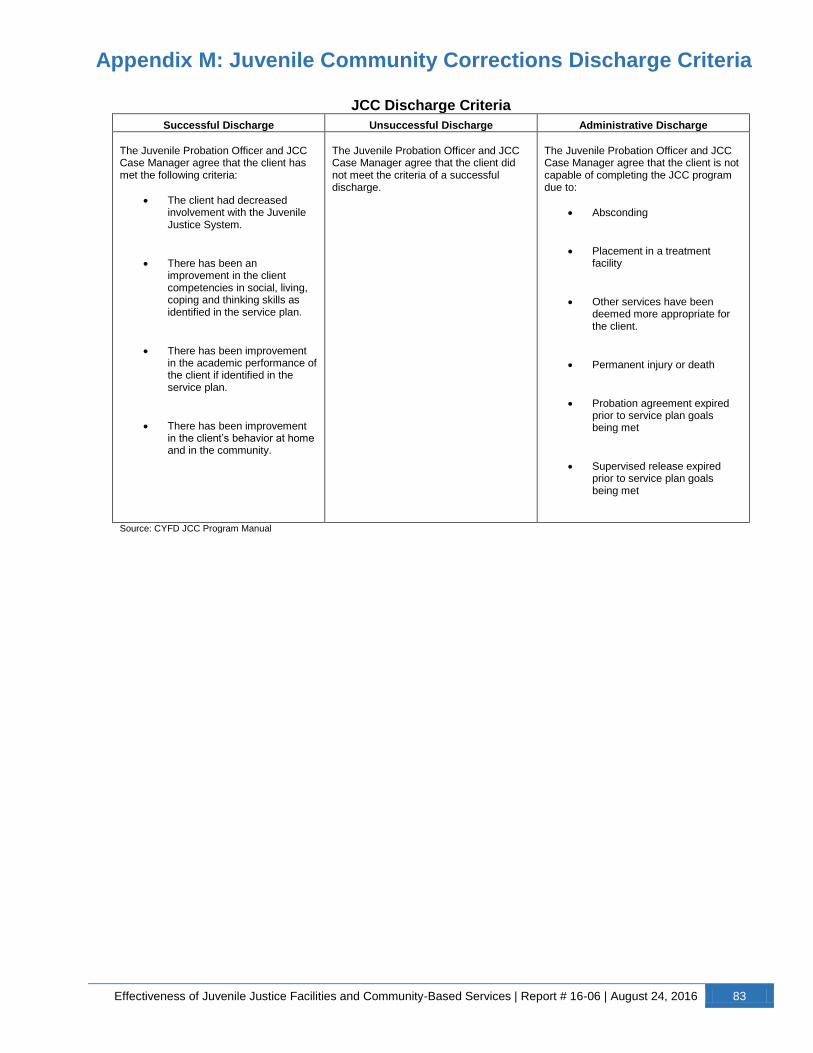
Effectiveness of Juvenile Justice Facilities and Community-Based Services | Report # 16-06 | August 24, 2016 83
Appendix M: Juvenile Community Corrections Discharge Criteria
JCC Discharge Criteria
Successful Discharge Unsuccessful Discharge Administrative Discharge
The Juvenile Probation Officer and JCC Case Manager agree that the client has met the following criteria:
The client had decreased involvement with the Juvenile Justice System.
There has been an improvement in the client competencies in social, living, coping and thinking skills as identified in the service plan.
There has been improvement in the academic performance of the client if identified in the service plan.
There has been improvement in the client’s behavior at home and in the community.
The Juvenile Probation Officer and JCC Case Manager agree that the client did not meet the criteria of a successful discharge.
The Juvenile Probation Officer and JCC Case Manager agree that the client is not capable of completing the JCC program due to:
Absconding
Placement in a treatment facility
Other services have been deemed more appropriate for the client.
Permanent injury or death
Probation agreement expired prior to service plan goals being met
Supervised release expired prior to service plan goals being met
Source: CYFD JCC Program Manual

84 Effectiveness of Juvenile Justice Facilities and Community-Based Services | Report # 16-06 | August 24, 2016
Appendix N: Additional MST Information
Multisystemic Therapy Providers as of 2015 Active Provider MST Services Provided Coverage Area
Guidance Center of Lea County Standard MST (1 team) Hobbs
La Clinica de Familia Standard MST (1 team)
MST-PSB (1 team) Las Cruces and Doña Ana County
Mental Health Resources Standard MST (1 team) Clovis, Portales
Presbyterian Medical Services Standard MST (7 teams) Santa Fe, Albuquerque, Rio Rancho, Los Lunas, Farmington
Southwest Family Guidance Center and Institute
Standard MST (4 teams) MST-PSB (2 teams)
Albuquerque, Valencia County, Sandoval County, Santa Fe, Las Cruces
University of New Mexico Standard MST (2 teams) Albuquerque
Closed Provider MST Services Provided Coverage Area
La Frontera Standard MST (3 teams)
MST-PSB (1 team) Las Cruces, Silver City, Alamogordo, Deming, Lordsburg
Turquoise Health & Wellness Standard MST (3 teams) Roswell, Clovis, Portales, Quay County
Source: New Mexico MST Outcomes Tracking Project 2015
Percent Change in Average Medicaid Behavioral Health Charges per Month for Youth Who Completed MST
Between July 2005 and June 2015 n=1,869
Service Category
Percent Reduction Between 12 Months Prior to MST to 24 Months after MST
Completion
Inpatient 77%
Outpatient 52%
Intensive Outpatient 76%
Residential 67%
Value Added Services 91% Note: Value added services accounted for 1 percent of pre-admission charges. Source: 2015 New Mexico MST Outcomes Tracking Project
Table xx. Select MST Performance
Measures
Percent of Youth Living at Home
Percent of Youth in School and/or Working
Percent of Youth with No New Arrests
Number of Cases with Adherence Data
Overall Average Adherence Score
Percent of Youth Completing Treatment
Percent of Cases Closed Due to Lack of Engagement
Percent of Youth Placed During Treatment
Average Length of Treatment in Days
Source: MST Institute

Effectiveness of Juvenile Justice Facilities and Community-Based Services | Report # 16-06 | August 24, 2016 85
Appendix O: Facility and Probation Risk and Needs Assessments
High Risk/High Need 62.3%
High Risk/Moderate
Need 25.3%
High Risk/Low Need 2.3%
Medium Risk/High
Need 5.3%
Medium Risk/Moderate
Need 3.4%
Medium Risk/Low Need
0.4%
Low Risk/High Need 0.4%
Low Risk/Moderate
Need 0.4%
Low Risk/Low Need 0.0%
2013 Facility Cohort Risk and Needs Assessment Results
Source: CYFD
High Risk/High Need 64.5%
High Risk/Moderate
Need 23.8%
High Risk/Low Need 2.3%
Medium Risk/High
Need 4.2%
Medium Risk/Moderate
Need 2.8%
Medium Risk/Low Need
0.5%
Low Risk/High Need 0.0%
Low Risk/Moderate
Need 0.0%
Low Risk/Low Need 1.9%
2010 Facility Cohort Risk and Needs Assessment Results
Source: CYFD
High Risk/High
Need 9.1%
High Risk/Moderate
Need 9.6%
High Risk/Low Need 3.8%
Medium Risk/High
Need 10.6%
Medium Risk/Moderate
Need 23.3%
Medium Risk/Low
Need 24.9%
Low Risk/High Need 0.4%
Low Risk/Moderate
Need 3.0%
Low Risk/Low Need 15.3%
2010 Probation Cohort Risk and Needs Assessment Results
Source: CYFD
High Risk/High
Need 8.0%
High Risk/Moderate
Need 9.8%
High Risk/Low Need 2.2%
Medium Risk/High
Need 12.1%
Medium Risk/Moderate
Need 30.1%
Medium Risk/Low
Need 20.8%
Low Risk/High Need 0.4%
Low Risk/Moderate
Need 3.0%
Low Risk/Low Need 13.5%
2013 Probation Cohort Risk and Needs Assessment Results
Source: CYFD
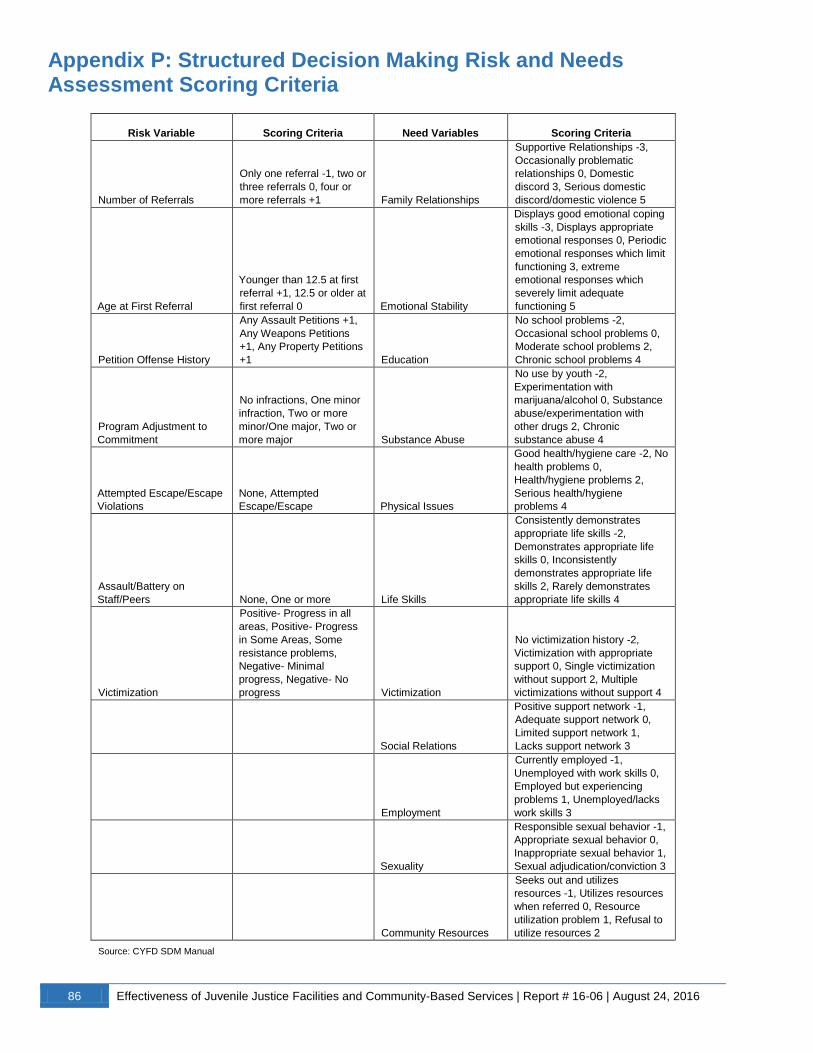
86 Effectiveness of Juvenile Justice Facilities and Community-Based Services | Report # 16-06 | August 24, 2016
Appendix P: Structured Decision Making Risk and Needs Assessment Scoring Criteria
Risk Variable Scoring Criteria Need Variables Scoring Criteria
Number of Referrals
Only one referral -1, two or
three referrals 0, four or
more referrals +1 Family Relationships
Supportive Relationships -3,
Occasionally problematic
relationships 0, Domestic
discord 3, Serious domestic
discord/domestic violence 5
Age at First Referral
Younger than 12.5 at first
referral +1, 12.5 or older at
first referral 0 Emotional Stability
Displays good emotional coping
skills -3, Displays appropriate
emotional responses 0, Periodic
emotional responses which limit
functioning 3, extreme
emotional responses which
severely limit adequate
functioning 5
Petition Offense History
Any Assault Petitions +1,
Any Weapons Petitions
+1, Any Property Petitions
+1 Education
No school problems -2,
Occasional school problems 0,
Moderate school problems 2,
Chronic school problems 4
Program Adjustment to
Commitment
No infractions, One minor
infraction, Two or more
minor/One major, Two or
more major Substance Abuse
No use by youth -2,
Experimentation with
marijuana/alcohol 0, Substance
abuse/experimentation with
other drugs 2, Chronic
substance abuse 4
Attempted Escape/Escape
Violations
None, Attempted
Escape/Escape Physical Issues
Good health/hygiene care -2, No
health problems 0,
Health/hygiene problems 2,
Serious health/hygiene
problems 4
Assault/Battery on
Staff/Peers None, One or more Life Skills
Consistently demonstrates
appropriate life skills -2,
Demonstrates appropriate life
skills 0, Inconsistently
demonstrates appropriate life
skills 2, Rarely demonstrates
appropriate life skills 4
Victimization
Positive- Progress in all
areas, Positive- Progress
in Some Areas, Some
resistance problems,
Negative- Minimal
progress, Negative- No
progress Victimization
No victimization history -2,
Victimization with appropriate
support 0, Single victimization
without support 2, Multiple
victimizations without support 4
Social Relations
Positive support network -1,
Adequate support network 0,
Limited support network 1,
Lacks support network 3
Employment
Currently employed -1,
Unemployed with work skills 0,
Employed but experiencing
problems 1, Unemployed/lacks
work skills 3
Sexuality
Responsible sexual behavior -1,
Appropriate sexual behavior 0,
Inappropriate sexual behavior 1,
Sexual adjudication/conviction 3
Community Resources
Seeks out and utilizes
resources -1, Utilizes resources
when referred 0, Resource
utilization problem 1, Refusal to
utilize resources 2
Source: CYFD SDM Manual