Program & Abstracts - University of Sydney
32
Veterinary Conference Centre, University of Sydney Friday 20 th August 2004 8 th Annual Symposium on Precision Agriculture Research & Application in Australasia Program & Abstracts
Transcript of Program & Abstracts - University of Sydney
8th Annual Symposium on Precision Agriculture Research &
Application in Australasia
Veterinary Conference Centre, University of Sydney
Friday 20th August 2004
Program & Abstracts

8th Annual Symposium on Precision Agriculture Research & Application in Australasia
Welcome Today brings another opportunity to consider the ‘bigger picture’, generic aspects of PA through the examination of specific research being undertaken in a number of agricultural industries across the region. Pulling together as many PA practitioners as possible so that the community can contemplate an ‘industry’ perspective is the ultimate goal of the Symposium. And as we consider the development of the Australasian PA industry it may be time to redefine the generic goals as something like…towards that kind of agriculture that increases the number of (correct) decisions per unit area of land per unit time with associated net benefits. This moves the focus a little away from simply spatial resolution to one involving the fineness of decisions in both space and time. But what are those associated benefits? In simple terms - a concomitant increase in quantity and/or quality of production and/or environmental stewardship along with the same or decreased total inputs. A proper definition of this in quantitative terms remains elusive. This will indeed involve a triple-bottom-line kind of definition focusing on sustainable development and taking into account traditional profitability along with environmental and social benefits. (Some have even argued for a fourth….a spiritual dimension). The last consideration suggests a rather broad question: Can precision agriculture make us feel better about the world? Should the hypothesis be that this may be the case, then the challenge is to make this plausible. But it is also obvious that there remains some very specific issues which require ongoing attention by us all to develop the PA concept to its full potential, and ultimately broad acceptance. (a) Grasping the power of the concept by political entities in the wider community (b) Improved Decision Support Tools (systems and training) (c) Appropriate criteria for economic assessment of PA (d) Insufficient recognition of temporal variation (e) Lack of whole-farm focus (f) Crop quality assessment methods (g) Product tracking (h) Environmental auditing Anyway, something broader to contemplate and tackling these should provide stimulus to us all. Together with the Southern Precision Agriculture Association (SPAA) and with the kind sponsorship of the Grains Research and Development Corporation (GRDC), we at the Australian Centre for Precision Agriculture (ACPA) thank you for your participation and hope you enjoy and benefit from the day. Alex McBratney & Brett Whelan ACPA University of Sydney
Page 1

8th Annual Symposium on Precision Agriculture Research & Application in Australasia
8th Annual Symposium on Precision Agriculture Research & Application in Australasia Program Page 8.50am Welcome Alex McBratney (Director ACPA)………………………………………1 9.00am The Application of Reflectance Measurements in Agronomy Research Bruce Haigh (NSW DPI)………………………………………………………………3 9.20am Rapid Soil Assessment Tools for PA Paul Rampant (DPI VIC)………………………………………………………………3 9.40am Integration of an Autonomous Vehicle & a Robot Arm for Fruit Picking Jay Katupitiya(UNSW)…………………………………………………………………4 10.00am Remote Sensing: An Innovative Balloon Platform Troy Jensen (QLD DPI) ………………………………………………………………5 10.20am CanBus ISO 11783 - An Emerging Standard Rohan Rainbow (SPAA)………………………………………………………………5 10.30am Morning Tea 11.00am Using Hyperspectral Imagery on Grain Crops Rob Kelly (QLD DPI)…………………………………………………………………..7 11.20pm Monitoring Wheat Protein Content On-Harvester James Taylor (ACPA)………………………………………………………………….8 11.40am Responses to Nitrogen and the Interaction with Soil Moisture Retention from
Cereal and Grass Seed Crops in New Zealand Murray Craighead (Nutrient Solutions) & Ian Yule (NZCPA)……………………10 Noon Precision Agriculture - A German Perspective
Kerstin Panten (CSIRO L & W), Silvia Haneklaus, Holger Lilienthal & Ewald Schnug (FAL-PB)……………………………………………………………………..10
12.20pm Progress in PA on the Riverine Plains Adam Inchbold (Grandview)…………………………………………………………12 12.40pm Lunch 1.30pm Precision Viticulture - A Tool for Improved Vineyard Experimentation Dean Lanyon (CSIRO L & W)……………………………………………………….16 1.50pm Localised Response to Inputs: Improving the Profit from PA? Brett Whelan (ACPA)………………………………………………………………...19 2.10pm Precise Fertiliser Application from Land and Air Ian Yule (NZCPA)…………………………………………………………………….20 2.30pm Economics of Precision Agriculture Tiho Ancev (ACPA)…………………………………………………………………..21 2.50 pm Standards for Soil ECa Measurement Gary O’Leary (DPI VIC)……………………………………………………………...22 3.00pm Afternoon Tea 3.30pm Managing Soilborne Diseases – A Spatial Approach John Heap (SARDI)…………………………………………………………………..23 3.50pm Identifying Strategies for Profitably Using PA Peter Stone (CSIRO Sustainable Ecosystems)…………………………………...26 4.10pm Development of Assessment Tools for Management of Perennial Trellised
Crops. John-Paul Praat (Lincoln Ventures Ltd)…………………………………..27 4.30am Assessing the Technical Opportunity to Manage Within-Vineyard Variability Bruno Tisseyre (Agricultural University, Montpellier)……………………………..28 4.50pm Close: Alex McBratney (Director ACPA)
Page 2
8th Annual Symposium on Precision Agriculture Research & Application in Australasia
Applications of Reflectance Measurement in Agronomy Research. Bruce M. Haigh and Warwick L. Felton NSW Department of Primary Industries Tamworth Agricultural Institute, RMB 944 Calala Lane, Tamworth 2340 [email protected] The reflectance of Red(R) and Near Infra-Red (NIR) wavebands on plant foliage has been used extensively to quantify crop growth. The initial approach was to use the sun as the source of illumination. However, problems occur due to changes in light levels throughout the day. With the introduction of sensors with their own illumination source, such as the WeedSeeker® and GreenSeeker® (Ntech Industries, Inc), the environmental conditions have become less important. Mounting these sensors on a tractor and continuously sampling across a plot has enabled the data resolution to be increased compared to stationary sensors. The simple ratio (Red/NIR) was used as a measure of chlorophyll density rather than the NDVI (NIR-R/NIR+R). A series of field experiments were designed to assess the performance of the sensors. Canola, chickpea, faba bean and wheat were used as test crops to calibrate the sensor readings with biomass and leaf area index. Results show that there was a linear relationship between biomass and reflectance below 1000 kg/ha. A weed competition trial, where chickpea was grown as a crop and triticale as a mimic weed, was sown. The weeds were at different densities to assess their effect on yield and hence the yield loss compared to weed free controls. By using reflectance techniques the plots can be sampled non-destructively to measure the crop and weed growth at multiple intervals throughout the growing season. The yield loss was accurately predicted by sampling from 50 to 100 days after the crop was sown. The technique also was used to examine the effect of different fungicide treatments to control disease in chickpea, and to compare the seedling vigour of different varieties. Visual assessments are subject to bias. Reflectance techniques provide a quantitative assessment and were found to be correlated with grain yield. Applications in the future could be used in selective “in-crop” herbicide spraying based on the differences in reflectance between areas with high and low weed infestations. Rapid Assessment Soil Mapping Tools for Precision Agriculture Paul Rampant Primary Industries Research Victoria Department of Primary Industries, Bendigo Box 3100, Bendigo Delivery Centre, Victoria, 3554 [email protected] Yield maps have been around for some time now and the equipment to monitor crop yields at harvest is becoming more common. Most land managers are finding this data is of limited
Page 3

8th Annual Symposium on Precision Agriculture Research & Application in Australasia
value as in some areas it varies on a seasonal basis and even where there is consistent values the question of what can be managed in order to increase the productivity still prevails. Maybe the question should be more along the lines of 'What inputs can we reduce in order to achieve the same productivity?'. We need to know the most limiting factor in order to make any decisions. Crop yield is a function of pedogenic (soil characteristics), climatic, biological as well as anthropogenic (human) factors. We have little say over rainfall, frost, hail etc but it can be monitored. We have some control over some of the pests and we have control over the anthropogenic factors in our management of the crop. The one that varies relatively little over the course of time is the pedogenic factors. Mapping the soil characteristics and variability at a paddock scale is the first stage in the process of understanding yield information. This needs to be done at a scale that will reflect the precision that the yield data is collected. Numerous geophysical tools, such as EM38, have been proposed for the purpose of mapping soils at the paddock scale. This paper presents some of the initial information obtained from a GRDC Precision Agriculture Initiative funded project. It assesses the usefulness of tools such as the EM38, the EM31 and a gamma ray spectrometer (commonly known as radiometrics) for the rapid mapping of soil characteristics at paddock scale and how well this data reflects the yield information. The combination of some of these tools with the addition of the elevation information, collected at the same time as the geophysical survey, can represent the soil and yield variability very well. Integration of an Autonomous Vehicle and a Robot Arm for Fruit Picking Jay Katupitiya, T Furukawa, R Eaton, R Willgoss and M Tordon School of Mechanical and Manufacturing Engineering, The University of New South Wales,Sydney NSW 2052 [email protected] This research is focusing on automating unstructured agricultural tasks. An unstructured agricultural task needs an intelligent approach based on sensor feedback. An example of such a task is fruit picking. An automated system that would carry out fruit picking must have the ability to traverse through the orchards autonomously, recognize and locate fruit, pick the fruit and safely stowaway the picked fruit. A system is currently being developed that integrates a mobile element and a manipulative element that are capable of influencing each other to coordinate so that the required tasks can be carried out. The mobile element consists of a John Deere agricultural tractor with a loader. Its sensors include, a laser range finder, GPS, an inertial navigation system, a digital compass, stereo cameras and tilt sensors. The loader, steering and traction are automatically controlled via an onboard computer. As the manipulative element, the system has a DENSO 6-DOF articulated robot arm mounted on a specially designed telescopic translation stages attached to the loader. Current developments are centered on autonomous navigation of the tractor. Current research is directed towards imaging for fruit recognition, imaging for outdoor scene recognition and task specific smart gripper development.
Page 4

8th Annual Symposium on Precision Agriculture Research & Application in Australasia
Remote sensing – an innovative balloon platform Troy Jensen Department of Primary Industries & Fisheries PO Box 102 Towoomba QLD 4350 [email protected] A low-cost remote sensing package has been developed. The sensor, which can be put into the air under a 1.8 m helium balloon or a 2.0 m wingspan remotely controlled aircraft, comprises two digital cameras and a video downlink. This system has successfully capture images of football fields, a fertiliser trial and cereal crops. The images have detected variations caused by stresses such as compaction, nutrition and/or moisture. This technology has wide-scale applications in precision agriculture and crop management. The system has been used extensively in the Grains Research and Development Corporation funded project ‘Eye in the sky to revolutionise northern crop production.’ CANBus ISO 11783 – An Emerging Standard Rohan Rainbow Executive Officer Southern Precision Agriculture Association (SPAA) PO Box 3993 Clare SA 5453 [email protected] There continues to be major advances in precision agriculture technologies. With an increasing range of tractor electronics such as auto-steer systems, sprayer, seeder and implement controllers, farmers are increasingly becoming confused, particularly when it comes to product compatibility The upcoming standard in the agricultural area for communications between a tractor and an implement is called CANBus ISO 11783 which is sometimes referred to as the generic CANBus or more specific Isobus in short. This standard forms the backbone of the autonomous agricultural machine system. CANBus (Controller Area Network, plus a Bus or data path shared by many devices) was originally developed in Germany by Bosch primarily for use in automotive applications. There have been many different standards of CANBus developed since the 1980’s, some are used universally and some are proprietary. The international CANBus ISO 11783 standard, which has been widely accepted for agricultural applications, consists of twelve documents ranging from definition of the transmission medium (Physical Layer) to application of the entire spectrum of serial communications based on CAN. CANBus ISO 11783 History 1986 Bosch introduced Controller Area Network or CAN 1988 Landwou (Agricultural) Bus System: LBS 1992 CiA – CAN in Automation founded 1992 DIN 9684 Part 4 German Ag Applications imported to form ISO 11783 Part 6 1999 Special ISO Task Force formed for development of the Virtual Terminal
Page 5
8th Annual Symposium on Precision Agriculture Research & Application in Australasia
Why do we need CANBus ISO Standards Many farmers currently run a mixed tractor fleet and require standardisation for ease of transferability of equipment and reduced hardware costs. Standardisation will improve cab ergonomics; reduce connector and cable clutter, reducing terminals damage. It will also simplify support and training for these devices. Working Groups and Plugfests The Implementation Group ISOBUS“ that is part of VDMA’s (German Engineering Federation) Agricultural Machinery Association is responsible for coordinating work within the industry. In March 2003, there was a joint meeting of the ‘Implementation Group ISOBUS’, which coordinates work in Europe, and the North American ISOBUS Implementation Task Force (NAIITF), which coordinates work in North America. ISOBUS is the common specification of the manufacturers concerning the application of the International Standard ISO 11783 Serial Control and Communications Data Network. European Agriculture Machinery manufacturers have primarily driven this ISOBUS standard ISOBUS is currently supported by the following companies: Agrocom, Amazonen-Werke, Case IH, Claas, AGCO Dronningborg, Fendt, Geotec, Grimme, Hardi, Holder, John Deere, Krone, Kverneland Group, Lemken, LH Technologies, Massey Ferguson, Müller Elektronik, New Holland, Rauch, Steyr, Valtra, GKN Walterscheid, WTK Elektronik. To date the Implementation Group ISOBUS has organised four manufacturer-independent tests (Plugfests) in Europe, and NAIITF has organised two tests in the USA. At these Plugfests, companies were able to successfully check their electronic components for ISOBUS compatibility. These plugfests not only test electronic components but also whole machines with different tractor/implement combinations during field operation. These plugfests offer an ideal opportunity to examine and to optimise system compatibility between several manufacturers. Developers of hardware and software can exchange experiences in small groups and benefit from each others know-how. It is possible to programme new software versions on the spot and to implement them in the systems. An afterward test of compatibility reveals possible problems which can be analysed in common and be corrected directly. The recent participation in January 2004 of European manufacturers and of the American Association AEM (Equipment Manufacturers Association) shows the international acceptance of ISOBUS. Companies that have been involved in US Plugfests (First held August 2002) are; AGCO Corporation, Beeline Technologies, Caterpillar, CNH Global, Dearborn Technologies, John Deere Dickey-John, HED, Integrinautics (Autofarm), Kverneland, Midtech, Phoenix International, Raven Industries, RDS, Satloc, Technical University of Munich, Trimble, Vansco and Vector Informatik. What does all this mean for farmers? In summary it appears that the ISO 11783 standard will emerge as the dominant standard for agricultural electronic control systems and precision agriculture.
Page 6

8th Annual Symposium on Precision Agriculture Research & Application in Australasia
Using hyperspectral imagery on grain crops Rob Kelly1, Armando Apan2, Stuart Phinn3, Troy Jensen1, Natasha Wells1, Wayne Strong1, David Butler1 1Department of Primary Industries and Fisheries, Toowoomba, QLD 4350 2University of Southern Queensland, Toowoomba, QLD 4350 3University of Queensland, Brisbane, QLD 4072 [email protected] Hyperspectral imagery refers to the use of hyperspectral sensors with a broad spectral coverage. These sensors are capable of capturing reflectance from the visible (VIS) to the near infrared (NIR) and the short-wave infrared (SWIR) portions of the electromagnetic spectrum. These devices provide higher spectral resolution, enabling a more accurate identification of physiological parameters including leaf structure and nutrition. This coverage is applicable for the study of vegetation health, leaf water content, soil moisture, and mineralogy (Fig.1).
Fig. 1. Typical spectral reflectance curves for vegetation, soil, and water (after Lillesand and Kiefer 1987).
We have captured hyperspectral imagery on grain crops in 2003 using both handheld and airborne spectrometers. The handheld device consisted of two spectrometer units from Analytical Spectral Devices (www.asdi.com) that captured reflectance between 400-1047 nm and 1020-2500 nm, in 1 nm increments. Reflectance was measured within a target view of 20 cm. We have identified spectral regions that co-vary with tissue sulfur, phosphorus and nitrogen concentrations (Fig.2).
Wavelength (nm)
400
450
500
550
600
650
700
750
800
850
900
950
1000
1050
Ref
lect
ance
(%)
0
5
10
15
20
25
30
350 kg S/ha30 kg S/ha
(b)(a) Fig.2. (a) VIS-NIR reflectance of
wheat at Colonsay that received two rates of sulfur. (b)
Use of the handheld
spectrometers by Stuart Phinn (left, UQ) and Armando
Apan (USQ). This research was made possible through the support of David Lester (Incitec/Pivot).
Page 7

8th Annual Symposium on Precision Agriculture Research & Application in Australasia
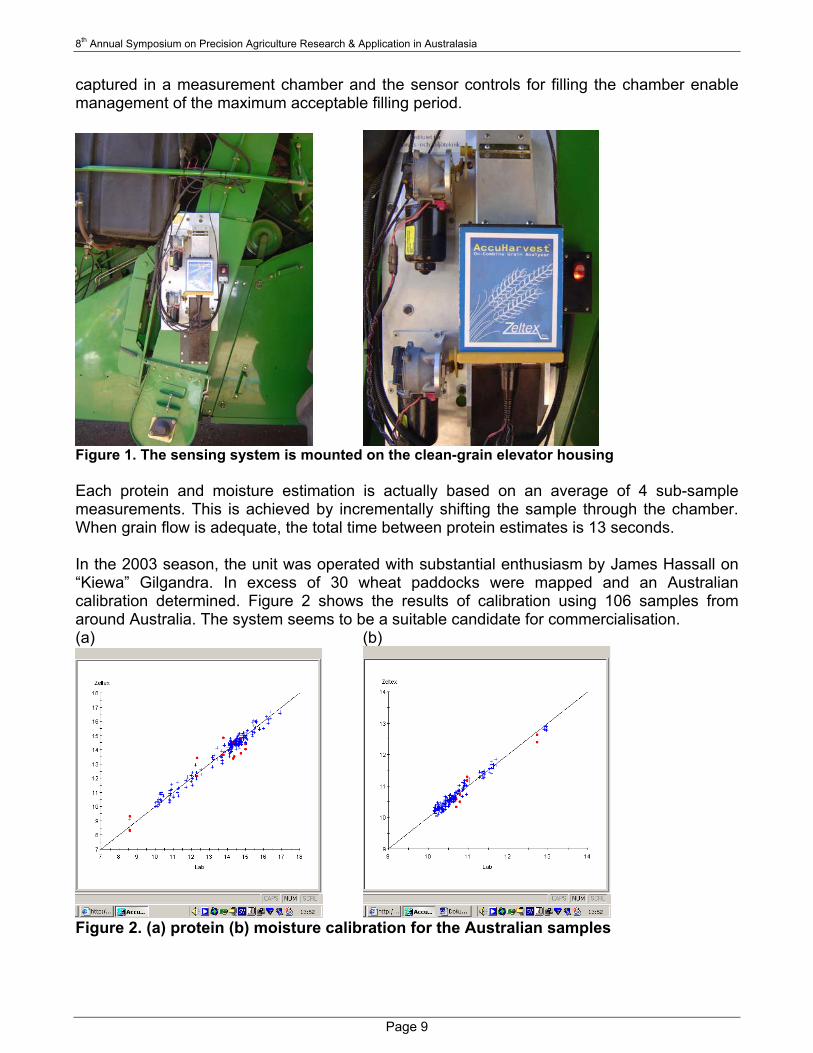
We also acquired aerial hyperspectral imagery with HyVISTA Corporation in April 2004 using the Hyperspectral Mapper (HyMapTM) (www.hymap.com), an airborne hyperspectral sensor manufactured by Integrated Spectronics (www.intspec.com). HyMap captures reflectance between 450 and 2500 nm, which is split into 126 bands of 10-20 nm. The platform gave a spatial resolution of about 3 m. Our goal is to identify spectral values that co-vary with biophysical measurements, such as protein, taken on sorghum grain samples. Fig. 3. Airborne hyperspectral imagery captured near Dalby, southern Queensland, in April 2004. The dots represent sorghum samples taken at harvest. This research was made possible through the support of the University of Queensland. Our work with hyperspectral sensors shows promise, particularly with linking canopy nutrition with NIR-SWIR reflectance. Understanding the underlying physiological mechanisms will improve our ability to locate and target appropriate spectral values. Monitoring Wheat Protein Content On-Harvester James Taylor & Brett Whelan Australian Centre for Precision Agriculture McMillan Building A05, University of Sydney NSW 2006 [email protected] In the 2001 and 2003 winter cropping seasons, the ACPA and the Northern Region PA Group (now under the CFI umbrella) were collaborating with Zeltex and JTI – Swedish Institute of Agricultural and Environmental Engineering in the testing and practical use of a system for on-harvester grain protein and moisture monitoring in Australia. The sensor is a 14 band Near Infrared Transmission (NIT) whole grain analyser operating with 14 wavelengths between 893 and 1045nm. The temperature of the sensor and the grain is also measured for the process of protein estimation. The system is presently mounted on the clean-grain elevator housing and uses a motor operated, sensor controlled gateway system to collect and dispatch sufficient grain samples (Figure 1). The grain samples are
Page 8
8th Annual Symposium on Precision Agriculture Research & Application in Australasia
captured in a measurement chamber and the sensor controls for filling the chamber enable management of the maximum acceptable filling period.
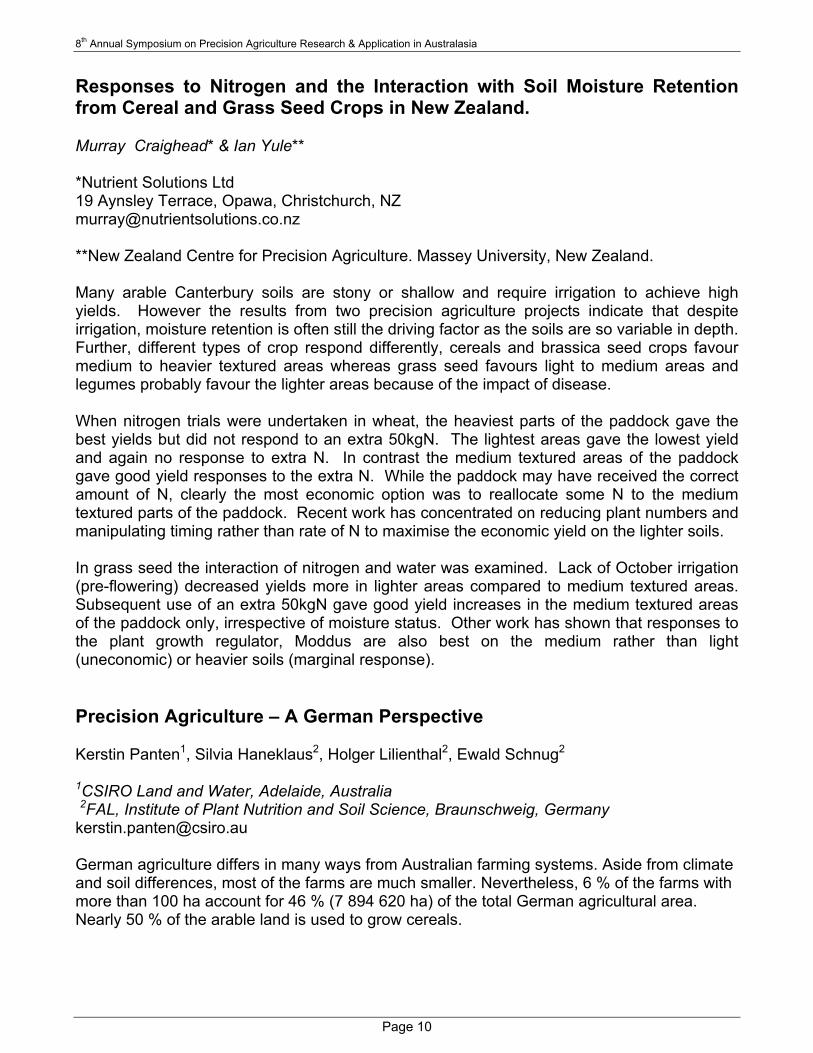
Figure 1. The sensing system is mounted on the clean-grain elevator housing Each protein and moisture estimation is actually based on an average of 4 sub-sample measurements. This is achieved by incrementally shifting the sample through the chamber. When grain flow is adequate, the total time between protein estimates is 13 seconds. In the 2003 season, the unit was operated with substantial enthusiasm by James Hassall on “Kiewa” Gilgandra. In excess of 30 wheat paddocks were mapped and an Australian calibration determined. Figure 2 shows the results of calibration using 106 samples from around Australia. The system seems to be a suitable candidate for commercialisation. (a) (b)
Figure 2. (a) protein (b) moisture calibration for the Australian samples
Page 9
8th Annual Symposium on Precision Agriculture Research & Application in Australasia
Responses to Nitrogen and the Interaction with Soil Moisture Retention from Cereal and Grass Seed Crops in New Zealand. Murray Craighead* & Ian Yule** *Nutrient Solutions Ltd 19 Aynsley Terrace, Opawa, Christchurch, NZ [email protected] **New Zealand Centre for Precision Agriculture. Massey University, New Zealand. Many arable Canterbury soils are stony or shallow and require irrigation to achieve high yields. However the results from two precision agriculture projects indicate that despite irrigation, moisture retention is often still the driving factor as the soils are so variable in depth. Further, different types of crop respond differently, cereals and brassica seed crops favour medium to heavier textured areas whereas grass seed favours light to medium areas and legumes probably favour the lighter areas because of the impact of disease. When nitrogen trials were undertaken in wheat, the heaviest parts of the paddock gave the best yields but did not respond to an extra 50kgN. The lightest areas gave the lowest yield and again no response to extra N. In contrast the medium textured areas of the paddock gave good yield responses to the extra N. While the paddock may have received the correct amount of N, clearly the most economic option was to reallocate some N to the medium textured parts of the paddock. Recent work has concentrated on reducing plant numbers and manipulating timing rather than rate of N to maximise the economic yield on the lighter soils. In grass seed the interaction of nitrogen and water was examined. Lack of October irrigation (pre-flowering) decreased yields more in lighter areas compared to medium textured areas. Subsequent use of an extra 50kgN gave good yield increases in the medium textured areas of the paddock only, irrespective of moisture status. Other work has shown that responses to the plant growth regulator, Moddus are also best on the medium rather than light (uneconomic) or heavier soils (marginal response). Precision Agriculture – A German Perspective Kerstin Panten1, Silvia Haneklaus2, Holger Lilienthal2, Ewald Schnug2
1CSIRO Land and Water, Adelaide, Australia 2FAL, Institute of Plant Nutrition and Soil Science, Braunschweig, Germany [email protected] German agriculture differs in many ways from Australian farming systems. Aside from climate and soil differences, most of the farms are much smaller. Nevertheless, 6 % of the farms with more than 100 ha account for 46 % (7 894 620 ha) of the total German agricultural area. Nearly 50 % of the arable land is used to grow cereals.
Page 10
8th Annual Symposium on Precision Agriculture Research & Application in Australasia
Research about spatial variability in fields and the first site specific applications were carried out even before the first GPS was used in agriculture. At the end of the 1980s, the first GPS-driven applications and associated data gathering took place. More than 15 years later Precision Agriculture is still a niche management system for those farm managers with sufficient financial resources to outsource parts of the data acquisition and data management to advisory services, or for computer and technology ‘freaks’. Various Precision Agriculture tools were developed and are commercially available. Strategies for soil and plant sampling as well as application algorithms were elaborated worldwide. Most of the tools were made much more user friendly than at the beginning and a lot of effort was made to create compatible systems. Nevertheless, whilst the available technologies have plenty of room for improvement, it is questionable whether ‘ease-of-use’ is the main problem limiting the adoption of Precision Agriculture. Remote sensing is increasingly seen as a key technology for gathering spatial information. Independent of the remote sensing platform (ground based, air based or satellite based) and sensor (active or passive), all recorded data still have to be verified by ground truthing. Three remote sensing systems have attracted attention in Germany in recent years because of their ability to overcome weather dependability for data recording - still one of the major bottlenecks for the practicability of remote sensed data in Central Europe. Two of these are ground-based systems. LASSIE (Low Altitude Stationary Surveillance Instrumental Equipment) is a stationary sensor system for continuous data acquisition offering the ability to gather data multiple times during the season, thus having the capability to collect information about plant development. The Yara N sensor was developed as an on-the-go sensor, which gathers reflectance data and simultaneously adjusts nitrogen fertilizer applications. Such approach is, however, suitable only under ceteris paribus conditions as there are countless reasons for changes in the spectral signature other than nitrogen so that this system carries high economic and environmental risks. For many years, radar has provided a capability for gathering spatial information form air or space without taking weather conditions and time of day into consideration. This presentation will summarize the possibilities and limitations of these systems for Precision Agriculture.
Page 11

8th Annual Symposium on Precision Agriculture Research & Application in Australasia
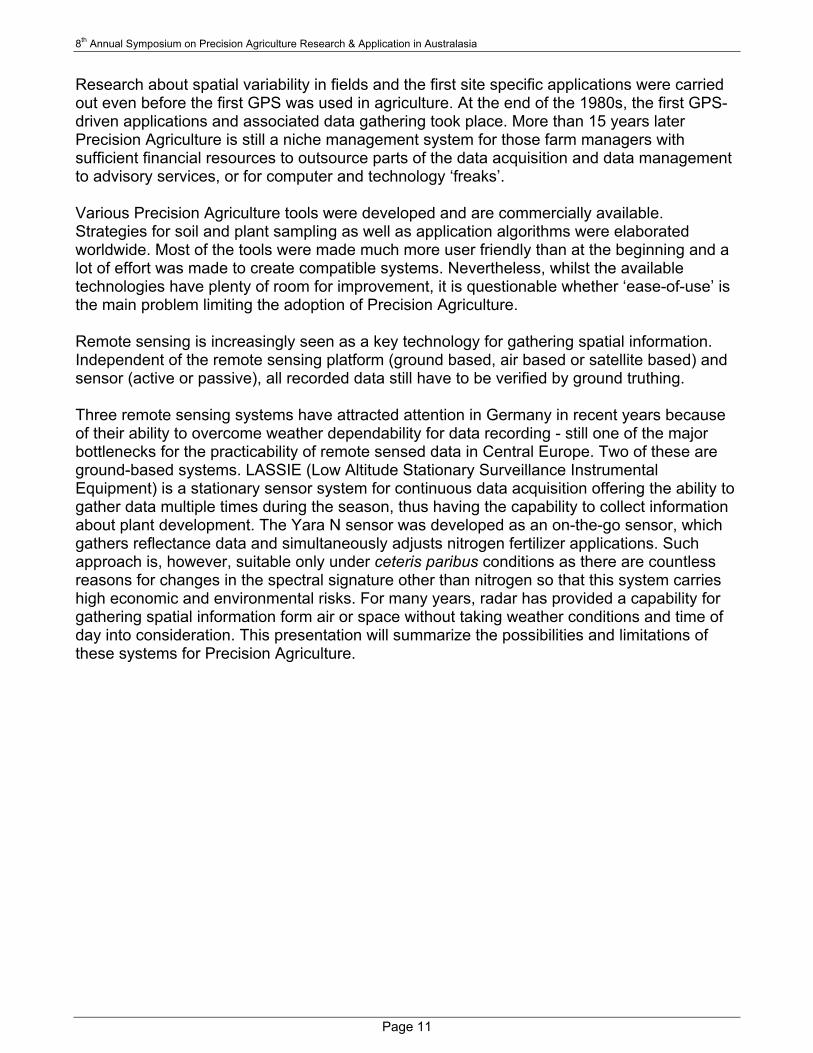
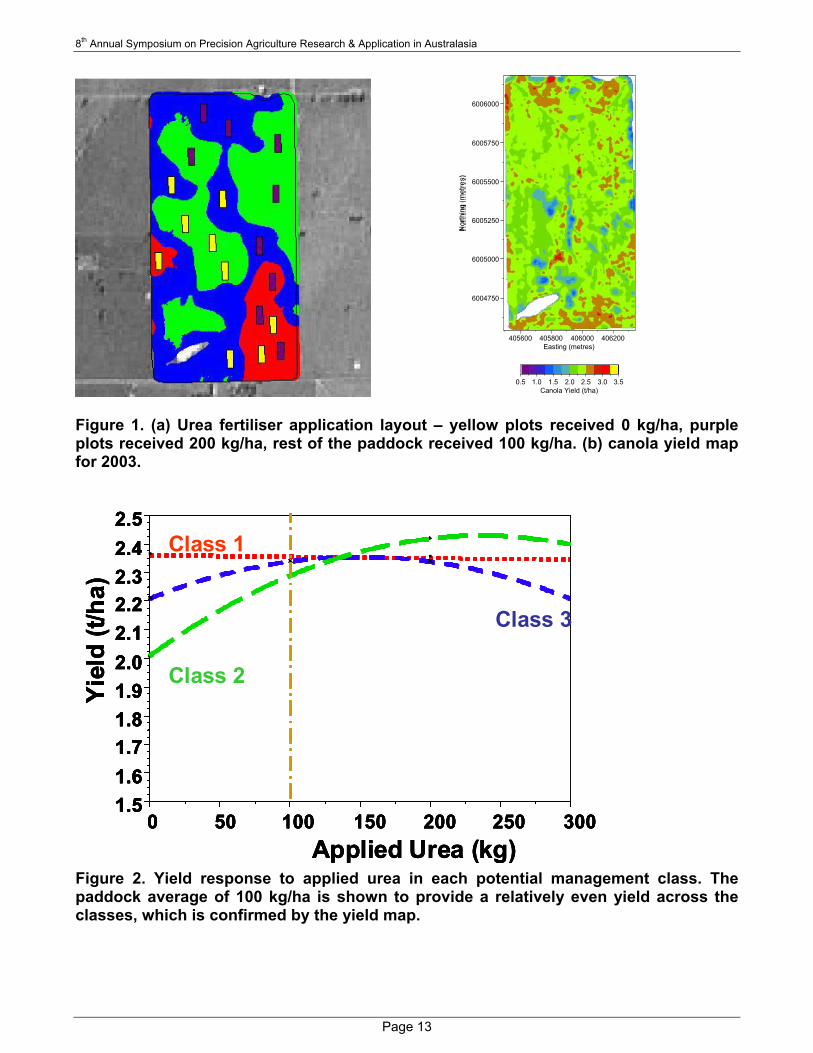
Progress in PA on the Riverine Plains Adam Inchbold “Grand View”, Yarrawonga, Victoria [email protected] Introduction Riverine Plains Inc, along with other workers, have previously identified variation in important soil parameters within paddocks. Other workers in Australia, have developed a means by which this information can be brought together with yield maps and other spatial data to delineate management zones within paddocks. However, most farmers are yet to adopt this technique on a commercial scale. Consequently, a project was designed to delineate and ground truth management zones in paddocks in the Riverine Plains and then investigate options to manage these zones more appropriately, according to their own unique characteristics. The eventual outcome would then provide advice on the best mix of Precision Agriculture (PA) tools for farms in the Riverine Plains, and develop a farmer friendly system approach to utilising PA in the Riverine Plains. Paddocks at three sites across the Riverine Plains were selected as project paddocks. Broadly the sites are at Yarrawonga, Vic (“Grand View” - Inchbold), Burrumbuttock, NSW (“Yaralla” – I”Anson ) and Urana, NSW (“Bogandillan” - Hamilton). 2003 was the first year of this project. In general terms, information that already existed on the project paddocks were combined with an updated em 38 survey to delineate potential management zones within each paddock. Once these zones were arrived at an extensive array of measurements were taken in each zone. In 2003, ground truthing undertaken in each zone included 0-10 cm soil tests, 0-60 cm N tests (DSN), data from in crop monitoring, and soil moisture data using Gopher meters. This ground truthing is continuing in 2004, along with extra in-crop plant measurements. Test strips – a common theme In 2003, the amount of available N from DSN tests taken from 90 sample sites ranged from 31 to 320 kg N/ha. Statistics (analysis of variance) indicate that significant difference occurred between the zones, with no significant difference in values occurring between replications (P < 0.05). This indicates that DSN values were consistent within each zone, and therefore differences in DSN status between zones was meaningful. As a result of the significant DSN results, an N fertilizer response experiment was set out, according to the guidelines developed by the ACPA. This involved the laying out of a replicated N rate trial in each zone to determine the response of each zone to varying rates of N (Figure 1a). This methodology will also be used in the future to determine the response to other inputs in the delineated management zones. Yield maps (Figure 1b) were and will be used to evaluate crop performance across the zones and also to determine the yield results of the test strips. Analysis of the yield response in each zone to applied urea in 2003 performed by Brett Whelan ACPA is shown in Figure 2.
Page 12
8th Annual Symposium on Precision Agriculture Research & Application in Australasia
405600 405800 406000 406200
6006000
6005750
6005500
6005250
6005000
6004750
Easting (metres)
Nor
thin
g (m
etre
s)
0.5 1.0 1.5 2.0 2.5 3.0 3.5Canola Yield (t/ha)
Figure 1. (a) Urea fertiliser application layout – yellow plots received 0 kg/ha, purple plots received 200 kg/ha, rest of the paddock received 100 kg/ha. (b) canola yield map for 2003.
1.51.61.71.81.92.02.12.22.32.42.5
0 50 100 150 200 250 300
Class 1
Class 2
Class 3
Applied Urea (kg)
Yiel
d (t/
ha)
1.51.61.71.81.92.02.12.22.32.42.5
0 50 100 150 200 250 300
Class 1
Class 2
Class 3
Applied Urea (kg)
Yiel
d (t/
ha)
1.51.61.71.81.92.02.12.22.32.42.5
0 50 100 150 200 250 300
Class 1
Class 2
Class 3
1.51.61.71.81.92.02.12.22.32.42.5
1.51.61.71.81.92.02.12.22.32.42.5
0 50 100 150 200 250 300
Class 1
Class 2
Class 3
Applied Urea (kg)
Yiel
d (t/
ha)
Figure 2. Yield response to applied urea in each potential management class. The paddock average of 100 kg/ha is shown to provide a relatively even yield across the classes, which is confirmed by the yield map.
Page 13

8th Annual Symposium on Precision Agriculture Research & Application in Australasia
The yield map is generally uniform across the paddock and this is reflected in the response function analysis. The majority of the paddock received 100kg/ha and the variation between the zones at this rate was calculated to be just 0.1 t/ha on average. However, an economic examination of the response data shows that the output from the different zones would have been optimised by applying different average rates in each. The urea rate for maximum yield and economic optimum urea rate for each zone using a marginal rate analysis is shown in Table 1. Urea Rate for
Maximum Returns (kg/ha)
Urea Rate for Maximum Yield (kg/ha)
Class 1 (Red – High EM) 0 0
Class 2 (Green – Low EM) 169 237
Class 3 (Blue – Medium EM) 72 151
Table 1. Urea rates to achieve maximum yield and economic optimum per management class.
Fertiliser waste ha x kg = t x $400/t =$
Class 1 18 x 100 = 1.8 -720
Class 3 59 x 28 =1.65 -600
Yield loss x $400/t =$
Class 2 53 x 100 =5.3 -2120
Yield gain
Class 3 59 x 20 = 1.18 +472
Total Waste 3028 (23.29/ha)
Table 2. Analysis of potential waste from fertilising at 100 kg/ha paddock average Using these response functions it is possible to make a simple estimate of what gains or losses would have been made if this information had been used to formulate fertiliser decisions at the beginning of the season. Table 2 documents a comparison with the paddock average treatment of 100 kg Urea/ha. As can be seen in the breakdown, in 77ha of the paddock there was more fertiliser than required, and in 53ha of the paddock an extra application of 69 kg/ha would have brought in over 5 tonne more canola. The total potential waste in this scenario is $3028 or $23.29 per hectare.
Page 14
8th Annual Symposium on Precision Agriculture Research & Application in Australasia
Soil-water, one of the drivers? Soil moisture tubes are located within delineated management zones at “Yaralla”, Burrumbuttock, and “Grand View”, Yarrawonga. At each site, at least three moisture tubes are located in each management zone to provide some replication of results. In 2003, soil moisture was measured at 10cm intervals down the soil profile with a moisture measurement sensor down to 1 metre. Readings were taken during the growing season twice weekly. The soil-water measurements that are being taken are proving to be a highly valuable dataset. It can already be seen from just one year’s results that the soils in the different zones have vastly different soil-water profiles. This is obviously crucial for a zones ability to yield, and hence the picture that will develop from further measurements in this area will give a much more in-depth insight into individual zones’ ability to yield. This is an area that represents the next step in zonal management. If farmers know which zones have a higher production capability, then different yield targets can be allocated to different zones, resulting in a more sophisticated and more appropriate fertiliser strategy. Extending the message Riverine Plains Inc. is a farming group concerned with the provision of excellent information to its members and the general agricultural community. Consequently, the effective extension of information obtained through projects the group is involved in has a high priority. IN 2003, soil pits were dug in one of the paddocks at the Yarrawonga site, with one pit being dug in each of the three zones. Each soil pit was classified, and it was found that each pit was a distinctly different soil type. More specifically, the pit in the low conductivity zone was a chromosol, the pit in the medium conductivity zone was a sodosol and the pit in the high conductivity zone was a vertosol. A field day was held at this site with attendees being shown through each pit by a soil expert. The field day was well attended confirming the level of interest in the area. The differences between the soil pits broadly highlighted the potential for different management techniques to be employed in different zones within paddocks. Aside from the extension of results from this project through its general information days, Riverine Plains will be extending results from this project to farmers through a series of discussion groups that will give farmers that chance to hear about results from this project, as well as discuss and learn about other PA related issues. Over forty farmers have signed up to be a part of this group from the general membership base. To coincide with the inaugural discussion group, Riverine Plains has produced a small booklet addressing some of the issues behind zonal management, and highlighting some of the interim results from the project. Looking beyond the beginning of the beginning at a grass roots level. Early work in the area of zonal management has highlighted some areas that have the potential to deliver significant economic and environmental outcomes for the farming community. However, it is important to recognize that the many issues in the broad area of Precision Agriculture in general are still relatively new in terms of their wide spread adoption in the commercial situation.
Page 15

8th Annual Symposium on Precision Agriculture Research & Application in Australasia
In the natural transfer of technology, cutting edge work that is done at the purely research level is then further investigated, confirmed and demonstrated on the ground before large scale commercial adoption takes place. This is particularly the case in the area of PA and in this case zonal management, as it involves the introduction of a new management concept, not just the incorporation of a new crop, fertilizer or machine into the existing system. Already, some of the very basic, initial findings, such as the potential for variable rate lime and gypsum application, are now utilised by the more advanced farmers in the Riverine Plains. In time, and depending on the ultimate conclusions of projects such as this one, the farmers at the cutting edge will move on to apply more inputs variably, and generally adopt a more sophisticated PA strategy, while the adoption of the initial concepts such as the variable application of lime and gypsum will become more widespread. Whilst the above is underway, researchers need to move further along the continuum of knowledge in the general area to raise and investigate new possibilities at the cutting edge, and also to answer questions that arise from the adoption of the initial concepts. So it will all take time, but this is not to say that its all too hard. This is surely the way it must happen when you are dealing with the introduction of an entirely new concept that will potentially revolutionize our whole management system. Riverine Plains “Zonal Management in the Riverine Plains” Project team Name Company Contact Adam Inchbold Riv Plains/Farmer 03 5743 1749 Paul I’Anson Riv Plains/Farmer 02 6029 3210 Brett Whelan ACPA 02 9351 2947 James Taylor ACPA 02 9036 5278 Peter Baines Riv Plains 0428 211 486 /Tim Paramore Agronomic Services Tim Paramore Riv Plains 0428 686 370 /Tim Paramore Agronomic Services John Sykes Riv Plains 02 6023 1666 /John Sykes Rural Consulting Lisa Cary Castleman Riv Plains/NSW Agriculture 02 6920 5177 Dale Grey Riv Plains/DPI Victoria 03 5871 0600 Roy Hamilton Farmer 02 6035 0230 Precision Viticulture – a Tool for Improved Vineyard Experimentation Dean M Lanyon1 and Rob G V Bramley1,2
1CSIRO Land and Water and 2Cooperative Research Centre for Viticulture PMB No. 2, Glen Osmond, SA 5064, Australia. [email protected] Vineyards are variable. To the extent that this presents a problem, it is one which, hitherto, has only really been considered by growers and wineries with respect to the parcelling of fruit and payment of price premiums for fruit of specific characteristics. However, we believe that vineyard variability also poses a problem for researchers and others conducting experiments
Page 16
8th Annual Symposium on Precision Agriculture Research & Application in Australasia
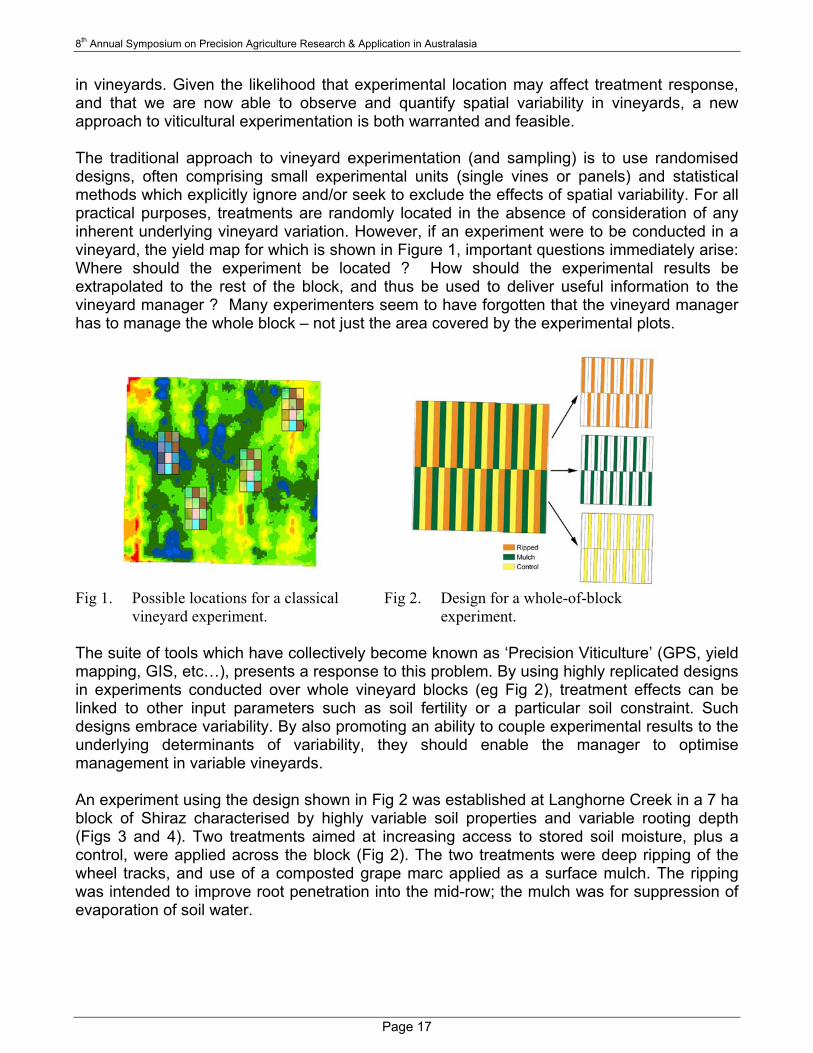
in vineyards. Given the likelihood that experimental location may affect treatment response, and that we are now able to observe and quantify spatial variability in vineyards, a new approach to viticultural experimentation is both warranted and feasible. The traditional approach to vineyard experimentation (and sampling) is to use randomised designs, often comprising small experimental units (single vines or panels) and statistical methods which explicitly ignore and/or seek to exclude the effects of spatial variability. For all practical purposes, treatments are randomly located in the absence of consideration of any inherent underlying vineyard variation. However, if an experiment were to be conducted in a vineyard, the yield map for which is shown in Figure 1, important questions immediately arise: Where should the experiment be located ? How should the experimental results be extrapolated to the rest of the block, and thus be used to deliver useful information to the vineyard manager ? Many experimenters seem to have forgotten that the vineyard manager has to manage the whole block – not just the area covered by the experimental plots.
Fig 1. Possible locations for a classical vineyard experiment.
Fig 2. Design for a whole-of-block experiment.
The suite of tools which have collectively become known as ‘Precision Viticulture’ (GPS, yield mapping, GIS, etc…), presents a response to this problem. By using highly replicated designs in experiments conducted over whole vineyard blocks (eg Fig 2), treatment effects can be linked to other input parameters such as soil fertility or a particular soil constraint. Such designs embrace variability. By also promoting an ability to couple experimental results to the underlying determinants of variability, they should enable the manager to optimise management in variable vineyards. An experiment using the design shown in Fig 2 was established at Langhorne Creek in a 7 ha block of Shiraz characterised by highly variable soil properties and variable rooting depth (Figs 3 and 4). Two treatments aimed at increasing access to stored soil moisture, plus a control, were applied across the block (Fig 2). The two treatments were deep ripping of the wheel tracks, and use of a composted grape marc applied as a surface mulch. The ripping was intended to improve root penetration into the mid-row; the mulch was for suppression of evaporation of soil water.
Page 17

8th Annual Symposium on Precision Agriculture Research & Application in Australasia
Depth to B(cm)
< 2020 - 2525 - 3030 - 35> 35
0-10 cm 15-25 cm 35-45 cm
% Clay< 55 - 1515 - 2525 - 3535 - 45> 45
Fig 3. Variation in depth to root restricting layer
Fig 4. Variation in clay content in different soil depth layers.
Figure 5 shows vine response to the imposed treatments, whilst Figure 6 shows how the vine response is linked to vineyard soil properties. We can conclude from these results that the effect of the imposed treatments on vine performance can be linked to the underlying soil conditions, and that the mulch was more effective in increasing yield in lighter soil types than ripping. Furthermore, this approach has enabled the vineyard manager to understand the variable response to these management options whilst providing useful information that can be transferred to other vineyards with similar soil properties and climate. In this connection it is also worth noting that the vineyard manager was very comfortable with implementing the experimental design used in this work. Control Mulch Ripped
Yield (kg/m)< 2.62.6 - 3.03.0 - 3.43.4 - 3.83.8 - 4.24.2 - 4.6> 4.6
Effect of mulch
Effect of ripping
Control Mulch Increase % Clay % Clay Depth to Bkg/m kg/m % 0-10 cm 35-45 cm cm2.99 3.62 21 7 28 333.17 3.83 21 18 40 273.99 3.76 -6 22 45 22
Control Ripped Increase % Clay % Clay Depth to Bkg/m kg/m % 0-10 cm 35-45 cm cm2.99 3.19 7 10 29 333.58 4.09 14 17 41 273.57 3.32 -7 22 44 23
Fig 5. Interpolated response to the
three treatments imposed. Fig 6. Linking vine response to vineyard soil
properties for the different treatments imposed.
Acknowledgments This work was funded by CSIRO Land and Water (CLW), the Commonwealth Cooperative Research Centres Program under the aegis of the CRCV (project 1.1.1) and Australia's grapegrowers and winemakers through their investment body the Grape and Wine Research and Development Corporation (project CSL01/01). Support from the latter was matched by the Federal Government. The assistance of Southcorp Wines in providing experimental sites and access to equipment such as harvesters is greatly appreciated, as is the input of Darren Aworth and Colin Hinze. Yield monitoring equipment was rented from Provisor.
Page 18
8th Annual Symposium on Precision Agriculture Research & Application in Australasia
Localised Response to Inputs: Improving the Profit from PA Brett Whelan Australian Centre for Precision Agriculture McMillan Building A05, University of Sydney NSW 2006 [email protected] The annual profit achieved by each farm across Australia prior to 1990 was highly farm-specific. The subsequent incorporation of precision agriculture will do nothing to alter the uniqueness of yearly results on individual farms. Derivation Of Profiting Middle English, from Old French, from Latin ‘profectus’, from past participle of proficere: pro-, forward ; + facere -, to make; So it originally meant ‘to make progress’. No mention of finances here. But in modern times we have generalised the term to mean ‘making money’. How We May End Up Profiting From Precision Agriculture Obviously we don’t farm to intentionally loose money and in general this is not the case. But if we consider farming over a short time frame (say a growing season) then financial losses do occur. Precision agriculture, as a form of farm management will be no different, but the risk of short-term financial losses may be minimised by optimising the product input/output ratio. All the while, we also profit from progress in long-term improvements in operability, landscape and environmental management, product marketing, storage of knowledge relevant to enterprise management and our contribution to society. This is catalogued in a stepwise process in Table 1. Precision agriculture provides tools and techniques to help sort out what the best ‘average’ management options are for all types of crop before even considering the need/requirements for changing rates of inputs across the landscape. Through vehicle guidance it offers immediate progress in minimising total input of applied chemicals and possibly maintenance/improvements in the resource-base. So it’s easy to see that a good guidance/steering system and the use of the associated GPS receivers with some crop and soil scouting tools is a sensible staring point. We are now beginning to see good reasons for continuing further down the path as input response function experiments from around the country now show us that our paddocks are indeed respoding in a site-specific manner.
Page 19
8th Annual Symposium on Precision Agriculture Research & Application in Australasia
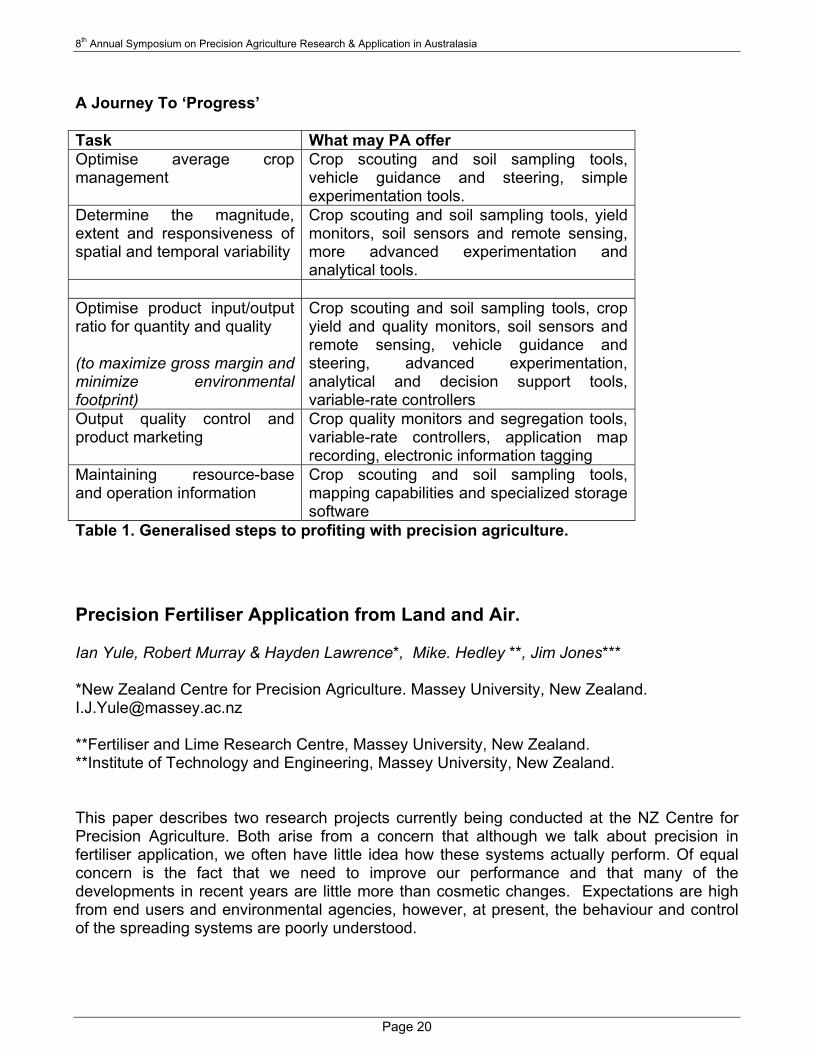
A Journey To ‘Progress’ Task What may PA offer Optimise average crop management
Crop scouting and soil sampling tools, vehicle guidance and steering, simple experimentation tools.
Determine the magnitude, extent and responsiveness of spatial and temporal variability
Crop scouting and soil sampling tools, yield monitors, soil sensors and remote sensing, more advanced experimentation and analytical tools.
Optimise product input/output ratio for quantity and quality (to maximize gross margin and minimize environmental footprint)
Crop scouting and soil sampling tools, crop yield and quality monitors, soil sensors and remote sensing, vehicle guidance and steering, advanced experimentation, analytical and decision support tools, variable-rate controllers
Output quality control and product marketing
Crop quality monitors and segregation tools, variable-rate controllers, application map recording, electronic information tagging
Maintaining resource-base and operation information
Crop scouting and soil sampling tools, mapping capabilities and specialized storage software
Table 1. Generalised steps to profiting with precision agriculture. Precision Fertiliser Application from Land and Air. Ian Yule, Robert Murray & Hayden Lawrence*, Mike. Hedley **, Jim Jones*** *New Zealand Centre for Precision Agriculture. Massey University, New Zealand. [email protected] **Fertiliser and Lime Research Centre, Massey University, New Zealand. **Institute of Technology and Engineering, Massey University, New Zealand. This paper describes two research projects currently being conducted at the NZ Centre for Precision Agriculture. Both arise from a concern that although we talk about precision in fertiliser application, we often have little idea how these systems actually perform. Of equal concern is the fact that we need to improve our performance and that many of the developments in recent years are little more than cosmetic changes. Expectations are high from end users and environmental agencies, however, at present, the behaviour and control of the spreading systems are poorly understood.
Page 20

8th Annual Symposium on Precision Agriculture Research & Application in Australasia
Aerial Topdressing A variable rate application system for aircraft has been under development for a number of years. It is now being used commercially and is attracting considerable interest from farmers mainly in the beef and sheep farming sectors. The scientific basis for the requirements and potential benefits of variable rate fertiliser application to New Zealand hill country pastures was established by Gillingham, et al. (1999)several years ago. It was a problem that at that time did not have a technical solution. The topdressing industry has used GPS for a number of years, mainly guidance assistance through the use of electronic lightbars. Recent innovations have included the recording of spreading tracks, which can then be supplied to farmers. Spreading at 200 km/hr has its technical difficulties and was a major barrier in developing an effective control system. The variable rate control system is capable of shutting off over waterways, varying rates according to an application map (as with land based systems), automatic flow adjustment for speed, preventing double spreading and a number of other features. It is seen as a possible platform that could be used to give more assistance to the pilot whilst providing a farmer with a more efficient means of using fertiliser. The work has been carried out in conjunction with Wanganui Aeroworks and Comtel Ltd, Wanganui, NZ. Ground Spreading One of the first problems facing ground spreader operators is having an adequate system to characterise the performance and behaviour of their spreader. A number of test methods exist through the world, all of which have their limitations. A research project is underway that uses a digital imaging system to record and assess the performance of a fertiliser spreader. The advantages of using this system are that not only can the transverse and longitudinal spread pattern be calculated without the laborious tasks of tray weighing, but individual particles are recorded allowing the size guide number (SGN) and uniformity index (UI) indices to be calculated for different parts of a spread pattern. This will assist operators in developing a better understanding of how to cope with non standardised products. It will also allow material to be tested for SGN and UI before and after spreading so the effectiveness of the machine can be measured. By making measurement easier, efficient and more accurate, it is hoped that it will improve the performance of our spreading fleet and ultimately allowing for the increased adoption of variable rate systems. Economics of Precision Agriculture Tihomir Ancev Faculty of Agriculture, Food and Natural Resources Watt Building A04, The University of Sydney, NSW 2006 & Australian Centre for Precision Agriculture [email protected] Precision agriculture may be viewed as a scientific endeavour to improve the management of agricultural production and together with a related concept of site-specific crop management (SSCM) they imply that the yield response to inputs is not uniform within a heterogeneous agricultural field, but is dependent on the spatial characteristics of the field. Both precision
Page 21

8th Annual Symposium on Precision Agriculture Research & Application in Australasia
agriculture and SSCM may also be viewed as applications of information technology in agriculture Even though the concept of SSCM is intuitive and straightforward, its adoption in farming practice has been limited This lack of practical application of SSCM technologies is a result of several factors. Gathering of information required for devising a SSCM strategy can be quite expensive and time consuming. Many farmers are not willing to incur these costs, in expectation of uncertain gains spread over longer period of time. In addition, any environmental and sustainability gains resulting from SSCM would be distributed among a whole range of stakeholders, and are not exclusive to the adopting farmer. The benefits of SSCM may be divided in three broad categories: immediate private benefits to the farmer, where the profitability of the farm business increases due to SSCM; sustainability benefits –both private and social– where natural resources used in agriculture are maintained at desirable levels over time due to SSCM; and environmental benefits to the society, where the negative environmental impacts from agriculture are reduced due to the SSCM. However, it is extremely difficult to appropriately evaluate these three benefit categories. Most of the literature, and probably most of the farmers, only account for the first benefit category. Because the markets for sustainability and environmental quality are either missing or utterly imperfect, there is a failure to assign correct values for these two benefit categories to the SSCM concept. And when only the most apparent and simplistic benefits are accounted, the SSCM concept is often found unprofitable and is therefore not applied in practice. Even though as technology improves, the costs of SSCM are diminishing, they are still too high for many farmers to realise any profitability from non-uniform crop management. This paper briefly addresses these issues by: (1) providing formal criteria that incorporate all benefit categories pertaining to SSCM technology. These criteria are based on constrained optimisation of an objective function which encompasses both social and private values regarding agricultural production. Specifically, the criterion explicitly includes an environmental damage cost function and the value of information. (2) discussing a procedure for jointly evaluating the concepts of SSCM in discrete management zones and the continuous SSCM concept. (3) proposing a hypothesis testing framework where the designed criteria are used to sequentially test hypotheses and to arrive at the optimal SSCM recommendation. This optimal recommendation can be either of the three: uniform management (one discrete management zone), discrete zone management (with determined number of zones) and continuous management. Plans for an EM data collection protocol Garry O’Leary CSIRO Land and Water Mallee Research Station, Walpeup, Victoria. 3507 garry.o’[email protected] At an EM training day held at Yanco, NSW in July 2001 a proposal was put forward by Dennis Ormesher to develop an industry standard. Dennis secured interest from a number of
Page 22
8th Annual Symposium on Precision Agriculture Research & Application in Australasia
participants and together developed a draft standard. This draft included EM38 operating guidelines as well as some standards. Unfortunately, since that time Dennis sold his business and the task put on the back burner. But the issue remains as relevant as ever. The basic problem is that EM contractors are providing an ever-increasing service to farmers, particularly with precision agriculture applications in mind with varying quality and standards. Whilst there is no question that various quality and standards may be required for particular exercises, what is lacking is clear documentation as to how the data was collected and how accurate it is. Further, some contractors only provide coloured maps that limit subsequent analyses by third-party consultants. It is clear that some basic standards should be agreed to by the industry in general. The Grains Research and Development Corporation was also concerned about this because the problem was widespread across Australia. Consequently, GRDC as part of its Precision Agriculture and Subsoil programmes, has asked CSIRO to coordinate the development of an industry standard for EM mapping. We have canvassed support from a number of EM contractors that are interested in developing this. We propose to hold two meetings during 2004/5 to form an industry committee to carry this forward. An important feature of an industry standard was the need for an enduring nature of such a protocol. The terms of reference proposed are: 1. To provide a generic EM protocol suitable for the broadacre industries (ie. neither
instrument nor industry specific). 2. The protocol should have wide applicability and not be prescriptive in every respect how
EM data is to be documented (ie. essential data only to be prescribed, other data recommended e.g. colours used on maps etc…).
3. The EM protocol should be enduring in nature with incentives to maintain its value. If you are interested in coming to our first meeting and participating please contact Garry O’Leary by email (garry.o’[email protected]), phone (04 2889 6656) or fax (03 5091 7210). Managing Soilborne Diseases Using Precision Agriculture John W Heap & Alan C McKay South Australian Research and Development Institute, GPO Box 397, Adelaide, 5001, SA [email protected] Introduction Most paddocks in Australia are managed as a single uniform unit, based on average measurements for the whole paddock (eg soilborne diseases, soil nutrients). This ignores the variability present in almost every paddock. There are high and low-yielding patches within paddocks, which are often correlated to a range of yield constraints such as shallow soil, disease, sub-soil constraints etc (1). Soilborne disease inoculum, along with other soil microflora and microfauna, are expected to exhibit spatial distribution that reflects the natural and cultural processes within paddocks that influence disease development and dispersal (2).
Page 23
8th Annual Symposium on Precision Agriculture Research & Application in Australasia
Precision Agriculture (PA) uses information about spatial variability to manage zones or patches within paddocks differentially, and is under-pinned by GPS technology. This allows data to be collected, and management applied, at known locations within the paddock, with potential economic and environmental benefits. PA will probably be common practice within 10 to 15 years, and consultants will play a vital role in assisting farmers. Equipment is already available to measure and map variability within paddocks, and machinery can deliver differential management (eg nutrient rate, seeding rate, seed type) to defined areas within paddocks. The challenge for us now is to learn how to interpret spatial paddock data in a reliable and efficient way, so that sensible and economic management decisions can be made and applied to different areas within a paddock. This is where research and commerce is now heading in Australia. The research reported in this paper combines the techniques of PA with the PCR-based pathogen detection technology developed by SARDI and CSIRO. This technology concurrently measures inoculum DNA for a range of diseases in the soil prior to sowing crops (3). The aims of the research are to improve management of soilborne diseases by 1) improving soil sampling within paddocks by using stratified random sampling based on PA management zones; 2) improving risk management by considering relative yield and relative disease risk in PA zones; and 3) exploring the feasibility of applying different management to different parts of the paddock using variable rate technology (VRT). Spatial Data Collection There are many sources of spatial data available for paddocks. These include “proximally-sensed” data such as yield maps, electro-magnetic surveys (EM maps), and elevation maps (DEMs). There are also “remotely-sensed” data such as aerial photographs, satellite reflectance bioimagery (eg NDVI), and gamma-radiometric surveys. These data vary in density (measured values per unit area), but all values can be mapped to a known location within the paddock via GPS. Using Geostatistics to Process Data It is useful to compare and combine values from a range of data sets at points on a regular grid. Often raw data is collected at irregular points, so interpolation is required. Interpolation often employs geo-statistical methods developed in the mining industry that are based on semi-variance (1). PA Management Zone Maps PA maps are constructed by combining and analysing values from various data sets to classify individual points within a paddock as having membership of (typically) two or three distinct management zones. The aim is not to draw direct inferences about the attributes of any zone, but rather to regard the zones as areas within the paddock that are somehow different to one-another. Targeted sampling and measurement at representative points within each zone is then used to quantify any differences between zones. Using the PA Management Zones PA management zones have potential for managing soilborne diseases in several ways: Stratified random sampling Most soil sampling protocols currently use a zig-zag transect pattern across a paddock, without regard to patterns of spatial variability. It is possible to inadvertently bias the
Page 24
8th Annual Symposium on Precision Agriculture Research & Application in Australasia
proportion of cores collected from one management zone compared to another. PA management zones allow consideration of the size and distribution of variability when choosing sampling points, to ensure that each zone is proportionally represented in the composite soil sample. Risk management Analysis of PA management zones often shows that one zone is expected to produce higher yields than the others. It is therefore more significant if this zone is affected by soilborne diseases than would be the case if an inherently low-yielding zone were affected. Growers who do not wish to test each zone for disease inoculum may decide instead to test only the higher-yielding zones to offset the higher risk of crop failure in these zones. As an example, results from a paddock sampled during this research showed that take-all inoculum was highest in the highest-yielding PA management zone. If the grower had used only a whole paddock zig-zag sampling approach, then the average take-all level would have appeared lower, and he would not know that his highest yielding zone was seriously at risk from take-all. Variable-rate technology Modern farm machinery increasingly has the capability to deliver inputs variably, using on-board computers linked to GPS, to known points within the paddock. Examples are variable rate seeders, seed bin switching on air seeders, and variable-rate fertiliser and spray systems. In the future it may be feasible to vary inputs at a fine spatial scale to manage soilborne diseases (Site Specific Crop Management - SSCM). Using the take-all example above, the grower might choose to use a fungicidal seed dressing which reduces the impact of take-all. There is a cost for seed treatment, and so he might decide to sow the more expensive treated seed only in the high-yielding zone threatened by take-all, using seed bin switching in the air seeder driven by a map on a computer mounted in the tractor. Judicious targeted pesticide use potentially has both economic and environmental benefits. Preliminary Results Preliminary research has demonstrated that levels of soilborne disease inoculum DNA are frequently correlated with PA production zones derived from both proximally-sensed and satellite (NDVI) data, and that these correlations have great potential to improve the efficiency and reliability of soil sampling strategies. These correlations also offer the potential for differential disease management at the production zone and SSCM level. Current Research Current research (GRDC DAS 00035; 2003-2007) aims to compare correlations between soilborne disease inoculum DNA and PA management zones constructed using different combinations of proximally- and remotely-sensed data layers. Economic studies will also be undertaken to investigate the commercial application of these techniques. Acknowledgements This research was supported by the Grains Research and Development Corporation (GRDC) of Australia, and the South Australian Research and Development Institute (SARDI). Growers are thanked for kindly making paddocks available for field work. Thanks also to Dr Kathy Ophel-Keller (SARDI), Dr Matthew Adams (Silverfox Solutions), Mr David Roget (CSIRO) and Dr Brett Whelan (ACPA, Univ. Sydney) for technical assistance. Ms. Ina Dumitrescu and Ms. Herdina (SARDI) are thanked for assistance with field work, and Dr Ray Correll (CSIRO)
Page 25
8th Annual Symposium on Precision Agriculture Research & Application in Australasia
provided valuable statistical advice. Staff of the SARDI FCPU Diagnostics lab is thanked for provision of PCR-based soil DNA assays and other laboratory work. References Whelan, B. (2001). Precision Agriculture – An introduction to concepts, analysis and interpretation. University of Sydney, Australia. Ettema, C., and D. Wardle, D. (2002). Spatial soil ecology. Trends in Ecology and Evolution 17 (4): 177-183. Heap, J.W., and McKay, A.C. (2004). Spatial distribution of soilborne disease inoculum DNA in cereal crops and implications for soil sampling protocols. In press. Proceedings of the 3rd Australasian Soilborne Diseases Symposium. Rowland Flat, South Australia, Feb. 8-11, 2004. Identifying Strategies for Profitably using PA Peter Stone on behalf of the CSIRO SIP09 team. CSIRO Sustainable Ecosystems & CSIRO Land & Water [email protected] To get the most value from yield maps, you need them to predict the tonnage of yield in each zone, not just whether it’s low, medium or high. To do this, you clearly need to take account of the season as it unfolds, as well as other things like crop sequence. Ideally, you could combine this seasonal (‘how much yield’) information with spatial (‘where is the yield’) information to make maps that predict yield at harvest. Based on case studies from the northern wheat belt of WA, it looks like there are some simple steps that could make this a possibility… Step 1. By the end of June, you can often predict the average yield in a paddock to within about 0.5 t/ha using nothing more than your rainfall records and some rough estimates of soil water holding capacity. This estimate gets better with time, so that by August it’s often accurate to within about 0.35 t/ha, for the Northern wheat belt of WA. Step 2. It seems that paddock yields are always close to ‘normally distributed’. That means that if you can predict the average yield (as above), we can also help you to predict the maximum and minimum yield. In addition, you can pick all the yields in between, along with the hectares of each that can be expected. That’s pretty useful, but it doesn’t tell you where in the paddock these yields can be found. That’s where… Step 3. A satellite image taken as early as late July shows where in the paddock these different yields will occur. Called an ‘NDVI image’, this shows how much ‘green’ is in different parts of the paddock. As early as July, the parts of the paddock that are most green will end up yielding more than the parts of the paddock that are less green. When combined with steps 1 & 2 above, it can be used to create a map of the yield expected at harvest in the current season. This sort of yield map could beat the problem of history by taking into account both the seasonal and spatial conditions occurring this year, not last year or the years before. By this means it could help to better match inputs with outputs, or even make decisions about which
Page 26
8th Annual Symposium on Precision Agriculture Research & Application in Australasia
parts of a paddock might be cut for hay or left for grain. However it is used, a yield map that predicts this season’s yield distribution is likely to be more valuable than maps that are a blast from the past. By helping to target investment in PA and to make yield maps that are ‘here and now’ rather than ‘history’, we aim to provide an approach to PA that pays reliable dividends every season. Development of assessment tools for management of perennial trellised crops. John-Paul Praat1, Frank Bollen1 and Kenji Irie2 1Supply Chain Systems Group, Hamilton 2Lincoln Technology, Christchurch 1&2Lincoln Ventures Ltd, New Zealand [email protected] Spatial distributions of yield and quality for perennial trellised crops such as kiwifruit and wine grapes can show wide variability on maps. This provides useful information to help assess how crop management and environmental factors have impacted on production and can help with planning future strategies to optimise quality and yield and at the same time minimise variability within product lines. Management can be further improved if timely interventions can be made to address developing quality and / or yield issues using crop management options as the canopy grows, such as pruning or fruit thinning. While management may be optimised on a bay-by-bay basis by experts in the field, field operations are often carried out by unskilled labour, especially in larger operations, and only managed by single supervisors or a few experts. In this case improved information on crop development could benefit decision makers and also provide audit capability. Lincoln Ventures Ltd has been developing tools for characterising perennial fruit crops such as wine grapes and kiwifruit using image based techniques. These tools could be used as surrogate indicators of crop growth potential. Techniques to assess fruiting canopies using video imaging are discussed along with a method for navigation in situations where GPS is unreliable. Grape canopy sensing Canopy management is an important determinant of yield and quality of grapes for winemaking. Several proximal remote systems for assessing grape canopies, trained to Vertical Shoot Positions (VSP), have been assessed. These technologies include laser, ultrasonic and image based techniques. Results show that traditional detailed point quadrat analysis, which has limited application for vineyard wide use, may be replaced by systems using medium quality digital imaging (video) and advanced high-speed real-time image processing. These systems have the potential to provide a cost-effective solution to canopy characterisation. Work over several seasons has progressed from preharvest canopy assessment to multiple assessments during canopy development. Some correlations with juice quality have been found and is discussed along with potential management implications. The sensing system has been developed into a commercial prototype and could be made available to other viticulture researchers to augment existing canopy research programmes as a tool for as a tool to assess canopy architecture.
Page 27
8th Annual Symposium on Precision Agriculture Research & Application in Australasia
Kiwifruit Counting Kiwifruit counting is laborious and difficult to do accurately. It is vital for quality management and yield estimation. As in other industries such as the wine industry, yield estimations are vital for planning capital works and for smooth logistics during harvest. The counting process is carried out by individual growers, their packhouses or consultants with varied levels of success. A new video image based system is described which could count all fruit in a block, if necessary. Limited trials have shown better than 95% accuracy. Navigation without GPS Kiwifruit are typical of high value perennial crops where use of the technologies associated with precision agriculture could potentially see profitable application. However, the majority of kiwifruit are grown on a pergola structure and are surrounding by shelter trees. This limits access to satellites for GPS navigation. Automation of canopy sensing, fruit counting and yield monitoring for this type of crop therefore requires a different orchard navigation system. A system based on wheel sensors and a priori GIS spatial information is described. Assessing the Technical Opportunity to Manage Within-Vineyard Variability Bruno Tisseyre Department of Agricultural and Food Engineering at the Agricultural University of Montpellier, France. Ecole Nationale Supérieure agronomique de Montpellier, chaire de génie rural, bâtiment 21, 2 place Viala 34060 Montpellier cedex France [email protected] The aim of the talk is to focus on the use of previous years’ yield monitor data to develop a Site Specific Management (SSM) technical opportunity index. Due to our research experience, we will mainly consider the case of a perennial cultivations such as grapes. Assuming that yield maps of all crops are a significant information source for SSM adoption, the index we propose could be generalised to other crops. In the first part of this talk we will make a brief overview of the problem of site-specific management, it will also present an existing opportunity index. In the second part, it will present the general aims and features of the technical opportunity index we develop here. The unique feature of our approach is to be based on a model of the within field data and of the variable-rate application controller which will take into account : the inaccuracy of the data, the inaccuracy of the application rate as well as the inaccuracy of the spatial application of the rate controller. Finally, the talk will present the results obtained on a data base of hypothetical fields with a known variability.
Page 28

Southern Precision Agriculture Association - A new association focusing on improved agricultural technologies The Southern Precision Agriculture Association (SPAA) has been
formed to promote the development and adoption of Precision Agriculture (PA) technologies as means of enhancing the profitability and sustainability of crop production systems. It is open to anyone involved or interested in agriculture. Current members include people involved in the production of grains, winegrapes and horticultural crops, such as growers, consultants and researchers. The advent of global positioning systems technology or GPS is beginning to provide significant scope for agricultural industries to accurately measure variation in soils and yields. Mr Malcolm Sargent, a Crystal Brook farmer who is the elected president of the newly formed Southern Precision Agriculture Association or SPAA believes “Precision Agriculture or PA will be an important component in the future of agricultural production” Key funding from the South Australian Grains Industry Trust has enabled the formation of SPAA and is a reflection of the level of adoption of PA in South Australia. Additional training support from FarmBis and the GRDC has further enhanced SPAA’s activities. However, SPAA is interested in all types of agricultural industries – a reflection of the opportunity that exists for everyone interested in PA to learn from shared experiences, and the fact that the management of all crop production systems is subject to the effects of the inherent variability of the land. SPAA also publishes ‘Precision Ag News’, a full colour printed magazine for its members, holds field-days and seminars, and is active in the promotion and conduct of on-farm experimentation on members properties. The committee encourages all those interested in PA to take advantage of the low membership fee of $55 (inc GST) and to contribute to the development of improved crop production systems. Further information is available from Dr Rohan Rainbow, SPAA Executive Officer, who can be contacted on (08) 8842 1568 or by email at [email protected].
SPAA is financially supported by the South Australian Grain Industry Trust, and GRDC
Privacy Statement Personal information collected by us enables us to process your application for membership. Your personal details are used to send newsletters and other SPAA information to you. This information is obtained for the sole use of SPAA and will not be passed on to another third party. For further information regarding privacy and our handling of your personal information please contact us at our using the details on the front of this form.
Precision Agriculture Survey
(please indicate brand/ type currently used) Yield Monitor _______________________________(years)____(interested Y/N)__ Yield Mapping _______________________________(years)____(interested Y/N)__ Variable Rate Machinery ______________________(years)____(interested Y/N)__ GPS Guidance _____________________________(years)____(interested Y/N)__ Mapping Software ___________________________(years)____(interested Y/N)__ Other PA Data collected/ Other issues (eg Electromagnetic mapping)____________ ___________________________________________________________________

A farm business may register 1 Full Member ($55 inc GST) and additional Associate Members who trade in the same business name for a further $27.50 (inc GST) each. Full and Associate Members have the same benefits (newsletters, participation in SPAA run days, conference at member rates, etc).
Please enroll me as a new member & ___ associate member(s) of SPAA
Full Member Grower Consultant Researcher Reseller / Manufacturer
Name __________________________________________________ Trading Name ————————————————————————————
Address __________________________________________________ ________________________________ Postcode__________ Telephone ___________________ Fax ______________________ E-mail __________________________________________________ Associate Member / type
Name ————————————————————————————
Address __________________________________________________ ________________________________ Postcode__________ Telephone ___________________ Fax ______________________ E-mail __________________________________________________
New Membership Form 2004/05 Financial Year
Full Member $55 — Associate Members $27.50 each Make Cheques Payable to: SPAA
Post applications to SPAA PO Box 3993 Clare SA 5453
A tax invoice will be returned made out to the members trading name.
For further information on SPAA please contact: Dr Rohan Rainbow, Executive Officer, SPAA
Ph: (08) 8842 1568 Fax: (08) 8842 1875 E-mail: [email protected]
SPAA Use Only Membership ID…………………………………….. Region Code…………………………….. Associate ID..…...…./….….…./….....…./….....…. Category…...…………………………….. Tax Invoice Number………………………………. Comments……………………………….. Payment Process date……………………………. ……………………………………………. New Membership process date………………….. …………………………………...……….
Method of Payment Full Member $55 — Associate Members $27.50 each
Cheque Make Cheques Payable to: SPAA
Visa Name on Card _________________________________________
Mastercard Card No
Bankcard Expiry Date
Amount $___________ Signature_____________________
Post applications to SPAA PO Box 3993 Clare SA 5453 Or Fax to (08) 8842 1875
A tax invoice will be returned made out to the members trading name.
For further information on SPAA please contact: Dr Rohan Rainbow, Executive & Scientific Officer, SPAA
/