
Prognostic Reliability Analysis of Power Electronics...
12
International Journal of Performability Engineering Vol. 6, No. 5, September 2010, pp. 513-524. © RAMS Consultants Printed in India ________________________________________ *Corresponding author’s email: [email protected] 513 Prognostic Reliability Analysis of Power Electronics Modules CHUNYAN YIN 1* , HUA LU 1 , MAHERA MUSALLAM 2 , CHRIS BAILEY 1 and C MARK JOHNSON 2 1 School of Computing and Mathematical Sciences, University of Greenwich 30 Park Row, London, United Kingdom 2 School of Electrical and Electric Engineering, University of Nottingham, University Park, Nottingham, United Kingdom (Received on October 02, 2009, revised on March 27, 2010) Abstract: This paper describes a physics-of-failure (PoF) based prognostic method for power electronics modules (PEMs). Differing from the traditional reliability prediction methods, this approach allows the reliability performance of PEMs to be assessed in real time. Four techniques have been used to develop this method, they are: (1) Compact electro-thermal model (2) Rainflow counting algorithm (3) Compact thermo-mechanical model and (4) Lifetime consumption model. As a demonstration, this method has been applied to a typical IGBT half bridge module and solder joint fatigue was assumed as the major failure mechanism. In this application, a random electric current load profile was generated in laboratory environment and used to derive the thermal loading condition for the module. Due to the randomness of the load profile, rainflow counting method was used to reduce the continuous load profile into discrete sets of thermal cycles. The damage induced in each temperature cycle was calculated via a compact thermo-mechanical model, and used in the lifetime model to calculate the PEMs lifetimes under simple cyclic loading conditions. Based on these predicted lifetimes and the linear damage accumulation rule, the total consumed life of the PEMs over the whole period of usage was predicted. Keywords: prognostic, reliability, power modules, physics-of-failure 1. Introduction Power electronics modules (PEMs) are power electronics components that contain power semiconductor devices such as the Insulated Gate Bipolar Transistor (IGBT) and Thyristor. These components are used in industries and domestic appliances for the control and conversion of electric currents. Due to the harsh working environments of PEMs, the required reliability standard of such components is often very high [1][2]. In recent years, physics-of-failure (PoF) based reliability analysis and prediction methods have played an increasingly important role in the PEM design and failure analysis. By combining computer modeling and failure mode/mechanism analysis methods, the reliability of PEMs can now be predicted for some common wear-out failure mechanisms such as solder joint fatigue and wirebond lifting. The results of this modern prediction method can be used to identify critical design parameters, and compared to traditional handbook methods they have the potential to provide end users with more accurate estimate of the mean lifetime of the components under qualification test conditions or mission profiles. However, the qualification test conditions and mission profiles are often made up of predetermined cyclic load profiles that in general are very different from the load profiles in service loading condition.
Transcript of Prognostic Reliability Analysis of Power Electronics...

International Journal of Performability Engineering Vol. 6, No. 5, September 2010, pp. 513-524.
© RAMS Consultants Printed in India
________________________________________
*Corresponding author’s email: [email protected] 513
Prognostic Reliability Analysis of Power Electronics Modules
CHUNYAN YIN1*
, HUA LU1, MAHERA MUSALLAM
2, CHRIS BAILEY
1 and
C MARK JOHNSON2
1School of Computing and Mathematical Sciences, University of Greenwich
30 Park Row, London, United Kingdom 2School of Electrical and Electric Engineering, University of Nottingham,
University Park, Nottingham, United Kingdom
(Received on October 02, 2009, revised on March 27, 2010)
Abstract: This paper describes a physics-of-failure (PoF) based prognostic method for
power electronics modules (PEMs). Differing from the traditional reliability prediction
methods, this approach allows the reliability performance of PEMs to be assessed in real
time. Four techniques have been used to develop this method, they are: (1) Compact
electro-thermal model (2) Rainflow counting algorithm (3) Compact thermo-mechanical
model and (4) Lifetime consumption model. As a demonstration, this method has been
applied to a typical IGBT half bridge module and solder joint fatigue was assumed as the
major failure mechanism. In this application, a random electric current load profile was
generated in laboratory environment and used to derive the thermal loading condition for
the module. Due to the randomness of the load profile, rainflow counting method was
used to reduce the continuous load profile into discrete sets of thermal cycles. The damage
induced in each temperature cycle was calculated via a compact thermo-mechanical
model, and used in the lifetime model to calculate the PEMs lifetimes under simple cyclic
loading conditions. Based on these predicted lifetimes and the linear damage accumulation
rule, the total consumed life of the PEMs over the whole period of usage was predicted.
Keywords: prognostic, reliability, power modules, physics-of-failure
1. Introduction
Power electronics modules (PEMs) are power electronics components that contain power
semiconductor devices such as the Insulated Gate Bipolar Transistor (IGBT) and
Thyristor. These components are used in industries and domestic appliances for the
control and conversion of electric currents. Due to the harsh working environments of
PEMs, the required reliability standard of such components is often very high [1][2].
In recent years, physics-of-failure (PoF) based reliability analysis and prediction
methods have played an increasingly important role in the PEM design and failure
analysis. By combining computer modeling and failure mode/mechanism analysis
methods, the reliability of PEMs can now be predicted for some common wear-out failure
mechanisms such as solder joint fatigue and wirebond lifting. The results of this modern
prediction method can be used to identify critical design parameters, and compared to
traditional handbook methods they have the potential to provide end users with more
accurate estimate of the mean lifetime of the components under qualification test
conditions or mission profiles. However, the qualification test conditions and mission
profiles are often made up of predetermined cyclic load profiles that in general are very
different from the load profiles in service loading condition.

Chunyan Yin, Hua Lu, Mahera Musallam, Chris Bailey and C Mark Johnson
514
Under in-service load conditions, load level and frequency change over time
irregularly. Obviously, this makes lifetime prediction methods that are based on
predetermined constant loading conditions not adequate for estimating the remaining life
of the components under the actual application conditions and this is where prognostic
reliability analysis method can play an important role.
The existing prognostic approaches for electronics can be classified into the following
four categories: (1) Fuses or Canaries, (2) Data Driven Methods, (3) Model Driven
Methods, and (4) Fusion technique, which is an integration of the above three methods.
Among these four types of techniques, Model Driven Methods such as the PoF lifetime
model based prognostic methods have been widely used for the lifetime prediction of
products where fatigue/wear out is the major failure mechanism [3][4]. In this method, the
loading conditions of the components are monitored for changes and the real-time
consumed/remaining lifetime of PEMs can be calculated at any time. In this work, this
kind of prognostic method has been applied to a typical IGBT half bridge module used in
aircraft applications, as shown in Figure 1. For PEMs, solder joint fatigue, wirebond
failure and substrate delamination etc., have been identified as the major failure
mechanisms [5][7]. In this work, however, only solder joint fatigue was taken into account
in the analysis.
2. Overview of the Prognostic System
The prognostic method presented in this paper is a model driven approach where PoF
models are used on the data gathered from the IGBT module to estimate the remaining
life. This method consists of four steps:
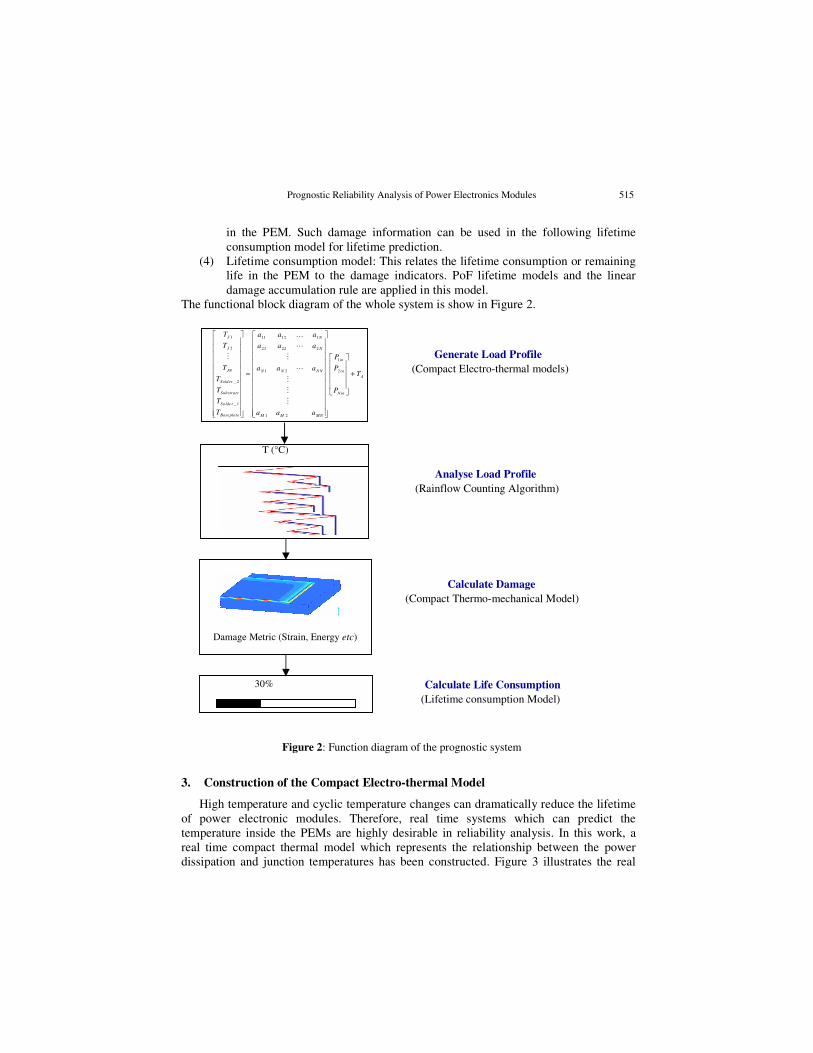
(1) Compact electro-thermal model: A reduced order electro-thermal model is
constructed to establish the relationship between the power dissipation and the
temperature in the PEM. Such relationship can be used for the calculation of the
junction temperatures and temperatures at each interface inside power modules
under variable operation conditions in real time.
(2) Classification of thermal cycles: Because the stochastic nature of the loading that
has been applied, the temperature profile consists of temperature cycles with
different amplitude and mean value. Cycle counting algorithm such as the
rainflow method is used to analyze the temperature profile, so that the number of
cycles for any temperature range can be calculated.
(3) Compact thermo-mechanical model: A reduced order thermo-mechanical model,
which relates the damage indicator (∆εp) to the temperature changes, is
constructed. This model enables the fast calculation of the damage indicator ∆εp
Figure 1: The IGBT power module that was used in the experiment
Prognostic Reliability Analysis of Power Electronics Modules 515
in the PEM. Such damage information can be used in the following lifetime
consumption model for lifetime prediction.
(4) Lifetime consumption model: This relates the lifetime consumption or remaining
life in the PEM to the damage indicators. PoF lifetime models and the linear
damage accumulation rule are applied in this model. The functional block diagram of the whole system is show in Figure 2.
3. Construction of the Compact Electro-thermal Model
High temperature and cyclic temperature changes can dramatically reduce the lifetime
of power electronic modules. Therefore, real time systems which can predict the
temperature inside the PEMs are highly desirable in reliability analysis. In this work, a
real time compact thermal model which represents the relationship between the power
dissipation and junction temperatures has been constructed. Figure 3 illustrates the real
Figure 2: Function diagram of the prognostic system
30%
T (°C)
1 11 12 1
2 21 22 2
1
1 2 2
_ 2
_ 1
1 2
J N
J N
in
JN N N NN in
A
Solder
Substrate Nin
Solder
Baseplate M M MN
T a a a
T a a a
P
T a a a PT
T
T P
T
T a a a
= +
K
L
M M
L
M
M
M
Analyse Load Profile
(Rainflow Counting Algorithm)
Calculate Damage
(Compact Thermo-mechanical Model)
Generate Load Profile
(Compact Electro-thermal models)
Calculate Life Consumption
(Lifetime consumption Model)
Damage Metric (Strain, Energy etc)

516 Chunyan Yin, Hua Lu, Mahera Musallam, Chris Bailey and C Mark Johnson
time implementation of the compact thermal model. This model was developed in
MATLAB/Simulink using the real time software toolbox and implemented on a DSPACE
real time system that incorporates a Pulse Width Modulation card [8].
In order to develop the compact thermal model, the junction temperature of each
active component was measured using infrared thermometer for given power dissipation.
In locations that are hidden from view, numerical analysis using FLOTHERM software
package has been carried out to predict the temperatures. The thermal parameters of the
heat transfer path from any heat source, i.e., the dies, to the hidden layers were
determined. In the end, an N by M transfer function matrix was constructed to represent
the thermal behavior of the whole module as shown in (1), where the terms a11….aMN
represent the transfer function of each heat transfer path, TA is the ambient temperature,
P1in… PNin are the heat sources, TJ1…TJN are the junction temperatures and T_solder_2
etc., are temperatures at other locations within the module [9].
Once the transfer function is constructed for a certain type of PEM, Equation (1) can
be used as an efficient and simple way to calculate the junction temperature and the
temperature inside the PEM in real time. The efficiency and accuracy of this compact
thermal model was tested using several test cases and the details can be found in [8][9].
Figure 3: Real time implementation of compact thermal model
Converter
Controller
Power
Electronic
Converter
Power
dissipation in
Component #1
Power
dissipation in
Component #N
Compact
thermal
model
fs/N
Estimated
temperature
s
1 11 12 1
2 21 22 2
1
1 2 2
_ 2
_1
1 2
(1)
J N
J N
in
JN N N NN in
A
Solder
Substrate Nin
Solder
Baseplate M M MN
T a a a
T a a a
P
T a a a PT
T
T P
T
T a a a
= +
K
L
M M
L
M
M
M
L
Prognostic Reliability Analysis of Power Electronics Modules 517
The output of the compact thermal model is a time series of temperatures that change
with the input electric current and the environment conditions. Cycle counting algorithms
such as the rainflow counting method, can be used to analyze the temperature vs. time
data to extract the occurrence frequencies of different thermal cycling ranges. This
information can then be used in the reduced-order thermo-mechanical model and the
lifetime prediction model to calculate the accumulated physical damage in the PEM. The
rainflow counting method is well described in the literature [10][14].
4. Construction of the Reduced Order Thermo-mechanical Model
4.1 Computational Modeling of the IGBT power module
A typical PEM consists of several layers of different materials that are assembled
together in the packaging process to form power electronic circuits and the mechanical
structure. Due to the mismatch of the coefficients of thermal expansion (CTE) in the
structure, high level stress can be created during temperature changes which can cause
crack initiation, propagation, and eventually failure, especially at the interface between the
different materials. In qualification tests and in-service conditions, the solder joint
degradation and wire bond lift-off are identified as the most common failure mechanisms
in the PEMs [5][6][7].
The reliability of PEMs can be predicted using finite element (FE) method. For low
cycle fatigue failure, this is achieved by calculating the stress and strain in the solder joint
under cyclic thermal loading and then using the accumulated plastic strain to predict the
lifetime of the structure.
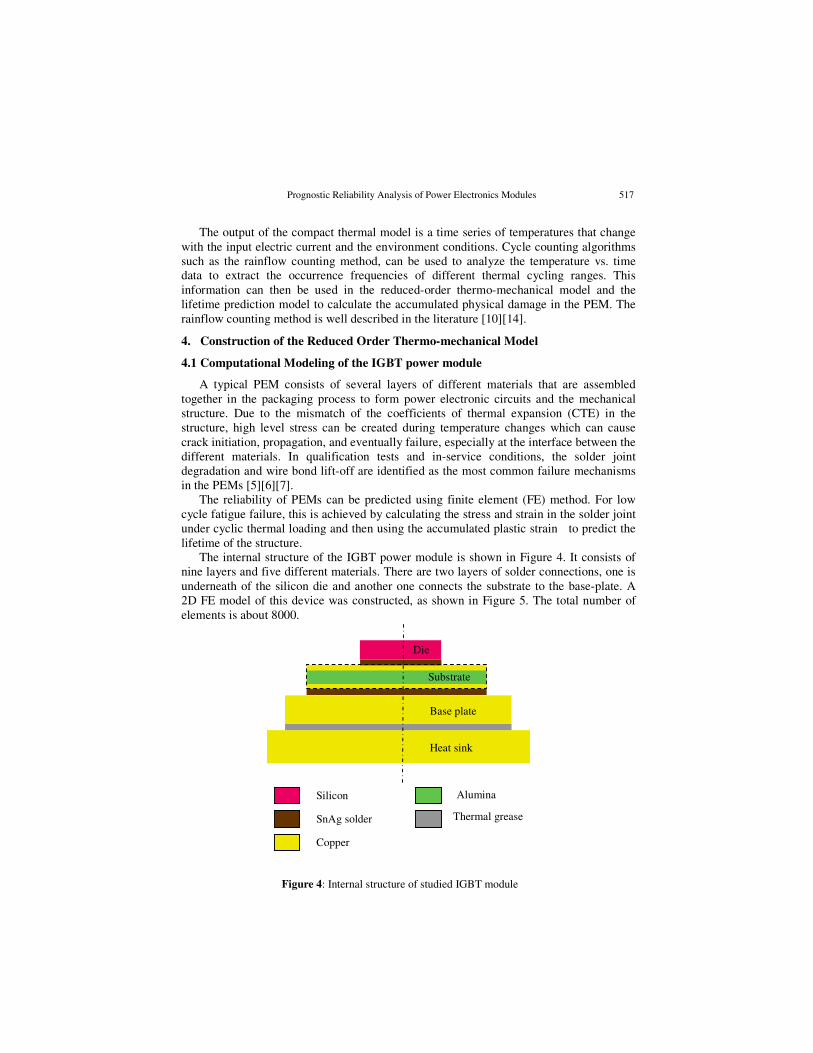
The internal structure of the IGBT power module is shown in Figure 4. It consists of
nine layers and five different materials. There are two layers of solder connections, one is
underneath of the silicon die and another one connects the substrate to the base-plate. A
2D FE model of this device was constructed, as shown in Figure 5. The total number of
elements is about 8000.
Heat sink
Base plate
Substrate
Die
Silicon
SnAg solder
Copper
Alumina
Thermal grease
Figure 4: Internal structure of studied IGBT module

518 Chunyan Yin, Hua Lu, Mahera Musallam, Chris Bailey and C Mark Johnson
This 2D model represents the cross section of the device along the length direction. A
previous study [11] has already proved that there is almost no difference in the von-Mises
stress prediction along the solder substrate interface in 2D and 3D models. In the model,
the thermal grease layer and heat sink were neglected. Instead, their existence was
represented by appropriate boundary conditions on the bottom surface of the base-plate,
i.e., the surface is free to move on the XZ plane, but fixed in the Y direction. A small
crack was also included in the model.
In the simulation, nonlinear material properties of the SnAg solder were used. The
visco-plastic/creep constitutive equation for the SnAg alloy is
( )sinh exp (2)n
cr e
QA
RTε ασ
− = ×
&
where R is the gas constant, T is the temperature in Kelvin, σe is the von Mises equivalent
stress. A, n, α, Q are material constants and their values are listed in Table 1.
Table 1: Creep parameters for solder material [11]
A(s) n α (1/MPa) Q/R
SnAg 9.00E+05 5.5 0.06527 8690
The measured IGBT junction temperature in the lab environment was used as the
loading profile in the computer simulations, as shown in Figure 6.
Figure 6: Measured IGBT junction temperature
Figure 5: 2D FE model of half of the IGBT module
IGBT junction temperature measurements (ºC)
20
30
40
50
60
70
80
0 50 100 150 200
Time (s)
Tem
pera
ture
(C)

Prognostic Reliability Analysis of Power Electronics Modules 519
As mentioned earlier, there are two solder interconnects in the IGBT module. The
lifetimes of these solder layers depend on the stress/stain level, size of the contact area and
temperature variation. Since the solder interconnect underneath the silicon die has much
smaller contact area than the one underneath the substrate in this application, it has been
found to be the interconnect that failed first. Therefore, the damage indicator for the PEM
was defined as the accumulated plastic strain in the solder interconnect underneath the
silicon die. The distribution of the accumulated plastic strain in this solder interconnect at
the end of the third temperature cycle is shown in Figure 7.
4.2 Design of Experiments (DoE) Method
FE is a powerful tool in reliability prediction, but it is not suitable for real time
analysis because it is time consuming. In order to solve this problem, an approximate
compact model has been built using the FE results and the Design of Experiment (DoE)
method. The purpose of DoE analysis is to identify the set of design points at which finite
element analysis will be undertaken to provide predictions for constructing the response
surface (i.e., reduced order model). In this study, a full quadratic function was used to
approximate the response surface. If the number of design variable is two, the
construction of such a polynomial function requires solving linear equations with 6
unknown variables. This means that at least 6 experimental points are required to identify
these coefficients. The DoE method that has been used in this analysis is a composite, full
factorial, D-optimal design with 9 design points.
The two design variables investigated are the mean temperature Tm and temperature
variation ∆T in one electrical switching cycle. The accumulated plastic strain ∆εp in the
solder interconnect was chosen as the damage indicator. As shown in Table 2, 9 points in
the design space were chosen and finite element calculations were carried out at these
design points. The predicted ∆εp and its natural logarithmic values are shown in Table 2.
Die
Substrate
Solder
Crack tip
Figure 7: Accumulated plastic strain distribution

520 Chunyan Yin, Hua Lu, Mahera Musallam, Chris Bailey and C Mark Johnson
Table 2: Design points and correspondent plastic strain
Run No ∆T Tm ∆εp Ln(∆εp)
1 6 38 8.7e-7 -13.954
2 6 48 1.81e-6 -13.22
3 6 58 3.4e-6 -12.59
4 18 38 5.3e-5 -9.845
5 18 48 6.7e-5 -9.611
6 18 58 8.65e-5 -9.355
7 30 38 5.1e-4 -7.581
8 30 48 8.1e-4 -7.118
9 30 58 1.17e-3 -6.75
4.3 Response Surface (RS) Modeling
Once the responses at the designs points are obtained, the next step is to construct an
approximation model to the accumulated plastic strain ∆εp using the least square fitting
technique. The constructed response surface equation of ∆εp related to the two design
parameters is expressed as:
The quality of the RS approximation can be evaluated using a number of techniques in
order to estimate its predictive power and accuracy. The one that is used here is the
coefficient of determination R2, the higher the value of R
2, the better the fitting of the
approximation model. For the above RS function, R2=98.94%. The definition of the
coefficient of determination can be found in Ref. [12].
In order to identify a better fitting function, the RS function of Ln(∆εp) related to the
two design parameters was also constructed, which is
The R2 of this RS function is 99.84%, which indicates that this is a better fitting
function than equation (3) in this design space. Therefore, the RS function (equation 4)
was used to calculate the accumulated plastic strain ∆εp approximately at any points in the
design space, and the predicted ∆εp can be used subsequently in the lifetime prediction
model to estimate the reliability of the PEM in terms of number of cycles to failure. Once
the reduced order model is constructed finite element simulations are not needed any more
and this will greatly reduce the computing time.
5. Lifetime consumption calculation
In order to calculate the lifetime of the solder interconnect, the following strain based
lifetime prediction model for SnAg solder material was used.
where L (mm) is the length of the solder interconnect, NL is the number of cycles needed
for the crack length to reach L, ∆εp is the accumulated plastic strain per cycle, α and b are
material constants, which are 0.00562 and 1.023 respectively [11].
2
2
(558.2 115.8 1.22 2.396
0.1158 1.335 ) /10 6 (3)
p m
m m
T T T
T TT e
ε∆ = − ∆ − + ∆ −
+ ∆
2
2
( ) 15.16 0.4447 0.07882 0.004081
0.00145 0.0009074 (4)
p m
m m
Ln T T T
T TT
ε∆ = − + ∆ − − ∆
+ − ∆
(5)( )
L b
p
LN
a ε=
∆

Prognostic Reliability Analysis of Power Electronics Modules 521
In this particular application, the size of the solder interconnect underneath of the
silicon die is 12 by 12 mm2, the damage criteria of a solder interconnect was defined as
the time it took for the crack to have an area that is 20% of the total solder interconnect
area. Accordingly, the length to crack (L) in the lifetime prediction model was defined as
0.635 mm. Equation (5) was used to calculate the PEM lifetimes under constant loading
conditions. Together with the number of temperature cycles calculated from rainflow
counting analysis, the life consumed for each constant loading profile was obtained. Based
on the Palmgren-Miner’s rule, the total life consumed in the PEM is calculated as:
number of cycles
the structure has been exposed to the ith load profile, which can be achieved from rainflow
counting analysis, Nfi represents the expected lifetime for the ith load profile, which can be
calculated from the stain based lifetime prediction model, i.e., equation (5).
6. Application Example
The above prognostic method was applied to the IGBT power module. In order to take
into account the stochastic property of the loading profile in the actual application
environment, a load profile which consists of a series of steps of random amplitude and
width was created, as shown in Figure 8.
The transfer function matrix (equation 1) was constructed for this IGBT power module
and applied to the above loading profile. The estimated solder layer temperature under this
loading condition is shown in Figure 9.
This temperature profile, which is considered as one load cycle afterward, consists of
cycles of different temperature change amplitudes and mean values. The rainflow
counting algorithm was applied to extract the numbers of cycles with certain temperature
ranges.
Figure 8: Sample of load current profile [13]
31 2
1 2 3
.... (6)k
i k
i fi f f f fk
N N NN NLC
N N N N N= = + +∑

522 Chunyan Yin, Hua Lu, Mahera Musallam, Chris Bailey and C Mark Johnson
After the PEM went through this loading profile for five times, the life consumed was
predicted using the above prognostic method, and the results are summarized in Table 3.
In order to reduce the size of the table, the contributions from the small temperature
change (∆T < 5°C) cycles were ignored, these temperature cycles often result in very
small accumulated strain per cycle and have little contribution to the whole lifetime
consumption. Table 3: Output from the PoF based prognostic method
∆T(°C) (Temperature amplitude) 24.6 25.4 12.4 11.7 < 5
Tm(°C) (Mean temperature) 53.2 53.1 48.1 48.3
No. of cycle (rainflow algorithm) 5 5 5 5 29
Predicted damage ∆εp 3.47e-4 4.02e-4 1.29e-5 1.06e-5
Predicted cycle to failure Nf 3.92e5 3.38e5 1.13e7 1.39e7
Life consumed 1.27e-5 1.48e-5 4.42e-7 4.72e-7
Life consumed total 0.000284%
The lifetime consumption due to the historical usage also indicates how much lifetime
the device has got left if the loading conditions remain the same.
7. Conclusions
PEMs are often used under severe working conditions and in hash environment, the
reliability performance of such devices is a big concern. Traditional reliability methods
developed using constant loading conditions do not take into account the randomness of
service loading conditions, therefore they are not suitable to be used for lifetime
prediction for the products in real time. The prognostic method presented in this paper
allows the reliability performance of PEMs to be assessed in real time. It was developed
using four techniques: Compact electro-thermal model, Cycle counting algorithm,
Compact thermo-mechanical model and Lifetime model. As a demonstration, this method
was applied to an IGBT module for aerospace applications. A random load current profile
Figure 9: Estimated solder layer temperature [13]
IGBT Substrate Solder temperature estimates (°C)
Ambient temperature (°C)

Prognostic Reliability Analysis of Power Electronics Modules 523
was generated in the laboratory environment; the accumulated damage in the PEM over
this usage period was predicted.
Acknowledgment: The authors would like to acknowledge the financial support of the
Innovative electronics Manufacturing Research Centre (IeMRC) for supporting the project
“A Prognostic and Diagnostic Environment for High Reliability Electronic Systems”
(SP/06/03). The authors would like to thank project partners Goodrich Corporation, GE
Aviation, Raytheon System Ltd, Dynex Semiconductor Ltd, Flomerics Ltd, Areva T&D
Ltd and Semelab Ltd for their contribution to the project.
References
[1]. Hamidi, A., N. Beck, K. Thomas, and E. Herr. Reliability and Lifetime Evaluation of
Different Wire Bonding Technologies for High Power IGBT Modules. Microelectronics
Reliability 1999; 39:1153-1158.
[2]. Fock-Sui-Too, J.L., B. Chauchat, P. Austin, M. Mermet-Guyennet, and R. Meuret.
Performance and Reliability Testing of Modern IGBT Devices under Typical Operating
Condicitons of Aeronautic Applications, Microelectronics Reliability 2008; 48:1453-1458.
[3]. Vichare, N. and M.G. Pecht. Prognostic and Health Management of Electronics. IEEE
Transactrions on Components and Packaging Technologies 2006; 29(1): 222-229.
[4]. Vichare, N., P. Rodgers, V. Eveloy, and M. Pecht. Environment and Usage Monitoring of
Electronic Products for Health Assesment and Product Design. Quality Technology and
Quantitative Management 2007; 4(2): 235-250.
[5]. Wernicke, T., A. Middendorf, S. Dieckerhoff, S. Guttowski, H. Reichl. Test System for the
Reliability Mangement of Power Modules, Proceeding of the CIPS conference 2008; 49-53.
[6]. Bailey, C., H. Lu, C. Yin, S. Ridout. Predictive Reliabilitiy, Prognostics and Risk Assesment
for Power Modules. Proceeding of the CIPS conference 2008; 19-25.
[7]. Ye, H., M. Lin, C. Basaran. Failure Modes and FEM Aanlysis of Power Electric Packaging.
Jounral of Finite Elements in Analysis and Design 2002; 38(7): 601-612.
[8]. Musallam, M., C. Buttary, M. C. Johnson, C. Bailey, M. Whitehead. Reduced Order Electro-
Thermal Models for Real-Time Health Management of Power Electronics. Proceeding of the
8th Thermal, Mechanical and Multi-Physics Simulation and Experiments in Micro-Electronics
and Micro-Systems Conference 2007; 548-553.
[9]. Musallam, M., M.C. Johnson. Extraction of Efficient Thermal Modles for Life Limiting
Interfaces in Poer Modules. Proceeding of the 5th Integrated Power Electronics Systems
conference 2008; 333-337.
[10]. Jono, M. Fatigue Damage and Crack Growth under Variable Amplitude Loading with
Reference to the Counting Mehods of Stress-strain Ranges. International Journal of Fatigue
2005; 27:1006-1015.
[11]. Lu, H., T. Tilford, C. Bailey, D.R. Newcombe. Lifetime Prediction for Power Electronics
Module Substrate Mount-down Solder Interconnect. Proceeding of the International
Symposium on High Density Packaging and Microsystem Integration 2007; 40-45.
[12]. http://en.wikipedia.org/wiki/Coefficient_of_determination
[13]. Musallam, M., M.C. Johnson, C.Y. Yin, H. Lu, C. Bailey. Real-Time Life Expectancy
Estimation in Power Modules. Proceeding of the 2nd Electronics System-Integration
Technology Conference 2008; 231-236.
[14]. Anthes, R.J. Modified Rainflow Counting Keeping the Load Sequence. International Journal
of Fatigue 1997; 19( 7): 529-535.

Chunyan Yin, Hua Lu, Mahera Musallam, Chris Bailey and C Mark Johnson
524
Chunyan Yin received her Master degree in material engineering from Harbin Institute of
Technology, China in 1999 and Ph.D. degree in computational science and engineering
from the University of Greenwich, U.K., in 2006. Since 2007, she has been working as a
research fellow within the School of Computer Sciences and Mathematics at the
University of Greenwich. Her current research interests are prognostic, reliability
predictions methods for power electronics.
Hua Lu received his M.Sc. degree in condensed matter physics from Wuhan University,
China in 1988, and he received his Ph.D. degree in computational physics from the
University of Edinburgh, U.K., in 1992. His current research areas are computer
modeling of electronic components, reliability prediction methods, design and
manufacturing optimization methods and their applications. He is now working as a
Reader (Associate Professor) in computational science at the University of Greenwich.
Mahera Musallam received her B.A. degree in electrical engineering from Birzeit
University in Palestine. In 2001 and 2005 she got her Masters degree in ‘Automation and
Control’ and her Ph.D. Degree in ‘Power Electronics and Control’ respectively from the
school of electrical and electronic engineering at Newcastle Upon Tyne University, U.K.
Since 2006 she has been a Research Fellow with the Department of Electrical and
Electronic Engineering, University of Nottingham, U.K. Her current research interests are
prognostics, thermal management and reliability of power electronics in real-time
applications.
Chris Bailey (for his biographical sketch, please refer to page 512 of this issue).
C Mark Johnson received the B.A. degree in engineering and the Ph.D. degree in
electrical engineering from the University of Cambridge, U.K., in 1986 and 1991
respectively. From 1992 to 2003 he was a Lecturer and later Reader at the University of
Newcastle where he led research into Silicon Carbide electronics. In 2003, he was
appointed as Rolls-Royce/RAEng Research Professor of Power Electronic Systems at the
University of Sheffield and in 2006 he was appointed to a personal chair at the University
of Nottingham, where he leads research into power semiconductor devices, power device
packaging, reliability, and thermal management, power module technologies and power
electronic applications. He is a member of the executive committee of the UK IeMRC and
is project manager for the Flagship Project in Power Electronics.