Profit Parabolas: Bringing Science to the Art of Pricing Parabolas: Bringing Science to the Art of...
12
Opportunities for Action in Consumer Markets Profit Parabolas: Bringing Science to the Art of Pricing
-
Upload
nguyenliem -
Category
Documents
-
view
243 -
download
1
Transcript of Profit Parabolas: Bringing Science to the Art of Pricing Parabolas: Bringing Science to the Art of...

Opportunities for Action in Consumer Markets
Profit Parabolas: Bringing Scienceto the Art of Pricing
Profit Parabolas 9/9/03 10:01 AM Page 1

Profit Parabolas: Bringing Science to the Art of Pricing
Pricing is rapidly becoming more science than art.But because the science is complex, most managersstill rely far too heavily on art—or instinct. As a result,they almost always miss the pricing sweet spot andleave millions of dollars of profit and several points ofshare on the table. Learning and applying the scienceof pricing are opportunities to create a new kind ofcompetitive advantage.
Pricing scientifically begins with asking two simplequestions:
• If I increase my product’s price by 1 percent, whatwill happen to profits?
• If I decrease my product’s price by 1 percent, whatwill happen to profits?
If the answer to both questions is that profit declines,you’ve reached the point of maximum profit. In ourexperience, however, fewer than 10 percent of man-agers responsible for pricing decisions can answereither question with any degree of confidence. A powerful, fact-driven tool called the profit parabolacan help.
What Is the Profit Parabola?
The profit parabola, which takes its name from itsshape, shows the total profit pool available at a givenprice. The goal of managing price is to reach thepeak of the parabola—the point of maximum profit.(See Exhibit 1.) Failure to understand how pricingaffects profits along the parabola can lead to serious
Profit Parabolas 9/9/03 10:01 AM Page 2

mistakes. For example, the three major competitors in the fast-food industry were locked in a lethal pricewar not long ago—all attempting to improve theirconsumer value propositions with price cuts. However,they hadn’t understood the full implications of theprofit parabola. The price reductions increased vol-ume—but not enough to offset margin decreases. The corporate parents continued to earn their feeroyalties, but the franchisees suffered considerabledeclines in margins. Those results could have beenavoided if the participants had used the profit parabo-la correctly and selectively applied pricing stimuli tothe right products and value packages.
Profit parabolas are the next frontier of pricing sci-ence. Applied appropriately, they can boost profitsand devastate competitors. To create a first-generationprofit parabola, you will need specific analytical andtesting capabilities and a comprehensive database forfive key inputs:
1. Current price and volume
2. A range of historical prices and corresponding vol-umes to determine elasticity, or consumer demand
Price
Profit
SOURCE: BCG analysis.
Exhibit 1. The Parabola’s Point of Maximum Profit
Profit Parabolas 9/9/03 10:01 AM Page 3
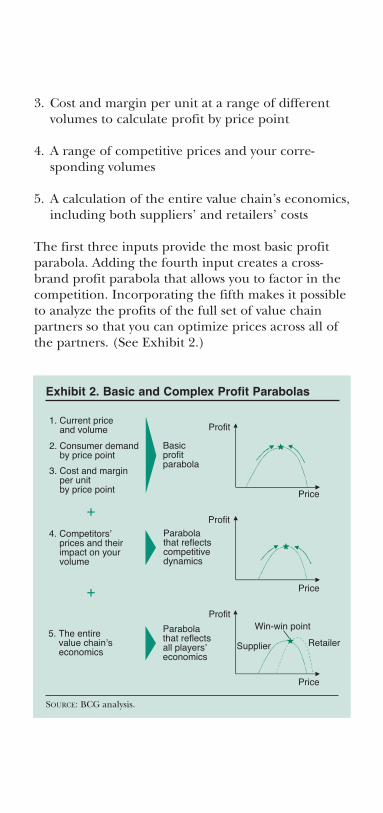
3. Cost and margin per unit at a range of differentvolumes to calculate profit by price point
4. A range of competitive prices and your corre-sponding volumes
5. A calculation of the entire value chain’s economics,including both suppliers’ and retailers’ costs
The first three inputs provide the most basic profitparabola. Adding the fourth input creates a cross-brand profit parabola that allows you to factor in thecompetition. Incorporating the fifth makes it possibleto analyze the profits of the full set of value chainpartners so that you can optimize prices across all ofthe partners. (See Exhibit 2.)
1. Current price and volume
Price
Profit
2. Consumer demand by price point
3. Cost and margin per unit by price point
Basicprofitparabola
4. Competitors’ prices and their impact on your volume
Parabola that reflectscompetitivedynamics
5. The entire value chain’s economics
Parabola that reflectsall players’economics
+
Supplier Retailer
Win-win point
+
Profit
Price
Profit
Price
SOURCE: BCG analysis.
Exhibit 2. Basic and Complex Profit Parabolas
Profit Parabolas 9/9/03 10:01 AM Page 4

Using the Profit Parabola
The effective use of the profit parabola requires adeep understanding of consumer demand, competi-tors’ prices, the profit pool, and the profit pool split.
Consumer Demand. Consumer demand for a productat a range of price points is expressed through elastic-ity. Elasticity is simply the change in volume for a 1percent change in price, everything else being con-stant. What is difficult about measuring elasticity isholding everything else constant. Merchandising con-ditions, competitors’ prices, holidays, and a variety ofother factors can influence consumers’ purchases andconfound the impact of price alone. Retailers use var-ious methods to work around such problems.
A leading food retailer, for example, calculated elas-ticity for a portion of its product line and found prod-ucts with demand curves like the one in Exhibit 3.When prices fell by 50 percent, volume increasedmore than six times. Other products were much
2x
4x
6x
8x
10x
12x
0x 0.5x 1.0x 1.5x
Weeklyvolumerelative toaveragedemand(index)
Price relative toaverage price (index)
Volume increases more than six times with a 50 percent reduction in price
SOURCE: BCG analysis.
Exhibit 3. A Typical Pricing-Elasticity Demand Curve
Profit Parabolas 9/9/03 10:01 AM Page 5

less elastic. Using these elasticities, the retailer was able to segment its products into different families.Products that had high elasticities and brought peo-ple into the store were candidates for decreases inprice. Products that had low elasticities but were likelyto be bought once someone was in the store (im-pulse purchases, for example) were candidates forfewer promotions and could even be considered for price increases. In the past, the retailer’s approachto price promotions had been sporadic and unsystem-atic. Now, armed with this new knowledge, it was ableto unlock potential increases of $650 million in salesand $100 million in profits. What’s more, the changesthat would bring such gains were easier to executeand test than many other opportunities of compara-ble size.
Competitors’ Prices. Cross-price elasticity (or theimpact of competitors’ prices on a product’s sales) isprobably the most poorly managed element of thepricing parabola. Managers, salespeople, and WallStreet analysts all keep an eye on competitive pricegaps, yet few companies understand their own prod-ucts’ cross-price elasticities. Is cross-price elasticityconstant across a wide range of price gaps? Or can abrand sustain its market share as long as it doesn’tallow the gap to exceed a certain threshold? How, and against which competitors, should price gaps bemeasured?
Most managers answer these questions with a combi-nation of instinct and company folklore. Even whencompanies have studied these issues, the answers tendto come back so buried in statistical arcana that theorganizations aren’t able to act on them.
Exhibit 4 shows what one packaged-goods companyfound when we analyzed the cross-price elasticitybetween its own brand and a private-label offering.
Profit Parabolas 9/9/03 10:01 AM Page 6

Each time the price gap between its brand and itscompetitor’s private label increased, the company’ssales fell sharply. The correlation was unmistakable.Many brands have an equally direct relationshipbetween price gaps and sales. The key is to developthe data that can allow these relationships to be seen.
The Profit Pool. The profit for the entire value chainis simply the sum of the manufacturer’s profits andthe retailer’s profits. This pool is probably the easiestelement of the profit parabola to understand and cal-culate. Understanding the total profit pool at everyprice point can help manufacturers and retailersdetermine whether certain price points (a two-for-onepromotion, for example) are worth contemplating.
The Profit Pool Split. Once managers understandhow volume and profitability vary by price point, theycan begin to take control of one of the most con-tentious aspects of price changes: renegotiating themanufacturer/retailer margin split. Many brand man-agers, when trying to change prices, find themselves
0
0.5
1.0
1.5
2.0
–5
–3
–1
1
3
5
Unit sales per week(millions)
Price gapper unit(cents)
SOURCE: BCG analysis.
Exhibit 4. A Typical Analysis of Cross-Price Elasticity
Profit Parabolas 9/9/03 10:01 AM Page 7

beholden either to retailers directly or to their salesforce’s claims about retailers. The profit parabola can-not in itself change this dynamic. It can, however,illustrate how much value is created by a price changeand thus make clear how much money a manufactur-er is giving away by keeping the retailer’s margin, orpenny profit, fixed.
Our experience with a packaged-goods supplier illustrates how powerful this approach can be. Themanufacturer analyzed its primary brands at a leadingretailer and discovered that it was on the far side ofthe peak for both its own profit parabola and theprofit parabola of the manufacturer and retailer com-bined. Most strikingly, the manufacturer found thatthe price elasticity for consumers at that particular re-tailer was nearly three times higher than at otherretailers. As a result, there was a much greater oppor-tunity to drive profits with lower consumer pricing.
The manufacturer developed a new consumer-pricingand promotion strategy for a selection of its products,giving up some margin per unit in order to drivegreater overall profitability and share. More impor-tant, the retailer recognized the value of the opportu-nity and also agreed to take a lower margin per unitin the interest of increasing overall profits. Workingtogether, the manufacturer and the retailer were ableto achieve consumer price reductions of approxi-mately 10 percent, with total profit increases of 20 to30 percent.
Once the database of price points, volumes, revenues,and profits is established, the profit parabola can gen-erate many opportunities for discussions founded onfacts rather than opinions. The parabola allows managers to be much more explicit, scientific, andprecise about the share and profit tradeoffs that aprice change entails.
Profit Parabolas 9/9/03 10:01 AM Page 8

Dealing with Value Chain Partners: Retailers, Distributors, and Suppliers
When a company understands the impact of pricechanges in a concrete way, it can dramatically alterthe competitive landscape of an entire industry. Theprofit parabola can help manufacturers both in nego-tiations with their suppliers and distributors and indiscussions with retailers about how the profit pool is split.
One of the most frequent reasons manufacturers givefor not raising prices is that Wal-Mart won’t accept aprice increase. As noted above, a profit parabola forthe entire value chain—one that calculates the wholeprofit pool, not just the manufacturer’s share—candemonstrate to retailers the overwhelming impact onprofits of a small price change. In some cases, thisinformation alone can help persuade retailers toincrease prices. For retailers that remain philosophi-cally opposed to price increases, using profit parabo-las to reset pricing across a product line can create apowerful argument for change: “If we raise the priceof product A by 3 percent, we can afford to lower theprice of product B by 4 percent. We’ll make moremoney and improve our consumer value proposition.”Since profit parabolas foster fact-based discussions,they counter the need for aggressive, one-sided nego-tiations.
What about decreasing prices? We often hear the fol-lowing complaint: “The trade would love it, but wewould reduce our profits.” Again, the profit parabolafor the entire value chain can demonstrate the profitpotential of a lower price point. Sales forces can thenuse the profit parabola in a discussion about chang-ing the distribution of profits at that new point. Forexample, a promotion that drops the price at theexpense of the manufacturer (while maintaining the
Profit Parabolas 9/9/03 10:01 AM Page 9

retailer’s margin) will likely drive substantial volumebut not the manufacturer’s profit. Manufacturers,however, can use the profit parabola to persuaderetailers to share the burden. By demonstrating thevolume potential of the promotion, a manufacturercan show that a decrease in price will be profitable forboth parties, even with a lower margin for the retailer.
Understanding the Impact of Competitive Response
Profit parabolas and cross-price elasticity can also beused to help you understand what kind of impactcompetitors’ reactions to price changes have on yourshares and profits. One of the most frequent reasonsthat retailers give for not increasing price is, “Whatwill our competitors do?” A profit parabola that trackscross-price elasticity can help you calculate the impacton your market share and profits when a competitorresponds—or doesn’t respond—to your price change.Although the profit parabola cannot predict the likeli-hood of a competitive reaction (it takes a thoroughcompetitive analysis to do that), it does lead to a moreinformed understanding of the consequences of areaction.
* * *
A company with a strong pricing capability can sharp-en its customer segmentation and use its deeperknowledge of each segment to fine-tune prices. It canmonitor competitors’ prices and learn how their pric-ing affects its own position, enabling it to respondintelligently to competitors’ moves or ignore them. Itcan test incrementally new or radically different pric-ing offers. It can bundle—or unbundle—productsand services.
Profit Parabolas 9/9/03 10:01 AM Page 10

Most important, a company with a strong pricingcapability can orchestrate the implementation of pric-ing policies and strategies throughout the organiza-tion in a disciplined, timely fashion.
Marin GjajaSims HulingsPeter Stanger
Marin Gjaja is a vice president and director and SimsHulings a manager in the Chicago office of The BostonConsulting Group. Peter Stanger is a vice president anddirector in the firm’s Toronto office and leader of the PricingInnovation topic area in the Americas.
You may contact the authors by e-mail at:
© The Boston Consulting Group, Inc. 2003. All rights reserved.
Profit Parabolas 9/9/03 10:01 AM Page 11

AmsterdamAthensAtlantaAucklandBangkokBarcelonaBeijingBerlinBostonBrusselsBudapestBuenos AiresChicagoCologneCopenhagenDallasDüsseldorfFrankfurt HamburgHelsinki
Hong KongHoustonIstanbulJakartaKuala LumpurLisbonLondonLos AngelesMadridMelbourneMexico CityMiamiMilan MonterreyMoscowMumbaiMunichNew DelhiNew YorkOslo
ParisRomeSan FranciscoSantiagoSão PauloSeoulShanghaiSingaporeStockholmStuttgartSydneyTaipeiTokyoTorontoViennaWarsawWashingtonZürich
www.bcg.com
BCG9/03
Profit Parabolas 9/9/03 10:01 AM Page 12