Profile of the Three Study Sites · 2018. 12. 11. · 15 II. Profile of the Three Study Sites . The...
86
15 II. Profile of the Three Study Sites The three cities selected for this study are located in Negros Island, Northern Luzon and the National Capital Region (NCR) or Metro Manila (MM). Quezon City, MM has the biggest population and the most number of barangays. San Carlos City, Negros Occidental is second in land area but has the least waste generation per capita. San Fernando City, La Union although smaller in land area is more urbanized. It hosts major businesses, financial institutions, regional offices, universities and colleges in Region 1. Figure 1: Philippine Map and the Location of the Three Study Sites
Transcript of Profile of the Three Study Sites · 2018. 12. 11. · 15 II. Profile of the Three Study Sites . The...

15
II. Profile of the Three Study Sites
The three cities selected for this study are located in Negros Island, Northern Luzon
and the National Capital Region (NCR) or Metro Manila (MM). Quezon City, MM
has the biggest population and the most number of barangays. San Carlos City,
Negros Occidental is second in land area but has the least waste generation per capita.
San Fernando City, La Union although smaller in land area is more urbanized. It
hosts major businesses, financial institutions, regional offices, universities and
colleges in Region 1.
Figure 1: Philippine Map and the Location of the Three Study Sites

16
All three cities have designed their SWM systems and programs to comply with the
requirements of the Ecological SWM Act of 2000 (RA 9003), although the level of
compliance and effectiveness differ in different cities and its barangays. Table 1
provides the brief SWM profile of the three study sites. A more detailed discussion of
each study site is presented in the next sections.
Table 1: SWM Profile of the Three Study Sites Particulars San Carlos City San Fernando City Quezon City
Land Area 45. 150 hectares 10,526 hectares 161,112.12 hectares
Population 129,809 (2007) 111,919 (2004) 142, 304 (2014 estimated)
2,861,081 (2009)
Number of households
22,166 (2011) 16,000 (2003) 535,890 (2009)
Number of barangays
18 59 152
Number of rural barangays
6 34 None
Number of urban barangays
12 25 152
SWM Organizational structure
Solid Waste Management Office under the Office of the City Mayor
General Services Office for collection and Disposal City Environment and Natural Resources Office for IEC and monitoring, technical assistance to barangay SWM programs
Environmental Protection and Management Department (EPWMD)
SWM Budget
PhP5.3 million for garbage collection; PhP3.8 million for Eco-center Operations (including SLF and MRF); PhP1.3 million for IEC; PhP4.7 million Maintenance of City Lanes (Street sweepers) (2011)
PhP15 million for collection and personnel services; PhP300,000 SLF operations; PhP2.5 million- subsidy to barangay collection PhP5.5 million for SLF operations (2011)
PhP630 million for collection; PhP180 million for operations and closure of controlled disposal facility (2008); PhP718 million for garbage collection package and PhP180 million for disposal (2010);

17
Particulars San Carlos City San Fernando City Quezon City PhP22 million for operating the SLF (2011)
Per capita waste generation/per day
.44 kg .3 kg / in rural areas .5 kg in urban areas
.66 kg
Waste generation/day
64 tons (2011) 617 .5 tons (2011) 1,889 (2009)
Sources: Collated from the LGU reports
II.1. Case Study A: San Carlos City, Negros Occidental
LGU Profile
The City of San Carlos is located at the northeast part of Negros Island. The city is at
the crossroads of four major cities in the Visayas: Cebu City, Bacolod City, Iloilo City
and Dumaguete City. Based on the August 2007 census, it has a population of
129,809 people and a total land area of 45.150 hectares. Sixty nine percent of its total
land area is classified as agricultural land planted to sugarcane (main crop), rice, corn
and some high value crops such as coffee, cabbage, carrots and other crops. It is also
developing its Agro-Industrial Economic Zone where San Carlos Bioenergy, Inc.
(SCBI) - the country's First Fuel Bioethanol and Co-generation Facility, is situated.
San Carlos City is politically subdivided into 18 barangays. There are 6 urban
barangays, 6 rural barangays and 6 coastal and island barangays. The city is
accessible by land through major arterial highways of the province and by sea through
its own national seaport. The people of San Carlos City speak the Ilonggo and
Cebuano dialects1
.
Solid Waste Profile
Based on the City’s Ten Year SWM Plan, the total solid waste generation of the
projected total population of 40,162 is 17,671.28 kg in 2011. The waste analysis and
characterization study conducted by GENESYS foundation show the following key
results: 1 http://www.swm4lgus.net/partner-lgu/SanCarlosCity.php

18
Table 2: San Carlos City Waste Profile Particulars Percentage/Amount
1. Per capita waste generation .44 kg/day
2. Biodegradable waste generated 65.17%
3. Recyclable waste generated 20.25%
4. Residual and special waste generated 14.58%
Source: San Carlos City Ten Year Solid Waste Management Plan 2000-2010
SWM System
The SWM Program of San Carlos City is included in its Twenty Year Master
Development Plan (2000-2020) as part of the City’s environmental protection
component. The Master Plan also provided for the construction of a sanitary landfill.
On February 14, 2002 the City created its Solid Waste Management Board. San
Carlos City’s SWM Board has since then bagged the Hall of Fame Award for winning
the Model Solid Waste Management Board award for the three consecutive years
2008, 2009 and 2010.
In 2004, it passed an Executive Order for the “ No Segregation, No Collection
Policy”. San Carlos completed its Ten Year SWM Plan in 2006 with the assistance
from the German Development Service (which merged with the GIZ in 2011).
In 2002, the City in cooperation with the Global Environment and Nature Ecosystems
Society (GENESYS) Foundation embarked on a four year massive information,
education and communication (IEC) campaign entitled “A Lifestyle Change Project”
covering the 18 barangays of the city. The focus of the Lifestyle Change Project is to
promote waste diversion at source. During the first year IEC efforts focused on the
lowland urban areas; the 2nd year on lowland and upland rural areas; the 3rd year on
monitoring and evaluation of barangay SWM implementation; and the 4th year on the
installation of a participative monitoring and evaluation system. The barangay health
19
workers, barangay tanods, purok leaders and day care workers were all trained to
conduct the IEC campaign in their communities.
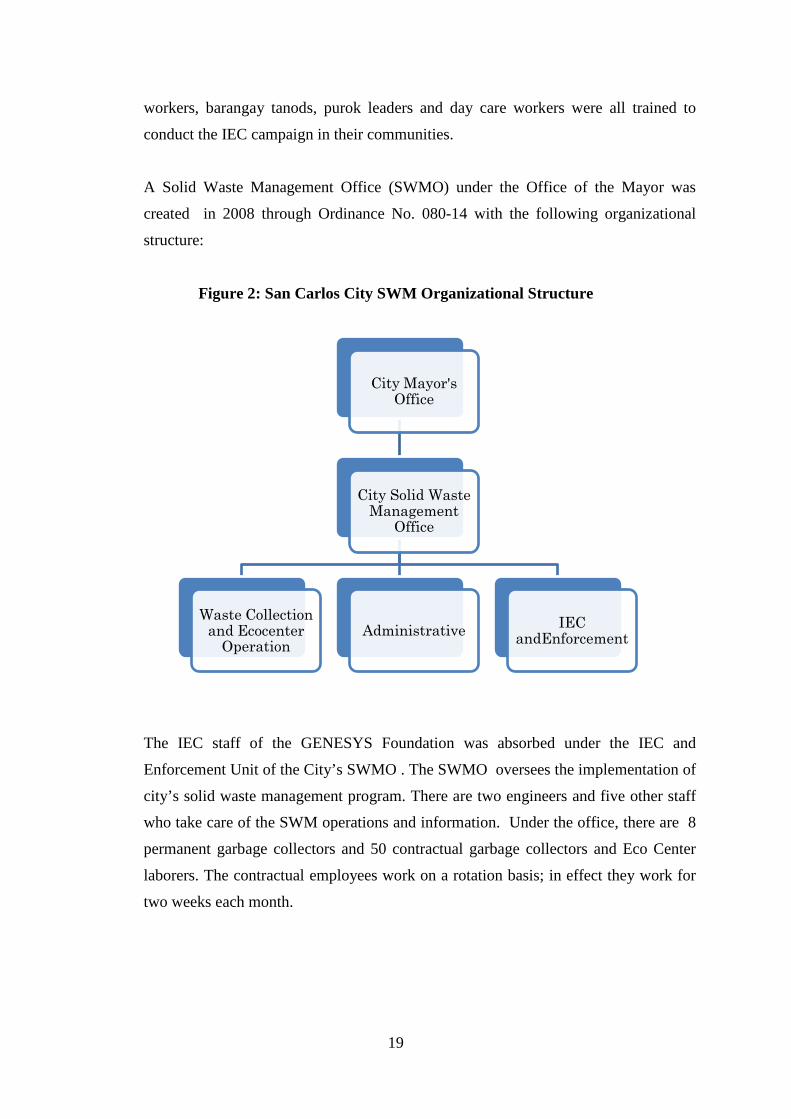
A Solid Waste Management Office (SWMO) under the Office of the Mayor was
created in 2008 through Ordinance No. 080-14 with the following organizational
structure:
Figure 2: San Carlos City SWM Organizational Structure
The IEC staff of the GENESYS Foundation was absorbed under the IEC and
Enforcement Unit of the City’s SWMO . The SWMO oversees the implementation of
city’s solid waste management program. There are two engineers and five other staff
who take care of the SWM operations and information. Under the office, there are 8
permanent garbage collectors and 50 contractual garbage collectors and Eco Center
laborers. The contractual employees work on a rotation basis; in effect they work for
two weeks each month.
City Mayor's Office
City Solid Waste Management
Office
Waste Collection and Ecocenter
OperationAdministrative IEC
andEnforcement

20
Segregation at Source and SWM Practices
The City’s Ten Year SWM Plan calls for the segregation of solid waste into
biodegradable, non-biodegradable and toxic/hazardous waste. In compliance with RA
9003, the City requires the barangays to be responsible for the segregation and
collection of recyclables and biodegradable wastes and to establish their respective
materials recovery facilities (MRFs). The four year IEC campaign was conducted in
order to support the Plan implementation.
Key informants from urban and rural barangays were interviewed during the study.
Regarding segregation at source, the urban respondents were more aware of the three
types of wastes while majority of the rural respondents were more aware of the
biodegradable and non-biodegradable waste classification. Key informants in both
urban and rural barangays were all aware of the ban on open burning of waste but to
a lesser degree not as aware of the law on anti-littering and dumping of wastes.
Seventy five of the rural key informants rated LGU performance on SWM as “very
good”; while only 60% of the urban respondents gave the same rating. Only one
respondent rated SWM services as “poor” because he observed that anti-littering is
not effectively enforced. Reasons for the good SWM performance rating are the
regular collection schedule and good information dissemination.
Regarding management of specific types of wastes, both rural and urban key
informants sell the following to the itinerant waste buyers: glass bottles, tin cans,
PET bottles, plastic containers, and aluminum (urban only).
Rural residents give their paper and plastic bags to their MRFs; although a few also
drop off bottles and plastic containers at their MRFs. Sixty percent of urban residents
give their yard waste to the garbage truck. Only 40 % give their kitchen waste to the
garbage truck. Majority of the respondents reuse their kitchen waste as animal feed.
Waste Collection and Transport
The garbage collection system in the urban area or the city proper is done 8-hours
daily on Sunday, which covers only 6 urban and 2 upland/sub-urban barangays out of

21
18 barangays. Waste generators in the 18 barangays are required to separate the
biodegradable from the non-biodegradable wastes. Biodegradable wastes are collected
daily while non-biodegradable wastes are collected twice a week in urban barangays.
On the other hand, the rest of the rural barangays which are not covered by the city’s
collection system bring their residual wastes to the Eco-Waste Management and
Recycling Center for final disposal.
Three out of the 18 barangyas have an average budget for collection of about PhP
25,000 per year. These are Barangays Quezon, Codcod and Punao. The average daily
collection of waste is about 17 to 20 tons. The city collection consists of 3 compactor
trucks and 2 open-dump trucks; most of which are old and break down often. Each
truck has a garbage collection team made up of the driver, 3 paleros and 1 monitoring
officer. The latter checks if the garbage is properly segregated and gives notice to
waste generators if they have not properly complied with the segregation
requirement 2
. According to the SWMO, they consider their segregated waste
collection as 95% successful. Five percent of the biodegradable wastes collected are
mixed with residual wastes so that this fraction is landfilled instead of being
composted.
Waste Disposal
Closure and Rehabilitation of the Old Dumpsite
The City converted their old 0.90 hectare open dump (which was operated since
1990’s) in Brgy. 1, Villarante Village to a controlled dumpsite in August 2006. It
ceased its operation a day after the opening of the new Eco-Waste Management and
Recycling Center on September 13, 2007. With a PhP 2.0 million allocation from the
city, the physical closure of the old dumpsite was initiated in May 2008 utilizing
biological treatment technology. The entire dumpsite was covered with a 45-cm. clay
material final cover with an addition of a 15-cm. top soil cover to allow vegetation
growth and to stabilize the slope protection layer. Five gas vents were also installed
for controlling possible methane gas migration. In 2010, the status of
closure/rehabilitation was already completed.
2 Ibid.
22
Sanitary Landfill Establishment
San Carlos City has a six hectare sanitary landfill facility located at Sitio Mabuni,
Barangay Guadalupe and which started its operations on September 13, 2007. The
total construction cost of the SLF was PhP7.5 million and with an annual operation
cost of PhP3.75 million. It has a projected life span of 20 years. The SLF site is under
a lease agreement of ten years with a private landowner.
The sanitary landfill at the Eco Center receives 5 tons per day of residuals (31% out
of the 17-20 tons daily collection of waste). To enhance the treatment process of the
leachate from SLF, an aeration chamber was added and vetiver grass was planted at
the last chamber to serve as biological treatment known as ‘reed-bed’ treatment
system. This has resulted to significant reduction of contaminants thus improving
water quality prior to its final discharge to the environment.
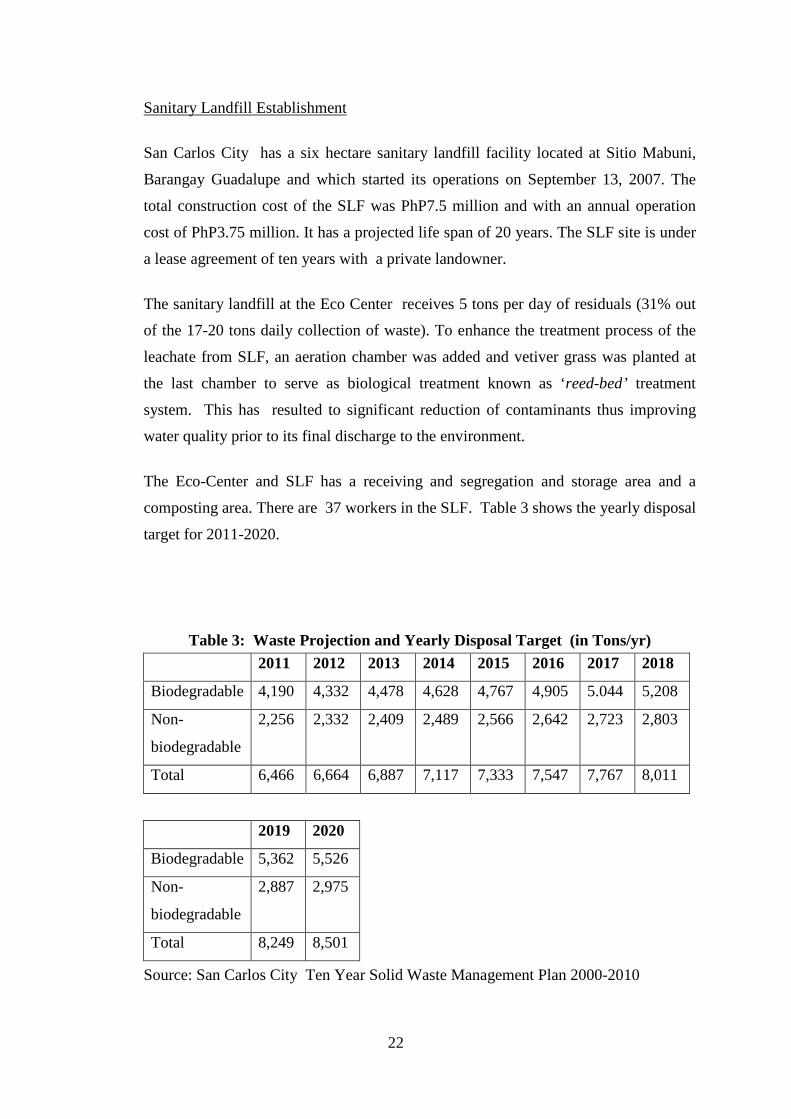
The Eco-Center and SLF has a receiving and segregation and storage area and a
composting area. There are 37 workers in the SLF. Table 3 shows the yearly disposal
target for 2011-2020.
Table 3: Waste Projection and Yearly Disposal Target (in Tons/yr) 2011 2012 2013 2014 2015 2016 2017 2018
Biodegradable 4,190 4,332 4,478 4,628 4,767 4,905 5.044 5,208
Non-
biodegradable
2,256 2,332 2,409 2,489 2,566 2,642 2,723 2,803
Total 6,466 6,664 6,887 7,117 7,333 7,547 7,767 8,011
2019 2020
Biodegradable 5,362 5,526
Non-
biodegradable
2,887 2,975
Total 8,249 8,501
Source: San Carlos City Ten Year Solid Waste Management Plan 2000-2010

23
Based on its 2004 Waste Characterization Study (WACS) residual wastes include
used diapers and sanitary napkins, sand and gravel, cloth/textiles leather and used
tires. In the ocular visit to the SCC landfill, the researchers also saw other residual
wastes such as single use plastic bags, Styrofoam and laminates.
Special wastes included in its WACS are pre-treated hospital wastes, spent
fluorescent lights, batteries, broken glass, tires and rubber.
Cost Recovery
Presently, the city government is on the drafting stage of its comprehensive SWM
Ordinance with cost-recovery mechanism. In line with the cost recovery initiative, the
city established an account entitled Trust Liability Account No. 439 under the
General Fund where all the sales of compost and recyclable materials are deposited.
It is supported by City Ordinance No. 07-14 which allows the solid waste
management office to sell compost and recyclables out from the processed materials.
In December 2010, a total of PhP 1.07 million was deposited in the SWM Trust Fund
Account from the sales of compost and recyclables (PhP 468,000) and from cash
awards from various contests (PhP 610,000). Another income from the garbage
collection fee of about PhP 148,000 was generated from business establishment went
to the city’s General Fund Account. Thus, a total of PhP 1.2 million has been
accumulated for Calendar Year 2010 in line with the city’s cost recovery measures for
SWM 3
.
Recyclable Waste Flow
An overview of the recyclable waste flow in San Carlos City (SCC) is shown in
Figure 3. Recyclables flow through the formal collection system of the City managed
garbage collection system, school recovery systems, the materials recovery facilities
of the barangays and the San Carlos City Eco Center. From waste generators,
recyclables also flow through the itinerant waste buyers and junkshops. Junkshops
from nearby municipalities also trade through the SCC junkshops. From the SCC
junkshops, the recyclables are brought and sold to Bacolod City or Metro Cebu and
3 Ibid.
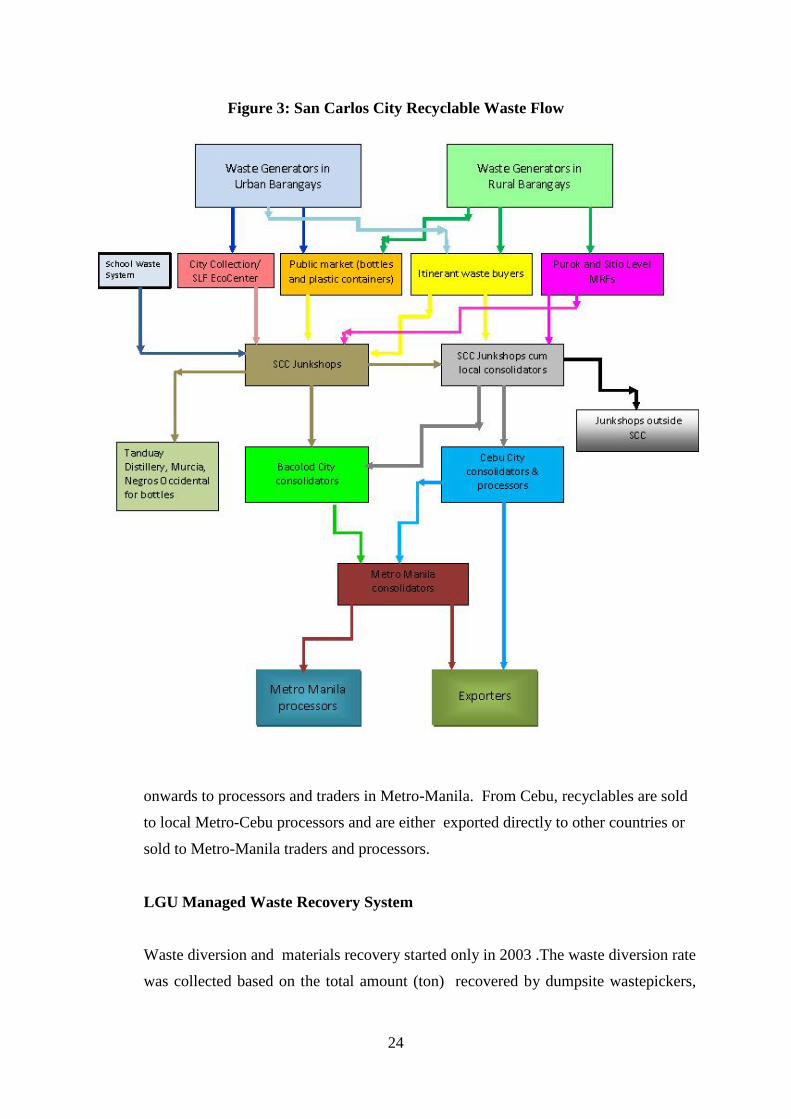
24
Figure 3: San Carlos City Recyclable Waste Flow
onwards to processors and traders in Metro-Manila. From Cebu, recyclables are sold
to local Metro-Cebu processors and are either exported directly to other countries or
sold to Metro-Manila traders and processors.
LGU Managed Waste Recovery System
Waste diversion and materials recovery started only in 2003 .The waste diversion rate
was collected based on the total amount (ton) recovered by dumpsite wastepickers,

25
and starting 2007 also by sorters at the SLF. The waste diversion rates are shown
below:
Table 4 : San Carlos City Waste Diversion Rates Year Waste Diversion rate
%
2003 6.40
2004 7.73
2005 16.20
2006 21.30
2007 74.09
2008 59.73
2009 67.52
2010 70.53
Source: San Carlos City Ten Year Solid Waste Management Plan 2000-2010
The high diversion rate in 2007 coincided with the establishment of the City’s Eco-
Center and SLF. The City reached its projected 70% waste diversion rate for 2010 as
targeted in its Ten Year SWM Plan. The city is aiming at maintaining its 70% waste
diversion rate until 2015. The following is SCC’s waste diversion target for 2011-
2020 ( tons/yr).
Table 5: Waste Diversion Target
2011 2012 2013 2014 2015 2016 2017 2018 2019 2020
Bio 2,935 3.033 3,135 3,241 3,336 3,924 4,037 4,168 4,289 4,421
Non-
bio
1,580
1,632 1,686 1,741 1,796 2,113 2,179 2,241 2,310 2,380
Total 4,515 4,664 4,821 4,982 5,132 6,037 6,216 6,409 6,599 6,801
Total
In%
70 70 70 70 70 80 80 80 80 80
Source: San Carlos City Ten Year Solid Waste Management Plan 2000-2010

26
Barangay Recovery System
Instead of just having barangay based MRFs, many barangays established purok level
MRFs on a voluntary basis. Villagers provided free labor in the construction of their
MRFs . As of January 2011, the City SWM Office reported a total of 102 MRFs. Of
these, seven were non –functional, most of which are those located in the city center.
Most of these MRFs are sitio-based and each MRF functions as a drop-off center on
specific days.
In the rural barangays, biodegradable wastes are not collected as waste generators are
supposed to manage their biodegradable wastes. In Barangay Guadalupe, the
hacienda owner provides a communal composting site where residents can bury their
biodegradable wastes so that these can be composted. In the urban barangays, there
are schedules set for the collection of biodegradable wastes.
Residents have the option either to drop off their recyclables at the materials recovery
facilities or sell them to the itinerant waste buyers locally called “canvassers” by the
junkshops which provide the latter with buying capital.
School Based Recovery System
The SWM Office also works with schools to promote segregation, recycling and
composting. They launched school competition and provided incentives in the form
of “gift packages” for schools with the most volume of materials recycled. From July
2006 to 2007, the public elementary and secondary schools were able to recover a
total of 40,000 kilos of recyclables which amounted to PhP 45,000.00. Registered
junkshops were chosen by the City and assigned to specific schools for the recovery
of recyclables.
Figure 4 below shows the increase in participating public schools from thirteen
schools in School Year 2006-2007 to forty six in School Year 2010-2011.

27
Figure 4: Number of Schools Participating in Recycling Program
Source: San Carlos City SWM Success Story, 2009
As of 2011, the SWMO also has special collection scheme for paper wastes from
schools which they sell to junkshops in Bacolod City since local junkshops do not
buy paper waste. It has also three accredited junkshops as its partner in the school-
based recovery system. Junkshop partners are required by the SWMO to record the
volume of recyclables recovered in their assigned schools.
Waste Recovery System at the Eco-Center/Centralized MRF
Figure 5 shows that the wastes delivered into SCC’s solid waste disposal facility
were sorted into biodegradable and non-biodegradable wastes and further into
whether the two types are contaminated from 2003 to 2008. The figure reflects also
the impact of the three year SWM education campaign as shown by the increase in
uncontaminated biodegradable wastes and non-biodegradable wastes.

28
27
42
21
10
19
62
12
7 16
66
9 9
15
69
8 8
9
70
7
14
3
63
0
20
40
60
80
100
2003 2004 2005 2006 2007 2008 3
31
- BIO - NON-BIO
- CONTAMINATED - CONTAMINATED
(IN PERCENTAGE)
Figure 5: Wastes delivered at the San Carlos City Eco-Center and Disposal
Facility
Source: SWM Success Story, 2009
As of 2011, of the average 18 tons brought to the SLF, waste diversion rate was 90 %.
Figure 6 shows that the biggest fraction diverted are biodegradable wastes. This
shows that the segregated waste collection of the city is effective. Only ten percent are
disposed at the landfill cell.
Figure 6: Profile of SCC Waste Diversion in 2011
Source: San Carlos City SWMO Report, 2011

29
Waste Diversion of Recyclables
At the Eco-Center, there are nine former wastepickers (all are males) from the closed
Villarante dumpsite who are currently working there. They were integrated into the
formal system because of their knowledge in waste recovery but the City did not
integrate the women wastepickers in the Eco-Center as waste segregator because they
considered the job as unsafe for women. However, one woman wastepicker was given
“light” jobs such as janitorial and clerical tasks.
Figure 7 shows the types of recyclable materials recovered by the EcoCenter workers
in 2011. The top three materials recovered include: plastic, PET and cartons. The
plastic bags are currently stockpiled awaiting arrangements with a cement factory to
pick it up to be used as alternative fuel and raw material.
Figure 7 : Recyclables (kg/month) Diverted at the SCC SLF Eco Center
Source: San Carlos City SWMO Report, 2011
The SWMO was authorized to sell compost and recyclable materials generated at its
Eco-Center through Ordinance No. 07-14 . As of April 11, 2011, the Eco Center
generated PhP 500,196.20 from the sales of recyclables and compost (Table 6). The
recyclables are sold by the City to the larger junkshops in San Carlos or are picked up
by local junkshops cum consolidators.

30
Table 6: SCC Eco Center Income (April 11, 2011) Source Sales
Sale of recyclables Php 347,605.20
Sale of Compost Php 152,591.00
Total Php 500,196.20
Source: San Carlos City Ten Year Solid Waste Management Plan 2000-2010
Informal Waste Recovery at the Former Dumpsite
Prior to the closure of the city’s open dumpsite in Villarante in 2007, wastepickers
recovered recyclables and sold the materials to the junkshops. Three key informants
from the informal waste sector were engaged in wastepicking in the Villarante
dumpsite for five to ten years. Two of the key informants also collected the
biodegradable waste and sold it as pig slop. Two did wastepicking on a part time
basis since they had other means of income. Wastepicking was done as a family
activity. Recyclables recovered were sold to the local junkshops and they were paid
on cash basis. Buying prices were determined by the junkshops. Estimated weekly
income ranged from PhP1,000 to PhP1,600.
Itinerant Waste Buyers
The itinerant waste buyers (IWBs) are key suppliers of the junkshops in San Carlos
City. The City does not have any data on the number of itinerant waste buyers
within the city. The respondents from the IWBs are relatively young, their ages
ranging from 15 to 30 years old. Two of them finished elementary education, two are
high school undergraduates and one did not complete his elementary education. Three
of them had been working in waste trading for just one year. Lack of other livelihood
opportunities and family influence were cited as their reason for going into this kind
of work.
The junkshops provide the itinerant waste buyers with buying capital. Junkshop A-2
has sidecars which it rents to the itinerant waste buyers whom they locally call
“canvassers”. Rental fee for sidecars are PhP20 to PhP40 per day. The IWBs go
beyond city limits to neighboring municipalities such as Calatrava.

31
The “suki” system where the IWBs buy recyclables from “regular” suppliers is a
prevailing practice. The table below shows the weekly amount of recyclables bought
by the IWBs, its buying and selling prices.
Table 7: Itinerant Waste Buyers’ Recyclable Waste Flow Recyclable Items Amount
Purchased/week
Buying Price Selling Price
Glass bottles 100 pcs – 20 pcs PhP0.50 PhP1 per piece
PET* 2 kg PhP8 PhP10
Plastics 9-4 kg PhP8 PhP10
steel 18 – 7 kg PhP10 PhP13
copper 2 kg - .25
kg/month
PhP200 PhP220-PhP240
aluminum 2 kg – 5 kg PhP25 –P30 PhP40
yero 30 kg – 3 kg PhP4-P9 PhP9-PhP10
*Only one IWS bought PET separately from the other types of plastics. Co-mingling
of the different types of plastics is the usual practice of the IWS and the small
junkshops.
The top earners for the IWBs are the assorted metals specially copper which they
recover from electrical and electronic goods where they either burn the wire cover or
peel it off. Co-mingled plastics are their second biggest earner followed by glass
bottles.
Private Sector Materials Recovery System
Waste Recovery of Junkshops
There are thirteen junkshops in San Carlos City, of which seven are legally registered
with the local government. The profile of three of the registered junkshops is shown
in Table 8.

32
Table 8 : Profile of Three SCC Junkshops Particulars Junkshop A-1 Junkshop A -2 Junkshop A-3
Year business started 1985 2007 2002
Owner’s Age 58 34 26
Educational
attainment of Owner
High school
graduate
Vocational
education
Monthly Buying
Capital
PhP50,000* PhP50,000 PhP300,000
No. of vehicles 1 ten wheeler
truck; rents other
vehicles as needed
2 trucks
5 vehicles
Activities Sorting
Baling through
baling machine
Crushing
Sorting
Manual baling
dismantling
Sorting, manual
baling,
dismantling
Suppliers • Itinerant waste
buyers
• Walk in clients
• Junkshops in
SCC
• Itinerant waste
buyers
• Junkshops
• Walk in clients
• Itinerant waste
buyers
• Walk-in clients
• Junkshops
• Schools
Buyers/Destination • Metro Cebu
• Processors
• Traders
• Bacolod City
processor
• Metro-Manila
*Understated as junkshop A-1 is also a consolidator who brings scrap directly to Metro-Cebu
The SCC junkshops deal mainly with traditional recyclables such as scrap metal, glass
bottles and plastic waste. The bigger junkshops segregate the co-mingled plastics
supplied by IWS into PET, polystyrene cups, hard plastics and plastic containers.
Only one junkshop identified e-wastes as part of its trading. However, it is a common
practice among junkshops to dismantle the e-wastes into its components, i.e. metals
and plastic. Waste paper with the exception of cartons are not traded in the city
junkshops. Newspapers are reused in the local market as wrappers.

33
Table 9 : Inflow of Recyclables into SCC Junkshops Scrap Junkshop A-1 Junkshop A-2 Junkshop A-3
White paper Not traded Not traded NA
Assorted Paper NA NA NA
Boxes/cartons 5 tons/week NA NA
PET 2 tons/week 500 kg/week
(includes all types
of plastics)
100 kg/week
Glass bottles 500 sacks/week
12.5 tons
100 sacks/week
(80-100 pcs/sack)
Approximately,
2.5 tons
Polystyrene
cups
No data given 50 kg/month*
Plastic
Containers
2 tons/week 50 kg /week
Plastic bags None traded None traded None traded
Plastic (hard) 1 ton/week 20 kg/week
E-waste NC No data given 30 kg/week
Steel 5 tons/week 375 kg/week 500 kg/week
Copper 100 kg/week 5 kg/week 50 kg/week
Aluminium 50 kg/week 5 kg/week 20 kg/week
Aluminium can 50 kg/week 5 kg/ week 15 kg/week
Yero 1 ton /week 300 kg/month 100 kg/week
Tin Cans No data given 200 kg/ week 50 kg/week
Brass No data given No data given 12 kg/week
Lead batteries No data given No data given 8 pcs/week
Stainless steel No data given No data given 10 kg/week
The top recyclables in terms of volume recovered are assorted scrap metals, cartons,
glass bottles and plastic containers. The projected total recyclable waste generated in
SCC is 4.14 tons daily. The total waste intake of the three junkshops amounts to 2.1
tons which also includes an undetermined amount from nearby municipalities.

34
The buying and selling prices of the SCC junkshops are based on the buying prices of
consolidators and processors. The local junkshops can access information on the
prices through personal inquiry using their mobile phones. They keep a list of contact
numbers and addresses of their preferred buyers.
Table 10: Buying (BP/kg) and Selling (SP/kg) Prices of Junkshops Scrap Junkshop A-1 Junkshop A-2 Junkshop A-3
BP SP BP SP BP SP
White paper Not
traded
Not
traded
Not
traded
Not
traded
Not
traded
Not
traded
Assorted Paper Not
traded
Not
traded
Not
traded
Not
traded
Not
traded
Not
traded
newspaper Not
traded
Not
traded
Not
traded
Not
traded
Not
traded
Not
traded
Boxes P2 P5 Not
traded
Not
traded
PET P10 P15-20
(crushed)
P10 P13 P10 P12
Glass PhP70-
P1
PhP1.20 PhP1 PhP1.50 No data
given
No data
given
Polystyrene cups No data
given
No data
given
No data
given
No data
given
No data
given
No data
given
Plastic Containers No data
given
No data
given
PhP7 PhP8 PhP9 PhP11.5
0
Monoblocks No data
given
No data
given
PhP7 PhP8 No data
given
No data
given
Plastic (hard) No data
given
No data
given
PhP7 PhP8 PhP9 PhP11
E-waste No data
given
No data
given
PhP7 PhP8 PhP50/p
c or
P13/kg
PhP70/p
c or
P15/kg
Steel PhP10 PhP12 PhP13 PhP15 PhP13 PhP14.5
0

35
Scrap Junkshop A-1 Junkshop A-2 Junkshop A-3
BP SP BP SP BP SP
Copper PhP200 PhP230 PhP200 PhP280 PhP270 PP295
Aluminum PhP30 PhP40 PhP40 PhP45 PhP55 PhP67
Aluminum can PhP30 PhP40 PhP40 PhP45 PhP45 PhP55
Yero PhP7 PhP10 PhP9 PhP12.5
0
PhP7 PhP8.50
Tin Cans PhP5 PhP7.50 PhP5 PhP7
Brass No data
given
No data
given
No data
given
No data
given
PhP150 PhP175
Lead batteries No data
given
No data
given
No data
given
No data
given
PhP300-
PhP1,40
0/
Per piece
PhP360-
PhP1,55
0
Per piece
Within SCC, some of the local junkshops are also consolidators. One of them is a
consolidator of bottles and cartons which he brings to Mandaue, Cebu processors or
exporters. Each of the three junkshops studied have its own set of
buyers/consolidators. The junkshops deliver their recyclables to the buyers in
Bacolod City. These buyers are either based in Bacolod City and Cebu City with the
latter having buying stations in Bacolod City. The Bacolod consolidator
(Consolidator-Processor A-4) sells directly to Manila consolidators and processors.
One Bacolod City trader sells to a foundry plant in Iligan City in Mindanao. Metro
Manila based Consolidator/Exporter A-5 exports the scrap metals to China or sell to
local foundry shops in Metro Manila and nearby localities. One Manila based
company has a processing plant in China.
36
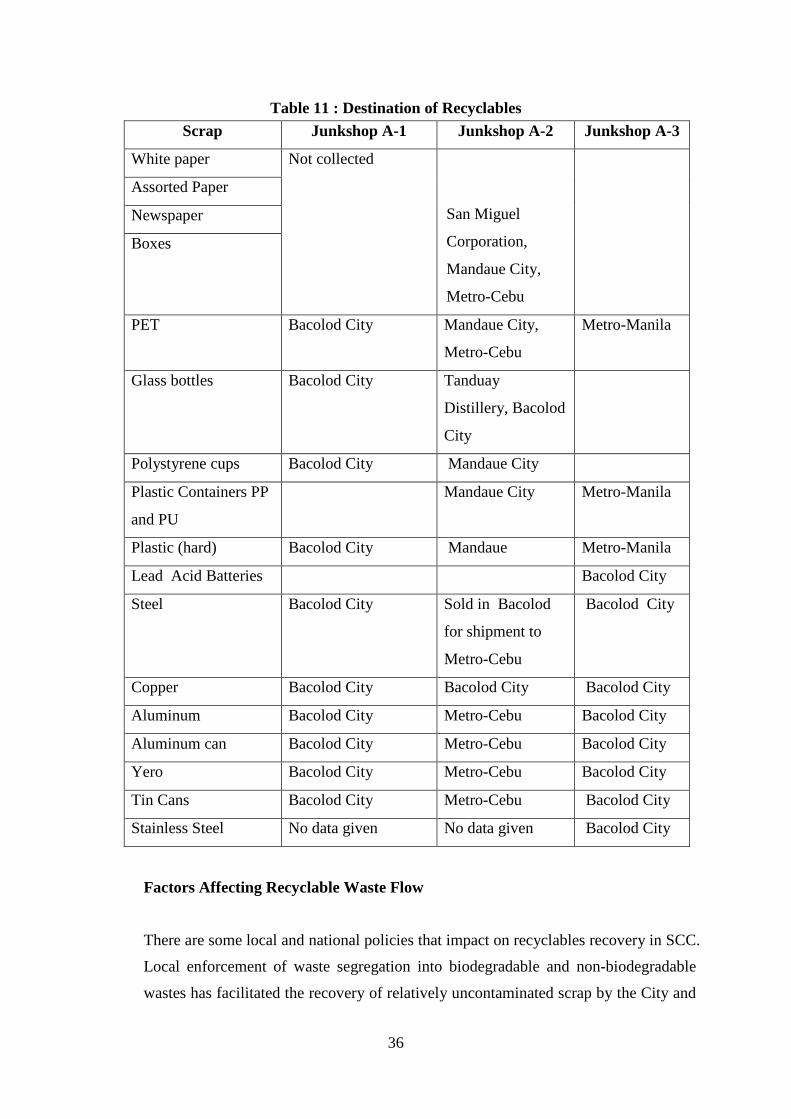
Table 11 : Destination of Recyclables Scrap Junkshop A-1 Junkshop A-2 Junkshop A-3
White paper Not collected
San Miguel
Corporation,
Mandaue City,
Metro-Cebu
Assorted Paper
Newspaper
Boxes
PET Bacolod City Mandaue City,
Metro-Cebu
Metro-Manila
Glass bottles Bacolod City Tanduay
Distillery, Bacolod
City
Polystyrene cups Bacolod City Mandaue City
Plastic Containers PP
and PU
Mandaue City Metro-Manila
Plastic (hard) Bacolod City Mandaue Metro-Manila
Lead Acid Batteries Bacolod City
Steel Bacolod City Sold in Bacolod
for shipment to
Metro-Cebu
Bacolod City
Copper Bacolod City Bacolod City Bacolod City
Aluminum Bacolod City Metro-Cebu Bacolod City
Aluminum can Bacolod City Metro-Cebu Bacolod City
Yero Bacolod City Metro-Cebu Bacolod City
Tin Cans Bacolod City Metro-Cebu Bacolod City
Stainless Steel No data given No data given Bacolod City
Factors Affecting Recyclable Waste Flow
There are some local and national policies that impact on recyclables recovery in SCC.
Local enforcement of waste segregation into biodegradable and non-biodegradable
wastes has facilitated the recovery of relatively uncontaminated scrap by the City and

37
its barangay MRFs. The DENR regulation, DAO 2010-06 entitled “ Guidelines on
The Use of Alternative Fuels and Raw Materials in Cement Kilns”, allowing the use
of plastic wastes as alternative fuel and raw material has encouraged the SWMO to
stock pile its plastics with no commercial value locally and to make arrangements
with a cement company.
There is presently no ordinance regulating use of plastic bags but the City has an IEC
campaign promoting “No Plastic Day” in the city. Except for cartons, paper waste has
no commercial value so the City has made arrangements for school-based recovery
and recycling of paper waste in partnership with three registered junkshops.
There is presently no ordinance regulating junkshop operations except for securing
business permits. There are problems such as trade in stolen goods and informal
recycling of e-waste. There are no regulations in support of itinerant waste buyers for
their social protection and support of their livelihood from waste.
The recyclables flow from waste generators to the junkshops are primarily through the
IWBs. Since SCC has a dearth of employment opportunities, itinerant waste buying
is one of the easiest way for income generation. As a result, the respondents from
IWBs group are complaining that their numbers are increasing thus, they have to
move away into nearby municipalities to buy recyclables.
Trading operations between IWBs and junkshops and between local junkshops are on
cash basis. Some of the junkshops provide the IWBs with cash advances that enable
them to conduct their buying activities. Cash basis and open trading are the norm.
Between the junkshops and their buyers trading information is readily accessible
through the mobile phone. Junkshop A-2 is a consolidator of Tanduay bottles which
he delivers to Murcia but there are certain bottles which he has to sell as cullets when
its consolidators stop buying. Presently, only Junkshop A-1 has plans to set up a
crusher for plastic wastes, thus most of the local junkshops simply commingle the
different types of plastics thus missing on a better selling price for each of the plastic
types.

38
There are consolidators and traders from Cebu City and Metro-Manila who conduct
their trading activities in Bacolod City. Due to the accessibility of Cebu, Junkshop A-
1 prefers to bring his scrap directly to Cebu processors and traders. Small junkshops
who want to save on transport sell their scrap to the big junkshops in SCC.
Table 12 : Factors Affecting Recyclable Waste Flow Waste Materials Facilitating Factors Hindering Factors
1. Paper • SWMO conducts special
collection days in schools
and sells the paper waste
directly in Bacolod City.
• School children and Eco-
Center workers recycle
paper waste into charcoal
briquette.
• Junkshops do not buy paper
wastes. Paper waste has no
economic value except for
cartons. There is no paper
processing company in
Bacolod City or nearby
cities in Negros Occidental.
2. Bottles • The bottles are usually sold
by waste generators to the
itinerant waste buyers and
the local junkshops.
• Junkshop A-2 is a
consolidator for Tanduay
bottles which he sells to
Tanduay Distillery plant in
Murcia.
• There is no market for UFC
bottles so Junkshop A-2
breaks it down into cullets.
3. Plastic bags and
styropor
• SCC was able to link with
potential buyer and relatively
uncontaminated bags are
being stockpiled for use as
alternative raw fuel for a
cement factory; Current
DENR policy allows the use
of plastic waste as alternative
• The junkshops do not buy
these materials.
• There is no formal
agreement between SCC
and the potential buyer of
plastic bags and Styrofoam.

39
Waste Materials Facilitating Factors Hindering Factors
raw fuel.
4. Assorted plastic
containers
(PET, PP,
HDPE,
monoblock
chairs also
called sibak or
malutong in
other cities)
• Junkshop A-2 will be
setting up a flaking
equipment that will
facilitate transport costs of
the plastics to Bacolod City
or Cebu City.
• In Bacolod City, Junkshop
A-1’s consolidator has
several flaking equipment, a
washing and drying system
that allows for further
classification of plastics.
• Transport costs and
bulkiness of materials bring
down the price of these
materials. The local buying
price is low and the volume
needed is not quickly
accumulated so that local
junkshops are not motivated
to segregate the plastics into
its different types.
5. Electronic
Wastes
• Dismantling allows for
further segregation of the E-
waste into various
recyclable items.
• Dismantling is done by the
itinerant waste buyers and
junkshops which is not
monitored by SCC. There
are risks of health and
environmental
contamination from lead
and other heavy metals.
6. Biodegradable
Wastes
• The sugar plantations
provide the market for the
Eco-Center’s compost
products. Thirty percent of
the compost produced are
given to the owner of the
Eco-Center site as land
rental.
• There is still some
contamination of
biodegradable waste due to
improper segregation but
the level of contamination
has gone down due to
effective IEC.

40
Impact of Economic Recession on the Flow of Recyclables
Trading of recyclables are also affected by changes in the global market, especially
changing demand from China, which is the number one export destination for
recyclables. Prior to the 2008 Olympic Games in China, there was very high demand
for recyclable materials specially scrap metal, steel and plastic wastes. As a result,
junkshops in SCC increased in number in anticipation of consistently good buying
prices from China. Many stockpiled scrap metal and steel but when the prices fell
way below their buying prices, many of these new junkshops closed down. It was
only the bigger junkshops that managed to survive the post Olympic Games price
downturn.
Junkshop A-2 bought tin cans at PhP5 per kg but its selling price went down to
PhP.50/kg. To survive, the owner stockpiled the inventory and shifted to alternative
income generation through their small retail store, swine raising and operating 2
tricycles. Junkshop A-3 stopped buying certain scrap, downsized its operations 50%
and stockpiled its inventory.
Issues and Challenges
In San Carlos City, the following are some issues and challenges facing the SWM
program:
Local Government
• No enforcement of RA 9003 provision regarding open burning as it applies to the sugar cane plantation. Currently a project is underway to use sugar cane waste
and other plant residues into biomass energy;
• No city SWM ordinance enacted;
• No junkshop ordinance enacted; and presence of illegal junkshops; and
• SWMO employees are co-terminus with the Mayor’s term of office; there is no City ENRO.
Local Junkshops
• Access to capital affects the volume and scope of operation of the SCC junkshops;
• Transport costs also affect the flow of goods; and

41
• There is no association that can help the junkshops in terms of representing their interests with the government and facilitating support for each other.
Informal Waste Sector
Due to lack of livelihood opportunities in San Carlos City, the number of itinerant
waste buyers have been increasing. They not only buy from San Carlos City but also
from nearby areas such as Calatrava and Salvador Benedicto. They have no job
security and are dependent on junkshop owners for their capital, usually ranging from
PhP500 to PhP1,000. One junkshop has terminated its practice of working with the
IWBs or canvassers as they are locally called because according to him, the IWBs do
not bring back the recyclables to his shop and instead sell it to those who offer the
highest price. Another junkshop mentioned that stolen goods is one of the problems
encountered in the scrap trade.
II.2. Case Study B: San Fernando City, La Union
LGU Profile
The City of San Fernando is the center of trade and development in Northern Luzon.
It serves as the regional center of Region I hosting major business and financial
institutions, regional offices, universities and colleges and others. Also, the city has
the Poro Point Special Economic and Freeport Zone with a functional airport and
seaport and warehouse facilities.
The City is the capital of the Province of La Union and is situated about 270
kilometers north - northwest of Metro Manila. Its land area is 10,526 hectares or
105.26 sq. kms and is subdivided into 59 barangays. Twenty four barangays are
classified as urban and 35 barangays as rural. Twenty barangays are located within the
coastal plain while 39 barangays are found in the hilly mountainous terrain east of the
Poblacion or the City center.
Its agricultural area covers 7,593, 668 hectares. or 72.14% and includes fishpond area
of 141.67 has. and a poultry and piggery farm of 2,129 square meter (sq. m).
Residential areas cover 1,001.70 has. or 9.52% of the City’s total area. Forest
42
areas/timber lands grown with shrubs, mature trees and other forest species has an
area of 636.53 hectares or 6.05% while the rest are utilized for commercial,
institutional, industrial and infrastructure uses.
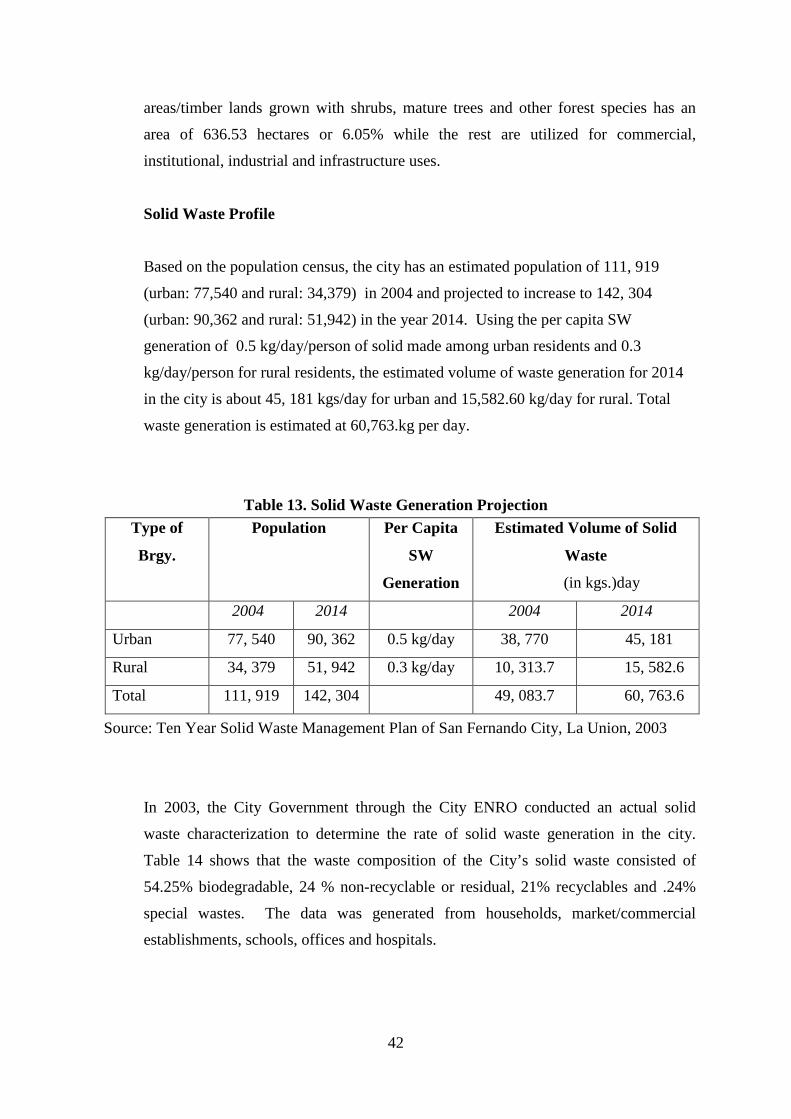
Solid Waste Profile
Based on the population census, the city has an estimated population of 111, 919
(urban: 77,540 and rural: 34,379) in 2004 and projected to increase to 142, 304
(urban: 90,362 and rural: 51,942) in the year 2014. Using the per capita SW
generation of 0.5 kg/day/person of solid made among urban residents and 0.3
kg/day/person for rural residents, the estimated volume of waste generation for 2014
in the city is about 45, 181 kgs/day for urban and 15,582.60 kg/day for rural. Total
waste generation is estimated at 60,763.kg per day.
Table 13. Solid Waste Generation Projection Type of
Brgy.
Population Per Capita
SW
Generation
Estimated Volume of Solid
Waste
(in kgs.)day
2004 2014 2004 2014
Urban 77, 540 90, 362 0.5 kg/day 38, 770 45, 181
Rural 34, 379 51, 942 0.3 kg/day 10, 313.7 15, 582.6
Total 111, 919 142, 304 49, 083.7 60, 763.6
Source: Ten Year Solid Waste Management Plan of San Fernando City, La Union, 2003
In 2003, the City Government through the City ENRO conducted an actual solid
waste characterization to determine the rate of solid waste generation in the city.
Table 14 shows that the waste composition of the City’s solid waste consisted of
54.25% biodegradable, 24 % non-recyclable or residual, 21% recyclables and .24%
special wastes. The data was generated from households, market/commercial
establishments, schools, offices and hospitals.

43
Composition of Household Waste Brgy. Pagdalagan
Recyclable14.39%
Bioderadable43.36%
Special Waste0.86%
Residual41.39%
Table 14. San Fernando City Waste Profile, 2003 Type of Solid
Waste
Weight (kgs) Total
Weight
of SWM
(kgs/
day)
Percent
(%) House-
holds
Market/
Commercial
Schools Offices Hospitals
Biodegradable 138 74 50 10 63 335 54.25
Recyclable 50 20 15 9 36 130 21.05
Non-
recyclable
45 40 25 11 30 151 24.45
Special waste .5 - - - 1 1.5 0.24
Total 233.5 134 90 30 130 617.5 100
Source: Ten Year Solid Waste Management Plan of San Fernando City, La Union, 2003
The City conducted a WACS at the barangay level in 2008 as shown in Figure 8. The
study showed that at the barangay level, biodegradable waste is lower is 43.36%
while at the city level it is 54.25% while residuals are higher at 41.39% compared to
24.45 %. The advent of laminates as packaging materials for consumer goods may
have been a factor in the increase of residual wastes and a consequent decrease in
recyclables. The composition of residual wastes include the following: Styrofoam
packaging, composites or laminates, plastic bags, sanitary napkins and diapers and
inerts.
Figure 8. WACS Result of Barangay Pagdalagan

44
SWM System
In compliance with RA 9003, then Mayor Mary Jane Ortega issued Executive Order
No. 2-2002 creating the City Solid Waste Management Board to respond to the
needs of the city and calling for the formulation of a Solid Waste Management
Plan/Program for the City of San Fernando. In 2003, the City conducted a planning
workshop which led to the formulation of its Ten Year Solid Waste Management Plan.
It was approved by the City Solid Waste Management Board in 2004 and will soon
undergo a process of updating.
The City Solid Waste Management Board was created in 2004 but ceased functioning
in 2009. At the barangay level, there are 15 barangay solid waste management
committees; the rest of the barangays just utilize their committee on environment for
solid waste management concerns.
There are currently two Departments handling solid waste management concerns,
namely: City Environment and Natural Resources Office (CENRO) and the General
Services Office (GSO) . The CENRO takes care of IEC and provides technical
assistance to barangays in the establishment of their SWM systems. The latter takes
care of waste collection and SLF operations.
The SWM approach developed by the City over the years is to strengthen the capacity
of its barangays to implement their responsibilities through a clustering approach in
the collection of solid wastes and MRF establishment. The City also provided
technical assistance to some of the barangays in the conduct of their Waste
Characterization Study and in the formulation of their SWM ordinances and plans.
Waste Segregation and SWM Practices
The City Solid Waste Management Ordinance classifies solid waste into four types as
specified in the Ecological Solid Waste Management Act of 2000. The City
Ordinance also requires that waste generators segregate-at source but to date there are
different perceptions and practices on segregation.
45
Among the key informants in Barangay Langcuas, a rural barangay and Parian, an
urban barangay, 80% of the respondents said that solid waste is classified into
biodegradable, non-biodegradable/non recyclable, and residual wastes. In Barangay
Parian, 40% said there are three types of solid wastes and another 40 % said there
are four types.
At the city level, segregation at source is not widely practiced although some
barangays with their own collection systems require their constituents to segregate
their wastes into biodegradable and non-biodegradable. According to the barangay
chairperson of Parian, segregation at source increased from 30% to 70% when they
intensified their information campaign in 2011.
On prohibited acts, 70% are aware that dumping of wastes is illegal. Forty percent
of respondents know that burning of wastes is prohibited. Thirty percent know that
littering is also against the law.
Common among all the respondents is their segregation of household recyclable
wastes that are bought by itinerant waste buyers and/or junkshops. The most common
items include glass bottles, plastic containers and tin cans. Sixty percent of the
respondents use paper waste as fuel for cooking. Seventy percent recycle kitchen
waste as animal feeds.
In 2010, the City required city market vendors to segregate coconut shells and
vegetable scrap from other waste stream The intention is to sell the vegetable scrap to
hog growers as animal feed. Two composting bins were also made to process other
biowastes from the market.
Waste Collection
Currently, forty-six (46) barangays or 78% of city barangays are covered by waste
collection services. Collection services are being conducted by the City Government,
barangays and other private haulers. Thirteen (13) barangays are still not covered by
collection. In these areas, households dug pits to dispose their wastes. 4
4 San Fernando City SWM Data, CY 2011.

46
The current formal system of waste collection is a mix of city-based and barangay-
based operated system as shown in Table 15:
Table 15: Coverage of City and Barangay-Based SWM Collection System
City-based Barangay-based
1. Brgy. I 2. Brgy. III 3. Ilocanos Sur 4. Ilocanos Norte 5. Langcuas 6. Pias 7. Camansi 8. Madayegdeg 9. Parian 10. Pagudpud 11. San Vicente 12. Mameltac 13. Canaoay 14. Birunget 15. Tanquigan 16. Bungro 17. Siboan-otong 18. Abut 19. Bato 20. Sagayad 21. Saoay 22. Narra Este 23. Narra Oeste 24. Bacsil
Parts of 25. San Francisco 26. Sevilla 27. Biday
Cluster 1 1. Brgy. II 2. Brgy. IV Cluster 2 3. Lingsat 4. Dalumpinas Oeste 5. Carlatan 6. Pagdaraoan 7. Bangcusay Cluster 3 8. Tanqui 9. Cabaroan 10. Santiago Sur Cluster 4 11. Dallangayan Oeste 12. Dallangayan Este 13. Namtutan Cluster 5 14. Poro 15. San Agustin 16. San Francisco Individual Barangays 17. Pagdalagan 18. Catbangen 19. Sevilla 20. Santiago Norte
The General Services Office supervises the collection and disposal operations of the
city-based collection system while each barangay designates its officer-in-charge of
garbage collection. National government offices and private institutions hire their
own haulers.
By 2011, 55.9% of the total wastes collected and transported to the SLF were those
collected by the barangay system. The city-based collection coverage comprised only

47
Table 16. Summary of Waste Collected by Various Entities, March 2011 Source Weight
(kg)/month
Weight
(ton)
Number of
Trips
%
City-based 520,650 520.65 358 41.77
Barangay-based 696,650 697 437 55.90
National (govt) 280 .28 3 00.02
Institutional 10 .01 1 00.0008
Total 28,720 28.72 28 2.30
Source: City ENRO. Waste Disposal Report, March 2011, San Fernando City, La
Union
42%. This was due to the city approach to devolve garbage collection to the
barangays.
The barangay managed collection are of two types: those that are barangay -based and
those that are cluster-barangay in scope. Nine (9) barangays have their own collection
trucks servicing 19 barangays because of clustering. The host barangay with the
trucks collect the waste generated by their barangay and their member barangays.
To support the clustering system, the barangays collect PhP25 per household per
month to the constituents and counterpart funds are also provided to the barangay
hosting the truck. In addition, the barangays also receive subsidy from the City in the
amount of PhP700 /truck/day of collection. The thrust of the City is to devolve
garbage collection to the barangays. Table 17 shows the amount of waste collected
and disposed by the barangays.

48
Table 17. Collection and Disposal Data of Barangays Implementing Garbage
Collection, March 2011 Source Weight
(kg)
Weight.
(tons)
No. of
trips
% No. of
days
Subsidy
(PhP)
Barangay 4 52,275 52.27 51 7.50 30 21,000
Catbangen 109,500 109.50 65 15.72 31 21,700
Dalangayan 24,680 24.68 24 3.54 26 18,200
Lingsat 1 100,915 100.91 62 14.48 31 21,700
Lingsat 2 90,890 90.89 48 13.05 30 21,000
Pagdalagan 29,910 29.91 18 4.29 16 11,200
Poro 73,140 73.14 30 10.50 24 16,800
Santiago 27,680 27.68 19 3.97 19 13,300
Sevilla 103,810 103.81 62 14.90 31 21,700
Tanqui 83,850 83.85 58 12.04 27 18,900
Total 696,650 696.65 437 100 265 185,500.00
Source: Waste Disposal Report, March 2011, City ENRO, San Fernando City, La
Union
Segregated collection of wastes is encouraged at the household and barangays.
Households are required to segregate their own wastes and allowed only to bring out
their waste during collection days. Sanitary technicians collect the wastes from the
different generators and transport it to the landfill. Leaves, tree cuttings/trimmings
and other garden and kitchen wastes (fruit and vegetable trimmings) are segregated
and transported separately to the landfill for composting purposes 5
.
Although some of the barangays have already formulated their ordinances which
require segregation at source and segregated collection, mixed waste collection is still
the predominant system among the barangays. According to the SWEEP Officer who
heads the collection and disposal operations, it is only in the Lingsat cluster and in
Barangay Pagdalagan where segregated collection of wastes is strictly enforced.
5 Jucutan, Celso. SWM Evaluation 2010, San Fernando City, La Union.

49
Aside from not being able to follow the provision on segregated collection, the
collection schedule is disrupted by time taken out for truck repairs. Seventy percent of
the collection vehicles experience breakdown due to aging of trucks.
Waste Disposal
SFC used an open dumpsite in barangay Canaoay from 1960-1977. In 1978, the
disposal operations was transferred to Barangay Mameltac. The open dumpsite in
Mameltac was converted into a controlled dumpsite in 1998.
In 2005, the controlled dumpsite was rehabilitated into a sanitary landfill (SLF).
through a Design-Build-Operate (DBO) Scheme. The World Bank through the
Department of Finance LOGOFIND Project funded the establishment of the city’s
sanitary landfill facility. The total project cost is more than PhP 163 million (80 % -
20 % cost sharing) to be paid within fifteen (15) years.
The SLF was constructed by the joint venture of Connestoga –Rovers and Associates
and Kane Construction Inc. (CRA-KCI). After three (3) years of construction and
operation works by the contractors, the operation and maintenance of the SLF was
turned-over to the City Government in 01 October 2008.
The SLF has an area of 4.5. hectares. It also has a reserve area of 5.4 hectares in an
adjoining parcel of land located in Barangay Dalangayan Oeste.
Waste disposed at the SLF from 2009 to 2011 show a decreasing trend but the rate of
decrease is minimal as shown in Table 18. From January to November 2011, about
14,396 metric tons (average of 43.102 mt/day) of wastes were disposed at the City
Engineered Sanitary Landfill compared to 48.04 mt in 2009 and 42.24 mt in 2010 6
.
The composition of residual and special wastes disposed as observed in the sanitary
landfill included plastic bags, diapers, sanitary napkins, rubber, leather, laminates,
inerts, and textiles. Due to mixed waste collection, biodegradables are contaminated
and treated as residual waste instead of being composted. As reported in its 2011 data,
6 GSO-SWEEP ISWM Data 2011.

50
the following special wastes are managed at the SLF: sharps, busted lights, tires and
treated human waste from the Ecosan toilet project. The Ecosan toilets do not use
septic tanks. Instead urine and feces are separated at source; with the feces
undergoing primary composting. These are then collected and undergoes secondary
composting at the SLF.
Figure 9: Waste Disposal, CY 2009-2011
Source: GSO – SWEEP, ISWM Data, CY 2011, San Fernando City, La Union
LGU Managed Waste Recovery System
Recyclable Waste Flow
The recycling chain goes through several rings as shown in Figure 10. From waste
generators, recyclables such as bottles and plastic containers are sold directly by
households to the local market vendors. The primary collectors of recyclables are the
itinerant waste buyers, the itinerant waste pickers in the city’s commercial and
business district, the garbage crew or paleros (wastepicking while the truck is in its
collection route), and the operators of barangay MRFs. Some waste generators go
directly to the junkshops. Recyclables recovered from the SLF are sold to a local
junkshop. Recyclables from nearby municipalities also flow into the SFC junkshops.
In SFC, consolidation of recyclables are undertaken by some of the big junkshops and
the buying station of some Metro-Manila consolidators. Scrap materials are also sold

51
Figure 10: San Fernando City Recyclable Waste Flow

52
to processors in La Union, Pangasinan, Pampanga and Metro-Manila. Some of the
recyclables are directly exported from SFC itself or through Metro-Manila traders to
China (as disclosed by two SFC junkshop consolidators).
LGU Recovery System
SFC Waste Diversion
At the SLF about 1,120 metric tons of materials or 9.3% of total waste intake of
14,396 tons were recovered and diverted from the waste stream from January to
November 2011 through the accredited wastepickers at its sanitary landfill. In 2009
there was only 4.17% waste diversion or recovery.7
The city managed collection trucks bring mixed wastes to the Mameltac Sanitary
Landfill except for market wastes where they separate the biodegradable from non-
biodegradable wastes. Twenty accredited wastepickers and some 25 to 35
unaccredited wastepickers recover and separate the recyclables from the residual and
special wastes at the SLF.
There is no data on waste
diversion activities at the barangay level except for the Lingsat Barangay Cluster.
The accredited wastepickers and their families reside in Mameltac, host barangay to
the sanitary landfill and were chosen by the then barangay captain who eventually set
up a private junkshop. Under a Memo of Agreement with the City Government, he is
supposed to pay a monthly royalty fee of PhP5,000 to the City.
The unaccredited wastepickers come from the other barangays adjacent to the
landfill. Although there is no formal permit allowing the other wastepickers, their
presence is tolerated by those who are in charge of operating the landfill.
Two of the accredited wastepickers interviewed have been engaged in informal
waste work for over a decade while two others have worked for more than four years.
Wastepicking at the SLF is a family enterprise with at least two other family members
assisting the accredited wastepicker. They like their work because it provides them
with readily available cash on a daily basis and they do not have to deal with an
employer or boss. They also have the chance to earn additional income by getting the
7 Ibid.

53
food waste as animal feed for backyard pig raising. The usual health problems
encountered include physical injuries, common colds, fatigue and fever.
From January to November 2011, a total of 1,120 tons was diverted from landfilling
out of the total waste intake of 14,396 tons. Table 18 shows the type of materials
diverted from landfilling from January to November 2011.
Table 18: Waste Materials Diverted from Land filling
Month Recyclables
Coconut
shell Bio Tires Sharps
Food
scrap Ecosan TOTAL
Kg/per day
January 28,969 22853 9460 430 0 797 3175 65684
February 27,014 31469 18485 50 55 1183 1985 80241
March 34,100 30955 16705 60 0 1625 1145 84590
April 33,180 34145 16120 115 625 895 2020 87100
May 31,546 38675 28084 579 840 1910 2095 103729
June 26,756 44245 33170 323 495 1375 2415 108779
July 27,231 43800 36070 1174 300 2145 1065 111785
August 21,469 47,190 41,395 955 20 1775 1310 114114
Septemb
er 32,343 38420 41838 180 0 2020 1795 116596
October 31,827 41530 54967 320 0 2165 2,010 132819
Novemb
er 35,326 45710 28651 0 50 1924 2700 114361
TOTAL 329,761 418,992 324,945 4,186 2.385 17,814 21.715 1.119.798
Source: SFC SWM Report 2011
Scrap Vegetables and Other Bio-Materials
Scrap vegetables generated from the City Market are sold to hog growers to be used
as feeds. In 2011, the wastepickers recovered 17.8 tons of food scrap.
At the landfill sites, two composting bins are intended to compost the biodegradable
materials from the market. Also composted are yard waste from Park operations. All

54
Parks personnel and street sweepers were instructed to segregate leaves and plant
trimmings generated from the areas and not to mix them with the general wastes.
SFC utilizes vermicomposting, in-vessel composting and windrow composting.
Composts produced are utilized in the landscaping projects of the city. Vermicompost
were also distributed to farmers . In 2011, the SLF diverted 325 tons of
biodegradable waste for composting.
Coconut Shell Segregation at the City Market
In 2010, to save on landfill space, the market vendors were required to segregate
coconut shells from other waste stream generated at the market. Coconut shells are
dried and recycled into charcoal. This is given free of charge to city residents who
use the shells as fuel for their tobacco kilns. Some are also sold locally. The coconut
fiber is used as mulch for the city nursery and landscaping projects.
Other Waste Recovery Activities at the Sanitary Landfill
Scrap tires are recovered and stored in a specific area at the landfill. The accredited
wastepickers sell the tires at PhP.50 per kilo to buyers from Bangar who then sell the
scrap tires to processors in Bulacan. Broken glasses are also segregated to prevent the
puncture of the liner.
Special wastes include the sharps and pre-treated human waste from the Ecosan toilets
in Fisherman’s Village. The sharps are placed in specific containers and placed in the
hazardous waste storage facility within the SLF. The pre-treated human wastes are
composted.
For eleven (11) months, 2,361 pieces of busted lamps were recovered and temporarily
stored at the newly constructed hazardous waste storage facility.
The top three items recovered by accredited wastepickers at the landfill are hard
plastic, assorted metals and cartons. The types recovered and its buying price are
shown in the Table 19.

55
Table 19: Recyclables Recovered by Accredited Wastepickers, March 2011 Types of
Recyclables
Weight
(kg)/month
Weight (kg) per
week
Buying Price of
Timpuyog
Junkshop/kg
(PhP/kg)
1. Cellophane 1,257 314.25 PhP4
2. Cartons 2,725 681.25 PhP5
3. Hard plastic 6,091 1,522.75 PhP10-PhP14
4. Metals/steel 3,474 868.50 PhP18
5. Bottles/glass 18,034 pcs 4,508 pieces
6. White paper 971 242.75 PhP5
7. Assorted
materials
1,548 387 PhP2
All of the accredited wastepickers are required to sell their recyclables to Junkshop B-
1. The unaccredited wastepickers are free to sell their recovered recyclables to the
junkshop of their choice. The City presently has no estimates of how much
recyclables are recovered by the non-accredited wastepickers.
The monthly income of the three wastepicker respondents are shown in the Table 20.
Variances in income may be due to assistance from other family members, age and
job skill.
Table 20: Monthly Income of Accredited Wastepickers Respondents Estimated Monthly Income
Respondent 1 P6,794
Respondent 2 P11,430
Respondent 3 P8,510

56
Other City-Led Recovery Systems
Tarpaulin Recycling Activity
Tarpaulins and streamers are being recycled in partnership with the People’s
Organization (PO) in the City. The tarps and streamers are made into bags and
marketed to local consumers.
City Hall Materials Recovery Facility
Two bins were fabricated for the City Hall so that recyclables from offices can be
dropped into the bins. Papers, plastics, metals and others are brought into the facility
by the designated personnel in each office.
School-Based Materials Recovery System
There are 26 public schools and 30 private schools in SFC, all of which have school-
based materials recovery facilities. The schools also recycle the wastes into bags,
paper weights and decorations/souvenir items. Trainings on recycling were
conducted by the Department of Trade and Industry and the City Government.
According to the Principal of South Central Elementary School, all public schools
teach the 3Rs and implement their own materials recovery system. Recycling of
waste into novelty items are usually taught in school. The South Central Elementary
School has a MRF and a composting area. Recyclables generated within the school
are sold to the local junkshops and the school’s waste diversion is currently being
monitored by the City GSO.
Barangay Waste Recovery System
Only fifteen out of fifty-nine barangays have existing MRFs in SFC. Two are cluster-
based MRFs while the rest are barangay-based MRFs. The CENRO has no data on the
volume and type of recyclables recovered at the barangay MRFs.

57
Table 21: Operational Materials Recovery Facility in the City of San Fernando
Barangay
Cluster members
Location of MRF
No. of
barangays
served
Biday Kap-Teens Junkshop
Brgy. Biday
1
Brgy. IV Timpuyog Junkshop,
Barangay Mameltac
1
Cadaclan 1
Catbangen 1
Dallangayan
Cluster
Dallangayan Oeste,
Dallangayan Este
Namtutan
Dallangayan Oeste
3
Lingsat Cluster Dalumpinas Oeste
Lingsat
Carlatan
Pagdaraoan
Bangcusay
Lingsat 5
Pacpaco 1
Santiago Norte 1
Sevilla 1
TOTAL 15
Source: GSO-SWEEP ISWM Data, CY 2011, San Fernando City, La Union
Instead of establishing their own MRFs, Barangay IV and Biday partnered with two
junkshops which they selected.
The solid wastes of Barangay IV is collected by the barangay through its collection
truck and these wastes are segregated by Junkshop B-1. As per agreement of the
parties, Junkshop B-2 gives a share of the income earned from the sales of recycables
to the barangay. Junkshop B-1 also used to be the partner of Biday but when there
was a change in barangay leadership, Junkshop B-6 was instead selected. Junkshop B-
58
6 truck collects the solid wastes in Biday and provides segregation services. Residuals
are then brought to the SLF.
All these MRFs do not pay residents for the recyclables collected from them.
Presently, neither the GSO nor the City ENRO has a monitoring system in place to
record the types and volumes of waste recovered through the barangays. Other
barangays sell the recyclable materials to any junkshop of their choice depending on
the better price. Junkshop B-1 also buys the recyclables of Lingsat, Sevilla and
Santiago MRFs.
In the study area, the oldest materials recovery facility is the Lingsat MRF which was
established in 2004 to serve the Lingsat cluster of barangays. Brgy. Lingsat collects
monthly SWM fees from its constituents. The Lingsat cluster enforces a “no
segregation, no collection” policy. The MRF serves as the sorting area for recyclables.
The MRF custodian records the inflow of recyclables on a daily basis and the monthly
income from sales of recovered waste.
According to the Lingsat MRF custodian in SFC , there has been a downward trend
in the recyclable waste flow to their facility. In 2003-2004, the average monthly sales
was fourteen thousand pesos (PhP14,000.00) but there was a decrease in the average
monthly income for 2011 at PhP7,024. The decrease in the collected recyclables was
due to the awareness of the households that there is money in waste, hence, they no
longer give their recyclables to the barangay and instead sell their recyclables to the
IWBs or directly to junkshops.
The top three items recovered at the Lingsat MRF are plastics, cartons and tin cans.
Table 22 shows the monthly and weekly amount of scrap recovered by the Lingsat
MRF.

59
Table 22: Lingsat MRF Recyclables for March 2011 Types of
Recyclables
Weight
(kg/month)
Weight
(kg/ week)
Buying Price of
Junkshop
(PhP/kg)
Cartons 273 63.25 Ph5
Assorted Plastic 377 94.25 PhP10-PhP14
Bottles 187 pieces 47 pieces PhP 1
Paper 13 3.25 PhP2
Tin Cans 251 62.75 PhP6-PhP7
Source: Lingsat Materials Recovery Facility Report for April 2011
Private Sector Materials Recovery System Most of the recyclables generated within the city flow directly into the city
junkshops through its IWBs and/or through their own collection system. At present,
there are 16 junkshops that are registered but there are illegal junkshops as well. The
City has enacted a Junkshop Ordinance which sets the requirements for the
establishment of accredited junkshops in the City.
Some of the junkshops studied formalized their business by getting registered with the
Department of Trade and Industry (DTI) and or the Securities and Exchange
Commission (SEC). They also secured their business permit from the City
Government. To get the business permit, the junkshops follow the permitting process
followed by other businesses: i.e. barangay clearance, fire protection clearance,
sanitation clearance, zoning or locational clearance. They also secure a provincial
permit by paying for a road tax so that they can transport their goods outside the city
limits. Junkshops with a 10,000 sq meter facility are required to get a Certificate of
Non-Coverage (CNC) or an Environmental Clearance Certificate (ECC) from the
Department of Environment and Natural Resources (DENR). The respondents did not
encounter any problems related to the processing of their business permits except for
one who cited the slow processing of ECC application by the DENR.

60
Table 23 presents is a profile of selected junkshops in San Fernando City. Three of
these are the largest junkshops in the city while the two others are relatively smaller
junkshops.
Table 23: Profile of Selected Junkshops in San Fernando City Particulars Junkshop
B-1
Junkshop
B-2
Junkshop
B-3
Junkshop
B-4
Junkshop
B-5
Age of Owner 59 30 51 53 41
Educational
Attainment
College,
Civil
Engineering
undergra-
duate
College
undergrad--
duate
College, civil
engineering
College College,
Undergra-
duate
Start of
business
1997 2009 1996 2008 2000
Work hours No Response 8-5/day/6
days/wk
8-5/day/6
days/wk
8-5/day/6
days/wk
8-5/day/7
days/wk
No. of
workers
25 regular 12 regular;
6 part-time
7 regular;
6 part time
1 regular 1 regular
Benefits • PhP300/
day – driver
• P200 –
travel
allowance
if outside
SFC
• P200-
P240/day –
worker
• P100 travel
allowance
if outside
San
Fernando
• Food
• PhP150/
day
Transport-
ation
• Medical
benefits
• Philhealth
• Life
insurance
• PhP250/d
ay
• SSS
• Philhealth
• Group
insurance
• PhP250/
day
• Food
• Housing
• Trans-
porta-tion
• Philhealth
• PhP250/
day
• Housing
• SSS
• Phil-health

61
Particulars Junkshop
B-1
Junkshop
B-2
Junkshop
B-3
Junkshop
B-4
Junkshop
B-5
allowance
• Emergency
medical
and basic
needs loan
Revolving
Monthly
Capital
PhP250,000* PhP 1
million
PhP1 million PhP50,000 PhP50,000
Net Monthly
Income
No answer PhP60,000 PhP30,000* PhP10,000 PhP10,000
*Understated as can be gleaned from the volume of recyclables purchased and sold
Buying and Trading Activities
Some of the junkshops provide itinerant waste buyers with buying capital and
transport. There are no formal agreements among the itinerant waste buyers and
junkshops except that itinerant waste buyers are obliged to bring their recyclables to
the junkshop that provided them with buying capital.
Based on the interview with junkshop operators, they usually pick up the recyclables
from commercial establishments and companies and/or buy recyclables door-to-door.
There is also trading among the local junkshops so that a smaller junkshop may
transport its recyclables to a bigger junkshop or the bigger junkshop would pick up
the recyclables from the smaller junkshop. The junkshop operators usually have
several vehicles in varying sizes to accommodate their buying and trading
requirements.
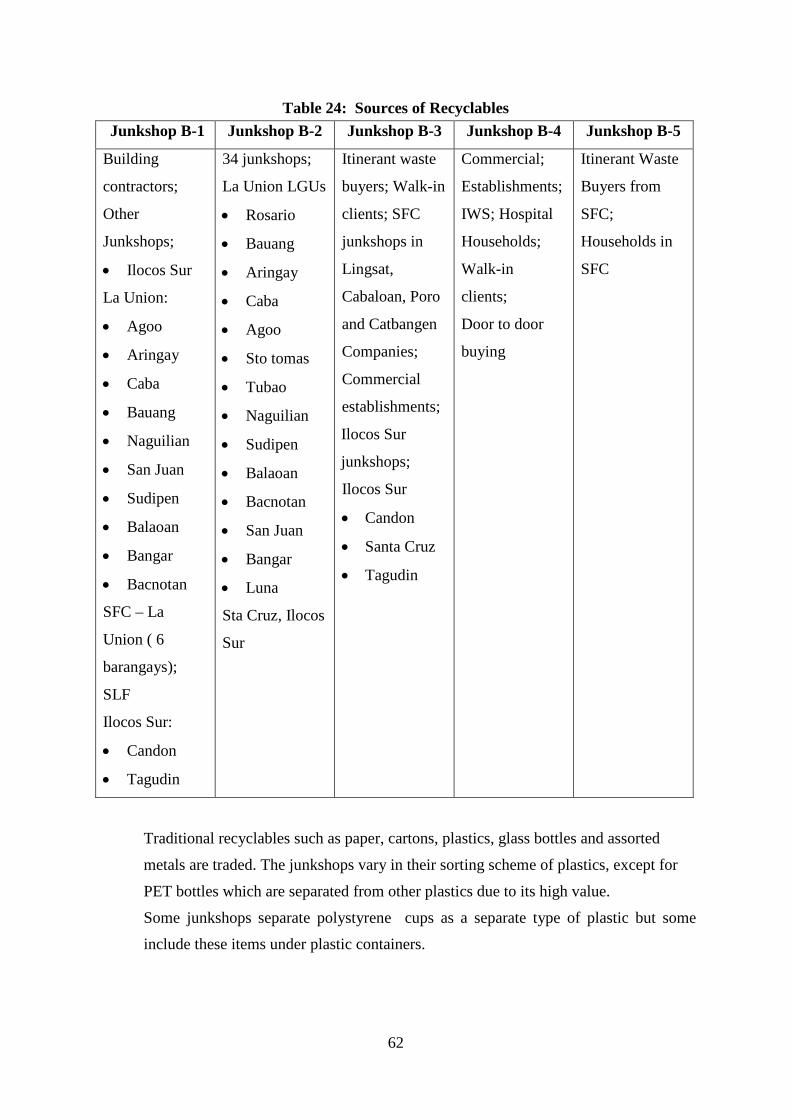
Table 24 shows that recyclables flowing into the city include recyclables from
neighboring municipalities in the provinces of La Union and Ilocos Sur.
62
Table 24: Sources of Recyclables Junkshop B-1 Junkshop B-2 Junkshop B-3 Junkshop B-4 Junkshop B-5
Building
contractors;
Other
Junkshops;
• Ilocos Sur
La Union:
• Agoo
• Aringay
• Caba
• Bauang
• Naguilian
• San Juan
• Sudipen
• Balaoan
• Bangar
• Bacnotan
SFC – La
Union ( 6
barangays);
SLF
Ilocos Sur:
• Candon
• Tagudin
34 junkshops;
La Union LGUs
• Rosario
• Bauang
• Aringay
• Caba
• Agoo
• Sto tomas
• Tubao
• Naguilian
• Sudipen
• Balaoan
• Bacnotan
• San Juan
• Bangar
• Luna
Sta Cruz, Ilocos
Sur
Itinerant waste
buyers; Walk-in
clients; SFC
junkshops in
Lingsat,
Cabaloan, Poro
and Catbangen
Companies;
Commercial
establishments;
Ilocos Sur
junkshops;
Ilocos Sur
• Candon
• Santa Cruz
• Tagudin
Commercial;
Establishments;
IWS; Hospital
Households;
Walk-in
clients;
Door to door
buying
Itinerant Waste
Buyers from
SFC;
Households in
SFC
Traditional recyclables such as paper, cartons, plastics, glass bottles and assorted
metals are traded. The junkshops vary in their sorting scheme of plastics, except for
PET bottles which are separated from other plastics due to its high value.
Some junkshops separate polystyrene cups as a separate type of plastic but some
include these items under plastic containers.
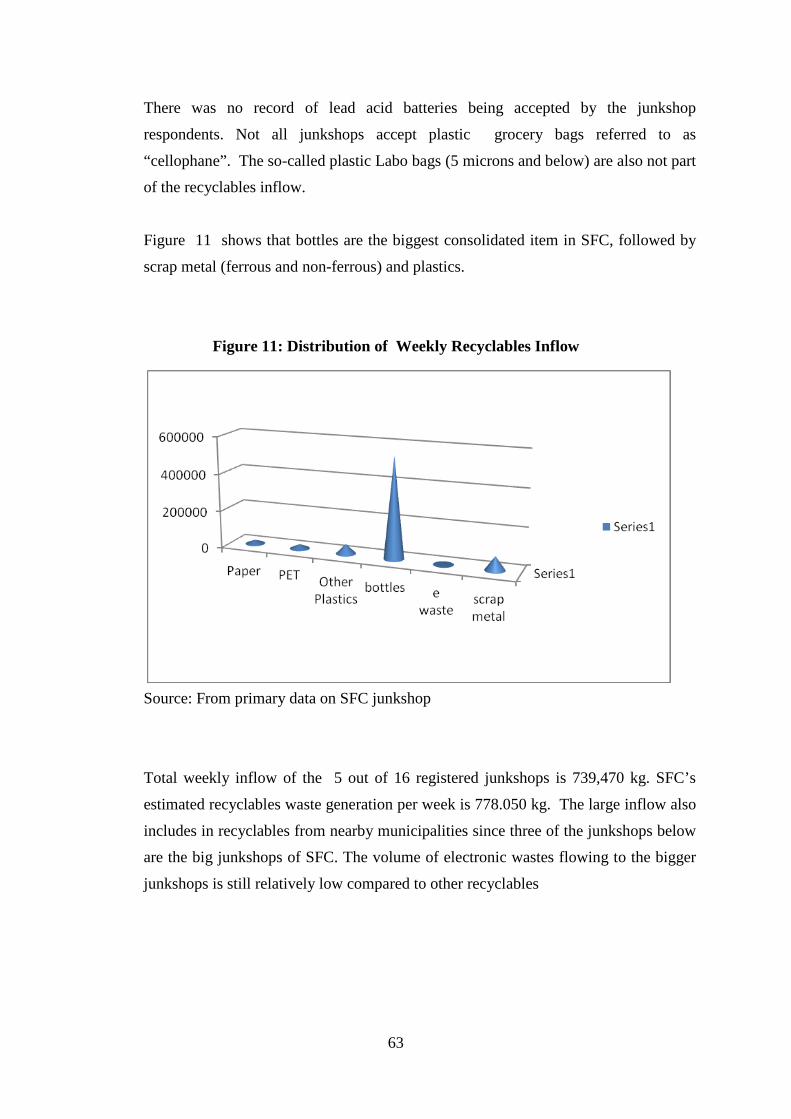
63
There was no record of lead acid batteries being accepted by the junkshop
respondents. Not all junkshops accept plastic grocery bags referred to as
“cellophane”. The so-called plastic Labo bags (5 microns and below) are also not part
of the recyclables inflow.
Figure 11 shows that bottles are the biggest consolidated item in SFC, followed by
scrap metal (ferrous and non-ferrous) and plastics.
Figure 11: Distribution of Weekly Recyclables Inflow
Source: From primary data on SFC junkshop
Total weekly inflow of the 5 out of 16 registered junkshops is 739,470 kg. SFC’s
estimated recyclables waste generation per week is 778.050 kg. The large inflow also
includes in recyclables from nearby municipalities since three of the junkshops below
are the big junkshops of SFC. The volume of electronic wastes flowing to the bigger
junkshops is still relatively low compared to other recyclables

64
Table 25: Inflow of Recyclables in Selected SFC Junkshops Items Junkshop
B-1/wk
Junkshop
B-2/wk
Junkshop
B-3/wk
Junkshop
B-4/wk
Junkshop
B-5 /wk
White paper 500 kg 1 ton 1 ton 500 kg
(includes
assorted
paper)
Assorted
Paper
2 tons 1 ton
Boxes/cartons 2.5 tons 7 tons 2.5 tons/wk 2
tons/month
200 kg
PET 2-3 tons 7 tons 2 tons 12.5 tons 250 kg
Glass bottles 300 tons 25 tons 200 tons (per
month)
12.5 tons 5 tons
Polystyrene
Cups
10 kg
Plastic
Containers
12.5 tons
(includes
hard plastics)
10 tons 2 tons per
month
350 kg per
week
(includes
hard
plastics
300 kg
Monoblocks 500 kg
Plastic (hard) 1.5 tons 700 kg/month 100 kg
E-waste 800 kg 400 kg 500 kg/month Rarely
Steel 20 tons 8 tons 30
tons/month
500 kg 1 ton
Copper 300 kg 200 kg 10-20 kg 50 kg
Aluminum 200 kg 150 kg 500 kg/month 10-20 kg 50 kg
Aluminum
Can
500 kg 100 kg 300kg/month 10-20 kg 20 kg
Yero 4 tons 3 tons/month 300 kg 400 kg
Tin Cans 5 tons 300 kg 200 kg
Zinc 50 kg

65
The lower buying and selling rates of recyclable items are those that are utilized by
the small junkshops. The higher buying and selling rates pertain to the big junkshops
who have the volume and means to transport their materials to bigger junkshops,
consolidators or the nearest recyclers. Thus the buying and selling prices vary from
junkshop to junkshop. Buying price variances for the same types of recyclables take
place due to competition among the junkshops.
Payment mode between the suppliers of recyclables, i.e. itinerant waste buyers, walk-
in clients, commercial establishments and institutions and junkshops are on cash
basis. Goods are paid with cash as soon as they are delivered to the buyer. There are
also cases when payments are made in advance by a bigger junkshop to a smaller
junkshop to ensure the inflow of recyclables.
Similarly, the consolidators and recycling industries have different modes of payment.
They pay the junkshops cash on delivery, provide cash advance payments or pay
through post-dated checks. The junkshops update their price information by calling
or texting (SMS) the buyers of their materials.

66
Table 26: Buying and Selling Prices of Recyclables Types of
Materials
Buying Prices
(PhP per kg)
Selling Prices
(PhP per kg)
White Paper PhP5 – PhP10 PhP8 - PhP13
Assorted Papers PhP2-3 PhP3.50 – PhP5
Boxes/cartons PhP5 – PhP7.30 PhP6 – PhP8.40
PET bottles PhP12 –PhP26 PhP25 – PhP41
Glass bottles PhP0.10 – PhP1 PhP0.35 – PhP1.85
Plastic containers PhP12 – PhP16 PhP15 - PhP23
Plastic (hard) PhP8 – PhP12 PhP12 – PhP17
E-waste PhP10 - PhP15 PhP14 –PhP30
Steel PhP14 – PhP18 PhP17 – PhP21
Copper PhP130 – PhP280 PhP160 - PhP320
Aluminum PhP40 – PhP56 PhP60 – PhP68
Aluminum cans PhP40 – PhP50 PhP45 – PhP56
Yero PhP9 – PhP14 PhP11 – PhP14.30
Tin Cans PhP6 – PhP7 PhP8 - PhP9
Destination of Recyclables sold by Junkshop Respondents
Transport costs and selling prices of consolidators are factors which affect the
decision of junkshop owners to whom and where they would sell their recyclables.
Smaller junkshops save on transport costs by selling to the bigger junkshops in the
city who specialize in consolidating certain types of recyclables. A Caloocan City
based paper consolidator has a buying station in San Fernando City. Two of the
junkshops interviewed used to sell paper waste to Trust Paper International Company
(TIPCO), in Mabalacat, Pampanga. However, due to transport costs they now bring
their paper wastes to consolidators in Dagupan City and Mangaldan, Pangasinan.
For PET bottles the smaller junkshops sell to the big SFC junkshops or nearer to the
plastics consolidator in Bauang, La Union. The PET plastics are then brought to
Manila to be exported or are sold to PET recyclers in Valuenzuela City.

67
Other plastic wastes are either transported directly to Valenzuela City where most of
the plastic recycling industries are located or at nearby recyclers such as Bauang, La
Union or Mangaldan and Rosales, Pangasinan where there are plastics consolidators
with semi-processing capacity.
One of the big junkshops in SFC and another junkshop in Bauang, La Union are
consolidators of glass bottles. The bottles are then transported to La Tondeña
Distillery in Sta Barbara, Pangasinan. Some glass bottles are also sold at the local
market for reuse.
Assorted metals are sold locally to Chinese and Korean consolidators at Poro Point
where the materials are loaded on a ship for export. Some of the metals are also sold
to consolidators in San Juan and Bauang in La Union; Dagupan City; Sison,
Pangasinan and a smelting plant in San Simon, Pampanga. Some of the consolidators
pick up the recyclables from SFC. The consolidators then export the scrap metal.
According to key informants, the materials are exported to China.
Impact of Economic Recession on the Flow of Recyclables
Changes in the demand for post consumer materials as raw materials for local and
foreign manufacturing affect the whole recycling chain. The traders and consolidators
of SFC sell their scrap either to local processors and/or to traders and exporters. The
fluctuation in demand is usually felt by the small junkshops and IWBs when the
bigger junkshops and consolidators stop buying or lower their buying price. Many
junkshops had to close down operations or lost money during the post China Olympic
Games period when the demand and buying price specially for scrap metal went
down.
For instance, one junkshop bought scrap metal at PhP20 per kg but the selling price
went down to PhP8/kg then later to PhP3/kg. The buying price of PET was PhP15-
PhP16 per kg but the selling price went down to PhP5/kg. The junkshop owner coped
by stockpiling his 3 tons of scrap metal. Another junkshop closed its operation for
five months and sold off their existing inventory at a loss. Other three big junkshops
suffered a decrease in income also but did not close down.
68
Factors Affecting Recyclables Waste Flow
In the City and barangay led system, weakly implemented segregation at source and
mixed waste collection affect the quality of recyclables that reach the barangay MRFs
and the recovery activities at the SLF. The presence of both accredited and non-
accredited wastepickers facilitate the recovery of recyclables. The accessibility of
two junkshops, one of which is accredited by the City Government as its partner make
the trading of scrap faster.
The establishment of recovery programs in schools also help improve the quality of
recyclables that flow to junkshops. The waste diversion requirement of Republic Act
9003 is also a pushing factor for the City to engage in waste recovery activities in
barangay MRFS and schools but they have no local policy and program providing
incentives and support for those involved in the junkshop business and recyclable
waste trade.
At the industry level, the SFC junkshops have no functional association that can
represent their interests vis-à-vis potential support from local government such as
fiscal and non-fiscal incentives. Because the junkshops and their partner IWBs
operate on a cash basis, they are able to recover most of the recyclables generated by
households, institutions and commercial establishments.
The presence of big junkshops also enable SFC to consolidate materials coming from
nearby municipalities of Ilocos Sur and La Union. The presence of a port in SFC also
facilitate the export of scrap to other countries such as China. The availability of
processors and traders in nearby municipalities of La Union and Pangasinan is also a
positive factor in the trading of recyclables. For instance, the accessibility of the
Tanduay Distillery Plant in Santa Barbara, Pangasinan probably accounts for glass
bottles being the top item consolidated by the SFC junkshops.
Issues and Challenges
• The city SWM approach to devolve waste collection at the barangay or cluster barangay levels are intended to strengthen segregation-at-source and to encourage
waste recovery and re-use. However, the Lingsat MRF case shows a decreasing

69
trend in the volume of recyclables recovered as waste generators opt to sell to
itinerant waste buyers and/or junkshops rather than giving it to the garbage trucks.
• Despite a city-wide ordinance requiring segregation-at-source, most barangays including those who have formulated SWM ordinances still do not enforce
segregation; most have not conducted information campaign on SWM.
• The inflow and outflow of recyclables at the barangay MRFS, junkshops, collection crew and SLF are not systematically monitored.
• There is no complete data on waste recovery at the barangay MRFs, junkshops and the City Sanitary Landfill; only the accredited wastepickers recovery are
monitored.
• The number of non-accredited wastepickers is not known to the City; there are as yet no measures on how to solve the issue of non-accredited wastepickers.
• The presence of MRFs and junkshops and scavenging by the collection crew has resulted to the decrease in the recyclables which the SLF wastepickers are able to
collect and sell.
• The presence of the wastepickers in the SLF is a violation of the provisions of RA 9003 on disposal management.
• The wastepickers at the SLF, waste workers at the junkshops and collection crew do not have access to social benefits and protection. They do not use personal
protective equipment.
• One of the main challenges of the junkshops is the cost of transport.
• The City has no support program for junkshops. There are no economic incentives provided to them.
• Buying prices vary among different junkshops. Increasing the buying price even by a few centavos can cause a seller to switch from one junkshop to another.
• The association of junkshop owners and operators is not functional.
• The city has a Junkshop Ordinance but there are still illegal junkshops which are able to set up their business within the city. Also, the provisions of the ordinance
is only focused on regulating the impact of junkshops on traffic, sale of stolen
goods, and sanitation and health. There are no provisions for monitoring waste
inflow and outflow and curbing unsafe practices such as informal E-waste
recycling.

70
II.3. Case Study C: Quezon City, Metro Manila
LGU Profile Quezon City is the largest among the 17 cities and municipalities in the National
Capital Region (NCR). The City has a total land area of 161,112.12 hectares
covering one-fourth of the total land area of the National Capital Region’s land area.
Quezon City is bordered by Manila to the southwest, by Caloocan and Valenzuela
City to the west and northwest.
Its population in 2009 was 2,861,081 and the total households was 535,890. In 2010
NSO projection was 2,945,644 . The city is subdivided into four districts and 152
barangays. Forty percent of its residents are in formal settlers.
The following is the distribution of business establishment, by industry in 2006:
wholesale and retail trade (47%); manufacturing (12%); hotels and restaurants (13%);
real estate, leasing and various business services (8%); community, social and other
personal services (6%); and others (14%). The city is dominated by small and
medium-scale business establishment engaged in the distribution of finished products
and the provision of basic personal services. Most of the businesses in Quezon City
are small, marginal, and family owned.
Solid Waste Profile
Based on Figure 12, the waste generation of Quezon City has increased from
1,302.17 metric tons in 2001 to 1,820.08 metric tons in 2008 as a consequence of its
estimated annual population growth rate of 2% and increase in commercial and other
business activities.

71
Waste Generation(Metric Tons Per Day)
1,335.55
1,820.08
1,768.441,694.46
1,641.501,592.741,547.91
1,302.171,200.00
1,300.00
1,400.00
1,500.001,600.00
1,700.00
1,800.00
1,900.00
2001 2002 2003 2004 2005 2006 2007 2008
Figure 12: Waste Generation Trend 2001-2008
Source: QC SWM Report,2008.
The per capita solid waste generation of Quezon City is pegged at 0.66 kg/day based
on its 2003 Waste Characterization and Assessment Study (WACS). Hence, using
the projected 2009 total population of 2,861,081, total waste generation is estimated
at 1,889 tons per day. Figure 13 shows the percentage distribution of the waste by
type.
The composition of residual waste include the following: construction demolition
wastes such as soil, sand, rock, concrete, ceramics, fines, textiles, leather, diapers,
cigarette butts, composite and other types of plastics, ash charcoal.
Special wastes generated include tires, animal remains, paint, oil/oil filters, small
batteries, medical waste and electronic appliances as listed in QC’s 2003 WACs.
SWM System
The formal SWM system is implemented by Quezon City through its Environmental
Protection and Waste Management Department (EPWMD). It begun as Task Force
Clean and Green and became a full department in 2000 through City Ordinance SP-
982, S2000. Its mandate include:
• implementation of an efficient garbage collection and disposal system;
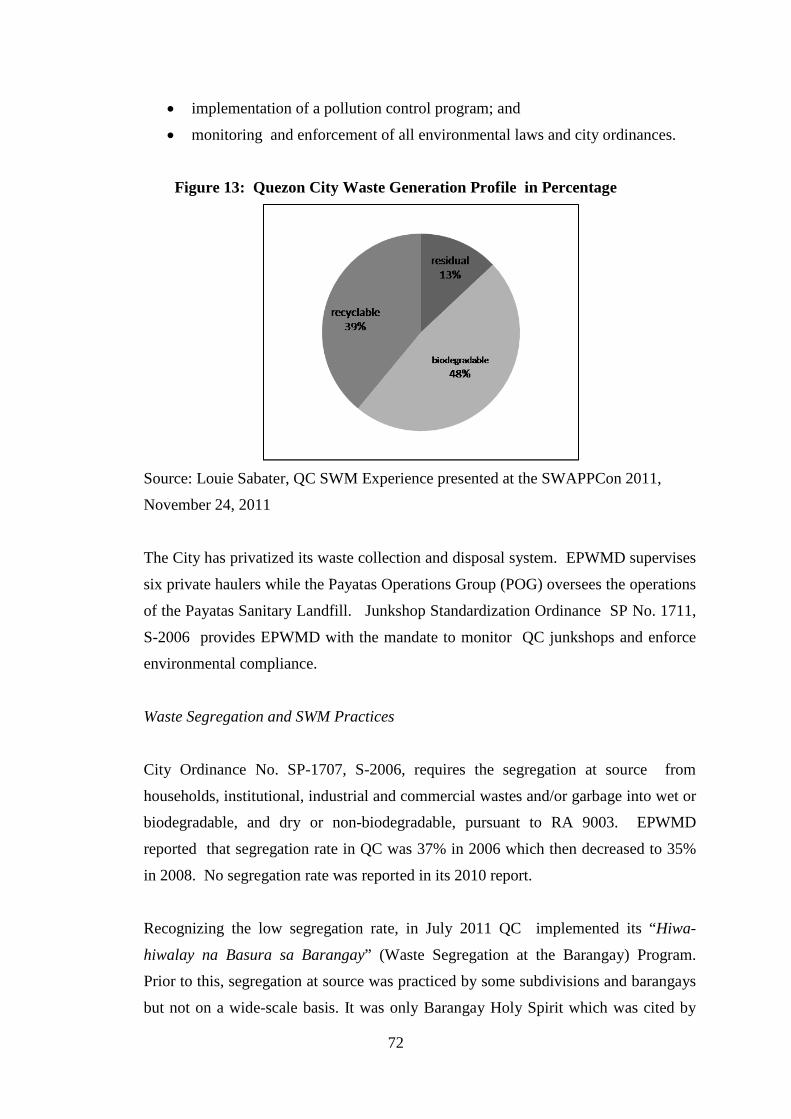
72
• implementation of a pollution control program; and
• monitoring and enforcement of all environmental laws and city ordinances.
Figure 13: Quezon City Waste Generation Profile in Percentage
Source: Louie Sabater, QC SWM Experience presented at the SWAPPCon 2011,
November 24, 2011
The City has privatized its waste collection and disposal system. EPWMD supervises
six private haulers while the Payatas Operations Group (POG) oversees the operations
of the Payatas Sanitary Landfill. Junkshop Standardization Ordinance SP No. 1711,
S-2006 provides EPWMD with the mandate to monitor QC junkshops and enforce
environmental compliance.
Waste Segregation and SWM Practices
City Ordinance No. SP-1707, S-2006, requires the segregation at source from
households, institutional, industrial and commercial wastes and/or garbage into wet or
biodegradable, and dry or non-biodegradable, pursuant to RA 9003. EPWMD
reported that segregation rate in QC was 37% in 2006 which then decreased to 35%
in 2008. No segregation rate was reported in its 2010 report.
Recognizing the low segregation rate, in July 2011 QC implemented its “Hiwa-
hiwalay na Basura sa Barangay” (Waste Segregation at the Barangay) Program.
Prior to this, segregation at source was practiced by some subdivisions and barangays
but not on a wide-scale basis. It was only Barangay Holy Spirit which was cited by

73
the City government as already with on-going waste segregation at source even prior
to the enactment of RA 9003.
The EPWMD conducted a three day summit in June 2011 to reorient the Barangay
Chairpersons and the Kagawad in charge of the barangay’s SWM program. Three
hundred IEC campaigners were also deployed by the private haulers to the different
parts of the city. The people were informed about the separate collection schedules for
biodegradable and non-biodegradable wastes.
Three key informants from Barangay Payatas were interviewed regarding their
awareness of the implementation of RA 9003. They stated that they are aware that
wastes should be classified into biodegradable, recyclable, and non-biodegradable/non
recyclable wastes while the fourth key informant was aware of segregation into
biodegradable and non-biodegradable only. They are also aware that of the SWM
services and activities of the barangay.
Majority of those interviewed were also aware of the prohibitions on burning,
dumping and littering of waste. Majority also rated the barangay’s SWM performance
as very good due to their satisfaction with the SWM collection services and its
information dissemination activities. Only one respondent made the observation that
enforcement was not satisfactory.
With regards to SWM practices related to specific types of wastes – all respondents
sold the following as recyclables to the itinerant waste buyers or junkshops: paper,
cartons, glass bottles, tin cans, aluminum, PET bottles and plastic containers. Kitchen
waste and yard wastes are generally used as animal feed and composted or used as
fuel for cooking except for one informant who gave the yard waste to the garbage
truck.
Waste Collection
The city-managed garbage collection service is implemented through a “Package
Clean-up System” where the service is contracted out to the private sector. The
contractor is given the full responsibility to manage/administer and directly carry out
actual collection, cleaning and disposal of solid wastes from various sources. These

74
include households, commercial establishments, markets, institutions like offices,
schools, churches and streets, alleys, vacant public lots or designated collection points
within the area of assignment.
In 2010, there were six private companies servicing the five districts and sub districts
of the City. A combination of 10-wheeler, 6-wheeler trucks and compactor trucks
were used. Collection is on a door-to-door policy which means that garbage should
be brought out only when the collecting truck has arrived and at no instance should
the garbage touch the ground. However, the City did not require its contractors to
follow a segregated waste collection system as required by RA 9003.
Further, since the system calls for a “Package Clean-up”, the provision of street
sweepers, conduct of information and education campaigns on solid waste
management, riverways management, bulky waste collection and a subsystem of
garbage collection for inaccessible areas are all included in the obligations of the
contractors.
In 2001, before the system was implemented, the City was shelling out no less than
PhP70 million per month on garbage collection. Now, the City is only spending
around PhP 47 million per month as a result of the package clean-up system. The
City is able to collect from 93.4% of the total households under its jurisdiction. The
EPWMD 2010 Report states that there were a total of 136,042 garbage collection trips,
an average of 377.89 trips daily. Its 2008 report recorded collection efficiency at 99%.
Daily average of waste collected in 2010 was 1,027.80 tons.
Aside from City government contracted garbage collection, there are 56 barangays
with independent collection systems. Barangay Payatas is one of these barangays.
Cash reimbursements incurred in the collection of waste in their own jurisdiction are
given to the barangays by the city government. The incentive scheme is provided in
City Ordinance No. SP-1191, Series of 2002 - an ordinance granting incentives to all
barangays utilizing their own trucks for solid waste collection service in their
respective barangay.

75
Waste Disposal
Before the establishment of the current sanitary landfill, Quezon City has been using
the 22.3 hectare Payatas dumpsite since 1973 as an open dumpsite. In July 2000, a
major trash slide occurred causing the death of more than 300 wastepickers. In 2004
it converted its open dumpsite in Payatas into a controlled dumpsite in compliance
with the provision of RA 9003 to close all open dumpsites within three years after the
enactment of the law. In 2007 QC in partnership with PANGEA Green Eneregy,
installed a methane gas capture system as part of its dumpsite closure and
rehabilitation program. The Payatas Controlled Dumpsite was finally closed at the end
December 2010.
From 2001 to 2008, total waste intake of the Payatas Controlled Dumpsite amounted
to 18,669,994 cubic meters as shown in Table 27. .
Table 27: QC CDF Waste Intake
Volume (total in cu. m)
Weight(mt/day) Total Daily
Average2001 2,727,554 1,495 No Data No Data2002 2,522,848 1,382 No Data No Data2003 2,294,218 1,257 No Data No Data2004 2,393,287 1,308 160,876 4402005 2,222,281 1,218 150,769 4132006 2,230,518 1,222 152,571 4182007 2,136,337 1,171 149,806 4102008 2,142,951 1,171 150,044 410Total 18,669,994
Truck TripsWaste IntakeYear
Source: EPWMD Accomplishment Report 2009
Currently, Quezon City disposes its waste at the 3.2 hectare Payatas Sanitary Landfill
which is owned and operated by IPM-Environmental Services Inc. (IPM-ESI). It was
formally opened in January 2011. The Payatas Operations Group is the oversight
group responsible for the SLF while IPM-ESI is in charge of the SLF operations and
management.
The composition of waste brought to the QC sanitary landfill is shown in Figure 14.
The biodegradable waste is 54%, recyclable wastes is 16%, residual wastes is 23%
and special wastes is 7%.

76
Figure 14 : 2010 Waste Composition at the QC Integrated Waste Management Facility
Source: Louie Sabater, Quezon City presentation, SWAPPCON 2011, November 24,
2011
Residual wastes disposed in the landfill cell are diapers, cigarette butts, composite
plastics, textiles, rubber, animal remains, inert or inorganic (rocks, soil, ash etc) and
biodegradables contaminated because of being mixed with other wastes. Special
wastes included paint, small batteries, electronic appliances and medical waste. The
average daily volume of waste disposed at the SLF in 2011 is estimated at 1,200 tons
per day of which 200 tons (17%) are recovered at the MRFs and 1000 tons are
finally covered8
.
Recyclable Waste Flow
In the 2009 EPWMD Report, recyclable waste generation for one year from all waste
generators: residential, commercial, institutional and industrial was estimated at
329,585.97 tons. Its composition is shown in Figure 15. The total plastics reported
was 21.36% but included diapers and cigarette butts, others and composite. Estimated
plastics composition minus these residuals is 20%.
8 Interview with Payatas Operations Group, 2012.

77
Figure 15: Composition of Recyclable Waste Generated in Quezon City
Source: Wilson, David et al. Comparative Analysis of Solid Waste Management in
Cities Around the World, in UN Habitat’s Third Global Report on Water and
Sanitation in the World Cities, 2010
Figure 16 provides an overview of the recyclable waste flow in Quezon City. From
waste generators recyclables flow through the formal system wherein recyclables are
recovered by the City through accredited wastepickers in Payatas and through
barangay MRFs. There are also special recycling events where the City partners with
institutions and the private sector for waste recovery.
Recyclables also flow through the informal system where recyclables are recovered
by street wastepickers and itinerant waste buyers employed by illegal junkshops.
There are also instances when waste generators go directly to junkshops and skip
intermediaries such as the IWBs, MRFS or the garbage crew. Some private haulers
also recover recyclables in their own MRFs prior to transporting wastes to the SLF.
Small junkshops sell to big junkshops which also engage in the consolidation of
recyclables.

78
Figure 16: Quezon City Recyclable Waste Flow
LGU Managed Waste Recovery System
Subdivision-Based Waste Recovery
Ordinance No. SP 1501, S-2005 requires subdivisions developers and/or owners in
QC to provide sufficient space for the installation of materials recovery facilities to
accommodate the recyclables and biodegradable wastes generated by homeowners. EPWMD was tasked to implement and enforce this ordinance. The average volume of
biodegradables composted by subdivisions in 2011 was 9,647.73 kgs. per day. There
was no data on the number of subdivisions complying with the ordinance and the
recyclables recovered and traded by the subdivisions.

79
School-Based Waste Recovery
EPWMD also mobilizes student and youth organizations through its Hukbong Luntian
Para sa Kalikasan where student organizations are given environmental management
trainings and are encouraged to implement environmental projects such as recycling,
composting, tree-planting etc.
The Hakot Bulasi sa Eskwela Project is under this program. This project started in
2008 and was formerly called Sinop Bulasi sa Eskwela Project. The project target is
to cover all public schools in Quezon City. Its goals are:
a. To impart the values of environmental stewardship among the youth by
initiating a school-based waste segregation and recycling program;
b. To make the practice of recycling part of the school culture; and
c. To increase the rate of school-based waste diversion.
Participating schools are required to set a day per month wherein students will bring
recyclables to school. Equivalent points are earned by students which they can
redeem in the form of school supplies or basic commodities. For 3 months, in School
Year 2009-2010 recovery amounted to 97,927.8 kg of recyclables in the 28 schools
that participated in the project.
Table 28: School- Based Recyclables Collection Results
Month Total Weight
(kg)
Total Sales Ave. volume
per school
Ave. amount
per school
Dec 2009 20,349.70 42,027.95 726.78 1,501
Jan 2010 35,068.10 65,286.25 1,252.43 2,331.65
Feb 2010 42510.00 76,979.80 1,518.21 2,749.28
Total 97,927.80 184,294.00 3,497.42 6,581.93
Average 32,642.60 61,431.33 1,165.81 2,193.98
Source: EPWMD Report 2010
This is a joint activity of EPWMD, IPM, Green Lights Inc., QC Linis Ganda and
Rotary Club of QC. As of April 2011, around 21 % of all public elementary and high
schools in the city are already included in the project.

80
Waste Markets
Waste Markets are held in selected shopping malls every last Friday and Saturday of
the month to promote recycling. Waste markets are also regularly held at the Quezon
City Hall. It is in these waste markets that recycling of non-traditional wastes such as
ink cartridges, lead acid batteries and waste electronics were first introduced. In 2008,
the total amount of recyclables traded was 240,994 kgs with paper as the most traded
with E-waste and plastics as 2nd and third.
Figure 17. Waste Markets’ Weight of Recyclables Sold (Kgs.)
Source: 2009 EPWMD Report
In 2010, the amount traded went down to 8.433.39 tons. According to Linis Ganda,
QC’s junkshop partner in its Waste Markets, some of the sellers of scrap are already
selling directly to traders and junkshops instead of waiting for the Waste Market
schedule which is held only twice a month.
Barangay Recovery System
Quezon City barangays who achieved at least 25% waste diversion are awarded
monetary incentives by the City through Ordinance No. SP-1203, S-2002 – an
ordinance granting incentives to barangays practicing best solid waste management.

81
Table 29: QC Barangays with Best SWM Practices Award 2004 2005 2006 2007 2008
1st Place Holy Spirit Vasra Paang
Bundok
Mariana Bagumbuhay
2nd Place UP Campus Balonbato Greater
Lagro
Pinagkaisah
an
Phil-Am
3rd Place Phil-Am Bagumbuhay Horseshoe
and UP
Village
Greater
Lagro
Pansol
4th Place Bagumbuhay Imelda
Source: EPWMD Accomplishment Report, 2008
In 2010, Barangay Bagumbuhay and Horseshoe for their waste reduction initiatives
awarded P460,369.27 for remarkable accomplishment in SWM in accordance with
Ordinance SP 1203, Series 2002.
In 2004, the EPWMD initiated its Sinop sa Basura Program to assist the barangays in
implementing their own solid waste management programs. The Program helped the
barangays in the organization of their SWM committees, preparation of SWM plans,
MRF establishment and information dissemination.
By 2008, there were 50 Barangays all over the City with Materials Recovery
Facilities (MRFs). These barangays initiated their own recycling activities while 45
of the 50 had composting activities (composting conceptually includes other
ecological means of managing biodegradable wastes such as the collection of kitchen
waste for livestock feeds). Waste diversion contribution of barangays was at a low
2.35% in 20099
.
In 2010, there were only 33 existing materials recovery facilities. These facilities
were recovering 31,687.80 kgs./day of biodegradable waste and 30,916.94 kgs of
recyclable wastes /day representing .04% of the total recyclables recovered in Quezon
City. Only 7 barangays were reported to have composting activities by end of 2010.
9 SWAPP, Economic Aspects of Informal Sector Activities in Solid Waste Management,
City Report for Quezon City. October 2009

82
The decrease in the number of MRFs and composting activities may probably be
attributed to changes in barangay leaderships as a result of the 2007 barangay
elections as well as problems in management including sustaining funds for MRF and
composting operations. The increasing household awareness of the economic value
of recyclables also decreased support for MRFs since people preferred to sell their
recyclables rather than have it collected by the barangay MRFs without any financial
or materials exchange.
In 2011, Quezon City implemented a campaign to push barangays to implement their
responsibilities in waste segregation, MRF establishment and composting. Some of
the reasons attributed for low compliance of barangays are: lack of political will,
manpower, funds, space for the establishment of an MRF, and technical capabilities in
the operations of composting systems and compost marketing challenges.
Waste Recovery at Barangay Payatas
Barangay Payatas has a population of 200,000. There are 60,000 households
distributed in Areas A and B. Barangay Payatas’ estimated monthly waste generation
is 3,360 tons and total monthly recovery is 42 tons which is only 1% of the total
waste generation in the barangay. The barangay operates a mixed waste SWM
system although it has started to conduct segregated collection in some parts of Area
A. It allocates P3 million for SWM annually out of its P43 M budget.
It has one ten-wheeler truck with a capacity of 18 cubic meters , a six wheeler truck
with 10 cubic meters capacity and 7 mini dump trucks with a capacity of 8 cubic
meters. Barangay Payatas employs 30 workers assigned as drivers and paleros.
The employees also do sorting at the Payatas MRF on a rotating basis every two days.
The paleros are paid an allowance of PhP3,000 per month and 50% of the net
proceeds of recyclables recovered at the MRF. This amounts roughly to
PhP50/week/employee. The paleros are also allowed to recover and sell non-
traditional scrap materials such as e-wastes. The MRF Officer takes care of
canvassing the local junkshops to secure the best price for the recovered scrap.

83
Table 30: Inflow of Recyclables in Barangay Payatas MRF Type of Waste Est. Qty
(kg/week)
Selling Price
(PhP)
Destination
White paper 295 PhP10 CARPEL
Assorted paper 3,238 PhP2 CARPEL
Newspaper 44 PhP5 ILS Trading
Cartons 933 PhP5 CARPEL
PP white 141 PhP18 Penaflor Junkhsop
PET 172 PhP25 ILS Trading
Glass bottles 3,130 pieces PhP1 ILS Trading
Plastics (blowing) 129 PhP18 Penaflor Junkhsop
Plastics (sibak) 332 PhP14 Penaflor Junkhsop
Cups (PS) 107 PhP13 Penaflor Junkhsop
PVC 666 PhP5 Penaflor Junkhsop
sacks 2,824 PhP3 Penaflor Junkshop
Tin cans 1,355 PhP10 Penaflor Junkshop
yero 227 PhP14 ILS trading
Source: Barangay Payatas MRF Report, 2011
At the barangay Payatas MRF the top three recyclables recovered per month are paper
(43%), plastics (42%) and scrap metals (15%).
Figure 18:Top Three Recyclables Recovered in Barangay Payatas MRF

84
City Recovery System at the Payatas Sanitary Landfill Facility
Presently, there are 8 Materials Recovery Stations located at the SLF. Each station
has three groups made up of 25 wastepickers. Approximately, 18 trucks dump the
waste into the recovery stations for each shift (4-11 am and 11-5 afternoon shifts).
Average total monthly recovery of all the MRFs is 1,320,965 kg or 1,321 tons.
Figure 19 : Summary of Monthly Waste Recovery Per MRF (kg) in 2011
Source: Louie Sabater, Quezon City presentation SWAPPCon 2011, November 24,
2011
Factors affecting variances in monthly recovery of each station include : variable
amount of recyclables dumped by the truck, variable total number of wastepickers
per MRF due to absentee wastepickers and individual differences in skills,work
attitudes and physical capacities.
The Payatas Operations Group also cited the following problems which hinder
efficient recyclables recovery :
Lack of coordination among the Group leaders and their cluster leaders;
Segregated items are not hauled out on the MRF in time;
Late arrival of junkers which delay the hauling out of materials and payment to
the waste pickers;
Discounts and percentage that junkers imposed on waste pickers;

85
Delays in the submission of reports to the leaders for recording purposes;
Lack of concern or consideration on the part of junkers to waste pickers and their
cluster leaders;
Selective recovery of waste pickers due to fluctuating monetary value of
materials; and
Insufficient storage area of recyclables.
The average daily income of wastepickers is PhP130 from traditional scrap and PhP70
from non-traditional materials which they term as their ”sideline”. Sideline scraps
include pig slop (PhP60/sack), bags, shoes, old clothes, foam, used tires and cotton,
sachets with promotional value (i.e. from raffles organized by manufacturing as
promotional activity), scrap wood etc. Those who are willing to spend more time on
recovery of “sideline” scrap can earn as much as PhP400-PhP500 daily. Table 31
shows the average amount of non-traditional scrap recovered by the wastepickers.
Table 31: List of Non Traditional Recyclables Recovered by Payatas Wastepickers Non Traditional Recyclables Average Kg/month
Plastic linoleum 30,763 Plastic sando bag 10,239 Residual styrofoam 1,825 Reuse bag, umbrella 13,350 Used tire 8,285 Firewoods 101,523 Food scrap 371,116 Foam 17,462 Cotton 5,338 Fabric/tela 21,235 Tarpaulin 45,277 Plehe 3,749 Charcoal (uling) 3,179
Source: PARE Monthly MRF Report, January-August 2011
Due to Quezon City’s proximity to consolidators and end users, the sub-classification
of traditional recyclables is more than the sub-types in the other study areas such as
San Carlos City and San Fernando City in La Union as shown in the Table 32.

86
Table 32: Sub-Classification of Major Recyclables by PARE Major Classification Sub Types
1. Paper • Paper waste no. 2 • Bond Paper • Cartons • Newspapers 2. Bottles Cullets Bottles of assorted sizes 3. Metals o Aluminum
o Steel (bakal) o Aluminum can o Tapalodo/yero (corrugated steel/chassis of
vehicles) o Copper wire o Acrylic trans o Zinc o Stainless metal o Copper (red) o Copper (yellow) o Metal (jalousie) o Tin cans
4. Plastics • Plastic spoons • Plastic cups • Wire covering • Plastic cd • Plastic H-10 • Plastic HDPE (sibak) • Linoleum • Plastic toys (malutong) • PE with print • PE white • PVC pipes and bottles • PET bottles • Tarpaulin • PP white • PP colored • Used plastic sacks • Plastic blowing • Styrofoam • Monoblocks
Source: PARE Monthly MRF Report, January-August 2011
At the MRF station, the wastepickers may opt to sell the scrap to PARE , where all
accredited waste pickers are members. There are 22 accredited buyers (called junker-
affiliates) who are also PARE members. They go to the MRF stations where they

87
weigh and buy the scrap recovered by the wastepickers. The accredited buyer then
sells the scrap to the PARE junkshop.
To date, only 50% of the 1,200 wastepickers sell the scrap to PARE. The other 50%
opt to sell to the junkshops outside the SLF due to better pricing. The lower buying
price of PARE as compared to the other junkshops is due to their present financial
condition. PARE ‘s accumulated capital is PhP200,000. An additional PhP400,000-
PhP500,000 is sourced from a big Payatas junkshop so they are obliged to sell their
scrap to this junkshop instead of being able to seek other dealers with better buying
prices.
For the period January to June 2011, the total amount of recyclables recovered by
Payatas wastepickers was 11,444,956 kgs . The total amount purchased by PARE
during the same period was 2,337,389 kgs. or just 20 %.
The top three items recovered are: paper, plastics and scrap metal as shown in
Figure 20.
Figure 20: Top Three Recyclables in QC SLF

88
Other Waste Recovery Systems at the Payatas SLF
Used Tire Retrieval
The Used Tire retrieval started in 2003 in partnership with Holcim Cement. Used
tires dumped at the disposal facility are retrieved and cleaned before being transported
to Holcim’s plant, where the tires are used as alternative fuel in the production of
cement. Based on the interview of Mr. Louie Sabater of the Payatas Operations Group,
about 450 tons or 65,000 pieces of used tires had been retrieved as of 2011.
Composting
The Payatas SLF has the capacity to compost 3 tons of biodegradable waste daily
through composting and vermi-composting. Unfortunately, there is no data on how
much biodegradable waste is composted at the SLF.
Pilot testing of the DOST Plastic Densifier Technology
This technology was set up at the SLF in order to determine the applicability of the
technology to the kind of waste received at the facility and to study the viability of a
livelihood based on the technology for the wastepickers. Presently, the products
manufactured using the technology include chairs and tabletops, planters, catwalks
and pavers. Based on the pilot test, the hindering factor to the use of the technology is
the added costs since used cooking oil is needed as input to the process.
Recovery of Plastic Bags and Styropor
With regards to thin plastic bags, the Payatas Operations Group has discussed the
problem of sando bags with the Philippine Plastic Industry Association (PPIA). PPIA
has arranged for one of their members to buy these sando bags.
POG, in turn, has selected a buyer from among the PARE members to focus on the
recovery and trading of plastic bags. PARE will buy the plastic bags from the
wastepickers at P1/kg for dirty plastics and P2 for clean and dry ones.

89
The assigned PARE buyer has different options regarding the sale of the recovered
plastic bags. A plastics consolidator and processor (Consolidator-Processor C-6)
based in Novaliches, Quezon City, will buy the plastic bags at PhP4-PhP5 per kg if
clean and dry and recycle it back to sando bags. Transportation cost will be
shouldered by the PARE member for the delivery of the sando bags to the factory.
Another company, Poly-GreenTechnology and Resources Inc, also buys sando bags at
the same price and converts waste plastic into diesel. A certain level of impurities is
tolerated by PolyGreen. Transport costs are to be shouldered by the supplier of waste
plastic. Since Poly –Green Technology and Resources Inc. is located near Payatas,
the designated PARE buyer has been selling the plastic bags to the company.
The Payatas SLF has a styropor densifying machine that allows the recycling of
styropor into pavers and other products. This recovery process is envisioned to be a
source of additional income for the wastepickers but the process requires the
procurement of used oil which is an added cost. Meanwhile the Payatas Operations
Group has initiated contacts with the Polystyrene Packaging Council of the
Philippines for the company to pick up and buy styropor waste recovered by the
wastepickers as an additional option for Styrofoam recovery.
The same PARE buyer for plastic bags was also assigned to buy Styrofoam
packaging materials from industrial applications from the wastepickers. He has
already transported and sold the Styrofoam to a Marikina recycler. However,
recovery of plastic bags and Styrofoam is still erratic because the assigned PARE
buyer has limited capital. Furthermore, transport costs are high, so that his net profit
per kilo is only PhP.50 per kilo.
QC Waste Diversion Profile
Table 33 shows that QC computes its waste diversion rate based on waste materials
diverted by junkshops, barangays, business establishments, subdivisions, schools ,
malls, waste markets and other special marketing activities. The waste diversion rate
does not include materials brought to the SLF and recovered by the SLF wastepickers.

90
Quezon City’s reported diversion rate in 2008 is 37.78% diversion, which exceeded
its goal of 33% diversion from disposal. In 2010, waste diversion rate increased to
38.21%.
Table 33: 2010 Quezon City Waste Diversion Actual Volume Composted Materials (kg/day) Barangay 31,687.80 2.44% Establishments 4,302.50 Subdivisions 9,647.73 Schools 29.09 QC Hall MRF 331.26 Barangays 30,916.94 35.77% Malls 7,255.52 Schools 112.08 Sinop bulasi sa Eskwela Project 3,526.28 Actual Volume of Recycled Materials (kg/day) QC City Hall Waste Market and other recycling activities
1,177.87
Junkshops 632,399.90 Others 735.98 1% TOTAL 675,388.79 38.21%
Source: 2010 EPWMD Report
Private Sector Materials Recovery System
In a 2009 study conducted by SWAPP for a UN Habitat publication, it described
the different recycling chains existing in Quezon City from the individual waste
buyers (formal and informal), registered collectors/junkshops (registered and illegal)
and the recycling industries as shown in Table 34.
Table 34: Recycling Chains in Quezon City Type Unit of measurement Details Source/Dates
Links Or Levels In The Chain – how many times the material is sold/ bought before it reaches the recycling factory
Number of rings in the chain
3 (ave.) EPWMD Sample Survey 2009
Individual Collectors - or persons working
Itinerant waste collectors: 392 Itinerant waste pickers:
Computed from 2009 EPWMD Data

91
Type Unit of measurement Details Source/Dates in families to collect material
1,480 Itinerant waste buyers: 3,700 Garbage collection crew: 926 Dumpsite waste pickers: 3,000 Junkshop personnel: 3394 For a total of 12,892.
Unregistered Buyers And Sellers - in the chain excluding individual collectors and family collectors
Number working without a business registration
740 Junk-shops
EPWMD survey 2008
Registered Buyers And Sellers - in the chain excluding individual collectors and family collectors
Number of registered businesses, permits, pay taxes
246 Business Process and Licensing Office data 2008
Source: SWAPP, Economic Aspects of Informal Sector Activities in Solid Waste
Management, City Report for Quezon City. October 2009.
Quezon City Junkshops
Recognizing the major role of junkshops in the recovery of recyclables, EPWMD
developed its Junkshop Standardization Program in August 2005. Quezon City issued
Ordinance SP -1711, S-2006 regulating the operations of junkshops in the city. They
were required to comply with specific standards to be approved through the issuance
of a clearance by EPWMD prior to getting a business permit. In a survey conducted
in 2007-2008, 740 non-registered and 246 registered junkshops in the city were
identified.

92
Figure 21. Daily Waste Recovery of Junkshops
Junkshop Daily Waste Diversion(kgs / day)
574,909574,909
613,226
408,305400,000.00450,000.00500,000.00550,000.00600,000.00650,000.00700,000.00
2005 2006 2007 2008
Source: 2010 EPWMD Report
The 2007-2008 figures reported by EPWMD show that the trade slowed down as a
result of the economic recession but by 2010, trade had already picked up with a daily
waste recovery of 632,399.90 kgs/day.
Representatives from two junkshop associations in Quezon City were interviewed
during this study. The first one is the Payatas-Litex Junkshop Association which
consists of haulers cum junkshop dealer and junkshop dealers. The other association
is Linis Ganda, Quezon City Chapter.
The table below shows the profile of the interviewed junkshop operators: two with
college education while the other two finished secondary school. Two operators have
been in the business for over a decade while the other two have more than five years
experience in the business. All had regular or full time workers whose salaries range
from PhP270-PhP200 per day and contractual workers usually paid by volume of
materials sorted or handled. Monthly revolving capital ranged from PhP20,000 to
PhP500,000.

93
Table 35: Profile of Selected Junkshops in Quezon City
Particulars Hauler/ Junkshop
C-1
Hauler/ Junkshop C-2
Junkshop C-3
Junkshop C-4
Age of Owner 52 48 54 39 Educational Attainment
High School College 3rd year
High School graduate
College undergraduate
Start of Business May 2004 March 1992 1984 2001 Work hours 8 hrs/6
days/week 10 hrs/ 7 days a week
10 hrs./day 10 hrs/day
No. of workers 10 regular, 15 part time
15 regular, 2 part time
5 regular; 3 contractual
6 regular
Benefits Regular – PHP250/day; Part time- PhP 150/ trip; Benefits- housing, medical, SSS
Regular- PhP 250/day; Part time- PhP350/day; Benefits- housing, medical
Regular – PhP270; Contractual- by volume of waste sorted
PhP 200/ day + 50 food allowance; Benefits- housing
Health problems of workers
Respiratory, physical injuries, sore eyes
Physical injuries, head aches
Coughs and colds
Coughs and colds
Revolving monthly capital
PhP 100,000 PhP 50,000 PhP500,000 PhP 20,000
Net Monthly Income
PhP 150,000/ month – not good
No answer No answer No answer
Buying and Trading Activities
The Payatas-Litex Junkshop and Truck Haulers’ Association is composed of 56
junkshop owners and haulers. The haulers collect wastes from buildings and
business/commercial establishments and subdivisions and bring the wastes to their
MRF for sorting. Residual wastes are then hauled to the Payatas Sanitary Landfill.
The waste generators and the haulers sign an annual contract specifying the terms of
collection, e.g., frequency of collection and monthly or annual fees.
Other members are junkshop owners, whose main suppliers are the garbage crew who
drop off and sell the recyclables recovered from the garbage truck to the junkshops
before reaching the Payatas SLF. Other junkshops also get their supply from the
wastepickers of the Payatas SLF who do not opt to sell their recyclables to the PARE

94
cooperative.
The Metro-Manila Linis Ganda Multi-purpose Cooperative is an organized
cooperative of junkshop dealers and consolidators. It was founded by Leonarda
Camacho and Sonia Mathay in the late 1980s. It has a total of 575 primary coop
members with 80 members in Quezon City. The QC Linis Ganda members employ
200 eco-aides who perform the role of primary collectors of recyclables. The daily
buying capital of the eco-aides is from PhP1,000 to PhP2,000 daily. As of December
2011, total loan amount released by the QC Linis Ganda chapter to its members was
PhP 4,190,000.
Linis Ganda classifies its members into small (20%) , medium (50%) and large (30%)
based on its revolving capital as shown in Table 36. The small junkshops would have
a capitalization of about PhP20,000; followed by a medium junkshop with PhP50,000
and a large junkshop with about PhP100,000.
Table 36: Classification of Junkshops
Type Revolving Capital/day % of members
Small P20,000 20%
Medium P50,000 50%
Large P100,000 30%
Source: Interview with Iluminada Teves, President QC Linis Ganda Chapter, Sept. 9,
2011
The inflow of recyclables in the table below shows that in terms of volume the top
three materials recovered by QC Linis Ganda are paper, scrap metal and metal
products and plastics. EPWMD figures for daily waste recovery of junkshops show
that only 574,909 kgs were recovered in 2008 compared to 613,226 kg in 2006.

95
Table 37: 2010 Inflow of Recyclables: Linis Ganda Quezon City Chapter Items January-
March
(Tons/
Quarter)
April-June
(Tons/
Quarter)
July-
September
(Tons/
Quarter)
October-
December
(Tons/
Quarter)
Total
(Tons/
Quarter)
Old newspaper 49,059.60 56,055.12 46,763.82 27,815.13 79,693.67
White paper 51,952.32 47,532.12 31,606.71 21,693.63 153,047.49
Carton 44,187.81 48,768.15 34,892.28 25,119.39 152,967.63
Plastics 35,519.37 39,484.17 37,369.53 31,666.29 144,039.36
Whole/broken
bottles
8,118,90 10,107.69 7,836.96 7,643.67 33,707.22
Scrap
metal/tapalodo
/Lata/yero
60,466.65
62,712.21 57,500.28 41,981.22 222,660.36
Aluminum
cans/
Copper/bronze
14,087.37
13,540.65 14,733.63 15,080.10 57,441.75
Source : Linis-Ganda. Recyclable Purchase Report from Jan. – Dec. 2010
Destination of Recyclables
Final buyers of materials of the junkshops are local recyclers ,e.g. San Miguel for
bottles, plastic scrap to various recyclers in Valenzuela, Bulacan (presently organized
under the Metro Plastic Recyclers Association) and the Philippine Plastics Industry
Association of the Philippines and unregistered consolidators exporting their scrap to
China.
CARPEL Trading Inc. (Consolidator Processor C-7), a Linis Ganda member is also a
paper and plastics consolidator. It has buying stations outside Quezon City. It is the
main supplier of white paper, newspaper and cartons to Bataan 2020, a paper
recycling company. Sixty percent of its waste paper is sold to Bataan 2020 while
96
waste paper which is not bought by Bataan 2020 is exported to China. The company
also consolidates “sibakin” plastics (HDPE, LDPE and PP plastics) which it
pelletizes and exports to China. It also buys waste paper from junkshops at PhP3.30
per kg and sells it to the recycling company or exporter at PhP3.50 to PhP3.70 per kg.
Linis Ganda consolidators have arrangements with some of its client recyclers that
the latter will donate two centavos per kilo of scrap sold to them by the former. Each
year the total money donated is distributed to members during their General
Assembly.
Impact of Economic Recession on the Flow of Recyclables Most of the responses of key informants regarding economic recession is associated
with the slump in the demand for recyclables from China after the Olympic Games.
They cited that the high demand for recyclables during the pre-Olympic Games period
caused an increase in number of new junkshop traders. During the post-Olympic
Games phase, many new traders lost their money but those who have been in the
business longer and who had access to capital and space to stockpile their inventory
were able to survive the slump. Some of them stopped buying temporarily and
reduced their working hours. Some closed down temporarily.
Factors Affecting the Flow of Recyclables
Facilitating Factors
Quezon City LGU has definite targets for diverting its waste from landfilling and
mechanisms to do so through recovery activities not only in its SLF but also through
its barangay MRFs and special events in partnership with the business sector, schools
and civic organizations. It has also established a comprehensive system for tracking
waste diversion outcomes of the various strategies. It has also integrated the 3,000
wastepickers in the City’s SLF and they have contributed to increase the waste
diversion in the SLF and they are now more organized and efficient.
Its Junkshop Standardization Program which included the establishment of a data base
on informal waste workers, passage of a junkshop ordinance and the accreditation

97
and affiliation of IWBs with junkshops also helped to partly regulate the informal
recovery system.
At the industry level, two associations of junkshops, the Payatas-Litex Junkshop
Owners and Truck Haulers Association Inc. and the QC Linis Ganda Chapter are able
to assist its members and interact with government and protect their interests. Linis
Ganda is also able to regulate unfair competition among junkshops by standardizing
their buying price.
One of the junkshop consolidators state that the business is thriving because there are
more types of recyclables at present, citing PET as an example of a no-value material
then but now ranking as the most expensive type of plastic waste. The accessibility of
consolidators, traders and processors in Metro-Manila and nearby provinces also
strengthen the flow of recyclables. Hence, even recyclables with low or no
commercial value in other places could find a market in QC as shown by the Payatas
wastepickers.
Hindering Factors
Consolidator Processor C-6 who identified the free entry of cheap imported goods
especially those from China as a hindering factor to his business since the imported
products are cheaper than the locally manufactured product of the consolidator-
recycler. As a local manufacturer, he has to pay taxes for importing his raw materials
and additional taxes for manufacturing. Also, other production costs such as labor and
energy are more expensive in the Philippines.
According to a Consolidator Processor C-7, the glut of cheap imported paper products
caused local paper manufacturers to stop buying mixed waste paper. The coping
strategy of the consolidator is to export the mixed waste paper to China. The
consolidator also found exporting more favorable because there are signed
agreements and prices are already fixed for the duration of the agreement. Payment is
made within 30 to 60 days. The exporter also takes care of transport costs. In
comparison, the local paper manufacturer has stricter quality requirements and the
term of payment for goods is six months.

98
Issues and Challenges
The issues and challenges are presented by stakeholders in the matrix below:
Stakeholders Concerns
Payatas SLF Wastepickers • Decreasing volume of scrap due to recovery
activities by barangay MRFs, paleros, etc.
• Future displacement when SLF closes down
• Access to alternative livelihood
PARE • Only 50% of wastepickers in Payatas SLF patronize
the PARE junkshop; continuing values formation
needed
• Increase in capital needed in order to cut their
dependence on the Junkshop which lends them their
revolving capital; so far, they have saved
PhP200,000 but need at least PhP500,000 more to
be able to cut their dependency on said Junkshop
Local Junkshops with
paleros/garbage crew as their
main suppliers
• Proliferation of junkshop competitors
• Potential loss of business upon closure of Payatas
SLF
• Decreasing volume of scrap recovered by garbage
crew/paleros as segregation campaign and no
segregation; no collection intensifies
Hauler/Junkshop Operators • Before: income comes from collection fee paid by
private clients plus income from recyclables
collected; Now: Clients deduct the value of
recyclables from the garbage fee paid to the haulers
• Increasing cost of transport
• Increasing cost of tipping fees
• Access to capital
Paleros/Garbage Crew • Decreasing volume of scrap materials as waste
generators sell their scrap to itinerant waste buyers
and junkshops instead of giving mixed wastes to the
garbage truck

99
Stakeholders Concerns
Consolidators and
Consolidator-processors
• High cost of operations – transport, energy costs,
high taxes
• Lack of support from government
• Competition from illegal consolidators
• Access to capital for acquisition of equipment such
as balers, crushers, pressers etc.

100