Profile of the Pharmaceutical Manufacturing Industry - · PDF fileProfile of the...
157
Sector Notebook Project Pharmaceutical Industry EPA/310-R-97-005 EPA Office of Compliance Sector Notebook Project: Profile of the Pharmaceutical Manufacturing Industry September 1997 Office of Compliance Office of Enforcement and Compliance Assurance U.S. Environmental Protection Agency 401 M St., SW (MC 2221-A) Washington, DC 20460
Transcript of Profile of the Pharmaceutical Manufacturing Industry - · PDF fileProfile of the...
Sector Notebook Project Pharmaceutical Industry
EPA/310-R-97-005
EPA Office of Compliance Sector Notebook Project:
Profile of the Pharmaceutical Manufacturing Industry
September 1997
Office of ComplianceOffice of Enforcement and Compliance Assurance
U.S. Environmental Protection Agency401 M St., SW (MC 2221-A)
Washington, DC 20460

Sector Notebook Project Pharmaceutical Industry
Sector Notebook Project September 1997ii
This report is one in a series of volumes published by the U.S. Environmental Protection Agency(EPA) to provide information of general interest regarding environmental issues associated withspecific industrial sectors. The documents were developed under contract by Abt Associates(Cambridge, MA), Science Applications International Corporation (McLean, VA), and Booz-Allen& Hamilton, Inc. (McLean, VA). This publication may be purchased from the Superintendent ofDocuments, U.S. Government Printing Office. A listing of available Sector Notebooks anddocument numbers is included on the following page.
All telephone orders should be directed to:
Superintendent of DocumentsU.S. Government Printing OfficeWashington, DC 20402(202) 512-1800FAX (202) 512-22508:00 a.m. to 4:30 p.m., EST, M-F
Using the form provided at the end of this document, all mail orders should be directed to:
U.S. Government Printing OfficeP.O. Box 371954Pittsburgh, PA 15250-7954
Complimentary volumes are available to certain groups or subscribers, such as public andacademic libraries, Federal, State, and local governments, and the media from EPA’s NationalCenter for Environmental Publications and Information at (800) 490-9198. For furtherinformation, and for answers to questions pertaining to these documents, please refer to thecontact names and numbers provided within this volume.
Electronic versions of all Sector Notebooks are available free of charge at the following webaddress: www.epa.gov/oeca/sector. Direct technical questions to the “Feedback” button at thebottom of the web page.
Cover photographs courtesy of Pharmaceutical Research and Manufacturers of America.

Sector Notebook Project Pharmaceutical Industry
Sector Notebook Project September 1997iii
Sector Notebook Contacts
The Sector Notebooks were developed by the EPA’s Office of Compliance. Questions relating to theSector Notebook Project can be directed to:
Seth Heminway, Coordinator, Sector Notebook ProjectUS EPA Office of Compliance401 M St., SW (2223-A)Washington, DC 20460(202) 564-7017
Questions and comments regarding the individual documents can be directed to the appropriate specialistslisted below.
Document Number Industry Contact Phone (202)EPA/310-R-95-001. Dry Cleaning Industry Joyce Chandler 564-7073EPA/310-R-95-002. Electronics and Computer Industry* Steve Hoover 564-7007EPA/310-R-95-003. Wood Furniture and Fixtures Industry Bob Marshall 564-7021EPA/310-R-95-004. Inorganic Chemical Industry* Walter DeRieux 564-7067EPA/310-R-95-005. Iron and Steel Industry Maria Malave 564-7027EPA/310-R-95-006. Lumber and Wood Products Industry Seth Heminway 564-7017EPA/310-R-95-007. Fabricated Metal Products Industry* Scott Throwe 564-7013EPA/310-R-95-008. Metal Mining Industry Jane Engert 564-5021EPA/310-R-95-009. Motor Vehicle Assembly Industry Anthony Raia 564-6045EPA/310-R-95-010. Nonferrous Metals Industry Jane Engert 564-5021EPA/310-R-95-011. Non-Fuel, Non-Metal Mining Industry Rob Lischinsky 564-2628EPA/310-R-95-012. Organic Chemical Industry* Walter DeRieux 564-7067EPA/310-R-95-013. Petroleum Refining Industry Tom Ripp 564-7003EPA/310-R-95-014. Printing Industry Ginger Gotliffe 564-7072EPA/310-R-95-015. Pulp and Paper Industry Seth Heminway 564-7017EPA/310-R-95-016. Rubber and Plastic Industry Maria Malave 564-7027EPA/310-R-95-017. Stone, Clay, Glass, and Concrete Industry Scott Throwe 564-7013EPA/310-R-95-018. Transportation Equipment Cleaning Ind. Virginia Lathrop 564-7057EPA/310-R-97-001. Air Transportation Industry Virginia Lathrop 564-7057EPA/310-R-97-002. Ground Transportation Industry Virginia Lathrop 564-7057EPA/310-R-97-003. Water Transportation Industry Virginia Lathrop 564-7057EPA/310-R-97-004. Metal Casting Industry Jane Engert 564-5021EPA/310-R-97-005. Pharmaceuticals Industry Emily Chow 564-7071EPA/310-R-97-006. Plastic Resin and Man-made Fiber Ind. Sally Sasnett 564-7074EPA/310-R-97-007. Fossil Fuel Electric Power Generation Ind. Rafael Sanchez 564-7028EPA/310-R-97-008. Shipbuilding and Repair Industry Anthony Raia 564-6045EPA/310-R-97-009. Textile Industry Belinda Breidenbach 564-7022EPA/310-R-97-010. Sector Notebook Data Refresh-1997 Seth Heminway 564-7017EPA/310-R-98-001. Aerospace Industry Anthony Raia 564-6045EPA/310-R-98-002. Agricultural Chemical, Pesticide, and Amy Porter 564-4149
Fertilizer IndustryEPA/310-R-98-003. Agricultural Crop Production Industry Ginah Mortensen (913)551-7864EPA/310-R-98-004. Agricultural Livestock Production Ind. Ginah Mortensen (913)551-7864EPA/310-R-98-005. Oil and Gas Exploration and Production Dan Chadwick 564-7054
IndustryEPA/310-R-98-008. Local Government Operations John Dombrowski 564-7036*Spanish translations available.

Page iv intentionally left blank.

Sector Notebook Project Pharmaceutical Industry
Sector Notebook Project September 1997v
Table of Contents
List of Tables . . . . . . . . . . . . . . . . . . . . . . . . . . . . . . . . . . . . . . . . . . . . . . . . . . . . . . . . . . . . . . vii
List of Figures . . . . . . . . . . . . . . . . . . . . . . . . . . . . . . . . . . . . . . . . . . . . . . . . . . . . . . . . . . . . viii
List of Acronyms . . . . . . . . . . . . . . . . . . . . . . . . . . . . . . . . . . . . . . . . . . . . . . . . . . . . . . . . . . . ix
I. INTRODUCTION TO THE SECTOR NOTEBOOK PROJECT. . . . . . . . . . . . . . . . . . . . . . 1A. Summary of the Sector Notebook Project . . . . . . . . . . . . . . . . . . . . . . . . . . . . . . . . . 1B. Additional Information . . . . . . . . . . . . . . . . . . . . . . . . . . . . . . . . . . . . . . . . . . . . . . . 2
II. INTRODUCTION TO THE PHARMACEUTICAL INDUSTRY. . . . . . . . . . . . . . . . . . . . . 3A. Introduction, Background, and Scope of the Notebook . . . . . . . . . . . . . . . . . . . . . . . 3B. Characterization of the Pharmaceutical Industry. . . . . . . . . . . . . . . . . . . . . . . . . . . . . 3
1. Product Characterization . . . . . . . . . . . . . . . . . . . . . . . . . . . . . . . . . . . . . . . . 52. Industry Size . . . . . . . . . . . . . . . . . . . . . . . . . . . . . . . . . . . . . . . . . . . . . . . . . 63. Geographic Distribution . . . . . . . . . . . . . . . . . . . . . . . . . . . . . . . . . . . . . . . . 114. Economic Trends and International Competition . . . . . . . . . . . . . . . . . . . . . . 13
III. INDUSTRIAL PROCESS DESCRIPTION. . . . . . . . . . . . . . . . . . . . . . . . . . . . . . . . . . . . 17A. Industrial Processes in the Pharmaceutical Industry. . . . . . . . . . . . . . . . . . . . . . . . . 17
1. Research and Development . . . . . . . . . . . . . . . . . . . . . . . . . . . . . . . . . . . . . 172. Production of Bulk Pharmaceutical Substances. . . . . . . . . . . . . . . . . . . . . . 193. Formulation, Mixing, and Compounding . . . . . . . . . . . . . . . . . . . . . . . . . . . 32
B. Raw Material Inputs and Pollutant Outputs . . . . . . . . . . . . . . . . . . . . . . . . . . . . . . . 381. Raw Materials . . . . . . . . . . . . . . . . . . . . . . . . . . . . . . . . . . . . . . . . . . . . . . . 402. Air Emissions and Control Systems . . . . . . . . . . . . . . . . . . . . . . . . . . . . . . . . 433. Wastewater . . . . . . . . . . . . . . . . . . . . . . . . . . . . . . . . . . . . . . . . . . . . . . . . . 464. Solid Wastes . . . . . . . . . . . . . . . . . . . . . . . . . . . . . . . . . . . . . . . . . . . . . . . . . 50
C. Management of TRI Chemicals in the Production Process . . . . . . . . . . . . . . . . . . . . 51
IV. CHEMICAL RELEASE AND TRANSFER PROFILE . . . . . . . . . . . . . . . . . . . . . . . . . . . 53A. EPA Toxic Release Inventory for the Pharmaceutical Industry. . . . . . . . . . . . . . . . . 57B. Summary of Selected Chemicals Released . . . . . . . . . . . . . . . . . . . . . . . . . . . . . . . . 68C. Other Data Sources . . . . . . . . . . . . . . . . . . . . . . . . . . . . . . . . . . . . . . . . . . . . . . . . . 72D. Comparison of Toxic Release Inventory Among Selected Industries . . . . . . . . . . . . 74
V. POLLUTION PREVENTION OPPORTUNITIES . . . . . . . . . . . . . . . . . . . . . . . . . . . . . . . 77A. Material Substitutions . . . . . . . . . . . . . . . . . . . . . . . . . . . . . . . . . . . . . . . . . . . . . . . 79B. Process Modifications . . . . . . . . . . . . . . . . . . . . . . . . . . . . . . . . . . . . . . . . . . . . . . . 83C. Good Operating Practices . . . . . . . . . . . . . . . . . . . . . . . . . . . . . . . . . . . . . . . . . . . . 87D. Recycling, Recovery, and Reuse . . . . . . . . . . . . . . . . . . . . . . . . . . . . . . . . . . . . . . . 90E. Pollution Prevention Research . . . . . . . . . . . . . . . . . . . . . . . . . . . . . . . . . . . . . . . . . 92

Sector Notebook Project Pharmaceutical Industry
Sector Notebook Project September 1997vi
VI. SUMMARY OF APPLICABLE FEDERAL STATUTES AND REGULATIONS . . . . . . 93A. General Description of Major Statutes . . . . . . . . . . . . . . . . . . . . . . . . . . . . . . . . . . . 93B. Industry Specific Requirements . . . . . . . . . . . . . . . . . . . . . . . . . . . . . . . . . . . . . . . 105C. Pending and Proposed Regulatory Requirements . . . . . . . . . . . . . . . . . . . . . . . . . . 110D. Other Federal Regulations Affecting the Pharmaceutical Industry. . . . . . . . . . . . . 111E. Other Statutes and Regulations Affecting the Pharmaceutical Industry. . . . . . . . . . 114
VII. COMPLIANCE AND ENFORCEMENT HISTORY . . . . . . . . . . . . . . . . . . . . . . . . . . . 117A. Pharmaceutical Industry Compliance History. . . . . . . . . . . . . . . . . . . . . . . . . . . . . 121B. Comparison of Enforcement Activity Between Selected Industries . . . . . . . . . . . . . 123C. Review of Major Legal Actions . . . . . . . . . . . . . . . . . . . . . . . . . . . . . . . . . . . . . . . 128
1. Review of Major Cases . . . . . . . . . . . . . . . . . . . . . . . . . . . . . . . . . . . . . . . . 1282. Supplementary Environmental Projects (SEPs). . . . . . . . . . . . . . . . . . . . . . 129
VIII. COMPLIANCE ACTIVITIES AND INITIATIVES . . . . . . . . . . . . . . . . . . . . . . . . . . . 131A. Sector-related Programs and Activities. . . . . . . . . . . . . . . . . . . . . . . . . . . . . . . . . 131B. EPA Voluntary Programs . . . . . . . . . . . . . . . . . . . . . . . . . . . . . . . . . . . . . . . . . . . 131C. Trade Association/Industry Sponsored Activity . . . . . . . . . . . . . . . . . . . . . . . . . . . 138
1. Environmental Programs . . . . . . . . . . . . . . . . . . . . . . . . . . . . . . . . . . . . . . . 1382. Summary of Trade Associations . . . . . . . . . . . . . . . . . . . . . . . . . . . . . . . . . 140
IX. CONTACTS/ACKNOWLEDGMENTS/REFERENCES . . . . . . . . . . . . . . . . . . . . . . . . . 143

Sector Notebook Project Pharmaceutical Industry
Sector Notebook Project September 1997vii
List of Tables
Table 1: Summary Statistics for the Pharmaceutical Industry. . . . . . . . . . . . . . . . . . . . . . . . . . . 8Table 2: Pharmaceutical Industry (SIC 283) Facility Size . . . . . . . . . . . . . . . . . . . . . . . . . . . . . 10Table 3: Employment Size Distribution for Medicinals and Botanicals and Pharmaceutical
Preparations Establishments . . . . . . . . . . . . . . . . . . . . . . . . . . . . . . . . . . . . . . . . . . . . . 10Table 4: Top U.S. Pharmaceutical Companies by Sales. . . . . . . . . . . . . . . . . . . . . . . . . . . . . . 11Table 5: Examples of Pharmaceutical Products by Bulk Manufacturing Process. . . . . . . . . . . . 20Table 6: Pharmaceutical Dosage Forms. . . . . . . . . . . . . . . . . . . . . . . . . . . . . . . . . . . . . . . . . . 34Table 7: Summary of Typical Material Inputs and Pollution Outputs in the Pharmaceutical
Industry . . . . . . . . . . . . . . . . . . . . . . . . . . . . . . . . . . . . . . . . . . . . . . . . . . . . . . . . . . . . 39Table 8: Solvents Used in the Chemical Synthesis Process . . . . . . . . . . . . . . . . . . . . . . . . . . . . 41Table 9: Solvents Used in Biological and Natural Product Extraction . . . . . . . . . . . . . . . . . . . . 42Table 10: Solvents Used in Fermentation Processes . . . . . . . . . . . . . . . . . . . . . . . . . . . . . . . . . 42Table 11: Chemicals Discharged in Wastewater by the Pharmaceutical Manufacturing Industry 48Table 12: Wastewater Treatment Technology Trends . . . . . . . . . . . . . . . . . . . . . . . . . . . . . . . 49Table 13: Source Reduction and Recycling Activity for the Pharmaceuticals Industry. . . . . . . 52Table 14: 1995 Releases for Pharmaceutical Facilities (SIC 2833 & 2834) in TRI . . . . . . . . . . 58Table 15: 1995 Transfers for Pharmaceutical Facilities (SICs 2833 & 2834) in TRI. . . . . . . . . 62Table 16: Top 10 TRI Releasing Pharmaceutical Manufacturing Facilities . . . . . . . . . . . . . . . . 66Table 17: Top 10 TRI Releasing Facilities Reporting Pharmaceutical
Manufacturing SIC Codes to TRI . . . . . . . . . . . . . . . . . . . . . . . . . . . . . . . . . . . . . . . . . 67Table 18: Air Pollutant Releases by Industry Sector (tons/year) . . . . . . . . . . . . . . . . . . . . . . . . 73Table 19: Toxics Release Inventory Data for Selected Industries . . . . . . . . . . . . . . . . . . . . . . . 76Table 20: Five-Year Enforcement and Compliance Summary for the Pharmaceutical Industry 121Table 21: Five-Year Enforcement and Compliance Summary for Selected Industries . . . . . . . 124Table 22: One-Year Enforcement and Compliance Summary for Selected Industries . . . . . . . 125Table 23: Five-Year Inspection and Enforcement Summary by Statute for Selected Industries 126Table 24: One-Year Inspection and Enforcement Summary by Statute for Selected Industries 127Table 25: Pharmaceutical Industry Participation in the 33/50 Program. . . . . . . . . . . . . . . . . . 133

Sector Notebook Project Pharmaceutical Industry
Sector Notebook Project September 1997viii
List of Figures
Figure 1: Percent of Total Value of Shipments by Sector . . . . . . . . . . . . . . . . . . . . . . . . . . . . . . 8Figure 2: Employment in the Pharmaceutical Industry. . . . . . . . . . . . . . . . . . . . . . . . . . . . . . . . 9Figure 3: Geographic Distribution of Pharmaceutical Facilities (SIC 2833 and 2834). . . . . . . . 11Figure 4: World Sales of Pharmaceuticals, 1995. . . . . . . . . . . . . . . . . . . . . . . . . . . . . . . . . . . . 14Figure 5: Simplified Process Flow Diagram for Chemical Synthesis . . . . . . . . . . . . . . . . . . . . . 22Figure 6: Typical Design of a Kettle-Type Batch Reactor. . . . . . . . . . . . . . . . . . . . . . . . . . . . . 23Figure 7: Cross-Section of Typical Top-Suspended Centrifugal Filter . . . . . . . . . . . . . . . . . . . 25Figure 8: Cross-Section of Typical Tumble Dryer . . . . . . . . . . . . . . . . . . . . . . . . . . . . . . . . . . 27Figure 9: Simplified Process Flow Diagram for Natural/Biological Extraction . . . . . . . . . . . . . 29Figure 10: Simplified Process Flow Diagram for the Fermentation Process . . . . . . . . . . . . . . . . 30Figure 11: Simplified Process Flow Diagram for Compounding and Formulating . . . . . . . . . . . 32Figure 12: Summary of TRI Releases and Transfers by Industry . . . . . . . . . . . . . . . . . . . . . . . . 75

Sector Notebook Project Pharmaceutical Industry
Sector Notebook Project September 1997ix
List of Acronyms
AFS - AIRS Facility Subsystem (CAA database)AIRS - Aerometric Information Retrieval System (CAA database)BIFs - Boilers and Industrial Furnaces (RCRA)BOD - Biochemical Oxygen Demand CAA - Clean Air ActCAAA - Clean Air Act Amendments of 1990CDER - Center for Drug Evaluation and ResearchCERCLA - Comprehensive Environmental Response, Compensation and Liability ActCERCLIS - CERCLA Information SystemCFCs - ChlorofluorocarbonsCO - Carbon Monoxide COD - Chemical Oxygen Demand CSI - Common Sense Initiative CTM - Clinical Trial MaterialCWA - Clean Water ActD&B - Dun and Bradstreet Marketing IndexELP - Environmental Leadership Program EPA - United States Environmental Protection AgencyEPCRA - Emergency Planning and Community Right-to-Know Act FDA - Food and Drug AdministrationFIFRA - Federal Insecticide, Fungicide, and Rodenticide ActFINDS - Facility Indexing SystemHAPs - Hazardous Air Pollutants (CAA)HSDB - Hazardous Substances Data Bank IDEA - Integrated Data for Enforcement AnalysisIND - Investigational New DrugLDR - Land Disposal Restrictions (RCRA)LEPCs - Local Emergency Planning Committees MACT - Maximum Achievable Control Technology (CAA)MCLGs - Maximum Contaminant Level Goals MCLs - Maximum Contaminant Levels MEK - Methyl Ethyl KetoneMSDSs - Material Safety Data Sheets NAAQS - National Ambient Air Quality Standards (CAA)NAFTA - North American Free Trade Agreement NAICS - North American Industrial Classification SystemNCDB - National Compliance Database (for TSCA, FIFRA, EPCRA)NCP - National Oil and Hazardous Substances Pollution Contingency Plan NDA - New Drug ApplicationNEIC - National Enforcement Investigation Center NESHAP - National Emission Standards for Hazardous Air PollutantsNO2 - Nitrogen DioxideNOV - Notice of Violation NOx - Nitrogen Oxides

Sector Notebook Project Pharmaceutical Industry
Sector Notebook Project September 1997x
NPDES - National Pollution Discharge Elimination System (CWA)NPL - National Priorities List NRC - National Response Center NSPS - New Source Performance Standards (CAA)OAR - Office of Air and RadiationOECA - Office of Enforcement and Compliance AssuranceOPA - Oil Pollution ActOPPTS - Office of Prevention, Pesticides, and Toxic SubstancesOSHA - Occupational Safety and Health Administration OSW - Office of Solid WasteOSWER - Office of Solid Waste and Emergency ResponseOW - Office of WaterP2 - Pollution PreventionPCS - Permit Compliance System (CWA Database)PhRMA - Pharmaceutical Research and Manufacturers of AmericaPOTW - Publicly Owned Treatments Works RCRA - Resource Conservation and Recovery ActRCRIS - RCRA Information SystemSARA - Superfund Amendments and Reauthorization Act SDWA - Safe Drinking Water ActSEPs - Supplementary Environmental Projects SERCs - State Emergency Response Commissions SIC - Standard Industrial Classification SO2 - Sulfur Dioxide SOx - Sulfur OxidesTOC - Total Organic Carbon TRI - Toxic Release InventoryTRIS - Toxic Release Inventory System TCRIS - Toxic Chemical Release Inventory SystemTSCA - Toxic Substances Control ActTSS - Total Suspended Solids UIC - Underground Injection Control (SDWA)UST - Underground Storage Tanks (RCRA)VOCs - Volatile Organic Compounds

Pharmaceutical Industry Sector Notebook Project
Sector Notebook Project September 19971
I. INTRODUCTION TO THE SECTOR NOTEBOOK PROJECT
I.A. Summary of the Sector Notebook Project
Integrated environmental policies based upon comprehensive analysis of air,water and land pollution are a logical supplement to traditional single-mediaapproaches to environmental protection. Environmental regulatory agenciesare beginning to embrace comprehensive, multi-statute solutions to facilitypermitting, enforcement and compliance assurance, education/ outreach,research, and regulatory development issues. The central concepts driving thenew policy direction are that pollutant releases to each environmental medium(air, water and land) affect each other, and that environmental strategies mustactively identify and address these inter-relationships by designing policies forthe “whole” facility. One way to achieve a whole facility focus is to designenvironmental policies for similar industrial facilities. By doing so,environmental concerns that are common to the manufacturing of similarproducts can be addressed in a comprehensive manner. Recognition of theneed to develop the industrial “sector based” approach within the EPA Officeof Compliance led to the creation of this document.
The Sector Notebook Project was originally initiated by the Office ofCompliance within the Office of Enforcement and Compliance Assurance(OECA) to provide its staff and managers with summary information foreighteen specific industrial sectors. As other EPA offices, states, the regulatedcommunity, environmental groups, and the public became interested in thisproject, the scope of the original project was expanded to its current form.The ability to design comprehensive, common sense environmental protectionmeasures for specific industries is dependent on knowledge of several inter-related topics. For the purposes of this project, the key elements chosen forinclusion are: general industry information (economic and geographic); adescription of industrial processes; pollution outputs; pollution preventionopportunities; Federal statutory and regulatory framework; compliancehistory; and a description of partnerships that have been formed betweenregulatory agencies, the regulated community and the public.
For any given industry, each topic listed above could alone be the subject ofa lengthy volume. However, in order to produce a manageable document, thisproject focuses on providing summary information for each topic. Thisformat provides the reader with a synopsis of each issue, and references ifmore in-depth information is available. The contents of each profile wereresearched from a variety of sources, and were usually condensed from moredetailed sources. This approach allowed for a wide coverage of activities thatcan be further explored based upon the citations and references listed at theend of this profile. As a check on the information included, each notebookwent through an external review process. The Office of Complianceappreciates the efforts of all those who participated in this process who

Pharmaceutical Industry Sector Notebook Project
Sector Notebook Project September 19972
enabled us to develop more complete, accurate and up-to-date summaries. Many of those who reviewed this notebook are listed as contacts in SectionX and may be sources of additional information. The individuals and groupson this list do not necessarily concur with all statements within this notebook.
I.B. Additional Information
Providing Comments
OECA’s Office of Compliance plans to periodically review and update thenotebooks and will make these updates available both in hard copy andelectronically. If you have any comments on the existing notebook, or if youwould like to provide additional information, please send a hard copy andcomputer disk to the EPA Office of Compliance, Sector Notebook Project,401 M St., SW (2223-A), Washington, DC 20460. Comments can also beuploaded to the Enviro$en$e World Wide Web for general access to all usersof the system. Follow instructions in Appendix A for accessing this system.Once you have logged in, procedures for uploading text are available from theon-line Enviro$en$e Help System.
Adapting Notebooks to Particular Needs
The scope of the industry sector described in this notebook approximates thenational occurrence of facility types within the sector. In many instances,industries within specific geographic regions or states may have uniquecharacteristics that are not fully captured in these profiles. The Office ofCompliance encourages state and local environmental agencies and othergroups to supplement or re-package the information included in this notebookto include more specific industrial and regulatory information that may beavailable. Additionally, interested states may want to supplement the"Summary of Applicable Federal Statutes and Regulations" section with stateand local requirements. Compliance or technical assistance providers mayalso want to develop the "Pollution Prevention" section in more detail. Pleasecontact the appropriate specialist listed on the opening page of this notebookif your office is interested in assisting us in the further development of theinformation or policies addressed within this volume. If you are interested inassisting in the development of new notebooks for sectors not alreadycovered, please contact the Office of Compliance at 202-564-2395.

Pharmaceutical Industry Introduction
Sector Notebook Project September 19973
II. INTRODUCTION TO THE PHARMACEUTICAL INDUSTRY
This section provides background information on the size, geographicdistribution, employment, production, sales, and economic condition of thepharmaceutical industry. Facilities described within this document aredescribed in terms of their Standard Industrial Classification (SIC) codes.
II.A. Introduction, Background, and Scope of the Notebook
The Standard Industrial Classification (SIC) code established by the U.S.Office of Management and Budget (OMB) to track the flow of goods andservices within the economy is 283 for the pharmaceuticals industry. Theindustry is further categorized by four 4-digit SIC codes consisting of:
Medicinals and Botanicals (SIC 2833)Pharmaceutical Preparations (SIC 2834)In Vivo and in Vitro Diagnostic Substances (SIC 2835) Biological Products, except diagnostics (SIC 2836)
OMB is in the process of changing the SIC code system to a system based onsimilar production processes called the North American IndustrialClassification System (NAICS). In the NAIC system, medicinals andbotanicals are classified as NAIC 325411 and pharmaceutical preparations areclassified as NAIC 325412.
According to the U.S. Census of Manufacturers, in 1992 the Medicinals andBotanicals and Pharmaceutical Preparations categories accounted for 64percent of establishments and 81 percent of the value of shipments in theindustry. In comparison, the In Vitro and In Vivo Diagnostic Products andBiological Products categories are relatively small. Together they accountedfor the remaining 36 percent of establishments and 19% of the value ofshipments in the industry. In general, the industrial processes and subsequentenvironmental impacts of the In Vitro and In Vivo Diagnostic Products andBiological Products categories are different from those of the Medicinals andBotanicals and Pharmaceutical Preparations categories. This notebookconcentrates on the two larger categories (SIC 2833 and 2834) within SIC283.
II.B. Characterization of the Pharmaceutical Industry
As defined by its SIC Code, the pharmaceuticals industry (SIC 283) consistsof establishments that are primarily involved in fabricating or processingmedicinal chemicals and pharmaceutical products. The industry also includesestablishments that formulate pharmaceutical products and are involved ingrinding, grading, and milling of botanical products. The Census ofManufacturers defines an establishment as a single physical location or a

Pharmaceutical Industry Introduction
1 The term “brand name” is used interchangeably with “pioneer drug” or “innovator’s drug product”. The termsreflect the fact that the drug product is the first to contain a particular active ingredient or ingredients to receiveFDA approval for a specified use. The term “generic” drug is used to describe a product that contains the sameactive ingredients but not necessarily the same excipients (inactive ingredients) as a so-called “pioneer drug”.
Sector Notebook Project September 19974
facility where manufacturing occurs. If more than one distinct line ofmanufacturing occurs at the same location, the Bureau of Census requiresseparate reports for each activity.
Although the industry is part of the two-digit SIC code 28 for Chemicals andAllied Products, it differs significantly from the rest of the chemicals industryin its industrial processes and regulatory requirements. For example, in itsindustrial processes, the pharmaceuticals industry uses more batch operationsthan the chemicals industry as a whole. Since some of the bulk manufacturingoperations involve extracting relatively small, highly concentrated quantitiesof active ingredients from much larger volumes of raw material, the industry’sproduction yield for these operations is correspondingly low.
The pharmaceuticals industry also receives extensive regulatory oversight bythe U.S. Food and Drug Administration (FDA). In 1996, the Center for DrugEvaluation and Research, FDA approved 131 new drug applications (NDAs),of which 53 were new molecular entities. According to the CongressionalOffice of Technology Assessment (OTA) in 1993, it costs an average of $359million to develop a new drug and complete the drug approval process. Totaldrug development and agency review time averaged 15.3 years for drugsapproved from 1990 through 1995. More information on the typical industrialprocesses and regulatory requirements of this industry is provided in SectionsIII and VI, respectively.
When a pharmaceutical company discovers a compound that may havemedical potential, the company usually applies for a patent. Patents are validfor 20 years from the date of application. Any drug made from the compoundmay be marketed only after approval by the federal Food and DrugAdministration (FDA). The drug development process, beginning with initialtoxicology testing, followed by clinical trials for safety and effectiveness, andreview of the application by the FDA averages fifteen years. When thecompany’s patent or period of exclusivity has expired, other companies mayrely on the original manufacturer’s data on safety and effectiveness to obtainapproval to market a generic version of the drug. Companies wanting tomanufacture the same drug once it is off-patent are required to obtain FDAmarketing approval, based on evidence that the generic version is“bioequivalent,” i.e., differs in the rate and extent of drug absorption by nomore than 25 percent nor less than the 20 percent from the original drug(FDA, 1996). While companies that specialize in the development andmarketing of brand-name, innovator drugs1 may have subsidiaries that

Pharmaceutical Industry Introduction
Sector Notebook Project September 19975
manufacture generic products, most generic drug companies do not conductresearch intended to identify and develop innovator drugs (PhRMA, 1997).
Because of the high cost and time to approval, effective patent protection isan essential component in the decision to invest in drug development andmarketing. This is especially true for international companies interested inmarketing drugs in several countries, each with its own approval procedureand marketing requirements. While the International Conference onHarmonization is proposing harmonized rules for drug registration andapproval for Europe, Japan and the United States, each country retains itsown approval system. In other countries, especially developing countries, theissue of adequate patent protection is a central concern of pharmaceuticalmanufacturers (PhRMA, 1997).
Discovery of new compounds followed by further research and development(R&D) is one of the primary functions of the industry. The pharmaceuticalproduction process starts with an extensive research stage, which can lastseveral years. Following the discovery of a new drug that appears to haveefficacy in treating or preventing illness, pre-clinical tests and clinical trials areconducted. Then a New Drug Application (NDA) is submitted to the FDAfor approval. According to a primary trade association for pharmaceuticalcompanies producing brand name drugs, the Pharmaceutical Research andManufacturers of America (PhRMA), it takes an average of 15 years to bringa new drug to market, from time of discovery to approval (PhRMA, 1996).It is only after FDA approval has been secured that market distribution in theU.S. can begin.
The competition for discovering new drugs and bringing them to market isextremely high. As a result, a significant proportion of the industry’s sales arereinvested into research and development (R&D). According to PhRMA,total R&D expenditures, both domestically and abroad, by its members, willbe close to $19 billion dollars in 1997. PhRMA estimates that over 21% oftotal sales will be reinvested into R&D by its members (PhRMA, 1997).
II.B.1. Product Characterization
The pharmaceutical industry manufactures bulk substance pharmaceuticalintermediates and active ingredients which are further processed into finishedproducts.
Medicinals and Botanicals (SIC 2833)
Companies in the Medicinals and Botanicals industry category are primarilyengaged in 1) manufacturing bulk organic and inorganic medicinal chemicalsand their derivatives and 2) processing (grading, grinding, and milling) bulkbotanical drugs and herbs. The industry is made up of establishments or

Pharmaceutical Industry Introduction
Sector Notebook Project September 19976
facilities that manufacture products of natural origin, hormonal products, andbasic vitamins, as well as those that isolate active medicinal principals such asalkaloids from botanical drugs and herbs (OMB, 1987). These substances areused as active ingredients for the Pharmaceutical Preparations industrycategory. Companies often produce both Medicinals and Botanicals andPharmaceutical Preparations at the same facility.
Pharmaceutical Preparations (SIC 2834)
The Pharmaceutical Preparations industry category is made up of companiesthat manufacture, fabricate, and process raw materials into pharmaceuticalpreparations for human and veterinary uses. Finished products are sold invarious dosage forms including, for example, tablets, capsules, ointments,solutions, suspensions, and powders. These are 1) preparations aimed for usemainly by dental, medical, or veterinary professionals, and 2) those aimed foruse by patients and the general public (OMB, 1987). A more in depthdiscussion of these finished products is provided in Section III.A.3.Pharmaceutical products also are often classified in terms of their availabilityto the general public.
Both prescription and over-the-counter (OTC) drugs are available to thepublic. Prescription drugs can be purchased only with a prescription from alicensed health care professional authorized to prescribe, while OTC drugsmay be purchased without a prescription. The FDA will consider approvingthe switch of a drug from prescription to OTC when the manufacturerpresents evidence that consumers can self-diagnose the condition for whichthe drug is approved, i.e., cold or seasonal allergy, and directions for use canbe written for the consumer (PhRMA, 1997).
In Vivo and In Vitro Diagnostic Substances (SIC 2835) and Biological Products (SIC 2836)
The In Vivo and In Vitro Diagnostic Substances industry category (SIC 2835)includes facilities that manufacture in vivo (tested inside a living organism)and in vitro (tested outside of a living organism) diagnostic substances. Theyproduce chemical, biological, and radioactive substances used in diagnosingand monitoring health. The Biological Products industry category (SIC 2836)produces bacterial and virus vaccines, toxoids, serums, plasmas, and otherblood derivatives for human and veterinary use, other than in vitro and in vivodiagnostic substances (OMB, 1987).
II.B.2. Industry Size
According to the U.S. Census of Manufactures for the pharmaceuticalsindustry as a whole (SIC 283), in 1992 there were a total of 1,425establishments employing 194,000 people (excluding Puerto Rico). It ispossible that some of the smaller facilities identified by the Census are actually

Pharmaceutical Industry Introduction
Sector Notebook Project September 19977
sales, marketing or distribution centers in which no manufacturing operationstake place. Such possible misclassifications have no significant effect on thecensus statistics other than on the number of companies and establishments.(U.S. Department of Commerce, 1995) The value of total shipments wasover $67 billion (see Table 1). Pharmaceutical Preparations (SIC 2834) wasthe largest sector in terms of number of facilities (48 percent), employment(63 percent), and value of shipments (75 percent). The remaining facilities,employment, and value of shipments were divided evenly among theremaining sectors within the industry. One exception is the In Vivo and InVitro Diagnostic Products sector (SIC 2835) which claims a higher portionof employment than SIC codes 2833 and 2836. Figure 1 displays the valueof shipments by sector, and Figure 2 displays employment by sector.
A relatively significant number of pharmaceutical establishments are locatedin Puerto Rico. This is in part the result of the federal government’s policydecision to encourage job creation by offering tax incentives to manufacturersto locate new plants in Puerto Rico. A 1996 tax law phases-out those taxincentives over the next ten years.
The effects of the tax incentive are illustrated by the concentration ofpharmaceutical plants in Puerto Rico. According to the 1992 EconomicCensus of Outlying Areas, which covers statistics for Puerto Rico, there werea total of 88 establishments in Puerto Rico. Of these 88, 74 establishmentswere in the Pharmaceutical Preparations industry, 8 were in the Medicinalsand Botanicals industry, and the remaining six establishments were in the InVitro and In Vivo Diagnostic Products industry, and the Biological Products,except diagnostic substances industry. The total value of shipments of the 88establishments located in Puerto Rico was about $12 billion. PharmaceuticalPreparations accounted for about 92 percent of this. The pharmaceuticalindustry in Puerto Rico employed about 25,000 people in the 88establishments in 1992.

Pharmaceutical Industry Introduction
Sector Notebook Project September 19978
Figure 1: Percent of Total Value of Shipments by Sector
Source: 1992 U.S. Census of Manufacturers.
Table 1: Summary Statistics for the Pharmaceutical Industry50 STATES PUERTO RICO
IndustryNumber of
EstablishmentsNumber ofCompanies1
Value ofShipments(millions of
dollars)2Employmen
t(000's)
Number ofEstablishments
Value ofShipments(millions of
dollars)2Employment
(000's)
SIC 2833 225 208 6,438 13 8 N/A3 N/A3
SIC 2834 691 585 50,418 123 74 11,097 22
SIC 2835 234 205 6,838 40 5 477 1
SIC 2836 275 193 3,974 18 1 N/A3 N/A3
Total 1,425 1,191 67,668 194 88 11,924 25Source: 1992 Census of Manufacturers, Industry Series: Drugs, US Department of Commerce, Bureau of the Census,1995 and 1992 Economic Census of Outlying Areas, Manufacturers: Puerto Rico, US Department of Commerce,Bureau of the Census, 1994.
1Defined as a business organization consisting of one establishment or more under common ownership or control.2Value of all products and services sold by establishments in the pharmaceuticals industry.3Certain census data are not available for Puerto Rico. Information is withheld to avoid disclosing data for individualfacilities.

Pharmaceutical Industry Introduction
Sector Notebook Project September 19979
Figure 2: Employment in the Pharmaceutical Industry
Source: 1992 U.S. Census of Manufacturers.
As shown in Table 2, many facilities within the pharmaceutical industry aresmall. Almost 70 percent of the facilities employ fewer than 50 people.However, a relatively small number of large companies account for a largeportion of the total value of shipments, as well as employment. For example,according to the 1992 U.S. Census of Manufacturers, only 36 facilities (lessthan three percent) employed more than 1,000 people in the 50 states (i.e., notincluding Puerto Rico). However, these 36 facilities accounted for over 38%of the total value of shipments for the industry. In comparison, 968 facilities(almost 70 percent) employ fewer than 50 people. However, these facilitiesaccounted for less than four percent of the industry’s value of shipments.

Pharmaceutical Industry Introduction
Sector Notebook Project September 199710
Table 2: Pharmaceutical Industry (SIC 283) Facility Size1
Number of Employees Number of Facilities Percent of TotalFacilities (%)
Percent of Total Valueof Shipments (%)
fewer than 10 479 34 0.6
10 to 49 489 34 3.2
50 to 249 292 20 19
250 to 999 129 9.1 392
1,000 or more 36 2.5 382
Total 1,425 100 100Source: 1992 Census of Manufacturers, Industry Series: Drugs, Bureau of the Census, 1995.1 Does not include Puerto Rico - information withheld to avoid disclosing data for individual facilities.2 Some information withheld to avoid disclosing individual facility data. Values may be somewhat higher.
Medicinals and Botanicals (SIC 2833) and Pharmaceutical Preparations (SIC 2834)
The establishment size distributions for Pharmaceutical Preparations andMedicinals and Botanicals are similar (see Table 3). The PharmaceuticalPreparations sector, however, has a somewhat higher proportion of largefacilities. As is the case with the pharmaceuticals industry as a whole, arelatively small number of large establishments account for the majority of thetotal value of shipments for the Pharmaceutical Preparations industry. Valueof shipment data is not available by establishment size for the Medicinals andBotanicals sector.
Table 3: Employment Size Distribution for Medicinals and Botanicals andPharmaceutical Preparations Establishments 1
Medicinals and Botanicals Pharmaceutical Preparations
Number ofEmployees
Number ofFacilities
Percent of Facilities
Percent of Value of
ShipmentsNumber ofFacilities
Percent of Facilities
Percent of Value of
Shipments
< than 10 104 46 N/A2 225 33 0.4
10 to 49 76 34 N/A2 211 30 2
50 to 249 35 16 N/A2 142 21 10
250 or more 10 4 N/A2 113 16 88
Total 225 100 100 691 100 100
Source: 1992 U.S. Census of Manufacturers.1 Not including Puerto Rico.2 Information has been withheld to avoid disclosing individual establishment data.

Pharmaceutical Industry Introduction
Sector Notebook Project September 199711
Table 4 lists the largest U.S. pharmaceutical companies in terms of U.S.prescription sales.
Table 4: Top U.S. Pharmaceutical Companies by SalesRank Company 1996 Rx Sales
(millions of dollars)
1 Glaxo Wellcome 5,803
2 Johnson & Johnson 5,275
3 American Home Products 5,251
4 Bristol-Myers Squibb 5,160
5 Merck & Co 5,026
6 Pfizer 4,511
7 Novartis 3,786
8 SmithKline Beecham 3,589
9 Lilly 3,567
10 Abbott 3,423
11 Schering-Plough 3,272
12 Hoechst Marion Roussel 2,474
13 Roche 2,316
14 Amgen 1,860
15 Bayer 1,854
Source: IMS America.
II.B.3. Geographic Distribution
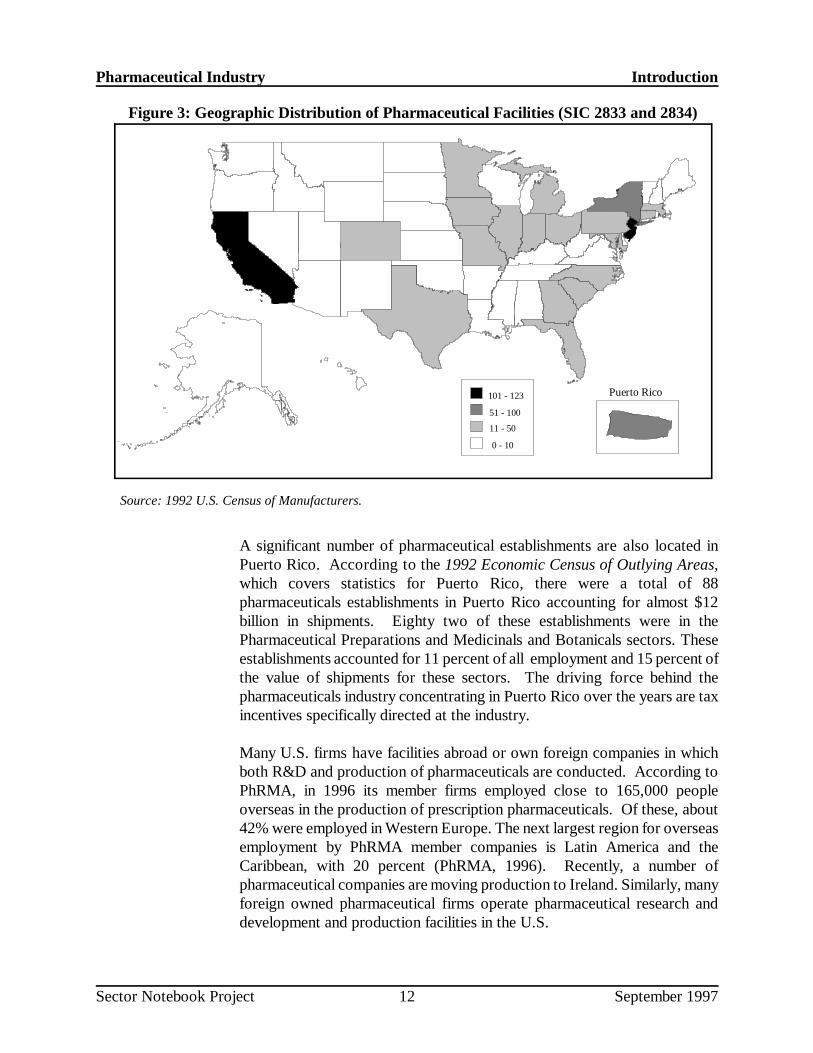
The U.S. pharmaceuticals industry has traditionally been concentrated in NewJersey, California, and New York (see Figure 3). These three states accountfor about one third of the facilities, employees, and value of shipments.Historically, the industry concentrated here because these were vocationalcenters. Other states, such as Massachusetts, North Carolina and Maryland,have seen recent growth in the pharmaceuticals industry, especially inbiotechnology and research and development.
Pharmaceutical Industry Introduction
Sector Notebook Project September 199712
Puerto Rico
0 - 10
101 - 123
51 - 100
11 - 50
Figure 3: Geographic Distribution of Pharmaceutical Facilities (SIC 2833 and 2834)
Source: 1992 U.S. Census of Manufacturers.
A significant number of pharmaceutical establishments are also located inPuerto Rico. According to the 1992 Economic Census of Outlying Areas,which covers statistics for Puerto Rico, there were a total of 88pharmaceuticals establishments in Puerto Rico accounting for almost $12billion in shipments. Eighty two of these establishments were in thePharmaceutical Preparations and Medicinals and Botanicals sectors. Theseestablishments accounted for 11 percent of all employment and 15 percent ofthe value of shipments for these sectors. The driving force behind thepharmaceuticals industry concentrating in Puerto Rico over the years are taxincentives specifically directed at the industry.
Many U.S. firms have facilities abroad or own foreign companies in whichboth R&D and production of pharmaceuticals are conducted. According toPhRMA, in 1996 its member firms employed close to 165,000 peopleoverseas in the production of prescription pharmaceuticals. Of these, about42% were employed in Western Europe. The next largest region for overseasemployment by PhRMA member companies is Latin America and theCaribbean, with 20 percent (PhRMA, 1996). Recently, a number ofpharmaceutical companies are moving production to Ireland. Similarly, manyforeign owned pharmaceutical firms operate pharmaceutical research anddevelopment and production facilities in the U.S.

Pharmaceutical Industry Introduction
Sector Notebook Project September 199713
II.B.4. Economic Trends and International Competition
Changes in the U.S. Health Care Industry
During the early 1990s the United States pharmaceutical industry faced majorchallenges associated with the changing nature of health care delivery coupledwith intense market competition. In 1995 about 62 percent of prescriptionswere paid for by insuring third parties, up from 39 percent in 1990. Thirdparties, including managed care organizations and Medicaid, consider cost inchoosing which drugs are approved for reimbursement. Techniques such assubstituting generic drugs for branded drugs are also used. Low pricedgeneric drugs rapidly capture a large share of prescriptions once theoriginating drug’s patent expires. Likewise, intense R&D rivalries betweencompanies now mean that new products may have major competition withinmonths after their FDA approval, as was the case for three competingprotease inhibitors approved between December 1995 and April 1996.Companies have responded to shorter product life cycles and costcontainment pressures by forming an increasing number of strategic alliancesand merging. However, a steady stream of new product introductions hascontributed to steady industry growth driven by an increasing volume ofprescriptions. In 1997, research-based companies’ net sales in the UnitedStates are projected to reach $66.1 billion, a 5.5 percent increase over 1996(PhRMA, 1997).
Consolidation of the Pharmaceuticals Industry
Competitive pressures are forcing many companies to restructure and formmergers and strategic alliances. Increasing competition from both domesticand foreign firms, as well as from the generic drug market, has forced mergersbetween the larger pharmaceutical companies and mid-sized companies. In1989, three major mergers occurred between large and mid-sizedpharmaceutical companies. In 1995, this number increased to seven. In 1996,there were three mergers.
As a result of generic competition, some brand name firms are becominginvolved with companies that manufacture generic drugs by purchasingexisting companies, setting up their own generic drug ventures, or formingpartnerships (PhRMA, 1996). Also, many smaller biotech and R&Dcompanies are merging with large pharmaceutical companies. Strategicalliances often involve domestic and foreign pharmaceutical companies,biotech firms, university research centers, government agencies such as theNational Institute of Health, and contract research organizations. Suchmergers and alliances allow companies to draw upon each others’ researchexpertise, bring products to market more rapidly, and more effectively marketproducts once they are approved by FDA.

Pharmaceutical Industry Introduction
Sector Notebook Project September 199714
Changes in Geographical Concentrations
An increasing number of establishments owned by U.S. companies arelocating outside the U.S. A number of forces are driving these changes,including the growing international market for pharmaceutical products,foreign registration requirements and patent laws, laws allowing sales only ifthe products are manufactured in the country; and tax incentives.
International Trade and Competition
The U.S. pharmaceuticals industry accounts for about one-third of allpharmaceuticals marketed worldwide (see Figure 4). The major U.S. tradingpartners are Europe, Japan, Canada, and Mexico. The largest importer ofU.S. pharmaceuticals is the European Community (EC). In 1993, the ECalone imported nearly 50% of all U.S. exports (ITA, 1994). Canada andMexico combined imported 15 percent of all U.S. exports of pharmaceuticalproducts in 1993. The North American Free Trade Agreement (NAFTA),however, has increased the volume of trade with Canada and Mexico in recentyears.
Although Japan still remains one of the largest importers of U.S.pharmaceuticals, Japanese pharmaceutical companies have been investingheavily in their own R&D, thereby reducing Japan’s import share of U.S.exports in recent years.
In 1993, European and Japanese pharmaceutical companies accounted for 27percent and 22 percent of all pharmaceuticals marketed worldwide,respectively (PhRMA, 1996). China and the countries of the former SovietUnion are potentially large markets for U.S. pharmaceuticals. However,China is also increasing its production of pharmaceuticals and the formercountries of the Soviet Union pose some major challenges for U.S. producersin terms of testing and licensing regulations (International TradeAdministration, 1994).
Major issues affecting the international competitiveness of U.S.pharmaceutical firms include price controls and intellectual propertyprotection abroad. Other trade barriers include foreign pricing systems thatfavor locally produced pharmaceuticals, discriminatory registrationrequirements, and requirements that foreign companies enter into jointventures with domestic firms.

Pharmaceutical Industry Introduction
Sector Notebook Project September 199715
Source: Pharmaceutical Research and Manufacturers of America, 1997based on data provided by IMS America, 1996.
Middle East2%
Southeast Asia & China
6%Canada3%
United States30%
Australasia1%
Europe27%
Africa2%
Japan22%
Latin America7%
Figure 4: World Sales of Pharmaceuticals, 1995

Page 16 intentionally left blank.

Pharmaceutical Industry Industrial Process Description
Sector Notebook Project September 199717
III. INDUSTRIAL PROCESS DESCRIPTION
This section describes the major industrial processes within the pharmaceuticalindustry, including the materials and equipment used, and the processesemployed. The section is designed for those interested in gaining a generalunderstanding of the industry, and for those interested in the inter-relationshipbetween the industrial process and the topics described in subsequent sectionsof this profile -- pollutant outputs, pollution prevention opportunities, andFederal regulations. This section does not attempt to replicate publishedengineering information that is available for this industry. Refer to Section IXfor a list of reference documents that are available.
This section specifically contains a description of commonly used productionprocesses, associated raw materials, and the materials either recycled ortransferred off-site. This discussion, coupled with schematic drawings of theidentified processes, provides a description of where wastes may be producedin the process. A more in-depth description of the major wastes produced bypharmaceutical manufacturing can be found in Section III.B.
Additionally, it is important to understand the regulatory framework in whichpharmaceutical products are manufactured. To protect the public from unsafeor ineffective pharmaceutical products, Congress established a stringentregulatory system to control the research and development, manufacture andmarketing of pharmaceutical products. The US Food and Drug Administration(FDA) was delegated the responsibility for: (i) evaluating the safety andefficacy of new drugs; (ii) determining if the benefits of the drug outweigh therisks and warrant approval for sale; and (iii) reviewing toxicologicalperformance of active pharmaceutical ingredients. For most newpharmaceutical compounds, FDA oversight begins soon after the discoveryof the compound.
III.A. I ndustrial Processes in the Pharmaceutical Industry
The production of pharmaceutical products can be broken down into threemain stages: 1) research and development; 2) the conversion of organic andnatural substances into bulk pharmaceutical substances or ingredients throughfermentation, extraction, and/or chemical synthesis; and 3) the formulation ofthe final pharmaceutical product.
III.A.1. Research and Development
New drug development involves four principal phases: Pre-Clinical Researchand Development; Clinical Research and Development; Review of New DrugApplication; and Post Marketing Surveillance. Pre-Clinical Research andDevelopment begins after a promising compound has been discovered andisolated in the laboratory. In this phase, the compound is subjected to

Pharmaceutical Industry Industrial Process Description
Sector Notebook Project September 199718
extensive laboratory and animal tests to determine whether the compound isbiologically active and safe. The average time to complete this phase is sixyears.
After completing the Pre-Clinical Research and Development and beforetesting the drug in humans, an application is filed with FDA known as anInvestigational New Drug Application (IND). The application must show theresults of the pre-clinical testing and detail the plans for human clinical tests.It must also contain information about the chemical structure of thecompound and a general description as to how the compound ismanufactured.
Clinical Research and Development is typically conducted in three phases,with each phase involving progressively more people. The first phase, whichtypically lasts about a year, is aimed at establishing the drug’s safety andinvolves a small number of healthy volunteers. The second phase, which lastsabout two years, helps the scientists determine the drug’s effectiveness. In thethird phase, the drug is used in clinics and hospitals, and scientists mustconfirm the results of earlier tests and identify any adverse reactions.Altogether the three phases of Clinical Research and Development take aboutsix years.
In the first phase of Clinical Research and Development, a small amount of thecompound is manufactured in a pilot plant for use in the clinical trials. Thisbatch of compound is called Clinical Trial Material (CTM). At this time, themanufacturing steps of the compound are also optimized and improved.During this phase, attention to waste minimization considerations is mosteffective.
After Clinical Research and Development is completed, the company files,with the FDA, a New Drug Application (NDA) containing comprehensivedata about the compound. The NDA must include data to demonstrate thatthe drug is safe and effective for use under the conditions described in itslabeling. FDA regulations require that the NDA contain specific and detailedinformation on: the components and composition of the drug; the methodsand controls used in the manufacturing; processing and packaging of the drug;and, data from all pre-clinical and clinical investigations. In 1993, the mediantotal approval time for NDAs was 21 months. This has been significantlyreduced and in 1996, the median total approval time for NDAs was 15months.
Each step in the manufacturing process, and the identity and quality of eachingredient used in the process, must be specified in the NDA and approved bythe FDA. Once the NDA is approved, certain changes cannot be madewithout the filing and approval by the FDA of a supplemental application,known as an SNDA. The level of reporting depends on the type of change

Pharmaceutical Industry Industrial Process Description
Sector Notebook Project September 199719
and may require substantial investment of resources to implement. FDAapproval may take several years to obtain depending on the nature of thechange, and some changes even require new clinical studies.
Based on data from a 1995 study by the Center for the Study of DrugDevelopment at Tufts University, a pharmaceutical Research andDevelopment (R&D) facility discovering and developing a new medicinalagent will evaluate approximately 5,000 to 10,000 compounds. About 250of these substances may hold therapeutic promise and enter preclinical testing.However, only about five will go on to limited human clinical testing.Subsequently, only one, after 15.3 years of research and development, will beintroduced commercially as a new drug (PhRMA, 1997).
Basic research is responsible for identifying and isolating or synthesizing eachnew chemical entity that will be evaluated for its potential therapeuticeffectiveness. Once a lead compound has been identified and characterized,some 1,000 related chemical substances will be synthesized and studied bylaboratory assay systems. These assay systems are designed to identity whichcompounds exhibit the most specific and potent biological effect. For eachcompound tested, generally some 5-10 separate chemical reactions will beneeded to synthesize the compound. The results of biological testing will thenguide the direction of subsequent synthetic operations. If the results areunsatisfactory, then the process starts anew.
Should a substance show promise in the laboratory assays, limited animalstudies are started. If there is no activity in the animal, other relatedcompounds will be evaluated or the program will be discontinued. Oncebiologically active substances are identified, they will undergo furtherchemical modification to refine their efficacy and safety.
Once an active candidate has been identified, it will be proposed for formaldevelopment. Pharmaceutical development includes the evaluation of syntheticmethods on a larger scale and the assessment of various ways of formulatingthe drug to provide optimum delivery. Up to this point, only small amountshave been synthesized for evaluation. More will be needed for the extensiveanimal testing required by FDA. Even larger amounts will be required for theextensive clinical studies in humans required before federal approval.
III.A.2. Production of Bulk Pharmaceutical Substances
Bulk pharmaceutical substances typically consist of structurally complexorganic chemical compounds which are manufactured via a series ofintermediate steps and reactions under precise conditions. These substancesare used in the manufacture of the dosage form of a formulatedpharmaceutical product and are manufactured by: (1) chemical synthesis; (2)fermentation; (3) isolation/recovery from natural sources, or (4) a combination

Pharmaceutical Industry Industrial Process Description
2 An intermediate is a material produced during a manufacturing process that must undergo furthermolecular change or processing before it becomes a bulk pharmaceutical substance.
Sector Notebook Project September 199720
of these processes. Examples of different drugs produced by each of theseprocesses are presented in Table 5.
Table 5: Examples of Pharmaceutical Products by Bulk Manufacturing Process
Chemical Synthesis Natural Product Extraction Fermentation
AntibioticsAntihistaminesCardiovascular AgentsCentral Nervous System (CNS) StimulantsCNS DepressantsHormonesVitamins
Antineoplastic AgentsEnzymes and Digestive AidsCNS DepressantsHematological AgentsInsulinVaccines
AntibioticsAntineoplastic AgentsTherapeutic NutrientsVitaminsSteroids
Most pharmaceutical substances are manufactured utilizing “batch” processes.In a batch process, a particular substance or “intermediate”2 is manufacturedin a “campaign” for periods ranging from a few days to several months untilsufficient material is manufactured to satisfy the projected sales demand. Atthe end of the manufacturing campaign, another pharmaceutical intermediateor substance is made. The same equipment with potentially differentconfigurations and the same operating personnel are often used to make adifferent intermediate or substance, utilizing different raw materials, executingdifferent processes, and generating different waste streams.
When the same equipment is used for manufacturing different intermediatesand/or different bulk substances, the equipment is thoroughly cleaned andvalidated prior to its reuse. Where cleaning of a specific type of equipmentis difficult or where a sufficient volume of a certain intermediate or bulksubstance is made every year, the equipment may be dedicated to the batchmanufacturing of a particular intermediate or bulk substance. Where theequipment is dedicated to the production of successive batches of the sameintermediate or bulk substance, the equipment may not be washed and cleanedbetween batches. Instead, the cleaning schedule will depend on whether thereis a potential for carryover of contaminants or degraded materials that couldaffect the final product.
The specific methods and materials (e.g., water, steam, detergents, and/ororganic solvents) used to clean the equipment are based on the ability of thecleaning process to remove residues of raw materials, intermediates,precursors, degradation products, and isomers (FDA, 1996).

Pharmaceutical Industry Industrial Process Description
Sector Notebook Project September 199721
Raw materials are checked for their identity and quality before use in themanufacturing processes. Additionally, in-process testing, as well as qualityassurance/quality control (QA/QC) testing in onsite laboratories, is performedduring drug product manufacturing. In-process testing may include simple pHmeasurements or checks on color, while QA/QC testing typically includesmore sophisticated analyses such as chromatography. “Upon completion ofthe manufacturing operation, batch-production records are checked bycompetent and responsible personnel for actual yield against theoretical yieldof a batch and to ensure that each step has been performed and signed for”(McGraw Hill Encyclopedia of Technology).
Chemical Synthesis
Most of the compounds used today as pharmaceutical products are preparedby chemical synthesis, generally by a batch process (Watthey, 1992).Cardiovascular agents, central nervous system agents, vitamins, antibiotics,and antihistamines are just a few examples of the bulk pharmaceuticalsubstances made by this process.
The manufacture of pharmaceutical compounds using chemical synthesisinvolves a complex series of processes including many intermediate stages andchemical reactions performed in a step-by-step fashion. Depending on theprocess, the operator (or a programmed computer) adds reagents, increasesor decreases the flow rate of chilled water or steam, and starts and stopspumps to draw the reactor contents into another vessel. At other stages in theprocess, solutions may be pumped through filters or centrifuges, recycledwithin the process, or pumped to recycling or disposal facilities. Co-products,such as salts, may be sold for reuse. Spent acids, metals, and catalysts maybe recovered and reused onsite or sold for reuse.
The material from each intermediate step may be isolated and transferred tothe next step of the process for continued processing until the final compoundis derived. These steps may be all conducted at the same manufacturing site,or if the intermediate is isolated, it may be transferred to another site forfurther processing.
It is impossible to provide a single process flow diagram for this industry sinceeach bulk pharmaceutical substance is different in its manufacture and severalintermediates may be produced in a step-wise fashion prior to the manufactureof the final active ingredient. However, an example chemical synthesisprocess has been provided as Figure 5 to show the equipment used and wherewastes or emissions might be generated.

Pharmaceutical Industry Industrial Process Description
Sector Notebook Project September 199722
ReactionVessel
Chemicals(reactants)
ReactionResidues
Sealed - jacketfor cooling/heating
media
ProcessCondenser
Separation - extraction - decanting - centrifugation - filtration
Spent solvents torecovery/disposal
Air EmissionsControl Device
Solvent Vapors
WastewaterTreatment
Solvent Vapors
Crystallization
ProcessCondenser
WastewaterTreatment
Solvent Vapors
Purification - recrystallization - centrifugation - filtration
Drying
Solvent Vapors
Solvent vapors
Product
Solvent Vapors
Wastewater
Wastewater Wastewater
Figure 5: Simplified Process Flow Diagram for Chemical Synthesis
Source: Adapted from Economic Impact and Regulatory Flexibility Analysis of Proposed Effluent Guidelines for thePharmaceutical Manufacturing Industry, 1995.
Reactors
The most common type of reactor vessel is the kettle-type reactor. Thesereactors typically range in capacity from 50 to several thousand gallons. Thevessels are made of either stainless steel or glass-lined carbon steel.
A diagram of a typical reactor vessel is shown in Figure 6. “Reactors areequipped to provide a range of capabilities that may be required during thebatch reaction step. This equipment may include: a jacket for heating andcooling, hookups for charging raw materials and for discharging the contentsof the reactor, an agitation and recycle line for mixing, control systems fortemperature and pressure, a condenser system for controlling vent losses, areturn line for refluxing condensables, a steam ejector for vacuum operation,a nitrogen supply for padding and purging the reactor, and a manway fortaking samples and adding solid catalysts, reactants, and other solid materialsto the reactor” (USEPA 1993).

Pharmaceutical Industry Industrial Process Description
Sector Notebook Project September 199723
CondensedSteam andOrganics
PressureRelief Valve
Steam-JetEjector
Steam
Nitrogen
Solvent,Raw Material,and Reactant
Addition
Manway
ReactorJacket
Steam
Cooling Wateror Coolant
SteamTrap
Condensed SteamDrain Valve
Agitator
ReactorDischarge
RecycleLine
Cooling Wateror Coolant
Figure 6: Typical Design of a Kettle-Type Batch Reactor
Source: Adapted from Control of Volatile Organic Compound Emissions from Batch Processes, EPA Guideline Series,1993.
Raw materials or ingredients, including solvents, used to produce theintermediate or bulk substances are charged into the reactor vessel. Liquidingredients are drawn into the reactor either by pumping or through vacuumfrom drums and storage tanks. Solids may be charged manually or viamechanical means such as through a vacuum system.
Once the reactor vessels are charged with the raw materials, the reaction takesplace. “The reactor can be operated at atmospheric pressure, elevatedpressure, or under vacuum. Because of their flexibility, reactors may be usedin a variety of ways. Besides hosting chemical reactions, they can act asmixers, heaters, holding tanks, crystallizers, and evaporators.” (USEPA,1979) Typical reactions performed include alkylations, hydrogenations,brominations, etc. Temperature, pressure, and the degree of mixing arecarefully monitored to achieve the desired product and to ensure workersafety.

Pharmaceutical Industry Industrial Process Description
Sector Notebook Project September 199724
Reactors are often attached to process condensers to recover solvents fromprocess operations. They are also often attached to other air pollution controldevices to remove volatile organics or other compounds from vented gases.Depending on the reaction being carried out, a reactor may also be attachedto a distillation column for solvent separation and recovery.
Separation
Several separation mechanisms are employed by the pharmaceutical industryincluding extraction, decanting, centrifugation, and filtration. Thesemechanisms may be employed jointly or individually, in multiple stages, toseparate the intermediate or bulk substance from the reaction solution and toremove impurities. Crystallization is another common technique used toseparate the desired active ingredient or intermediate from the reactionmixture. Because crystallization is widely used in conjunction with otherseparation techniques, it is presented separately from the other separationtechniques shown in Figure 5 and discussed below.
Extraction. Extraction is used to separate liquid mixtures by taking advantageof differences in the solubility of the mixture components. A solvent thatpreferentially combines with only one of the components is added to themixture. “The resulting mixture consists of an extract (containing thepreferentially combined material) and a raffinate (containing the residualphase). Extraction may take place in an agitated reaction vessel (mixer-settler), in a vertical cylinder (where the solvent flows upward or downwardthrough the liquid mixture), or in a column with internals to mechanicallyenhance the contact between the two liquid phases” (Crume et al., 1992).
Decanting. Decanting is a simple process used to separate mixtures of a liquidand insoluble solid that has settled to the bottom of a reactor or settlingvessel. The liquid over the solid is either pumped out of the vessel or pouredfrom the vessel leaving behind the insoluble solid and a certain amount ofliquid.
Centrifugation. “Centrifuges are used to remove the intermediate or productsolids from a liquid stream” (USEPA 1979). Centrifuges work on the principleof centrifugal force, in which an outward force is exerted on a rotating object.Centrifuges are cylinders with rotating baskets within them. The sides of thebasket are perforated and covered with filter medium such as woven fabric ormetal. As the basket rotates, a slurry solution is fed into the centrifuge via aninlet pipe. The centrifugal force pushes the slurry against the rotating basket,forcing the liquid to pass through the perforations, and the solids or filter caketo remain behind, accumulating on the sides of the basket. “After all of theslurry has been fed to the chamber, a wash liquid may be introduced to forcethe remaining slurry liquid through the cake and filter medium” (USEPA1993). Once the centrifuge is turned off, the solids (i.e., the intermediates or

Pharmaceutical Industry Industrial Process Description
Sector Notebook Project September 199725
Motor
Slurry Inlet
Wash Inlet
Solids Cake
Perforated Basket
Removable Valve Plate
Solids Discharge
Casing
FiltrateDischarge Adjustable Unloader
Knife
Figure 7: Cross-Section of Typical Top-Suspended Centrifugal Filter
Source: Adapted from Control of Volatile Organic Compound Emissions from Batch Processes, EPA Guideline Series,1993.
the final bulk substance) are scraped off the sides with an internal scraper ormanually scooped out. A diagram of a typical basket centrifuge is shown inFigure 7.
The extremely high speeds and frictional forces involved in centrifuging,combined with the potential build-up of combustible solvent vapors, create apotential for an explosive environment to develop within the centrifuge. Tocontrol this, an inert gas, usually nitrogen, may be introduced into the unitbefore the slurry is fed in. “Centrifuges must be carefully operated to avoidair infiltration by vortex entrainment. Therefore, they usually are operatedunder nitrogen blanket and kept sealed under operation” (USEPA 1993).VOC emissions may occur when purging the vessel before loading andunloading (USEPA, 1993).
Filtration. Filtration is the separation of a fluid-solids mixture involving

Pharmaceutical Industry Industrial Process Description
Sector Notebook Project September 199726
passage of most of the fluid through a porous barrier (the filter medium)which retains most of the solid particulates contained in the mixture (Perry’s1984). In the pharmaceutical industry, “filtration is used to remove solidsfrom a liquid, whether these solids be product, process intermediates, catalystsor carbon particulates (e.g., from a decoloring step)” (USEPA 1979). Batchfiltration systems widely used by the pharmaceutical industry are the plate-and-frame filter, cartridge filters, the nutsche filter, and combinationfilter/dryers.
“The normal filtration procedure is simply to force or draw the mother liquorthrough a filtering medium. Following filtration, the retained solids areremoved” (USEPA, 1979). The wet cake may then go through a reslurryprocess where it is washed and filtered again. “This option is usually carriedout when a highly specialized product requiring high purity is desired or whensolvents were not removed as part of the original slurry filtration (USEPA,1993).
Crystallization
After the reaction takes place, the intermediate or final bulk substance (whichis usually in solid form) can be separated from the reaction solution bycrystallization. Crystallization is one of the most common separationtechniques and is often used alone or in combination with one or more of theseparation techniques described above. In crystallization, a supersaturatedsolution is created in which crystals of the desired compound are formed.Supersaturation depends on the solubility of the desired compound. If thecompound’s solubility increases with temperature, supersaturation can beachieved by cooling the solution. If the solubility is independent of ordecreases with temperature, then evaporating a portion of the solvent willcreate supersaturation. “If neither cooling nor evaporation is desirable,supersaturation may be induced by adding a third component. The thirdcomponent forms a mix with the original solvent in which the solute isconsiderably less soluble” (USEPA 1979). If crystallization is done throughcooling of a solution there will be relatively little VOC emissions, especiallyif the equipment is fully enclosed. “However, when crystallization is done bysolvent evaporation in a vacuum environment, there is a greater potential foremissions” (USEPA 1993). Further separation of the crystals from thesupersaturated solution can be done by centrifuging or filtration.
Purification
Once the intermediate or the bulk substance has been separated, it may needto be purified. Depending on the intermediate or the bulk substance produced,there may be several purification steps involved to produce the desired activeingredient. In vitamin production, for example, there are at least three to fourpurification steps. Purification typically is achieved through additional

Pharmaceutical Industry Industrial Process Description
Sector Notebook Project September 199727
separation steps such as those described above. Purification is often achievedthrough recrystallization. Washing with additional solvents and filtration mayalso be used.
Drying
The final step in the chemical synthesis process is drying of the intermediateor final bulk substance. Drying is done by evaporating the solvents from thesolids. Solvents released from drying operations may be condensed for reuseor disposal (USEPA 1993).
There are several different types of dryers used by the pharmaceutical industryincluding tray dryers, rotary dryers, drum or tumble dryers, or pressure filterdryers. “The selection of the dryer type depends primarily on thecharacteristics of the solid” (USEPA 1993).
Prior to 1980, probably the most common type of dryer used by the industrywas the vacuum tray dryer. In a vacuum tray dryer, “the filtered solid isplaced on trays which are then manually stacked on shelves in the dryer.When the dryer is closed, the trays are heated to remove any liquids. Avacuum is applied within the dryer so that drying can take place at lowertemperatures when needed” (USEPA, 1993).
More often today, tumble dryers or combination filter/dryers are used. In acombination filter/dryer “the equipment not only acts as a filter, but can alsofunction as a product dryer after the slurry has been compressed and filteredinto cake form. Heat is introduced to the filter/dryer through a hot gaseousmedium which is blown up through the cake until the desired level of drynessis achieved” (USEPA 1993). VOC emissions may occur since the gas willentrain evaporated solvent which must be vented from the drying filter/dryer.
Tumble dryers consist of revolving conical shells ranging in capacity from 20to 100 gallons. “The rotation of the dryer tumbles the product to enhancesolvent evaporation and may also perform a blending function” (USEPA1979). These dryers may be operated under a vacuum or using hot aircirculation. When operated under a vacuum, heat is supplied throughconduction from heated surfaces. Some air will pass through the equipmentdue to inward leakage. Thus, the vacuum exhaust will contain VOCs(USEPA, 1993). A diagram of a simple tumble dryer is shown in Figure 8.

Pharmaceutical Industry Industrial Process Description
Sector Notebook Project September 199728
Chain Casing
Steam orHot WaterInlet
Concreteor StructuralFoundation
DischargeOpening
VacuumConnection
Cover
Figure 8: Cross-Section of Typical Tumble Dryer
Source: Adapted from Control of Volatile Organic Compound Emissions from Batch Processes, EPA Guideline Series,1993.
Natural and Biological Product Extraction
Natural product extraction, as the name suggests, involves isolating an activeingredient from natural sources, such as plants, roots, parasitic fungi or animalglands. This process is often used to produce allergy relief medicines, insulin,morphine, anti-cancer drugs, or other pharmaceuticals with unique properties.Blood fractionation, used to produce plasma, is also part of the naturalproduct extraction process (USEPA 1995). A simplified diagram of naturalproduct extraction processes and its associated wastes, is shown in Figure 9.
The desired active ingredient, usually present in raw materials at very lowconcentrations, must be extracted for the final product. Therefore, a definingcharacteristic of this process is that the volume of finished product is often anorder of magnitude smaller than that of the raw materials used. At each stepin the extraction process, the volume of material being processed is reducedsignificantly. This inherent nature of the process makes it an expensive one

Pharmaceutical Industry Industrial Process Description
Sector Notebook Project September 199729
M ix in g &W a sh in g
R a w M a te r ia l(a n im al t iss u epla n t t is su e ,
ro o ts , plas m a )
W a ste w a te r(B O D , C O D , T S S )
E x tra c tio n
H 2O
E v a p o ra t io n
W a ste w a te r(B O D , C O D ,
T S S , am m o n iu msa lts , so lv e n ts)
S lu d g e(s o lv e n ts ,o rga n ic
m a te r ia l )
S o lv e n t v a p o rs(p h e n o l , c h lo ro fo rm ,
m e th ely n e c h lo r .)
A c t iv eIn g re d ie n t
T o C o m p o u n d in g& F o rm u la t io n
O rg a n ic S o lv e n ts(m e th ely n e ch lo rid e ,ch lo ro fo rm , a lco h o l,
to lu e n e ) S c ru b b e r
W a ste w a te r(a c id ic o r
b a s ic , s o lv en ts )
H 2O
Figure 9: Simplified Process Flow Diagram for Natural/Biological Extraction
Source: Adapted from Economic Impact and Regulatory Flexibility Analysis of Proposed Effluent Guidelines for the PharmaceuticalManufacturing Industry, 1995.
to utilize (USEPA 1995).
Because of the large volume reductions involved, an assembly-line processingmethod, consisting of several operation stations is used. At each subsequentoperation station, a little more of the inert material is removed and the activeingredient is extracted. As the volume of material being processed decreases,the size of the containers carrying the material also decreases, from containerscapable of carrying 75-100 gallons to, in some cases, laboratory sizeequipment (USEPA 1995).
Active ingredients are recovered by precipitation, purification and solventextraction methods. In precipitation, solubility is changed by pH adjustment,salt formation, or addition of an anti-solvent. Solvents are used as extractiveagents to remove the active ingredient from the raw materials, such as plantand animal tissues. Solvents are also used to remove fats and oils, which maycontaminate the product (USEPA 1995). Such solvents remove the fats andoils, without damaging the essential active ingredient(s) found in the rawmaterials. Ammonia is also used in the extraction stages as a method ofcontrolling the pH when extracting from animal and plant sources.Ammonium salts are used as buffering chemicals, and aqueous or anhydrousammonia is used as an alkalizing agent. The high degree of solubility of

Pharmaceutical Industry Industrial Process Description
Sector Notebook Project September 199730
ammonium salts prevents unwanted precipitation. Also, ammonium salts havethe advantage of not reacting with animal and/or plant tissues (USEPA 1995).

Pharmaceutical Industry Industrial Process Description
Sector Notebook Project September 199731
FermentationBroth
Seed
Heat
Filter
H2O
Product Dissolved or Precipitated
Wastewater(solvents,
copper, zinc,BOD, COD, TSS,
low pH)
Sludge(sugars,
starches, fermentationbroths, corn steep
liquor)
Separations ActiveIngredient
InoculationTank
Nutrients(sugars, starches)
Gas(NO2CO2, sulfur)
Solvents orMetal Salts
(MiBK, Cu, Zn)
FilterCake
Organic Solvents(acetone, MiBK,
1,2-dichloroethane)
To Compounding &Formulation
Wastewater(solvents)
Figure 10: Simplified Process Flow Diagram for the Fermentation Process
Source: Adapted from Economic Impact and Regulatory Flexibility Analysis of Proposed Effluent Guidelines for thePharmaceutical Manufacturing Industry, 1995.
Fermentation
Most steroids, antibiotics, and certain food additives (such as vitamins) arecommonly known pharmaceuticals which are produced by fermentation. Infermentation, microorganisms (e.g., bacteria, yeast or fungi) are typicallyinoculated in a liquid broth supplemented with nutrients that are acclimatedto an environment (e.g., temperature, pH, oxygen), conducive to rapidgrowth). These microorganisms produce the desired product (e.g., antibiotic,steroid, vitamin, etc.) as a by-product of normal metabolism. Fermentationinvolves three main steps: 1) inoculum and seed preparation, 2) fermentation,and 3) product recovery. A diagram of a fermentation process and the wastesproduced in this process is shown in Figure 10.

Pharmaceutical Industry Industrial Process Description
Sector Notebook Project September 199732
Seed Preparation
The fermentation process begins with the introduction of the microbial strainto a primary seed fermentation, which is commonly performed using shaking-flask culture techniques at the laboratory scale. Once grown, the suspensionis then transferred to further seed stages, which may be additional flaskfermentations, stirred tanks or both. The purpose of this “seed-train” is togenerate enough inoculum for the production fermentor (typically 1-10% ofthe production tank volume). Generally, special seed tanks are used for thefermentor inoculum which are miniature versions (1-10% of size) of theproduction fermentor. If a seed tank becomes contaminated, it is emptied,sterilized, and reinoculated.
Fermentation
Once the fermentor inoculum is ready, it is charged into a sterilized fermentor.During fermentation, the fermentor is usually agitated and aerated. The pH,temperature, and dissolved oxygen content of the fermentation broth may bemonitored during fermentation. Fermentation may last from hours to weeks,depending on the process. A fermentor “broth” is produced, which is thenfiltered or centrifuged to separate out the solids (USEPA 1991).
Product Recovery
Filtration removes any larger residues from the broth, but it does not isolatethe active ingredient from the residues. This must be done by productrecovery processes. Product recovery is achievable through three differentmethods: solvent extraction, direct precipitation and ion exchange, oradsorption (USEPA 1995). Sometimes, the active material is containedwithin the cells of the microorganism. Cell wall breakage by heat orultrasound, for example, may be required to recover the material.
In solvent extraction the active ingredient is removed from the aqueous brothby contacting it with an organic solvent, in which the product is more solublethan it is in water. Removal of the active agent from the solvent can beachieved by crystallization (USEPA 1995).
The direct precipitation method of product recovery involves precipitation ofthe active ingredient, as a metal salt from the broth using, for example, copper(Cu) and/or zinc (Zn) as precipitating agents. The actual choice of theprecipitating agent depends on the properties of the desired active ingredient.The broth is then filtered and the product is recovered from the solid residues(USEPA 1991).
Additionally, ion exchange or adsorption may be used for product recovery.Ion exchange resin (or alternatively, activated carbon) is contacted with the

Pharmaceutical Industry Industrial Process Description
Sector Notebook Project September 199733
Mixing &Granulation
Active Ingredient(Drug)
Tableting &Encapsulation
WashingEquipment
Tablets and Capsules
Non-ContactCooling Water Excipients &
Binders(sugars, starches)
SolventEmission - VOCs
Wastewater(solvents,
detergents)
Aqueous-based Solvents
Wastewater(waste starches,
sugarsBOD, COD, TSS)
Fugitive emissions,vent emissions
TabletDust
Figure 11: Simplified Process Flow Diagram for Compounding and Formulating
Source: Adapted from Economic Impact and Regulatory Flexibility Analysis of Proposed Effluent Guidelines for thePharmaceutical Manufacturing Industry, 1995.
broth and the product adsorbs onto the resin. The product is recovered fromthe resin by using a solvent or by washing the resin with an acidic or basicsolution. It is then crystallized.
III.A.3. Formulation, Mixing, and Compo unding
“The primary objective of mixing, compounding, or formulating operationsare to convert the manufactured bulk substances into a final, usable form.”(USEPA 1995) Figure 11 shows a simplified process flow diagram forcompounding, formulation and packaging. Common dosage forms ofpharmaceutical products include tablets, capsules, liquids, creams andointments, as well as aerosols, patches and injectable dosages. Table 6 listscommon pharmaceutical dosage forms and their uses.

Pharmaceutical Industry Industrial Process Description
Sector Notebook Project September 199734
As with the bulk manufacturing operations, many final products are producedin batch utilizing a campaign regimen. At the end of the production campaign,another product may be formulated and packaged using the same equipmentand the same personnel. Additionally, formulation and packaging isperformed in accordance with “good manufacturing practices” (GMP). GMPis regulated by the FDA and sets forth the minimum methods to be used in,and the facilities and controls to be used for the manufacture, processing,packing, or holding of a drug to assure that such drug meets the safetyrequirements and the quality and purity characteristics that it purports or isrepresented to possess.
Following formulation, the finished product may be packaged at the same siteor it may be transferred to another site. Packaging includes placing the finalformulated products into containers, labeling, and preparing for shipping.“The packaging components of a pharmaceutical product are vital to its safeand effective use. Besides serving the patient as a convenient unit of use, thecomposite package (unit container, labeling, and shipping components) mustprovide appropriate identification and necessary information for proper useincluding warnings and (pre)cautions and preservation of the product’schemical and physical integrity” (Kirk-Othmer, 1994).
Batch production records are used and describe each manufacturing step indetail. At various stages in the formulation and packaging process, qualitycontrol checks are utilized. All raw materials are checked prior to use in aprocess and the final dosage forms require a myriad of tests to assuretherapeutic benefit. For example, the content uniformity, color, homogeneity,dissolution, stability, identity, and potency of the product must be determinedand meet stated ranges. Representative samples are collected at the end of theformulation stage and submitted to the chemical and/or microbiologicallaboratories for final assaying. Representative samples are also collectedduring packaging operations. The quality control unit of the pharmaceuticalmanufacturing company has the responsibility and authority to approve orreject all raw materials, in-process materials, packaging materials includingcontainers, closures, and labeling materials, as well as the final product.
The equipment used to formulate and package the final product is cleaned,maintained, and sanitized at appropriate intervals. Actual maintenance andcleaning schedules and results are documented. As described under bulkmanufacturing, the methods, equipment, and materials used (e.g., waterwash, steam, detergents, organic solvents) to clean the equipment arespecified on a per product basis.

Pharmaceutical Industry Industrial Process Description
Sector Notebook Project September 199735
Table 6: Pharmaceutical Dosage FormsDosageForm
Constituents, properties
Solids
Uses
powders,bulk
comminuted or blended, dissolved or mixed with water external, internal
effervescent CO2-releasing base ingredients oral
insufflation insufflator propels medicated powder into body cavity body cavities
lyophilized reconstitution by pharmacist of unstable products various uses includingparenteral and oral
capsules small-dose bulk powder enclosed in gelatin shell, active ingredient plusdiluent
internal
troches,lozenges
prepared by piping and cutting or disk candy technology; compounded withglycerogelatin
slow dissolution in mouth
compressedtablets
dissolved or mixed with water; great variety of shapes and formulations oral and external
pellets for prolonged action implantation
coated tablets coating protective, slow release oral
Liquid Solutions
syrups sweetener, solvent, medicinal agent flavoring agent, medicinal
spirits alcohol, water, volatile substances flavor or medicinal
collodions pyroxylin in ether, medicinal agent (castor oil, camphor) external for corns andbunions
parenteralsolutions
sterile, pyrogen-free, isotonic, pH close to that of blood; oily or aqueoussolution
intravenous, intramuscular,subcutaneous injection
ophthalmic sterile, isotonic, pH close to that of tears; viscosity builder eye treatment
nasal aqueous, isotonic, pH close to that of nasal fluids; sprays or drops nose treatment
mouthwash,gargles
aqueous, antiseptic refreshment, short termbacterial control
inhalations administered with mechanical devices medication of trachea orbronchioles
Liquid Dispersions
suspensions powder suspended in water, alcohol, glycol, or an oil oral dosing, skin application
emulsions,lotions
oil-in-water or water-in-oil oral, external or injection
Semisolid and plastic dispersions
ointments hydrocarbon (oily), adsorptive water-washable, or water-soluble bases;emulsifying agents, glycols, medicating agent
external
pastes andcerates
ointments with high dispersed solids and waxes, respectively external
suppositories theobroma oil, glycinerated gelatin, or polyethylene glycol base plusmedicinal agent
insertion into body cavity
Source: Adapted from Zanowaik, P., 1995, “Pharmaceuticals” in Kirk-Othmer, Encyclopedia of Chemical Technology,vol. 18, 4th edition.

Pharmaceutical Industry Industrial Process Description
Sector Notebook Project September 199736
Tablets
Tablets account for the majority of solid medications taken orally in theUnited States. “Tablets can be made to achieve rapid drug release or toproduce delayed, repeated or prolonged therapeutic action” (Kirk-Othmer,1994). Tablets can be compressed or molded, and may be coated.
To prepare a tablet, the active pharmaceutical ingredient is combined with afiller, such as sugar or starch, and a binder, such as corn syrup or starch. Thefiller is added to ensure that the active ingredient is diluted to the properconcentration. A binder is needed to bind tablet particles together. Alubricant, such as magnesium sterate or polyethylene glycol, may be added tofacilitate equipment operation, or to slow disintegration or dissolution of theactive ingredient.
Tablets are produced by compression of powder blends or granulations. Indirect compression, the ingredients are blended and then compressed into thefinal tablet without modifying the physical nature of the material itself. “Themost widely used and most general method of tablet preparation is the wet-granulation method” (Remington, 1995). In wet granulation, the activeingredient is powdered and mixed with the filler. This mixture is then wettedand blended with the binder, forming a solution. Coarse granules form whichare mixed with lubricants such as magnesium stearate and then compressedinto tablets. Slugging or dry granulation is used when tablet ingredients aresensitive to moisture or temperatures associated with drying or when thetablet ingredients have sufficient inherent binding or cohesive properties. Drygranulation includes weighing, mixing, slugging, dry screening, lubrication,and compression. Slugging requires large heavy presses to compress largertablets, between 20-30 grams in weight. These large tablets are then groundand screened to a desired mesh size then recompressed into final tablets(USEPA, 1991).
Coating may be used to offer protection from moisture, oxygen, or light, tomask unpleasant taste or appearance, and to impart distinctive colors tofacilitate patient recognition. “Enteric coatings are used to delay the releaseof the active ingredient in the stomach and prolong therapeutic activity. Thelatter are used for drugs that are unstable to gastric pH or enzymes, causenausea and vomiting, or irritation to the stomach, or should be present in highconcentrations in the intestines” (Kirk-Othmer, 1994). Coating is done in arotary drum. The coating solution is poured onto the tablets. In manyoperations, aqueous coating solutions are now used instead of solvent based(usually methylene chloride) solutions. As the drum rotates, the tabletsbecome coated. Once coated, they are dried in the drum and may be sent toanother rotary drum for polishing. Polishing works by the friction created

Pharmaceutical Industry Industrial Process Description
Sector Notebook Project September 199737
when the tablets rotate and rub against each other. Un-coated tablets mayalso be polished.
Once the tablets pass quality control requirements, they may be held or sentdirectly to packaging. Coated tablets are stamped with identifying information(e.g., brand name, code number) in a rotary ink press.
Capsules
After tablets, the most common solid oral dosage form is the capsule.Capsules come in soft and hard shelled varieties. Hard capsules or “dry-filled”capsules are formed by dipping metal pins into a solution of gelatin of aspecific temperature. The temperature controls the viscosity of the gelatinand hence the thickness of the capsule walls. When the pins are removedfrom the solution, a hard coating of gelatin forms on the pins. The coating isdried and trimmed. “These capsules are filled by introducing the powderedmaterial into the longer end or body and the capsule and then slipping on thecap.” (Remington, 1995)
Soft shelled capsules are formed by placing two continuous gelatin filmsbetween rotary die plates. As the plates are brought together, the two gelatinfilms join and seal, forming the two halves of the capsule. As the two halvesjoin, the ingredients, which can be a liquid, paste or powder, are injected intothe capsules. “Commercially filled soft gelatin capsules come in a wide choiceof sizes and shapes: they may be round, oval, oblong, tube or suppository-shaped” (Remington).
Liquid Dosage
In formulating a liquid product, the ingredients are first weighed and thendissolved in an appropriate liquid. The solutions are mixed in glass-lined orstainless steel vessels, after which they are stored in tanks before finalpackaging. Preservatives may be added to prevent mold and bacterial growth.If the liquid will be used for injection or ophthalmic use, sterilization isrequired. In this case, the container, which has also been previouslysterilized/depyrogenated, is filled with liquid which has either been renderedsterile by aseptic filtration in a sterile environment and/or the entire containerand its contents are terminally heat sterilized in an autoclave.
Ointments and Creams
Ointments are usually made by blending the bulk active ingredient with a base,such as a petroleum derivative or wax. The mixture is cooled, rolled out, andpoured into tubes by machines and packaged (USEPA, 1991).

Pharmaceutical Industry Industrial Process Description
Sector Notebook Project September 199738
Creams are semisolid emulsions and are either oil-in-water or water-in-oil,rather than being petroleum based. “Generally, the ingredients of the twophases are heated separately, then are mixed and stirred vigorously to achieveemulsification” (Kirk-Othmer, 1994).
As with all other dosage forms, equipment is washed and cleaned based onbatch record requirements. However, because of the greasy nature ofointment and cream production, cleaning often is done with detergents.

Pharmaceutical Industry Industrial Process Description
Sector Notebook Project September 199739
III.B. Raw Material I nputs and Pollutant Outputs
Pharmaceutical batch processes use numerous raw materials and generatewastes and emissions. In general, the waste and emissions generated dependon the raw materials and equipment used, as well as the manufacturingprocess employed. In designing bulk manufacturing processes, considerationis given to the availability of the starting materials and their toxicity, as wellas the wastes (e.g., mother liquors, filter residues, and other by-products) andthe emissions generated. A description of some of the considerations givenis provided in Section V, Pollution Prevention Opportunities.
When bulk manufacturing reactions are complete, the solvents are physicallyseparated from the resulting product. Due to purity concerns, solvents oftenare not reused in a pharmaceutical process. They may be sold for non-pharmaceutical uses, used for fuel blending operations, recycled, or destroyedthrough incineration.
This section describes the raw materials and associated waste streams andsome of the more common technologies used to control these wastes. Muchof this information is summarized in Table 7.

Pharmaceutical Industry Industrial Process Description
Sector Notebook Project September 199740
Table 7: Summary of Typical Material Inputs and Pollution Outputs in the Pharmaceutical Industry
Process Inputs (examples ofsome commonly usedchemicals provided)
Air Emissions Wastewater ResidualWastes
ChemicalSynthesis
- Reaction
Solvents, catalysts,reactants, e.g. benzene,chloroform, methylenechloride, toluene,methanol, ethyleneglycol, methyl isobutylketone (MiBK), xylenes,hydrochloric acid, etc.
VOC emissions fromreactor vents, manways,material loading andunloading, acid gases(halogen acids, sulfurdioxide, nitrous oxides);fugitive emissions, frompumps, samplecollections, valves, tanks
Process waste waters withspent solvents, catalysts,reactants; pump seal waters,wet scrubber wastewater;equipment cleaningwastewater; wastewatermaybe high in BOD, COD,TSS with pH of 1-11.
Reaction residuesand reactorbottom wastes
- Separation Separation and extractionsolvents, e.g.. methanol,toluene, hexanes, etc.
VOC emissions fromfiltering systems whicharen’t contained; andfugitive emissions fromvalves, tanks andcentrifuges
Equipment cleaning washwaters, spills, leaks, spentseparation solvents
- Purification Purification solvents e.g..methanol, toluene,acetone, hexanes, etc.
Solvent vapors frompurification tanks;fugitive emissions
Equipment cleaning washwaters, spills, leaks, spentpurification solvents
- Drying Finished active drug(s) orintermediates
VOC emissions frommanual loading andunloading of dryers
Equipment cleaning washwaters, spills, leaks
Natural ProductExtraction
Plants, roots, animaltissues, extractionsolvents, e.g.. ammonia,chloroform, phenol,toluene, etc.
Solvent vapors & VOC’sfrom extractionchemicals
Equipment cleaning washwaters, spent solvents(ammonia); natural productextraction wastewater havelow BOD, COD, TSS and pHof 6-8.
Spent rawmaterials (plants,roots etc.)
Fermentation Inoculum, sugars,starches, nutrients,phosphates, fermentationsolvents, e.g.. ethanol,amyl alcohol, methanol,MiBK, acetone, etc.
Odoriferous gases,extraction solvent vapors,particulates
Spent fermentor broth,fermentation wastewatercontaining sugars, starches,nutrients, etc.; wastewatertends to have high BOD,COD, TSS and have pH of 4-8.
Waste filter cake,fermentationresidues
Formulation Active drug, binders(starches), sugar, syrups,etc.
Tablet dusts, otherparticulates
Equipment cleaning washwaters (spent solvents), spills,leaks; wash waters typicallycontain low levels of BOD,COD, TSS and have pH of 6-8.
Particulates,waste packaging,rejected tablets,capsules etc.
Source: Development Document for Proposed Effluent Limitations Guidelines and Standards for the PharmaceuticalManufacturing Point Source Category, US EPA, Washington, DC., February 1995.

Pharmaceutical Industry Industrial Process Description
Sector Notebook Project September 199741
III.B.1. Raw Materials
“The pharmaceutical manufacturing industry draws upon worldwide sourcesfor the myriad of raw materials it needs to produce medicinal chemicals.Fermentation operations require many new raw materials falling into generalchemical classifications such as carbohydrates, carbonates, steep liquors,nitrogen, and phosphorus compounds, anti-foam agents, and various acids andbases. These chemicals are used as carbon and nutrient sources, as foamcontrol additives, and for pH adjustment in fermentation processes. Varioussolvents, acids, and bases are also required for extraction and purificationprocesses.
Hundreds of raw materials are required for the chemical synthesis processesused by the industry. These include organic and inorganic compounds and areused in gas, liquid, and solid forms. Plant and animal tissues are also used bythe pharmaceutical manufacturing industry to produce various biological andnatural extraction products” (EPA, 1995).
Each manufacturing or formulation plant is special, differing from othersimilar pharmaceutical plants in size, types of intermediates, bulk substances,or products produced, amounts and types of solvents used, and thus, in theraw materials used and wastes/emissions generated. Most bulkpharmaceutical reactions require organic solvents to dissolve chemicalintermediates and reagents. Because of the high reactivity of manypharmaceutical reagents and intermediates, pharmaceutical solvents must benon-reactive, provide an environment which allows efficient heat transferduring endothermic or exothermic reactions, and facilitate efficient electrontransfer. Often halogenated solvents, such as methylene chloride, provide theoptimum choice for pharmaceutical reactions. The most commonly usedsolvent in the pharmaceutical industry is methanol, an oxygenated organicsolvent. Other common solvents used are ethanol, acetone, and isopropanol.Tables 8, 9, and 10 show the typical solvents (and whether or not they arepriority pollutants or hazardous air pollutants) used in chemical synthesis,biological and natural extraction, and fermentation processes, respectively.
Final bulk substances from the bulk manufacturing processes are used informulation operations, along with other raw materials or ingredients. Theproduction of these ingredients is described under Section III.A.2.

Pharmaceutical Industry Industrial Process Description
Sector Notebook Project September 199742
Table 8: Solvents Used in the Chemical Synthesis Process
Chemical PriorityPollutantUnder the
Clean WaterAct
HazardousAir Pollutant
under theClean Air
Act
Chemical PriorityPollutantUnder the
Clean WaterAct
HazardousAir
Pollutantunder theClean Air
Act
Acetone Ethylene glycol X
Acetonitrile X Formaldehyde X
Ammonia (aqueous) Formamide
n-Amyl acetate Furfural
Amyl Alcohol n-Heptane
Aniline X n-Hexane X
Benzene X X Isobutyraldehyde
2-Butanone (MEK) X Isopropanol
n-Butyl acetate Isopropyl acetate
n-Butyl alcohol Isopropyl ether
Chlorobenzene X X Methanol X
Chloroform X X Methylamine
Chloromethane X X Methyl cellulose
Cyanide X Methylene chloride X X
Cyclohexane Methyl formate
o-Dichlorobenzene (1,2-Dichlorobenzene)
X Methyl isobutylketone (MiBK)
X
1,2-Dichlorobenzene X 2-Methylpyridine
Diethylamie Petroleum naphtha
Diethyl Ether Phenol X X
N,N-Dimethylacetamide
Polyethylene glycol600
Diethylamine n-Propanol
N,N-Dimethylaniline X Pyridine
N,N-Dimethylformamide
X Tetrahydrofuran
Dimethyl sulfoxide Toluene X X
1,4-Dioxane X Trichlorofloromethane
Ethanol Triethylamine X
Ethyl acetate Xylenes X
Source: adapted from Development Document for Proposed Effluent Guidelines and Standards for the PharmaceuticalManufacturing Point Source Category, 1995 and US Environment Laws, 1994.

Pharmaceutical Industry Industrial Process Description
Sector Notebook Project September 199743
Table 9: Solvents Used in Biological and Natural Product ExtractionChemicals Priority
Pollutantsunder the
Clean WaterAct
HazardousAir
Pollutantsunder theClean Air
Act
Chemicals PriorityPollutantsunder the
Clean WaterAct
HazardousAir
Pollutantsunder theClean Air
Act
Acetone Ethylene glycol X
Acetonitrile X Formaldehyde X
Ammonia (aqueous) n-Heptane
n-Amyl acetate n-Hexane X
Amyl alcohol Isopropanol
n-Butyl alcohol Isopropyl acetate
Chloroform X X Isopropyl ether
1,2-Dichloroethane X Methanol X
Diethylamine Methylenechloride
X X
Diethyl ether Petroleumnaphtha
N,N-Diethylformamide
X Phenol X X
Dimethyl sulfoxide n-Propanol
1,4-Dioxane X Pyridine
Ethanol Tetrahydrofuran
Ethyl acetate Toluene X X
Source: adapted from Development Document for Proposed Effluent Guidelines and Standards for the PharmaceuticalManufacturing Point Source Category, 1995 and US Environment Laws, 1994.
Table 10: Solvents Used in Fermentation ProcessesChemicals Priority
Pollutants Underthe Clean Water
Act
HazardousAir
Pollutantsunder theClean Air
Act
Chemicals PriorityPollutants Underthe Clean Water
Act
HazardousAir
Pollutantsunder theClean Air
Act
Acetone n-Heptane
Acetonitrile X n-Hexane X
Ammonia (aqueous) Isopropanol
n-Amyl acetate Isopropylacetate
Amyl alcohol Methanol X
n-Butyl acetate Methylcellulose
n-Butyl alcohol Methylenechloride
X X
Chloroform X X Methylisobutaneketone (MiBK)
X

Pharmaceutical Industry Industrial Process Description
Table 10: Solvents Used in Fermentation Processes
Sector Notebook Project September 199744
N,N-Diethylformamide
X Petroleumnaphtha
Ethanol Phenol X X
Ethyl acetate Toluene X X
Formaldehyde X Triethylamine X
Source: adapted from Development Document for Proposed Effluent Guidelines and Standards for the PharmaceuticalManufacturing Point Source Category, 1995 and US Environment Laws, 1994.
III.B.2. Air Emissions and Control Systems
Both gaseous organic and inorganic compounds, as well as particulates, maybe emitted during pharmaceutical manufacturing and formulation. Some ofthe volatile organic compounds (VOC) and inorganic gases that are emittedare classified as hazardous air pollutants (HAPs) under the Clean Air Act.
The type and amount of emissions generated are dependent on the operationsconducted by the facility, as well as how the product is manufactured orformulated. “Each (pharmaceutical) plant is unique, differing from otherplants in size, types of products manufactured, amounts and types of VOCused, and air pollution control problems encountered” (EPA, 1979).
Bulk Manufacturing
As previously described, the industry manufactures most bulk pharmaceuticalsubstances and intermediates in campaigns via batch processes. Following thecompletion of one campaign, another bulk substance or intermediate istypically made using the same equipment (e.g., reactors, filters, dryers). Thereactants and solvents used in manufacturing the next bulk substance orintermediate may vary greatly from the ones previously used. While somereactions may require the use of halogenated solvents, the next reaction mayuse another solvent or no solvent at all.
This wide variations in bulk manufacturing makes predicting typical or annualaverage emissions difficult. This is because the emission generated arepredicated on what bulk substance or intermediate is manufactured and overwhat length of time, and which equipment and raw materials are used. Somebulk substances and intermediates are made frequently, while others may bemade only once every two to three years over a one to two week period. Thishas often prevented the calculation of typical emission rates for eachoperation. However, an approximate ranking of emission sources has beenestablished by EPA and is presented below in order of decreasing magnitude.The first four sources generally will account for the majority of emissionsfrom a bulk manufacturing plant.
&Dryers
Pharmaceutical Industry Industrial Process Description
Sector Notebook Project September 199745
&Reactors&Distillation units&Storage and transfer of materials&Filtration&Extraction&Centrifugation&Crystallization
Dryers are one of the largest sources of VOC emissions in bulkmanufacturing. In addition to the loss of solvent during drying, manualloading and unloading of dryers can release solvent vapors into ambient air,especially when tray dryers are used. VOCs are also generated from reactionand separation steps via reactor vents and manways. Centrifuges may be asource of VOC emissions, especially in top loading types, where solids aremanually scooped out.
Typical controls for these emission sources, excluding storage and transferoperations, include condensers, scrubbers, carbon absorbers and, on occasion,incinerators. “Storage and transfer emissions can be controlled by vaporreturn lines, vent condensers, conservation vents, vent scrubbers, pressuretanks and carbon absorbers. Floating roofs may be feasible controls for largevertical storage tanks” (EPA, 1979).
Formulation
Both particulates and VOCs may be formed during mixing, compounding,formulation, and packaging steps. Because these compounds may pose adanger to workers, through direct inhalation, they are a principal concern.Depending on the process and the batch record requirements, the particulates(e.g., tablet dusts) may be recycled back into the formulation process.However, sometimes the particulates are collected for destruction or disposal.
As in bulk manufacturing, the type and quantity of compounds emitteddepends on the operation. For example, formulation facilities may or may notemit VOCs. Some formulation operations do not require the use of solvents,some may only use solvents for cleaning, and some may use solvents ingranulation and coating operations. In some facilities, organic compounds,such as ethanol or isopropyl alcohol, might be used in the formulation of theproduct and VOCs may be emitted during mixing, formulation, and/orpackaging.
Air Pollution Control Equipment
More than one type of air control equipment may be used at any one time inany one facility. A description of the various equipment used by the industry

Pharmaceutical Industry Industrial Process Description
Sector Notebook Project September 199746
is provided below.
Condensers. Condensers are widely used in the pharmaceutical industry torecover solvents from process operations (a process condenser) and as airpollution control devices to remove VOCs from vented gases. Processcondensers differ from condensers used as air pollution control devices as theprimary purpose of a process condenser is to recover material as an integralpart of a unit operation. The process condenser is the first condenser locatedafter the process equipment and supports a vapor-to-liquid phase change forthe vapors produced in the process equipment. Examples of processcondensers include distillation condensers, reflux condensers, processcondensers in line before the vacuum source, and process condensers used instripping or flashing operations. The primary purpose of a condenser usedas an air pollution control device is to remove VOCs prior to venting.
Condensation is the process of converting a gas or vapor to liquid. In thismethod, gas streams from vents containing VOCs are cooled to below theirsaturation temperatures, converting the gas into a VOC liquid. This removessome VOCs from the gas, but some remains. The amount of VOCs remainingin the gas depends on the temperature and vapor-liquid equilibrium of theVOC. Lowering the temperature of the condenser generally lowers thecontent of VOC in the gas stream.
“In the most common type, surface condensers, the coolant does not directlycontact condensable vapors, rather heat is transferred across a surface (usuallya tube wall) separating vapor and coolant. In this way the coolant is notcontaminated with condensed VOC and may be directly reused. The type ofcoolant used depends on the degree of cooling needed for a particularsituation” (EPA, 1979). Coolants in common use are water, chilled water,brine, and glycol.
Scrubbers. Scrubbers or gas absorbers are used to remove one or moreconstituents from a gas stream by treatment with a liquid. “Absorption isimportant in the pharmaceutical industry because many VOCs and otherchemicals being used are soluble in water or aqueous solutions. Therefore,water, caustic or acidic scrubbers can be applied to a variety of air pollutionproblems” (USEPA 1979).
When using a scrubber as an air pollution control device, the solubility of theconstituents in the gas stream in the absorbing liquid must be determined.“The rate of transfer of the soluble constituents from the gas to the liquidphase is determined by diffusional processes occurring on each side of the gasliquid interface” (Theodore and Bonicore, 1989).
The main types of scrubbers used are packed tower, plate or tray tower,

Pharmaceutical Industry Industrial Process Description
Sector Notebook Project September 199747
venturi scrubber, and spray tower. Each type of scrubber is designed toprovide intimate contact between the scrubbing liquid and the gaseousconstituents so that mass transfer between phases is promoted. The degreeof control achieved is dependent on the residence time of the gas and liquids,the interfacial area, and the physical and thermodynamic properties of theVOC species involved.
Combustion or Incineration. Another method used for controlling VOCemissions is combustion or incineration. “In general, factors that influencethe efficiency of combustion are: (1) temperature, (2) degree of mixing, (3)residence time in the combustion chamber, and (4) type of VOC combusted.Since more waste streams contain dilute VOC concentrations, they requirethat supplemental fuel maintain the necessary combustion temperatures”(EPA, 1979). Although combustion systems can achieve high removalefficiencies, these systems are typically more expensive to install, operate, andmaintain, and have secondary emissions associated with their operation.Additionally, a scrubber may be required to control inorganic gases producedas by-products of combustion.
“Equipment used to control waste gases by combustion can be divided intothree categories: direct combustion or flaring (not often used by thepharmaceutical industry), thermal oxidation, and catalytic oxidation. A directcombustor or flare is a device in which air and all the combustible waste gasesreact at the burner. In contrast, in thermal oxidation, the combustible wastegases pass over or around a burner flame into a residence chamber whereoxidation of the waste gases is completed. Catalytic oxidation is very similarto thermal oxidation. The main difference is that after passing through theflame area, the gases pass over a catalyst bed which promotes oxidation at alower temperature than does thermal oxidation” (Theodore and Buonicore,1989). Efficiency rates of catalytic oxidizers in destroying VOCs can reachclose to 98% (Buonicore and Davis, 1992).
Adsorption. Adsorption is another method for removing VOCs from gasstreams. This method filters out the volatiles by passing them through apacked column of activated carbon, silicates, aluminas, aluminosilicates, orany other surface which is porous and has a microcrystalline structure. As thegas stream passes through the column, the VOCs adsorb to the surface of themedia. The adsorption material in the column eventually becomes saturated,and must be either regenerated or disposed. Most sorbents may beregenerated repeatedly by passing hot gas or steam through the bed. VOCswill desorb into the gas or steam. The high VOC concentration in the gas orsteam can then be removed through condensation. Adsorption can be about98% efficient in removing VOCs in the waste gas stream (Crume and Portzer,1992).
Pharmaceutical Industry Industrial Process Description
3 Priority pollutants are the pollutants listed in 40 CFR part 403, Appendix A.
Sector Notebook Project September 199748
III.B.3. Wastewater
Pharmaceutical manufacturers use water for process operations, as well as forother non-process purposes. However, the use and discharge practices andthe characteristics of the wastewater will vary depending on the operationsconducted at the facility. Additionally, in some cases, water may be formedas part of a chemical reaction.
Process water includes any water that, during manufacturing or processing,comes into direct contact with or results from the use of any raw material orproduction of an intermediate, finished product, byproduct, or waste. Processwastewater includes water that was used or formed during the reaction, waterused to clean process equipment and floors, and pump seal water. Non-process wastewater includes noncontact cooling water (e.g., used in heatexchangers), noncontact ancillary water (e.g., boiler blowdown, bottlewashing), sanitary wastewater, and wastewater from other sources (e.g.,storm water runoff).
Based on the responses from 244 facilities to a 1990 308 Questionnaire, EPAestimated the average daily wastewater generation by the pharmaceuticalmanufacturing industry to be 266 million gallons. Additionally, EPA learnedthat more than half of the responding facilities have implemented waterconservation measures. Such measures include: careful monitoring of wateruse, installation of automatic monitoring and alarm systems or in-plantdischarges, implementation of alternative production processes, reuse of non-contact water as process makeup water and treatment of contact coolingwater to allow reuse.
Pharmaceutical manufacturers generate process wastewater containing avariety of conventional parameters (e.g., BOD, TSS, and pH) and otherchemical constituents. The top ten chemicals discharged by thepharmaceutical industry are provided in Table 11. Of these compounds, twoare “priority pollutants”3. The top four compounds are oxygenated organicsolvents (e.g., methanol, ethanol, acetone, and isopropanol).

Pharmaceutical Industry Industrial Process Description
Sector Notebook Project September 199749
Table 11: Chemicals Discharged in Wastewater by the PharmaceuticalManufacturing Industry
Constituent NameQuantity
Discharged (lbs/yr)Percent of Total
Loading# of Facilities Reporting
Constituents
Methanol 15,388,273 28 82
Ethanol 6,802,384 12 97
Acetone 4,573,766 8.4 55
Isopropanol 4,565,370 8.4 85
Acetic acid 4,328,691 7.9 44
Methylene chloride 3,590,640 6.6 47
Formic acid 2,136,059 3.9 9
Ammonium hydroxide 1,365,741 2.5 32
N1N-Dimethylacetamide 1,046,333 1.9 7
Toluene 783,364 1.4 43
Source: adapted from Development Document for Proposed Effluent Guidelines and Standards for the PharmaceuticalManufacturing Point Source Category, 1995 and US Environment Laws, 1994.
Most process wastewater receives some treatment, either in-plant at theprocess unit prior to commingling with other facility wastewater or prior todischarge to a permitted outfall. Table 12 provides a trend analysis preparedby EPA of wastewater treatment technologies used by the pharmaceuticalindustry. EPA found that “since 1986, the use of neutralization, equalization,activated sludge, primary clarification, multimedia filtration, steam stripping,secondary clarification, granular activated carbon, and oxidation have allincreased, while the use of aerated lagoons, chlorination, waste stabilizationponds, and trickling filters have decreased slightly” (USEPA 1995).
More than half of the surveyed facilities provide pH adjustment orneutralization to adjust the pH prior to discharge. Additionally, becausewastewater treatment can be sensitive to spikes of high flow or highconstituent concentration, many treatment systems include equalization.Advanced biological treatment is used to treat biochemical oxygen demand(BOD5), chemical oxygen demand (COD), total suspended solids (TSS), aswell as various organic constituents. Biological systems can be divided intotwo basic types: aerobic (treatment takes place in the presence of oxygen) andanaerobic (treatment takes places in the absence of oxygen). Very fewpharmaceutical facilities (only two) use anaerobic treatment. However, morethan 30 percent use aerobic systems such as activated sludge, aerated lagoons,trickling filter, and rotating biological contactors (RBC).

Pharmaceutical Industry Industrial Process Description
Sector Notebook Project September 199750
Table 12: Wastewater Treatment Technology Trends
Treatment TechnologyPercentage of Facilities Using
Technology Prior to 1986Percentage of Facilities Using
Technology in 1989/1990
Neutralization 26.0 44.3
Equalization 20.1 28.6
Activated sludge 16.9 20.5
Settleable solids removal 13.3 NA
Primary sedimentation 12.0 NA
Aerated lagoon 7.5 4.9
Primary clarification 3.9 9.8
Chlorination 3.6 2.5
Polishing ponds 3.2 NA
Waste stabilization pond 2.9 2.5
Trickling filter 2.9 2.0
Multimedia filtration 2.3 6.1
Stream stripping 1.9 5.7
Evaporation 1.9 NA
Secondary clarification 1.6 20.9
Granular activated carbon 1.3 3.3
Oxidation 1.0 2.0
Dissolved air flotation 1.0 NA
pH adjustment NA 50.0
Phase separation NA 12.3
Note: Total percentage is not 100 because facilities may use multiple treatment technologies.NA - Not available.
Source: adapted from Development Document for Proposed Effluent Guidelines and Standards for thePharmaceutical Manufacturing Point Source Category, 1995 and US Environment Laws, 1994.
Although the pharmaceutical industry has routinely utilized recovery systemsto recover and reuse solvents, only four facilities were identified by EPA asusing stream stripping to remove gases and/or organic chemicals fromwastewater streams. Sixty one facilities were identified that use distillationeither to recover a specific solvent from a process stream or to treat one ormore process waste streams. However, according to PhRMA, it is likely that

Pharmaceutical Industry Industrial Process Description
Sector Notebook Project September 199751
these facilities use this method to recover a specific solvent from a specificprocess stream rather than to treat wastewater from numerous operationssince the treatment technology is not applicable to the wide range of wastecharacteristics common in the pharmaceutical industry.
III.B.4. Solid Wastes
Both nonhazardous and hazardous wastes are generated during all threestages of pharmaceutical manufacturing. These wastes can include off-specor obsolete raw materials or products, spent solvents, reaction residues, usedfilter media, still bottoms, used chemical reagents, dusts from filtration or airpollution control equipment, raw material packaging wastes, laboratorywastes, spills, as well as wastes generated during packaging of the formulatedproduct.
Filter cakes and spent raw materials (plants, roots, animal tissues etc.) fromfermentation and natural product extraction are two of the largest sources ofresidual wastes in the pharmaceutical industry. Other wastes include reactionresidues and filtrates from chemical synthesis processes. These wastes may bestripped of any solvents which remain in them, and then disposed as eitherhazardous or nonhazardous wastes. Typically, solid wastes are shipped off-site for disposal or incineration.
A number of practices are implemented by the industry to reduce wastegeneration and material losses. Typical practices include processoptimization, production scheduling, materials tracking and inventory control,special material handling and storage procedures, preventive maintenanceprograms, and waste stream segregation.

Pharmaceutical Industry Industrial Process Description
Sector Notebook Project September 199752
III.C. Management of TRI Chemicals in the Production Process
The Pollution Prevention Act of 1990 (PPA) requires facilities to reportinformation about the management of Toxics Release Inventory (TRI)chemicals in waste and efforts made to eliminate or reduce those quantities.These data have been collected annually in Section 8 of the TRI reportingForm R beginning with the 1991 reporting year. The data summarized belowcover the years 1994 through 1997 and are meant to provide a basicunderstanding of the quantities of waste handled by the industry, the methodstypically used to manage this waste, and recent trends in these methods. TRIwaste management data can be used to assess trends in source reductionwithin individual industries and facilities, and for specific TRI chemicals. Thisinformation could then be used as a tool in identifying opportunities forpollution prevention compliance assistance activities.
While the quantities reported for 1994 and 1995 are estimates of quantitiesalready managed, the quantities reported for 1996 and 1997 are projectionsonly. The PPA requires these projections to encourage facilities to considerfuture waste generation and source reduction of those quantities as well asmovement up the waste management hierarchy. Future-year estimates are notcommitments that facilities reporting under TRI are required to meet.
Table 13 shows that the TRI reporting pharmaceutical facilities managedabout 382 million pounds of production related wastes (total quantity of TRIchemicals in the waste from routine production operations in Column B) in1995. From the yearly data presented in Column B, the total quantity ofproduction related wastes increased between 1994 and 1995. This is probablyin part because the number of chemicals on the TRI list almost doubledbetween those years. The quantity of wastes generated was also projected toincrease in 1996 and 1997. The effect of production increases on the amountof wastes generated has not been evaluated.
Values in Column C are intended to reveal the percentage of TRI chemicalsthat are either transferred off-site or released to the environment. Column Cis calculated by dividing the total TRI transfers and releases (reported inSections 5 and 6 of the TRI Form R) by the total quantity of production-related waste (reported in Section 8 of Form R). Column C shows a decreasein the portion either transferred off-site or released to the environment from50 percent in 1994 to 46 percent in 1995. The waste released to theenvironment or transferred off-site for disposal decreased slightly in 1995 toabout 10 percent of total wastes generated, as shown in Column J. Thisdecreasing trend is projected to continue through 1997.
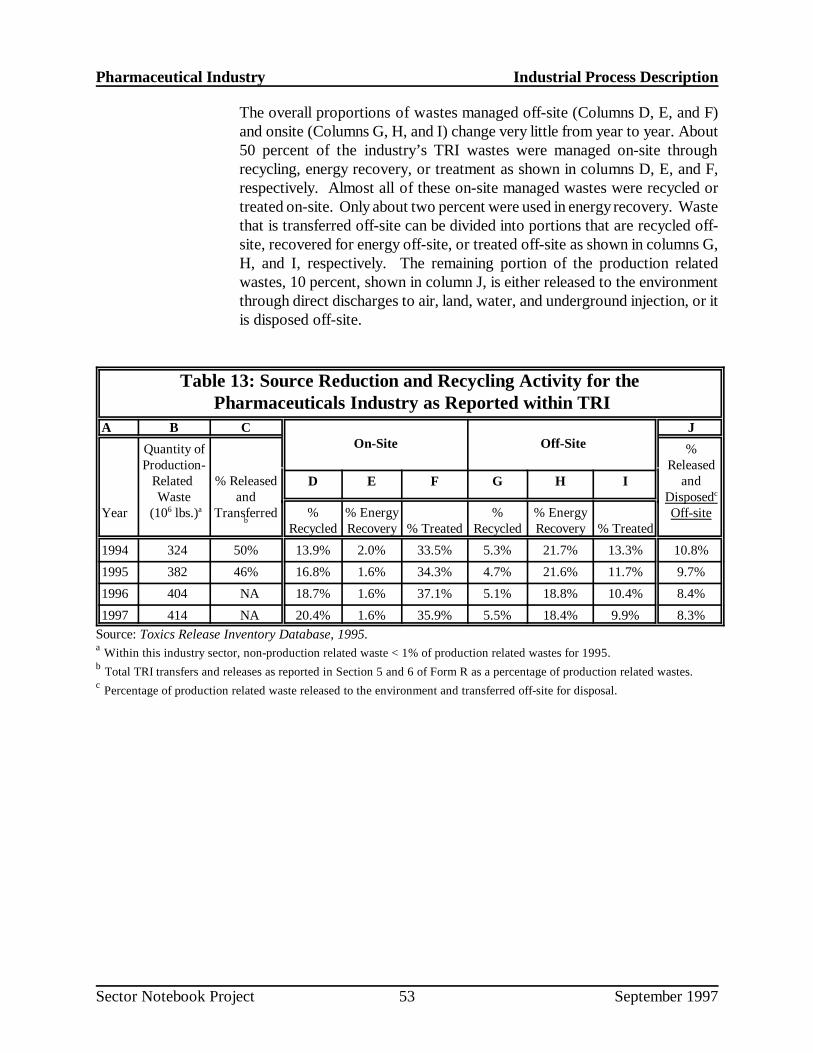
Pharmaceutical Industry Industrial Process Description
Sector Notebook Project September 199753
The overall proportions of wastes managed off-site (Columns D, E, and F)and onsite (Columns G, H, and I) change very little from year to year. About50 percent of the industry’s TRI wastes were managed on-site throughrecycling, energy recovery, or treatment as shown in columns D, E, and F,respectively. Almost all of these on-site managed wastes were recycled ortreated on-site. Only about two percent were used in energy recovery. Wastethat is transferred off-site can be divided into portions that are recycled off-site, recovered for energy off-site, or treated off-site as shown in columns G,H, and I, respectively. The remaining portion of the production relatedwastes, 10 percent, shown in column J, is either released to the environmentthrough direct discharges to air, land, water, and underground injection, or itis disposed off-site.
Table 13: Source Reduction and Recycling Activity for the Pharmaceuticals Industry as Reported within TRI
A B COn-Site Off-Site
J
Year
Quantity ofProduction-
Related Waste
(106 lbs.)a
% Releasedand
Transferredb
%Released
andDisposedc
Off-site
D E F G H I
%Recycled
% EnergyRecovery % Treated
%Recycled
% EnergyRecovery % Treated
1994 324 50% 13.9% 2.0% 33.5% 5.3% 21.7% 13.3% 10.8%
1995 382 46% 16.8% 1.6% 34.3% 4.7% 21.6% 11.7% 9.7%
1996 404 NA 18.7% 1.6% 37.1% 5.1% 18.8% 10.4% 8.4%
1997 414 NA 20.4% 1.6% 35.9% 5.5% 18.4% 9.9% 8.3%
Source: Toxics Release Inventory Database, 1995. a Within this industry sector, non-production related waste < 1% of production related wastes for 1995.b Total TRI transfers and releases as reported in Section 5 and 6 of Form R as a percentage of production related wastes.c Percentage of production related waste released to the environment and transferred off-site for disposal.

Pharmaceutical Industry Industrial Process Description
Sector Notebook Project September 199754

Pharmaceutical Industry Releases and Transfers Profile
Sector Notebook Project September 199755
IV. CHEMICAL RELEASE AND TRANSFER PROFILE
This section is designed to provide background information on the pollutantreleases that are reported by this industry. The best source of comparativepollutant release information is the Toxic Release Inventory (TRI). Pursuantto the Emergency Planning and Community Right-to-Know Act, TRI includesself-reported facility release and transfer data for over 600 toxic chemicals.Facilities within SIC Codes 20 through 39 (manufacturing industries) thathave more than 10 employees, and that are above weight-based reportingthresholds are required to report TRI on-site releases and off-site transfers.The information presented within the sector notebooks is derived from themost recently available (1995) TRI reporting year (which includes over 600chemicals), and focuses primarily on the on-site releases reported by eachsector. Because TRI requires consistent reporting regardless of sector, it isan excellent tool for drawing comparisons across industries. TRI data providethe type, amount and media receptor of each chemical released or transferred.
Although this sector notebook does not present historical informationregarding TRI chemical releases over time, please note that in general, toxicchemical releases have been declining. In fact, according to the 1995 ToxicRelease Inventory Public Data Release, reported onsite releases of toxicchemicals to the environment decreased by 5 percent (85.4 million pounds)between 1994 and 1995 (not including chemicals added and removed from theTRI chemical list during this period). Reported releases dropped by 46percent between 1988 and 1995. Reported transfers of TRI chemicals to off-site locations increased by 0.4 percent (11.6 million pounds) between 1994and 1995. More detailed information can be obtained from EPA's annualToxics Release Inventory Public Data Release book (which is availablethrough the EPCRA Hotline at 800-535-0202), or directly from the ToxicRelease Inventory System database (for user support call 202-260-1531).
Wherever possible, the sector notebooks present TRI data as the primaryindicator of chemical release within each industrial category. TRI dataprovide the type, amount and media receptor of each chemical released ortransferred. When other sources of pollutant release data have been obtained,these data have been included to augment the TRI information.
TRI Data Limitations
Certain limitations exist regarding TRI data. Release and transfer reportingare limited to the approximately 600 chemicals on the TRI list. Therefore, alarge portion of the emissions from industrial facilities are not captured byTRI. Within some sectors, (e.g. dry cleaning, printing and transportationequipment cleaning) the majority of facilities are not subject to TRI reportingbecause they are not considered manufacturing industries, or because they arebelow TRI reporting thresholds. For these sectors, release information from

Pharmaceutical Industry Releases and Transfers Profile
Sector Notebook Project September 199756
other sources has been included. In addition, many facilities report more thanone SIC code reflecting the multiple operations carried out onsite. Therefore,reported releases and transfers may or may not all be associated with theindustrial operations described in this notebook.
The reader should also be aware that TRI "pounds released" data presentedwithin the notebooks is not equivalent to a "risk" ranking for each industry.Weighting each pound of release equally does not factor in the relativetoxicity of each chemical that is released. The Agency is in the process ofdeveloping an approach to assign toxicological weights to each chemicalreleased so that one can differentiate between pollutants with significantdifferences in toxicity. As a preliminary indicator of the environmental impactof the industry's most commonly released chemicals, the notebook brieflysummarizes the toxicological properties of the top five chemicals (by weight)reported by each industry.
Definitions Associated with Section IV Data Tables
General Definitions
SIC Code -- the Standard Industrial Classification (SIC) is a statisticalclassification standard used for all establishment-based Federal economicstatistics. The SIC codes facilitate comparisons between facility and industrydata.
TRI Facilities -- are manufacturing facilities that have 10 or more full-timeemployees and are above established chemical throughput thresholds.Manufacturing facilities are defined as facilities in Standard IndustrialClassification primary codes 20-39. Facilities must submit estimates for allchemicals that are on the TRI list and are above throughput thresholds.
Data Table Column Heading Definitions
The following definitions are based upon standard definitions developed byEPA’s Toxic Release Inventory Program. The categories below represent thepossible pollutant destinations that can be reported.
RELEASES -- are an on-site discharge of a toxic chemical to theenvironment. This includes emissions to the air, discharges to bodies ofwater, releases at the facility to land, as well as contained disposal intounderground injection wells.
Releases to Air (Point and Fugitive Air Emissions) -- Include all airemissions from industry activity. Point emissions occur through confined airstreams as found in stacks, vents, ducts, or pipes. Fugitive emissions include

Pharmaceutical Industry Releases and Transfers Profile
Sector Notebook Project September 199757
equipment leaks, evaporative losses from surface impoundments and spills,and releases from building ventilation systems.
Releases to Water (Surface Water Discharges) -- encompass any releasesgoing directly to streams, rivers, lakes, oceans, or other bodies of water.Releases due to runoff, including storm water runoff, are also reportable toTRI.
Releases to Land -- occur within the boundaries of the reporting facility.Releases to land include disposal of toxic chemicals in landfills, landtreatment/application farming, surface impoundments, and other land disposalmethods (such as spills, leaks, or waste piles).
Underground Injection -- is a contained release of a fluid into a subsurfacewell for the purpose of waste disposal. Wastes containing TRI chemicals areinjected into either Class I wells or Class V wells. Class I wells are used toinject liquid hazardous wastes or dispose of industrial and municipalwastewaters beneath the lowermost underground source of drinking water.Class V wells are generally used to inject non-hazardous fluid into or abovean underground source of drinking water. TRI reporting does not currentlydistinguish between these two types of wells, although there are importantdifferences in environmental impact between these two methods of injection.
TRANSFERS -- is a transfer of toxic chemicals in wastes to a facility that isgeographically or physically separate from the facility reporting under TRI.Chemicals reported to TRI as transferred are sent to off-site facilities for thepurpose of recycling, energy recovery, treatment, or disposal. The quantitiesreported represent a movement of the chemical away from the reportingfacility. Except for off-site transfers for disposal, the reported quantities donot necessarily represent entry of the chemical into the environment.
Transfers to POTWs -- are wastewater transferred through pipes or sewersto a publicly owned treatments works (POTW). Treatment or removal of achemical from the wastewater depend on the nature of the chemical, as wellas the treatment methods present at the POTW. Not all TRI chemicals canbe treated or removed by a POTW. Some chemicals, such as metals, may beremoved, but are not destroyed and may be disposed of in landfills ordischarged to receiving waters.
Transfers to Recycling -- are sent off-site for the purposes of regeneratingor recovery by a variety of recycling methods, including solvent recovery,metals recovery, and acid regeneration. Once these chemicals have beenrecycled, they may be returned to the originating facility or sold commercially.

Pharmaceutical Industry Releases and Transfers Profile
Sector Notebook Project September 199758
Transfers to Energy Recovery -- are wastes combusted off-site in industrialfurnaces for energy recovery. Treatment of a chemical by incineration is notconsidered to be energy recovery.
Transfers to Treatment -- are wastes moved off-site to be treated througha variety of methods, including neutralization, incineration, biologicaldestruction, or physical separation. In some cases, the chemicals are notdestroyed but prepared for further waste management.
Transfers to Disposal -- are wastes taken to another facility for disposalgenerally as a release to land or as an injection underground.

Pharmaceutical Industry Releases and Transfers Profile
Sector Notebook Project September 199759
IV.A. EPA Toxic Release Inventory for the Pharmaceutical Industry
This section summarizes TRI data of pharmaceutical facilities reporting SICcodes 2833 and 2834 as the primary SIC code for the facility. Of the 916pharmaceutical establishments reported by the 1992 Census ofManufacturers, 200 reported to TRI in 1995.
According to 1995 TRI data, the reporting facilities released (discharged tothe air, water, or land without treatment) and transferred (shipped off-site) atotal of 177 million pounds of pollutants, made up of 104 different chemicals.This represents about 3 percent of the 5.7 billion pounds of TRI chemicalsreleased and transferred by all manufacturers that year. In comparison, thechemical industry (SIC 28) as a whole produced 1.7 billion pounds that year,accounting for about 30 percent of all releases and transfers.
Of the pharmaceutical industry’s TRI releases, 57 percent go to the air, 25percent to underground injection, 17 percent to surface waters, and 1 percentto the land. This release profile differs from other TRI industries whichaverage approximately 59 percent to air, 30 percent to water, and 10 percentto land. Table 14 lists the pharmaceutical industry’s TRI reported chemicalreleases.
Of the pharmaceutical industry’s transfers, about 55 percent are transferredfor energy recovery off-site, 19 percent for treatment off-site, 13 percent aretransferred to POTWs, 12 percent for recycling off-site, and about 1 percentfor disposal off-site. Table 15 lists the pharmaceutical industry's TRI reportedtoxic chemical transfers.
Of the top ten most frequently reported toxic chemicals on the TRI list, theprevalence of volatile chemicals explains the air intensive toxic chemicalloading of the pharmaceutical industry. Seven of the ten most commonlyreported toxic chemicals are highly volatile. Six of the ten are volatile organiccompounds (methanol, dichloromethane, toluene, ethylene glycol, N,N-Dimethylformamide, and acetonitrile). These are primarily solvents used toextract active ingredients and for cleaning equipment. The primary means ofrelease to the environment are from fugitive air and point air sources. Largequantities of methanol, N,N-Dimethylformamide, and acetonitrile, however,are released via underground injection. Other commonly reported chemicalsreleased and transferred are acids (hydrochloric, sulfuric, and phosphoric)which can be used for pH control or as catalysts.

Pharm
aceutical IndustryR
eleases and Transfers P
rofile
Secto
r No
teboo
k Pro
jectS
eptember 1997
60
Table 14: 1995 Releases for Pharmaceutical Facilities (SIC 2833 & 2834) in TRI,by Number of Facilities Reporting(Releases reported in pounds/year)
%*'/+%#. 0#/' � 4'2146+0)
%*'/+%#.
(7)+6+8'
#+4
21+06
#+4
9#6'4
&+5%*#4)'5
70&'4)4170&
+0,'%6+10
.#0&
&+5215#.
616#.
4'.'#5'5
#8)�
4'.'#5'5
2'4 (#%+.+6;
/'6*#01. ��� ��������� ��������� ������� ��������� ����� ���������� ������
&+%*.141/'6*#0' �� ��������� ��������� ������ ������ � ��������� �������
*;&41%*.14+% #%+&
���� #0& #(6'4 �#%+& #'4151.5� 10.;� �� ������ ������� �� � � ������� �����
61.7'0' �� ������� ������� ������ ����� � ��������� ������
#//10+# �� ������� ������� ��������� � ������� ��������� ������
2*152*14+% #%+& �� ����� ����� �� � � ������ ���
'6*;.'0' ).;%1. �� ������ ����� ������ � ��� ������ �����
#%'610+64+.' �� ������� ������� ����� ������� � ������� ������
0�0�&+/'6*;.(14/#/+&' �� ������ ������ ������ ��������� ����� ��������� ������
%*.14+0' �� ����� ����� ������ � � ������ �����
0�*':#0' �� ������� ������� ����� ����� � ������� ������
64+'6*;.#/+0' �� ������ ������ ������ ����� � ������ �����
<+0% %1/2170&5 �� ��� ������ ������ ������� ������� ������� ������
%*.141(14/ �� ������ ������ ����� � � ������� ������
0�$76;. #.%1*1. �� ������� ������� ��� ����� � ������� ������
/'6*;. +51$76;. -'610' �� ������� ������� ������ ����� � ������� ������
:;.'0' /+:'& +51/'45� �� ������ ������� � � � ������� �����
(14/+% #%+& �� ������ ����� ����� ����� � ������ �����
0+64+% #%+& �� ����� ������ �� � � ������ �����
/'6*;. 6'46�$76;. '6*'4 �� ����� ������ � ������ � ������ �����
57.(74+% #%+& �� ������ ����� � � � ������ �����
0+64#6' %1/2170&5 �� � � ��������� � ������ ��������� �������
(14/#.&'*;&' � ����� ����� ����� � � ����� ���
%;%.1*':#0' � ������ ������� ��� ������ � ������� ������
&+%*.141&+(.7141/'6*#0' � ������ ������� � � � ������� ������
%'46#+0 ).;%1. '6*'45 � ����� ������ � � � ������ �����
6'46�$76;. #.%1*1. � ������ ������ ����� ������ � ������ ������
/'6*;. '6*;. -'610' � ������ ������ �� ������ � ������� ������
0#2*6*#.'0' � ��� ����� � � � ����� ���
2;4+&+0' � ����� ����� � ������ � ������ �����
%122'4 %1/2170&5 � � �� � � � �� ��

Pharm
aceutical IndustryR
eleases and Transfers P
rofile
Secto
r No
teboo
k Pro
jectS
eptember 1997
61
Table 14, cont.: 1995 Releases for Pharmaceutical Facilities (SICs 2833 & 2934), in TRIby Number of Facilities Reporting(Releases reported in pounds/year)
%*'/+%#. 0#/'
� 4'2146+0)
%*'/+%#.
(7)+6+8'
#+4
21+06
#+4
9#6'4
&+5%*#4)'5
70&'4)4170&
+0,'%6+10
.#0&
&+5215#.
616#.
4'.'#5'5
#8)� 4'.'#5'5
2'4 (#%+.+6;
%122'4 %1/2170&5 � � �� � � � �� ��
%;#0+&' %1/2170&5 � ��� ��� ����� ����� � ����� �����
/#0)#0'5' %1/2170&5 � ��� ����� ������ � ��� ������ �����
%*.141/'6*#0' � ������ ������ ������ � � ������� ������
64+%*.141(.7141/'6*#0' � ������ ������ � � � ������� ������
&+��'6*;.*':;.� 2*6*#.#6' � ��� ��� � � � ��� ��
'6*;.$'0<'0' � ��� ��� � � � ����� ���
����&+%*.141'6*#0' � ��� ����� ��� ������ � ������ �����
��/'6*1:;'6*#01. � ����� ����� � � � ������ �����
$41/+0' � ��� ��� �� � � ����� ���
#45'0+% %1/2170&5 � � �� � � � �� �
0+%-'. %1/2170&5 � � �� ��� � �� ��� ���
%*.141&+(.7141/'6*#0' � ������ ������ � � � ������ ������
%*.141#%'6+% #%+& � �� � �� � � �� ��
$'0<1;. 2'41:+&' � � � � � � � �
51&+7/ 0+64+6' � � � ������ � � ������ �����
$#4+7/ %1/2170&5 � �� � ��� � � ��� ��
#0+.+0' � ����� ����� � � � ����� �����
$'0<'0' � ����� ��� � ��� � ����� �����
'6*;.'0' 1:+&' � ������ ����� � � � ������ �����
&+%*.1416'64#(.7141'6*#0' %(%����� � ����� ����� � � � ����� �����
2'4#%'6+% #%+& � ��� � � � � ��� ��
*;&4#<+0' � ��� �� � � � ��� ���
1<10' � ��� ��� � � � ��� ���
6'64#%;%.+0' *;&41%*.14+&' � � ��� � � � ��� ���
+512412;. #.%1*1. /#07(#%674+0)�
56410)�#%+& 241%'55 10.;� 01 5722.+' � ������ ������� � � � ������� �������
/'6*;. +1&+&' � ����� ��� � � � ����� ���
2412;.'0' 1:+&' � ��� ����� � � � ����� ���
(4'10 ��� � ����� ������ � � � ������ ������
#%4;.+% #%+& � �� �� � � � �� ��
2*6*#.+% #0*;&4+&' � � � � � � � �

Pharm
aceutical IndustryR
eleases and Transfers P
rofile
Secto
r No
teboo
k Pro
jectS
eptember 1997
62
Table 14, cont.: 1995 Releases for Pharmaceutical Facilities (SICs 2833 & 2934) in TRI,by Number of Facilities Reporting(Releases reported in pounds/year)
CHEMICAL NAME# REPORTING
CHEMICALFUGITIVE
AIRPOINT
AIRWATER
DISCHARGESUNDERGROUND
INJECTIONLAND
DISPOSALTOTAL
RELEASESAVG. RELEASES
PER FACILITYBENZOYL CHLORIDE 2 0 2 0 0 0 2 1BENZYL CHLORIDE 2 5 5 0 0 0 10 5EPICHLOROHYDRIN 2 290 50 0 0 0 340 170M-XYLENE 2 1,565 571 250 0 0 2,386 1,193PHENOL 2 255 255 0 0 0 510 255DIETHANOLAMINE 2 500 1,000 5 0 0 1,505 7531,4-DIOXANE 2 270 260 0 0 0 530 265DIMETHYLAMINE 2 23,500 15,250 250 0 250 39,250 19,625TETRACHLOROETHYLENE 2 2,239 14,000 0 0 0 16,239 8,120DIAZINON 2 5 278 5 0 0 288 144ZINC (FUME OR DUST) 2 0 2 0 0 0 2 1TITANIUM TETRACHLORIDE 2 5 10 0 0 0 15 8HYDROGEN FLUORIDE 2 250 8,350 0 0 0 8,600 4,300ABAMECTIN 2 0 0 16 0 0 16 8ANTIMONY COMPOUNDS 1 5 5 0 0 0 10 10CHROMIUM COMPOUNDS 1 0 0 0 43,000 0 43,000 43,000COBALT COMPOUNDS 1 0 0 0 0 0 0 0SELENIUM COMPOUNDS 1 0 3 0 0 0 3 3FAMPHUR 1 0 0 0 0 0 0 0CARBON TETRACHLORIDE 1 60 400 67 0 0 527 527PHENYTOIN 1 0 0 0 0 0 0 0DICHLORVOS 1 5 250 5 0 0 260 2601,1,1-TRICHLOROETHANE 1 76,500 52,500 0 0 0 129,000 129,000BROMOMETHANE 1 50 21 0 0 0 71 71CHLOROETHANE 1 163 0 0 0 0 163 163CARBON DISULFIDE 1 2,450 21,000 0 0 0 23,450 23,450PHOSGENE 1 240 5 0 5 0 250 250DIMETHYL SULFATE 1 0 8 0 0 0 8 8ISOBUTYRALDEHYDE 1 11 25 0 0 0 36 36SEC-BUTYL ALCOHOL 1 250 71,799 0 0 0 72,049 72,049METHYL CHLOROCARBONATE 1 250 0 5 0 5 260 260QUINOLINE 1 5 0 5 0 5 15 15

Pharm
aceutical IndustryR
eleases and Transfers P
rofile
Secto
r No
teboo
k Pro
jectS
eptember 1997
63
Table 14, cont.: 1995 Releases for Pharmaceutical Facilities (SICs 2833 & 2934) in TRI, by Number of Facilities Reporting(Releases reported in pounds/year)
CHEMICAL NAME# REPORTING
CHEMICALFUGITIVE
AIRPOINT
AIRWATER
DISCHARGESUNDERGROUND
INJECTIONLAND
DISPOSALTOTAL
RELEASESAVG. RELEASES
PER FACILITYBIPHENYL 1 5 0 0 0 0 5 5O-XYLENE 1 2,400 54 0 0 0 2,454 2,4541,2-DICHLOROBENZENE 1 244 2,490 0 0 0 2,734 2,7341,2,4-TRIMETHYLBENZENE 1 250 250 5 0 0 505 505CUMENE 1 250 250 5 0 0 505 505ACETOPHENONE 1 5 5 0 0 0 10 10NITROBENZENE 1 3,891 321 0 0 0 4,212 4,212ALLYL CHLORIDE 1 321 27 0 0 0 348 348CHLOROMETHYL METHYL ETHER 1 0 0 0 0 0 0 0MALEIC ANHYDRIDE 1 5 5 0 5 0 15 15CHLOROBENZENE 1 12 11 0 0 0 23 23CYCLOHEXANOL 1 93 133 0 0 0 226 2262-ETHOXYETHANOL 1 29 91 0 0 0 120 120PROPYLENE 1 5 5 0 0 0 10 10N,N-DIMETHYLANILINE 1 5 35 0 0 0 40 40MALATHION 1 0 2 0 0 0 2 2THIABENDAZOLE 1 175 3,504 0 0 0 3,679 3,679ETHYL CHLOROFORMATE 1 250 250 5 0 5 510 5101,3-DICHLOROBENZENE 1 1,200 80 0 0 0 1,280 1,280LITHIUM CARBONATE 1 0 0 0 0 0 0 0N-METHYL-2-PYRROLIDONE 1 7 0 0 0 0 7 7TETRACHLORVINPHOS 1 5 5 5 0 0 15 15TRIFLURALIN 1 6,900 250 0 0 0 7,150 7,150BENFLURALIN 1 750 250 0 0 0 1,000 1,000PROMETRYN 1 0 0 0 0 0 0 0NICKEL 1 0 0 250 0 0 250 250THIOPHANATE-METHYL 1 0 187 0 0 0 187 187SODIUM AZIDE 1 0 0 0 0 0 0 0VINCLOZOLIN 1 0 0 0 0 0 0 0PERMETHRIN 1 0 0 0 0 0 0 0PROPICONAZOLE 1 0 0 0 0 0 0 0
____ _________ _________ ________ ________ _______ ________ _________200 6,664,939 10,500,358 4,936,137 7,438,370 375,274 29,915,078 149,575

Pharm
aceutical IndustryR
eleases and Transfers P
rofile
Secto
r No
teboo
k Pro
jectS
eptember 1997
64
Table 15: 1995 Transfers for Pharmaceutical Facilities (SICs 2833 & 2834) in TRI, by Number and Facilities Reporting(Transfers reported in pounds/year)
%*'/+%#. 0#/'
�
4'2146+0)
%*'/+%#.
2169
64#05('45
&+5215#.
64#05('45
4'%;%.+0)
64#05('45
64'#6/'06
64#05('45
'0'4);
4'%18'4;
64#05('45
616#.
64#05('45
#8)
64#05('4
2'4
(#%+.+6;
/'6*#01. ��� ���������� ������ ��������� ��������� ���������� ���������� �������
&+%*.141/'6*#0' �� ������� ������ ��������� ��������� ��������� ���������� �������
*;&41%*.14+% #%+&
���� #0& #(6'4 �#%+& #'4151.5� 10.;� �� ����� � �� ������ �� ������ ���
61.7'0' �� ������� ����� ��������� ��������� ���������� ���������� �������
#//10+# �� ��������� ����� � ������� ����� ��������� ������
2*152*14+% #%+& �� ����� � � �� � ����� ���
'6*;.'0' ).;%1. �� ������� ����� ������� ������ ������ ��������� ������
#%'610+64+.' �� ������ � ��������� ��������� ��������� ��������� �������
0�0�&+/'6*;.(14/#/+&' �� ������� ������� ������� ������� ��������� ��������� �������
%*.14+0' �� � � � � � � �
0�*':#0' �� ������ ����� ������� ��������� ��������� ��������� �������
64+'6*;.#/+0' �� ������� �� ����� ������� ������� ������� ������
<+0% %1/2170&5 �� ����� ������� � ������ ����� ������� ������
%*.141(14/ �� ������� ��� ������ ������� ������ ������� ������
0�$76;. #.%1*1. �� ������� � � ������� ������� ��������� �������
/'6*;. +51$76;. -'610' �� ������� � ����� ������� ��������� ��������� �������
:;.'0' /+:'& +51/'45� �� ����� � ��� ����� ��������� ��������� �������
(14/+% #%+& �� ������ � � ������ �� ������� �����
0+64+% #%+& �� � � ������� ��� � ������� ������
/'6*;. 6'46�$76;. '6*'4 �� ������ � � ������� ��������� ��������� �������
57.(74+% #%+& �� � � � � � � �
0+64#6' %1/2170&5 �� ������� � � ��� � ������� ������
(14/#.&'*;&' � ������� ����� � ��� � ������� ������
%;%.1*':#0' � ��� ��� ��� ������ ������� ������� ������
&+%*.141&+(.7141/'6*#0' � � � ������ ������� � ������� ������
%'46#+0 ).;%1. '6*'45 � ������� � � �� ������� ������� ������
6'46�$76;. #.%1*1. � ����� ����� � ��� ������� ������� ������
/'6*;. '6*;. -'610' � ����� � ��� ����� ������� ������� ������
0#2*6*#.'0' � � � � �� ��� ��� ��
2;4+&+0' � ������� � ������ ����� ������ ������� ������
%122'4 %1/2170&5 � ��� ����� � ����� � ������ �����
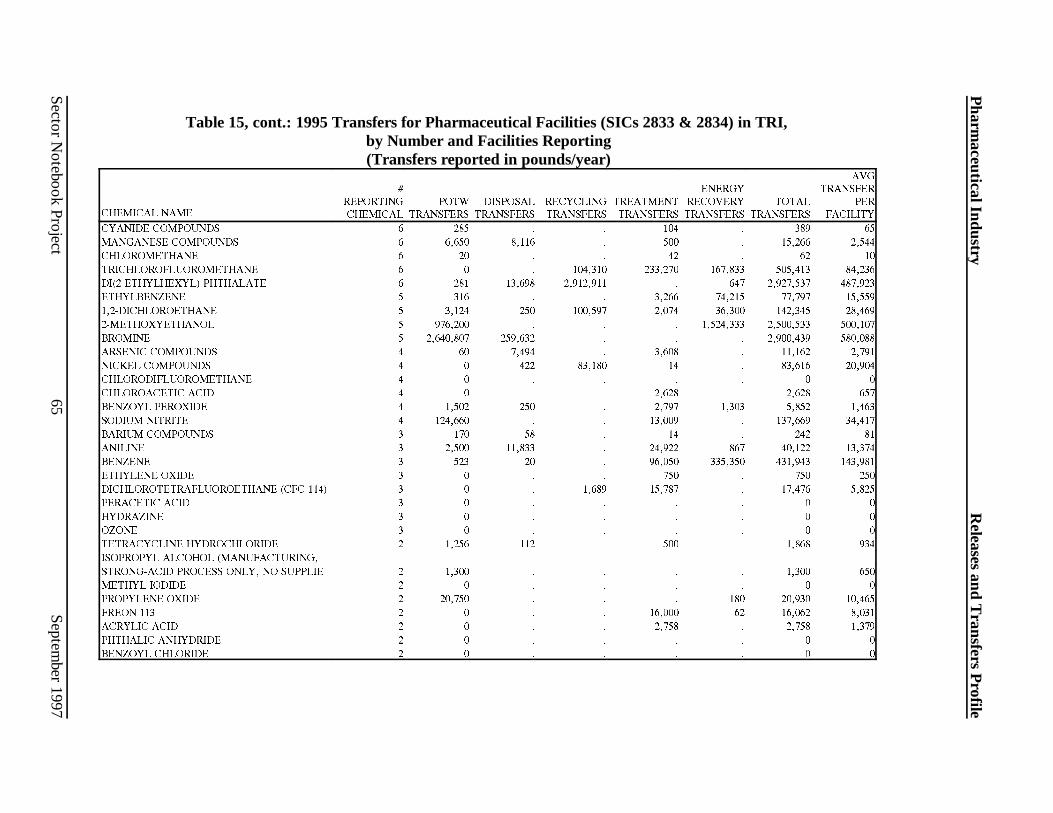
Pharm
aceutical IndustryR
eleases and Transfers P
rofile
Secto
r No
teboo
k Pro
jectS
eptember 1997
65
Table 15, cont.: 1995 Transfers for Pharmaceutical Facilities (SICs 2833 & 2834) in TRI, by Number and Facilities Reporting(Transfers reported in pounds/year)
%*'/+%#. 0#/'
�
4'2146+0)
%*'/+%#.
2169
64#05('45
&+5215#.
64#05('45
4'%;%.+0)
64#05('45
64'#6/'06
64#05('45
'0'4);
4'%18'4;
64#05('45
616#.
64#05('45
#8)
64#05('4
2'4
(#%+.+6;
%;#0+&' %1/2170&5 � ��� � � ��� � ��� ��
/#0)#0'5' %1/2170&5 � ����� ����� � ��� � ������ �����
%*.141/'6*#0' � �� � � �� � �� ��
64+%*.141(.7141/'6*#0' � � � ������� ������� ������� ������� ������
&+��'6*;.*':;.� 2*6*#.#6' � ��� ������ ��������� � ��� ��������� �������
'6*;.$'0<'0' � ��� � � ����� ������ ������ ������
����&+%*.141'6*#0' � ����� ��� ������� ����� ������ ������� ������
��/'6*1:;'6*#01. � ������� � � � ��������� ��������� �������
$41/+0' � ��������� ������� � � � ��������� �������
#45'0+% %1/2170&5 � �� ����� � ����� � ������ �����
0+%-'. %1/2170&5 � � ��� ������ �� � ������ ������
%*.141&+(.7141/'6*#0' � � � � � � � �
%*.141#%'6+% #%+& � � � � ����� � ����� ���
$'0<1;. 2'41:+&' � ����� ��� � ����� ����� ����� �����
51&+7/ 0+64+6' � ������� � � ������ � ������� ������
$#4+7/ %1/2170&5 � ��� �� � �� � ��� ��
#0+.+0' � ����� ������ � ������ ��� ������ ������
$'0<'0' � ��� �� � ������ ������� ������� �������
'6*;.'0' 1:+&' � � � � ��� � ��� ���
&+%*.1416'64#(.7141'6*#0' %(%����� � � � ����� ������ � ������ �����
2'4#%'6+% #%+& � � � � � � � �
*;&4#<+0' � � � � � � � �
1<10' � � � � � � � �
6'64#%;%.+0' *;&41%*.14+&' � ����� ��� � ��� � ����� ���
+512412;. #.%1*1. /#07(#%674+0)�
56410)�#%+& 241%'55 10.;� 01 5722.+' � ����� � � � � ����� ���
/'6*;. +1&+&' � � � � � � � �
2412;.'0' 1:+&' � ������ � � � ��� ������ ������
(4'10 ��� � � � � ������ �� ������ �����
#%4;.+% #%+& � � � � ����� � ����� �����
2*6*#.+% #0*;&4+&' � � � � � � � �
$'0<1;. %*.14+&' � � � � � � � �

Pharm
aceutical IndustryR
eleases and Transfers P
rofile
Secto
r No
teboo
k Pro
jectS
eptember 1997
66
Table 15, cont.: 1995 Transfers for Pharmaceutical Facilities (SICs 2833 & 2834) in TRI, by Number and Facilities Reporting(Transfers reported in pounds/year)
CHEMICAL NAME
#REPORTINGCHEMICAL
POTWTRANSFERS
DISPOSALTRANSFERS
RECYCLINGTRANSFERS
TREATMENTTRANSFERS
ENERGYRECOVERYTRANSFERS
TOTALTRANSFERS
AVGTRANSFER
PERFACILITY
BENZYL CHLORIDE 2 5 . . 10 . 15 8EPICHLOROHYDRIN 2 0 0 . . . 0 0M-XYLENE 2 20 . . 87,148 78,059 165,227 82,614PHENOL 2 250 . . 548 . 798 399DIETHANOLAMINE 2 1,500 . . . 47,916 49,416 24,7081,4-DIOXANE 2 4,170 2 . 300 8,960 13,432 6,716DIMETHYLAMINE 2 0 38,000 . 2,100 . 40,100 20,050TETRACHLOROETHYLENE 2 0 . 510 . 49,005 49,515 24,758DIAZINON 2 0 1,060 . 1,609 . 2,669 1,335ZINC (FUME OR DUST) 2 0 1,223 . . . 1,223 612TITANIUM TETRACHLORIDE 2 0 . . . . 0 0HYDROGEN FLUORIDE 2 0 . . . . 0 0ABAMECTIN 2 0 . . 5,582 . 5,582 2,791ANTIMONY COMPOUNDS 1 0 53,200 . . . 53,200 53,200CHROMIUM COMPOUNDS 1 250 260 . 5 . 515 515COBALT COMPOUNDS 1 2,920 . . . . 2,920 2,920SELENIUM COMPOUNDS 1 260 . . 13,641 . 13,901 13,901FAMPHUR 1 0 . . 1,540 . 1,540 1,540CARBON TETRACHLORIDE 1 40 . . 45,782 . 45,822 45,822PHENYTOIN 1 0 19,300 . . . 19,300 19,300DICHLORVOS 1 0 250 . 250 . 500 5001,1,1-TRICHLOROETHANE 1 0 . 106,250 . . 106,250 106,250BROMOMETHANE 1 0 . . . . 0 0CHLOROETHANE 1 0 . . 2,489 . 2,489 2,489CARBON DISULFIDE 1 1,120 . . 18 11,390 12,528 12,528PHOSGENE 1 0 . . . . 0 0DIMETHYL SULFATE 1 0 . . . . 0 0ISOBUTYRALDEHYDE 1 0 . 8,647 640 . 9,287 9,287SEC-BUTYL ALCOHOL 1 0 . . . . 0 0METHYL CHLOROCARBONATE 1 0 . . . . 0 0QUINOLINE 1 0 . . 250 . 250 250

Pharm
aceutical IndustryR
eleases and Transfers P
rofile
Secto
r No
teboo
k Pro
jectS
eptember 1997
67
Table 15, cont.: 1995 Transfers for Pharmaceutical Facilities (SICs 2833 & 2834) in TRI, by Number and Facilities Reporting(Transfers reported in pounds/year)
CHEMICAL NAME
#REPORTINGCHEMICAL
POTWTRANSFERS
DISPOSALTRANSFERS
RECYCLINGTRANSFERS
TREATMENTTRANSFERS
ENERGYRECOVERYTRANSFERS
TOTALTRANSFERS
AVGTRANSFER
PERFACILITY
BIPHENYL 1 0 . . . . 0 0O-XYLENE 1 0 . . 100,000 61,800 161,800 161,8001,2-DICHLOROBENZENE 1 6,480 . . 14,000 91,891 112,371 112,3711,2,4-TRIMETHYLBENZENE 1 4,800 . . . . 4,800 4,800CUMENE 1 1,167 . . . . 1,167 1,167ACETOPHENONE 1 0 . . . . 0 0NITROBENZENE 1 5 . . 5,914 . 5,919 5,919ALLYL CHLORIDE 1 0 . . . . 0 0CHLOROMETHYL METHYL ETHER 1 0 . . . . 0 0MALEIC ANHYDRIDE 1 0 . . . . 0 0CHLOROBENZENE 1 0 . . . 179,228 179,228 179,228CYCLOHEXANOL 1 0 . . . . 0 02-ETHOXYETHANOL 1 4 . . 25,004 . 25,008 25,008PROPYLENE 1 0 . . . . 0 0N,N-DIMETHYLANILINE 1 10,000 . . . 328,000 338,000 338,000MALATHION 1 0 26 . 273 . 299 299THIABENDAZOLE 1 271 . . . 2,160 2,431 2,431ETHYL CHLOROFORMATE 1 0 . . . . 0 01,3-DICHLOROBENZENE 1 1,400 . . . . 1,400 1,400LITHIUM CARBONATE 1 0 . . 750 . 750 750N-METHYL-2-PYRROLIDONE 1 249,000 . . . . 249,000 249,000TETRACHLORVINPHOS 1 0 4,200 . . . 4,200 4,200TRIFLURALIN 1 0 18,000 . . . 18,000 18,000BENFLURALIN 1 0 14,000 . . . 14,000 14,000PROMETRYN 1 0 . . 203 . 203 203NICKEL 1 0 18 400,000 . . 400,018 400,018THIOPHANATE-METHYL 1 0 . . 2,677 . 2,677 2,677SODIUM AZIDE 1 0 . . . . 0 0VINCLOZOLIN 1 0 . . 1,030 . 1,030 1,030PERMETHRIN 1 0 . . . . 0 0PROPICONAZOLE 1 0 . . 1,025 . 1,025 1,025
____ _________ _________ _________ _________ _________ __________AAAAAAAAAA
200 19,119,179 1,394,801 18,168,783 27,330,633 81,213,752 147,239,047 736,195
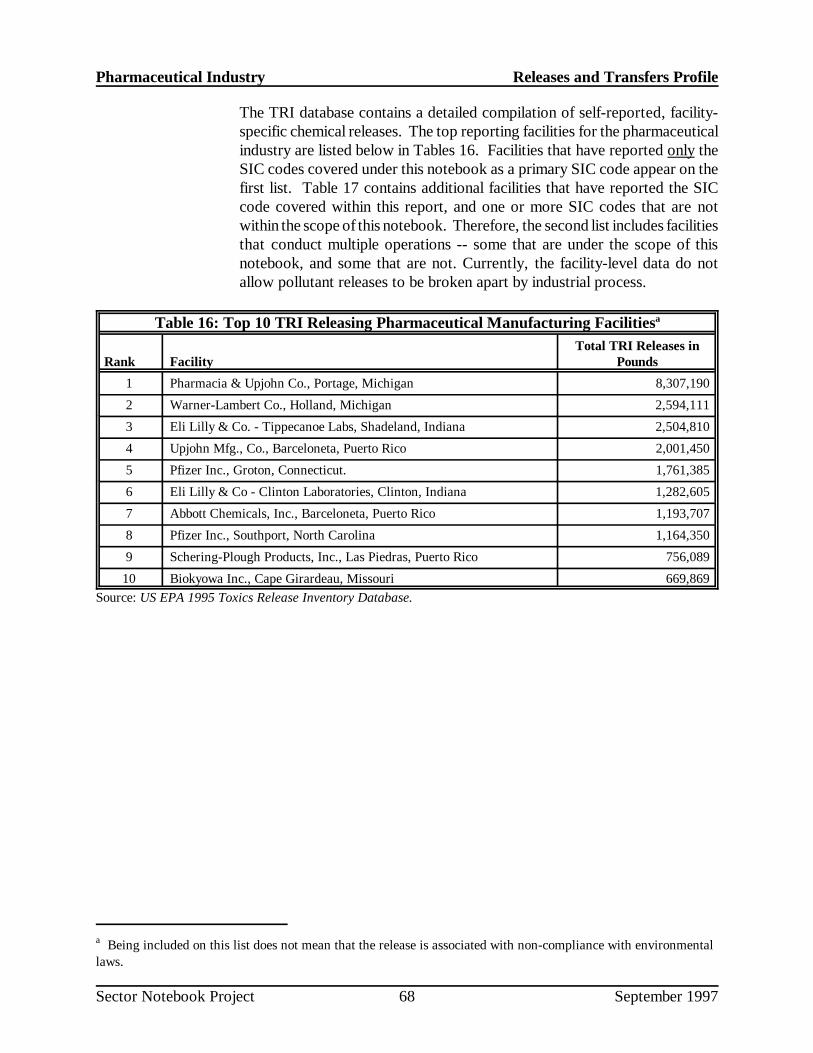
Pharmaceutical Industry Releases and Transfers Profile
a Being included on this list does not mean that the release is associated with non-compliance with environmentallaws.
Sector Notebook Project September 199768
The TRI database contains a detailed compilation of self-reported, facility-specific chemical releases. The top reporting facilities for the pharmaceuticalindustry are listed below in Tables 16. Facilities that have reported only theSIC codes covered under this notebook as a primary SIC code appear on thefirst list. Table 17 contains additional facilities that have reported the SICcode covered within this report, and one or more SIC codes that are notwithin the scope of this notebook. Therefore, the second list includes facilitiesthat conduct multiple operations -- some that are under the scope of thisnotebook, and some that are not. Currently, the facility-level data do notallow pollutant releases to be broken apart by industrial process.
Table 16: Top 10 TRI Releasing Pharmaceutical Manufacturing Facilitiesa
Rank FacilityTotal TRI Releases in
Pounds
1 Pharmacia & Upjohn Co., Portage, Michigan 8,307,190
2 Warner-Lambert Co., Holland, Michigan 2,594,111
3 Eli Lilly & Co. - Tippecanoe Labs, Shadeland, Indiana 2,504,810
4 Upjohn Mfg., Co., Barceloneta, Puerto Rico 2,001,450
5 Pfizer Inc., Groton, Connecticut. 1,761,385
6 Eli Lilly & Co - Clinton Laboratories, Clinton, Indiana 1,282,605
7 Abbott Chemicals, Inc., Barceloneta, Puerto Rico 1,193,707
8 Pfizer Inc., Southport, North Carolina 1,164,350
9 Schering-Plough Products, Inc., Las Piedras, Puerto Rico 756,089
10 Biokyowa Inc., Cape Girardeau, Missouri 669,869
Source: US EPA 1995 Toxics Release Inventory Database.

Pharmaceutical Industry Releases and Transfers Profile
a Being included on this list does not mean that the release is associated with non-compliance with environmentallaws.
Sector Notebook Project September 199769
Table 17: Top 10 TRI Releasing Facilities Reporting Pharmaceutical Manufacturing SICCodes to TRIa
RankSIC Codes
Reported in TRI FacilityTotal TRI Releases in
Pounds
1 2834 Pharmacia & Upjohn Co., Portage, Michigan 8,307,190
2 2819, 2834, 2842,2865, 2869, 2873,2879
Monsanto Co., Luling, Louisiana 5,698,031
3 2834 Warner-Lambert Co., Holland, Michigan 2,594,111
4 2834 Eli Lilly & Co. - Tippecanoe Labs, Shadeland,Indiana
2,504,810
5 2834 Upjohn Mfg., Co., Barceloneta, Puerto Rico 2,001,450
6 2833 Pfizer Inc., Groton, Connecticut. 1,761,385
7 2834, 2869, 2969 Ethyl Corp., Orangeburg, South Carolina 1,284,456
8 2833, 2834 Eli Lilly & Co - Clinton Laboratories, Clinton,Indiana
1,282,605
9 2819, 2821, 2824,2834, 2865, 2869,2879, 2979
Dow Chemical Co., Midland, Michigan 1,228,629
10 2833, 2834 Abbott Chemicals, Inc., Barceloneta, Puerto Rico 1,193,707
Source: US EPA Toxics Release Inventory Database, 1995.

Pharmaceutical Industry Releases and Transfers Profile
a TOXNET is a computer system run by the National Library of Medicine that includes a number of toxicologicaldatabases managed by EPA, National Cancer Institute, and the National Institute for Occupational Safety andHealth. For more information on TOXNET, contact the TOXNET help line at 800-231-3766. Databases includedin TOXNET are: CCRIS (Chemical Carcinogenesis Research Information System), DART (Developmental andReproductive Toxicity Database), DBIR (Directory of Biotechnology Information Resources), EMICBACK(Environmental Mutagen Information Center Backfile), GENE-TOX (Genetic Toxicology), HSDB (HazardousSubstances Data Bank), IRIS (Integrated Risk Information System), RTECS (Registry of Toxic Effects of ChemicalSubstances), and TRI (Toxic Chemical Release Inventory). HSDB contains chemical-specific information onmanufacturing and use, chemical and physical properties, safety and handling, toxicity and biomedical effects,pharmacology, environmental fate and exposure potential, exposure standards and regulations, monitoring andanalysis methods, and additional references.
Sector Notebook Project September 199770
IV.B. Summary of Selected Chemicals Released
The following is a synopsis of current scientific toxicity and fate informationfor the top chemicals (by weight) that facilities within both SIC 2833 and2834 self-reported as released to the environment based upon 1994 TRI data.Because this section is based upon self-reported release data, it does notattempt to provide information on management practices employed by thesector to reduce the release of these chemicals. Information regardingpollutant release reductions over time may be available from EPA’s TRI and33/50 programs, or directly from the industrial trade associations that arelisted in Section VIII of this document. Since these descriptions are cursory,please consult the sources referenced below for a more detailed descriptionof both the chemicals described in this section, and the chemicals that appearon the full list of TRI chemicals appearing in Section IV.A.
The brief descriptions provided below were taken from the HazardousSubstances Data Bank (HSDB) and the Integrated Risk Information System(IRIS). The discussions of toxicity describe the range of possible adversehealth effects that have been found to be associated with exposure to thesechemicals. These adverse effects may or may not occur at the levels releasedto the environment. Individuals interested in a more detailed picture of thechemical concentrations associated with these adverse effects should consulta toxicologist or the toxicity literature for the chemical to obtain moreinformation. The effects listed below must be taken in context of theseexposure assumptions that are more fully explained within the full chemicalprofiles in HSDB. For more information on TOXNETa , contact theTOXNET help line at 1-800-231-3766.
Methanol (CAS: 67-56-1)
Toxicity. Methanol is readily absorbed by the gastrointestinal tract and therespiratory tract, and is toxic to humans in moderate to high doses. In thebody, methanol is converted into formaldehyde and formic acid. Methanol isexcreted as formic acid. Observed toxic effects at high dose levels generally

Pharmaceutical Industry Releases and Transfers Profile
Sector Notebook Project September 199771
include central nervous system damage and blindness. Long-term exposureto high levels of methanol via inhalation cause liver and blood damage inanimals.
Ecologically, methanol is expected to have low toxicity to aquatic organisms.Concentrations lethal to half the organisms of a test population are expectedto exceed one mg methanol per liter water. Methanol is not likely to persistin water or to bioaccumulate in aquatic organisms.
Carcinogenicity. There is currently no evidence to suggest that methanol iscarcinogenic.
Environmental Fate. Liquid methanol is likely to evaporate when leftexposed. Methanol reacts in air to produce formaldehyde which contributesto the formation of air pollutants. In the atmosphere it can react with otheratmospheric chemicals or be washed out by rain. Methanol is readilydegraded by microorganisms in soils and surface waters.
Physical Properties. Methanol is a colorless, highly flammable liquid.Methanol is miscible in water and has a boiling point of 147 degrees F.
Methylene Chloride (Dichloromethane) (CAS: 75-09-2)
Toxicity. Short-term exposure to methylene chloride (MC) is associated withcentral nervous system effects, including headaches, giddiness, stupor,irritability, and numbness, and tingling in the limbs. More severe neurologicaleffects are reported from longer-term exposure, apparently due to increasedcarbon monoxide in the blood from the break down of MC. Contact with MCcauses irritation of the eyes, skin, and respiratory tract.
Occupational exposure to MC has also been linked to increased incidence ofspontaneous abortions in women. Acute damages to the eyes and upperrespiratory tract, unconsciousness, and death were reported in workersexposed to high concentrations of MC. Phosgene (a degradation product ofMC) poisoning has been reported to occur in several cases where MC wasused in the presence of an open fire.
Populations at special risk from exposure to MC include obese people (dueto accumulation of MC in fat), and people with impaired cardiovascularsystems.
Carcinogenity. MC is a probable human carcinogen via both inhalation andoral exposure, based on limited evidence in humans, and sufficient evidencein animals.

Pharmaceutical Industry Releases and Transfers Profile
a The reporting standards for ammonia were changed in 1995. Ammonium sulfate is deleted from the list andthreshold and release determinations for aqueous ammonia are limited to 10 percent of the total ammonia presentin solution. This change will reduce the amount of ammonia reported to TRI. Complete details of the revisionscan be found in 40 CFR Part 372.
Sector Notebook Project September 199772
Environmental Fate. When spilled on land, MC is rapidly lost from the soilsurface through volatilization. The remainder leaches through the subsoil intothe groundwater.
Biodegradation is possible in natural waters but will probably be very slowcompared with evaporation. Little is known about bioconcentration in aquaticorganisms or adsorption to sediments but these are not likely to be significantprocesses. Hydrolysis is not an important process under normalenvironmental conditions.
MC released into the atmosphere degrades via contact with other gases witha half-life of several months. A small fraction of the chemical diffuses to thestratosphere where it rapidly degrades through exposure to ultravioletradiation and contact with chlorine ions. Being a moderately solublechemical, MC is expected to partially return to earth in rain.
Physical Properties. Methylene chloride is a colorless liquid. It is soluble to2 percent in water and has a boiling point of 104 degrees F.
Ammoniaa (CAS: 7664-41-7)
Toxicity. Anhydrous ammonia is irritating to the skin, eyes, nose, throat, andupper respiratory system.
Ecologically, ammonia is a source of nitrogen (an essential element for aquaticplant growth), and may therefore contribute to eutrophication of standing orslow-moving surface water, particularly in nitrogen-limited waters such as theChesapeake Bay. In addition, aqueous ammonia is moderately toxic to aquaticorganisms.
Carcinogenicity. There is currently no evidence to suggest that ammonia iscarcinogenic.
Environmental Fate. Ammonia combines with sulfate ions in theatmosphere and is washed out by rainfall, resulting in rapid return of ammoniato the soil and surface waters.
Ammonia is a central compound in the environmental cycling of nitrogen.Ammonia in lakes, rivers, and streams is converted to nitrate.
Pharmaceutical Industry Releases and Transfers Profile
Sector Notebook Project September 199773
Physical Properties. Ammonia is a colorless gas at atmospheric pressure,but is shipped as a liquefied compressed gas. It is soluble to about 34 percentin water and has a boiling point of -28 degrees F. Ammonia It is corrosive andhas a pungent odor.
Toluene (CAS: 108-88-3)
Toxicity. Inhalation or ingestion of toluene can cause headaches, confusion,weakness, and memory loss. Toluene may also affect the way the kidneys andliver function.
Reactions of toluene (see environmental fate) in the atmosphere contribute tothe formation of ozone in the lower atmosphere. Ozone can affect therespiratory system, especially in sensitive individuals such as asthma or allergysufferers.
Some studies have shown that unborn animals were harmed when high levelsof toluene were inhaled by their mothers, although the same effects were notseen when the mothers were fed large quantities of toluene. Note that theseresults may reflect similar difficulties in humans.
Carcinogenicity. There is currently no evidence to suggest that toluene iscarcinogenic.
Environmental Fate. A portion of releases of toluene to land and water willevaporate. Toluene may also be degraded by microorganisms. Oncevolatilized, toluene in the lower atmosphere will react with other atmosphericcomponents contributing to the formation of ground-level ozone and other airpollutants.
Physical Properties. Toluene liquid with a sweet, pungent odor. It is solubleto 0.07 percent in water and has a boiling point of 232 degrees F.
Pharmaceutical Industry Releases and Transfers Profile
Sector Notebook Project September 199774
IV.C. Other Data Sources
The toxic chemical release data obtained from TRI captures many of thefacilities in the pharmaceutical industry. It also allows for a comparisonacross years and industry sectors. Reported chemicals are limited however tothe approximately 600 reported chemicals. Most of the hydrocarbonemissions from pharmaceutical facilities are not captured by TRI. The EPAOffice of Air Quality Planning and Standards has compiled air pollutantemission factors for determining the total air emissions of priority pollutants(e.g., total hydrocarbons, SO2, NO2, CO, particulates, etc.) from manychemical manufacturing sources.
The EPA Office of Air’s Aerometric Information Retrieval System (AIRS)contains a wide range of information related to stationary sources of airpollution, including the emissions of a number of air pollutants which may beof concern within a particular industry. With the exception of volatile organiccompounds (VOCs), there is little overlap with the TRI chemicals reportedabove. Table 18 summarizes annual releases of carbon monoxide (CO),nitrogen dioxide (NO2), particulate matter of 10 microns or less (PM10), totalparticulate (PT), sulfur dioxide (SO2), and volatile organic compounds(VOCs).

Pharmaceutical Industry Releases and Transfers Profile
Sector Notebook Project September 199775
Table 18: Air Pollutant Releases by Industry Sector (tons/year)
Industry Sector CO NO2 PM10 PT SO2 VOC
Metal Mining 4,670 39,849 63,541 173,566 17,690 915
Nonmetal Mining 25,922 22,881 40,199 128,661 18,000 4,002
Lumber and WoodProduction
122,061 38,042 20,456 64,650 9,401 55,983
Furniture and Fixtures 2,754 1,872 2,502 4,827 1,538 67,604
Pulp and Paper 566,883 358,675 35,030 111,210 493,313 127,809
Printing 8,755 3,542 405 1,198 1,684 103,018
Inorganic Chemicals 153,294 106,522 6,703 34,664 194,153 65,427
Organic Chemicals 112,410 187,400 14,596 16,053 176,115 180,350
Petroleum Refining 734,630 355,852 27,497 36,141 619,775 313,982
Rubber and Misc. Plastics 2,200 9,955 2,618 5,182 21,720 132,945
Stone, Clay and Concrete 105,059 340,639 192,962 662,233 308,534 34,337
Iron and Steel 1,386,461 153,607 83,938 87,939 232,347 83,882
Nonferrous Metals 214,243 31,136 10,403 24,654 253,538 11,058
Fabricated Metals 4,925 11,104 1,019 2,790 3,169 86,472
Electronics and Computers 356 1,501 224 385 741 4,866
Motor Vehicles, Bodies,Parts and Accessories
15,109 27,355 1,048 3,699 20,378 96,338
Dry Cleaning 102 184 3 27 155 7,441
Ground Transportation 128,625 550,551 2,569 5,489 8,417 104,824
Metal Casting 116,538 11,911 10,995 20,973 6,513 19,031
Pharmaceuticals 6,586 19,088 1,576 4,425 21,311 37,214
Plastic Resins andManmade Fibers
16,388 41,771 2,218 7,546 67,546 74,138
Textiles 8,177 34,523 2,028 9,479 43,050 27,768
Power Generation 366,208 5,986,757 140,760 464,542 13,827,511 57,384
Shipbuilding and Repair 105 862 638 943 3,051 3,967
Source: U.S. EPA Office of Air and Radiation, AIRS Database, 1997.

Pharmaceutical Industry Releases and Transfers Profile
Sector Notebook Project September 199776
IV.D. Comparison of Toxic Release Inventory Among Selected Industries
The following information is presented as a comparison of pollutant releaseand transfer data across industrial categories. It is provided to give a generalsense as to the relative scale of releases and transfers within each sectorprofiled under this project. Please note that the following figure and table donot contain releases and transfers for industrial categories that are notincluded in this project, and thus cannot be used to draw conclusionsregarding the total release and transfer amounts that are reported to TRI.Similar information is available within the annual TRI Public Data ReleaseBook.
Figure 12 is a graphical representation of a summary of the 1995 TRI data forthe pharmaceutical industry and the other sectors profiled in separatenotebooks. The bar graph presents the total TRI releases and total transferson the vertical axis. The graph is based on the data in Table 19 and is meantto facilitate comparisons among the relative amounts of releases, transfers,and releases per facility both within and among these sectors. The readershould note, however, that differences in the proportion of facilities capturedby TRI exist among industry sectors. This can be a factor of poor SICmatching and relative differences in the number of facilities reporting to TRIfrom the various sectors. In the case of the pharmaceutical industry, the 1995TRI data presented here covers 200 facilities. Only those facilities listingprimary SIC codes falling within SIC 2833 and 2834 were used.
Comparisons of the reported pounds released or transferred per facility inTable 19 demonstrate that the pharmaceutical industry is above average in itspollutant releases and transfers per facility when compared to other TRIindustries. Of the twenty manufacturing SIC codes listed in the TRI database,the mean amount of pollutant release per facility (including pharmaceuticalfacilities) was approximately 101,000 pounds. The TRI releases of theaverage pharmaceutical facility (SIC 2833 and 2834) were 150,000 pounds,making the industry 1.5 times higher in per facility releases than for otherindustries. For transfers, the mean of pharmaceutical facilities was about 4.6times as much as that of all TRI manufacturing facilities (161,000 poundstransferred off-site per facility compared to 736,000 pounds perpharmaceutical facility). This comparison is difficult to interpret due to thedivergent nature of the industries listed in Table 19 and the differences in theraw materials and processes used to manufacture the specific industry’sproducts. The batch nature and large volumes of raw materials used toproduce the relatively small amounts of high purity pharmaceutical productsmay account for the higher rate released and transferred by the pharmaceuticalindustry.

Pharmaceutical Industry Releases and Transfers Profile
Sector Notebook Project September 199777
0
100
200
300
400
500
600
22 24 25
2611
-263
1
2711
-278
9
2812
-281
9
2821
, 282
3, 2
824
2833
, 283
4
2861
-286
9
2911 30 32 331
332,
336
333,
334 34 36 371
3731
SIC Range
Tot
al P
ound
s (m
illio
ns)
Total Releases Total Transfers
Figure 12: Summary of TRI Releases and Transfers by Industry
Source: US EPA 1995 Toxics Release Inventory Database.
SICRange
Industry Sector SICRange
Industry Sector SICRange
Industry Sector
22 Textiles 2833,2834
Pharmaceuticals 333, 334 Nonferrous Metals
24 Lumber and WoodProducts
2861-2869
Organic Chem. Mfg. 34 Fabricated Metals
25 Furniture and Fixtures 2911 Petroleum Refining 36 Electronic Equip. andComp.
2611-2631 Pulp and Paper 30 Rubber and Misc.Plastics
371 Motor Vehicles, Bodies,Parts, and Accessories
2711-2789 Printing 32 Stone, Clay, andConcrete
3731 Shipbuilding
2812-2819 Inorganic ChemicalManufacturing
331 Iron and Steel

Pharmaceutical Industry Releases and Transfers Profile
Sector Notebook Project September 199778
2821,2823, 2824
Plastic Resins andManmade Fibers
332, 336 Metal Casting

Pharm
aceutical IndustryR
eleases and Transfers P
rofile
Secto
r No
teboo
k Pro
jectS
eptember 1997
79
Table 19: Toxics Release Inventory Data for Selected IndustriesTRI Releases TRI Transfers
Industry Sector SICRange
# TRIFacilities
TotalReleases
(million lbs.)
Ave.Releases per
Facility(pounds)
TotalTransfers
(million lbs.)
Ave. Trans.per Facility(pounds)
Total Releases+Transfers(million lbs.)
Average Releases +Transfers per Facility
(pounds)
Textiles 22 339 17.8 53,000 7.0 21,000 24.8 74,000
Lumber and Wood Products 24 397 30.0 76,000 4.1 10,000 34.1 86,000
Furniture and Fixtures 25 336 37.6 112,000 9.9 29,000 47.5 141,000
Pulp and Paper 2611-2631 305 232.6 763,000 56.5 185,000 289.1 948,000
Printing 2711-2789 262 33.9 129,000 10.4 40,000 44.3 169,000
Inorganic Chem. Mfg. 2812-2819 413 60.7 468,000 21.7 191,000 438.5 659,000
Plastic Resins and ManmadeFibers
2821,2823,2824
410 64.1 156,000 192.4 469,000 256.5 625,000
Pharmaceuticals 2833, 2834 200 29.9 150,000 147.2 736,000 177.1 886,000
Organic Chemical Mfg. 2861-2869 402 148.3 598,000 208.6 631,000 946.8 1,229,000
Petroleum Refining 2911 180 73.8 410,000 29.2 162,000 103.0 572,000
Rubber and Misc. Plastics 30 1,947 143.1 73,000 102.6 53,000 245.7 126,000
Stone, Clay, and Concrete 32 623 43.9 70,000 31.8 51,000 75.7 121,000
Iron and Steel 331 423 90.7 214,000 513.9 1,215,000 604.6 1,429,000
Metal Casting 332, 336 654 36.0 55,000 73.9 113,000 109.9 168,000
Nonferrous Metals 333, 334 282 201.7 715,000 164 582,000 365.7 1,297,000
Fabricated Metals 34 2,676 83.5 31,000 350.5 131,000 434.0 162,000
Electronic Equip. andComp.
36 407 4.3 11,000 68.8 169,000 73.1 180,000
Motor Vehicles, Bodies,Parts, and Accessories
371 754 79.3 105,000 194 257,000 273.3 362,000
Shipbuilding 3731 43 2.4 56,000 4.1 95,000 6.5 151,000
Source: US EPA Toxics Release Inventory Database, 1995.

Pharmaceutical Industry Releases and Transfers Profile
Sector Notebook Project September 199780

Pharmaceutical Industry Pollution Prevention Opportunities
Sector Notebook Project September 199781
V. POLLUTION PREVENTION OPPORTUNITIES
The best way to reduce pollution is to prevent it in the first place. Somecompanies have creatively implemented pollution prevention techniques thatimprove efficiency and increase profits while at the same time minimizingenvironmental impacts. This can be done in many ways, such as reducingmaterial inputs, re-engineering processes to reuse by-products, improvingmanagement practices, and employing substitution of toxic chemicals. Somesmaller facilities are able to actually get below regulatory thresholds just byreducing pollutant releases through aggressive pollution prevention policies.
The Pollution Prevention Act of 1990 established a national policy ofmanaging waste through source reduction, which means preventing thegeneration of waste. The Pollution Prevention Act also established as nationalpolicy a hierarchy of waste management options for situations in which sourcereduction cannot be implemented feasibly. In the waste managementhierarchy, if source reduction is not feasible the next alternative is recyclingof wastes, followed by energy recovery, and waste treatment as a lastalternative.
In order to encourage these approaches, this section provides both generaland company-specific descriptions of pollution prevention activities that havebeen implemented within the pharmaceutical industry. While the list is notexhaustive, it does provide core information that can be used as the startingpoint for facilities interested in beginning their own pollution preventionprojects. When possible, this section provides information from real activitiesthat can be, or are being, implemented by this sector -- including a discussionof associated costs, time frames, and expected rates of return. This sectionprovides summary information from activities that may be, or are beingimplemented by this sector. Please note that the activities described in thissection do not necessarily apply to all facilities that fall within this sector.Facility-specific conditions must be carefully considered when pollutionprevention options are evaluated, and the full impacts of the change must beexamined to determine how each option affects air, land and water pollutantreleases.
The bulk manufacturing processes of the pharmaceutical industry arecharacterized by a low ratio of finished product to raw material. Therefore,large quantities of residual waste are generated, especially in fermentation andnatural product extraction. Chemical synthesis processes generate wastescontaining hazardous spent solvents and reactants, combined with residualwastes such as reaction residues. Equipment cleaning water and residue, oftencontaining hazardous chemicals, also are a major waste stream (U.S. EPA,1991).

Pharmaceutical Industry Pollution Prevention Opportunities
Sector Notebook Project September 199782
Source reduction is one method by which the industry aims to reduce thesewastes. However, source reduction methods such as process modificationsand material substitutions may not be as easily implemented in thepharmaceutical industry as in other manufacturing sectors. This is becauseany significant change to the production process of an existing product, mayneed approval from the Food and Drug Administration (FDA). If a companywishes to change the method of making a drug or active ingredient that goesinto it, the FDA requires the company to prove that the ‘new’ drug is of thesame or better quality as the old drug and that any reformulation will notadversely affect the identity, strength, quality, purity, or bioavailability of thedrug. The process of gathering information to support the change andawaiting FDA review and approval can be lengthy, time-consuming andexpensive.
As a result, many pharmaceutical companies are looking at ways to minimizewaste in future production processes at the research and development stage.Incorporating pollution prevention at the start of a new drug developmentprocess is much more economical, efficient, and environmentally sound (seeSection VI. D. for further details). The factors affecting the pharmaceuticalindustry’s pollution prevention efforts were documented by PhRMA membersin a 1997 document entitled Pharmaceutical Industry Waste MinimizationInitiatives.
Many pharmaceutical companies have already implemented pollutionprevention programs in their manufacturing facilities. Although pollutionprevention may not always be a substitute for control technologies, it is oftenviable and is an increasingly popular method for meeting environmentalcompliance requirements. Some examples of innovative waste reductionprograms that incorporate source reduction as well as recycling and reuse arepresented in the case studies that appear in this section.

Pharmaceutical Industry Pollution Prevention Opportunities
Sector Notebook Project September 199783
V.A. Material Substitutions
Substituting raw materials to lessen the volume and/or toxicity of wastegenerated is a type of source reduction (U.S. EPA, 1991). One of the mostcommon opportunities for material substitutions in the pharmaceuticalsindustry is found in the tablet coating process. Until recently, many tabletcoating operations involved the use of methylene chloride and otherchlorinated solvents. By switching to aqueous-based coating films, manyfirms have reduced the hazardous waste content in their air and effluent wastestreams, as well as the cost of purchasing chemicals. Aqueous-based cleaningsolutions are also being used more frequently for equipment cleaning insteadof solvent-based solutions (U.S. EPA, 1991).

Pharmaceutical Industry Pollution Prevention Opportunities
Sector Notebook Project September 199784
POLLUTION PREVENTION CASE STUDIES
Material Substitution
&Schering-Plough Pharmaceuticals will market a new inhaler for the treatment of asthma,which is free of chlorofluorocarbons (CFCs). The CFC-free inhaler was developed by 3MPharmaceuticals. CFCs are used as a propellant in metered-dose inhalers (MDI). In a newMDI, which was approved by the FDA in August, 1996, CFCs have been replaced byhydrofluoroalkane-134a (HFA-134a). Unlike CFCs, HFA-134a does not deplete theozone. The product will be marketed under the brand name Proventil® HFA.
&Schering-Plough Laboratories is switching to a coated natural kraft (CNK) paperboard forits packaging. CNK is stronger and less expensive than the previous packaging material, aswell as recyclable and compostable. The paperboard is not bleached with chlorine, but iscoated with white clay coating. Instead of mineral-based varnishes and inks, water and soy-based materials are used. In New Jersey alone, the company is expected to save $225,000per year and could save up to $1.2 million if the program expands to other divisions.
&At its West Point, PA, facility, Merck removed 1,1,1-Trichloroethane (TCA) from itsproduction operations. TCA was used in stripping labels off bottles and other cleaningoperations, printing, and manufacturing. A citrus-based solvent was substituted forcleaning packaging equipment. For cleaning manufacturing equipment, a petroleum-basedsolvent was substituted, the waste from which is used for energy recovery in an off-sitefacility.
&At the same facility, Merck substituted phenol for thimerosal, a mercury-based compound. Thimerosal had been used as a biocide to inactivate bacteria during the initial stages offermentation in the production of a vaccine. Substituting phenol, a less-hazardous, FDA-approved biocide enabled Merck to achieve an 85 percent reduction in mercury-basedwaste. In addition, the substitution resulted in increased product yields, improved microbialkinetics, and cost savings for raw materials.
&At its Cherokee plant in Riverside, PA, Merck developed an innovative new manufacturingchemistry which substitutes toluene for dichloromethane. The change has resulted in a 98percent reduction in releases and transfers of dichloromethane. In addition, becausetoluene is less volatile and more easily recovered, the controls and recovery equipment onthe new process are able to control toluene releases such that they have increased onlyslightly.
Material Substitution (cont.)
&Riker Laboratories in Northbridge, CA recently replaced several different organic solventcoating materials used on medicine tablets with a water-based coating material. Differences in the new coating material required that new spray equipment be installed. However, the company saves $15,000 per year not purchasing these organic solvents anddetermined that $180,000 in pollution control equipment was no longer needed. Theyestimate that the investment will pay for itself in less than one year. The substitutionprevents 24 tons per year in organic solvent emissions, reduced exposure risks to workers, and has made it easier for the company to comply with strict California air emissionstandards.
&In producing the anti-viral drug 6-aminopenicillanic acid, Bristol-Myers Squibb used to extract the intermediate, penicillin V from an aqueous fermentation broth. The broth wasfiltered and the intermediate then was extracted in several centrifuge steps using the toxicsolvent methyl isobutyl ketone (MiBK). The extraction was a major source of fugitiveemissions. The broth now is filtered through a membrane and the intermediate is extractedusing n-butyl acetate, a non-toxic chemical, in closed centrifuges, reducing fugitiveemissions. The overall capital investment for this project came to almost $10 million. However, the annual operating cost reductions, coupled with a 10 percent increase inthroughput, generate $4.9 million in additional cash flow. Based on this, the project willgenerate a return on investment of 28 percent and a payback period of 2.7 years. Inaddition the project reduced hazardous waste by 20,000 pounds and eliminated over onemillion pounds of MiBK releases to the air and water.
&Glaxo-Wellcome, Inc. developed an innovative aqueous coating method that eliminatedthe use of methylene chloride, isopropyl alcohol, methanol, and ethanol in their Zantactablet coating operations performed at their Zebulon, North Carolina facility. Glaxo-Wellcome overcame a number of obstacles before using the aqueous-based coatingmaterial on the Zantac production line. First, the pharmaceutical active readily degraded atthe extreme heat and moisture encountered during aqueous coating. Also, thepharmaceutical active migrates through the aqueous coating causing discolorization anddegradation of the tablet coating film. To implement the use of the substitute materials,Glaxo-Wellcome had to make extensive changes to the coater spray assemblies, revampedthe coater air handling system with larger fans and heating coils, and installed adehumidifying system. The capital investment for this equipment was $1.5 million. However, the company annually saves $286,800 in organic solvent purchases and$322,900 in disposal costs of the more than 479 tons of hazardous waste generated by theold system every year. The estimated payback period for the modifications is three years. In addition, the new system cut VOC emissions to the air from almost 15,000 pounds peryear to zero.

Pharmaceutical Industry Pollution Prevention Opportunities
Sector Notebook Project September 199785
Material Substitution (cont.)
&The Pharmacia and Upjohn, Inc. Sterile Manufacturing area in Kalamazoo has receivedFDA approval for a Thimerosal-free formulation of one of its products. This newformulation will eliminate the use of Thimerosal, a mercury based preservative, in themanufacture of the drug Atgam. Atgam will be manufactured without any preservativeusing new closed column chromatography and Restrictive Access Barrier technology. Atgam is used to prevent organ transplant rejection and in the treatment of aplastic anemia.
&The Eli Lilly Cleaning Technology Center in late 1996 initiated a formal screeningprogram to identify potential aqueous based cleaners as replacements for the variousorganic and chlorinated solvents currently used in bulk pharmaceutical manufacturingequipment cleanings. In one product line, 8,700 liters of acetone per cleaning was replacedwith an alkaline aqueous based cleaner for an estimated annual reduction of 17,400 liters ofacetone. An acid aqueous based cleaner replaced methanol in another product line,resulting in methanol reductions of 25,800 liters per year. In cleaning operationsassociated with another product, an alkaline aqueous based cleaner replaced 117,000 litersof methanol and 600 liters of ethylene dichloride per cleaning. This resulted in anestimated annual reduction of 368,000 liters of methanol and 1,200 liters of ethylenedichloride.

Pharmaceutical Industry Pollution Prevention Opportunities
Sector Notebook Project September 199786
V.B. Process Modifications
Process modifications are alterations to or modernization of existing processesto reduce waste generation. Process modifications can involve re-designingchemical transfer systems to reduce spillage and other material losses. Forexample, in batch operations, each loading and unloading of the reactors andother equipment increases the risk of chemical spills and solvent vaporreleases. Batch operations often require more frequent reactor clean outsusing significant volumes of cleaning solution and solvents. With continuousoperations, the reactor is loaded once and solvents and reactants are fed intothe reactor continually, thereby reducing the risk of pollutant releases (USEPA, 1991).
Thus switching from batch to continuous operations for certain products maypotentially reduce large volumes of wastes. Switching to a continuous orpartially continuous process may be possible for a facility that is the primaryproducer of a product which is in constant demand. For example, HoffmannLa Roche’s facility in Nutley, NJ is one of the primary producers of VitaminE in the country. Consequently, much of their vitamin production equipmentis dedicated and run as semi-continuous operations.
Process changes that optimize reactions and raw material use can reducewaste and releases to the environment (US EPA, 1995). Modifications assimple as careful monitoring of reaction parameters (temperatures, pH, etc.)can dramatically improve manufacturing efficiency. Production in many of thelarge pharmaceutical companies is computerized and highly automated.Computers equipped with computer aided design (CAD) programs visuallysimulate the production process on the screen. The automated system allowsproduction managers to turn on the batch process and control temperatures,pressure, and other process parameters, from the keyboard. While, the systemruns, production personnel are free to do other things such as checkequipment or take product samples. Such careful automated monitoring mayinsure against the formation of fouling waste at the bottom of reactor vessels,thereby reducing the need for additional cleaning, as well as lessening the riskof damaged batches of product which have to be disposed (US EPA, 1991).

Pharmaceutical Industry Pollution Prevention Opportunities
Sector Notebook Project September 199787
POLLUTION PREVENTION CASE STUDIES
Process Modifications
&As part of their “Environment 2000" program, Bristol-Myers Squibb has started to look atProduct Life Cycle (PLC) management as a way to implement pollution prevention. PLCinvolves investigating the environmental impacts of a product at every stage of production:R&D, manufacturing, and packaging. Pollution prevention options are now beinginvestigated at the very beginning of drug development. This eliminates the possibility oflengthy Supplementary Drug Approval applications with FDA. Using PLC management,Bristol-Myers Squibb discovered the use of a filtration membrane for their 6-aminopenicillanic acid production (see Section V.A. Case Studies).
&At its East Hanover, NJ facility, Sandoz Pharmaceutical Co. changed processes in itsreactors, to reduce solvent usage. An inert atmosphere above the reaction mixture is usedduring synthesis to protect the reaction from exposure to oxygen. In the previous process,nitrogen flowed continuously over the mixture, carrying away with it a certain amount ofsolvent vapors. The nitrogen gas blanketing process uses a non-flowing nitrogen layer thatonly bleeds out a very small amount of nitrogen and solvent.
&In their main drug development lab in Tippecanoe, IN, Eli Lilly and Company hasimplemented a pollution prevention program. Beginning in the R&D phase, the companyassesses the environmental impacts of every new product and determines where wastes canbe minimized. As a result, Eli Lilly developed a new process which eliminated the use ofmethylene chloride, aluminum wastes, use of an odoriferous raw material, and alldistillation steps from production of a drug under development for the treatment ofosteoporosis.
&One of Hoffmann La Roche’s major manufacturing processes uses glycol ether as anextractive solvent, much of which had to be disposed of as wastewater. After the productis recovered, the glycol ether is distilled and reused. The overhead from the distillation isprimarily water with some glycol ether which is disposed as wastewater. The process wasredesigned to increase per pass recycle of the glycol ether in the distillation column by12%. As a result, use of the chemical was reduced by about 60% and solvent releasesdecreased by 300,000 pounds per year and the batch cycle time was reduced by four hours. Annual savings are $250,000.

Pharmaceutical Industry Pollution Prevention Opportunities
Sector Notebook Project September 199788
Process Modifications (cont.)
&At one of its facilities, Hoffman La Roche was using 110,000 gallons of methanol per yearfor cleaning equipment during product changeovers. Methanol was being used for allcleaning and rinsing stages. To reduce methanol usage and the associated waste disposalcosts, a new method was developed whereby a two-stage water-based cleaning is done beforea final methanol rinse. This reduced the amount of methanol used to about 30,000 gallons peryear and saves about $49,000 per year.
&In one of its manufacturing processes, Hoffman La Roche extracted a synthesizedpharmaceutical intermediate from toluene into water, and then from water into chloroform. Because toluene was soluble in the extraction, it contaminated the chloroform and created awaste stream of the mixed solvents. The company eliminated the waste stream by steam-distilling the toluene from the water so that the toluene never came in contact with thechloroform. Chloroform use decreased by 76 percent which was sufficient to remove thismaterial from the list of chemicals the facility was required to include in its Toxic ReleaseInventory report. The project saved $22,000 per year.
&At its West Point, PA facility, Merck Co. made a simple change in the sequence of processsteps used to manufacture a vaccine, which resulted in a substantial reduction of mercury-based wastes. Thimerisol, a mercury-based chemical, was used as a preservative during anintermediate process step. Thus any waste stream produced during the rest of the processwas contaminated with mercury. A process change was initiated to add thimerosal at the endof the process. By elimating mercury in waste streams generated prior to the addition ofthimerisol, mercury contaminated wastes generated during manufacturing were dramaticallyreduced.
&At its Flint River plant in Albany, Georgia, Merck used steam jets to produce a vacuum inthe process vessel during the production of an antibiotic. This results in dichloromethanebeing mixed with steam and subsequently evaporating into the air. The steam jets werereplaced with liquid ring vacuum pumps which reduced air emissions. Dichloromethaneemissions were further reduced by maintaining the vacuum pump seal fluid at subzerotemperatures which condenses the dichloromethane vapor so it can be recycled and reused.
&Pharmacia and Upjohn’s wastewater treatment process was modified to significantly reducewaste disposed by its Underground Injection Control operation. A modification suggested byan employee eliminated about 1 million pounds of solid waste. This modification involvedsubstituting a bag filter for a precoat vacuum filter. The precoat vacuum filter used adiatomaceous filter medium, which generated large volumes of solid waste. The bag filtercreates much less waste per volume of liquid filtered. The used filter bags are incinerated onsite, thereby greatly reducing landfill wastes.

Pharmaceutical Industry Pollution Prevention Opportunities
Sector Notebook Project September 199789
Process Modifications (cont.)
&In converting to a new process for bioconversion of a steroid intermediate, Pharmacia andUpjohn, Inc. has eliminated approximately 90,000 pounds of dimethylformamide waste andapproximately 190,000 pounds of filter aid waste per year. In addition, solvent handling wasreduced from about 6 million pounds to about 600,000 pounds and aqueous waste wasreduced more than 4 million pounds per year.

Pharmaceutical Industry Pollution Prevention Opportunities
Sector Notebook Project September 199790
V.C. Good Operating Practices
One of the easiest and most economical ways to achieve source reduction isto implement good operating practices. Pharmaceutical companies alreadyfollow a list of Good Manufacturing Practices (GMP) guidelines outlined bythe FDA. In some cases these involve good operating practices that willreduce raw materials use and waste generation. As a result, many companieshave developed environmental policies for all of their facilities, both in theU.S. and abroad. Typically, policies may be written for employee training,employee health and safety, hazardous chemical spill cleanup procedures,equipment maintenance procedures, leak detection, and emergency responseprocedures.
Management commitment. Good operating practices start with on-sitecommitment and understanding of the need and methods for pollutionprevention, from top management levels to the plant floor. Without facility-wide efforts to reduce pollution, source reduction may not be successful (USEPA, 1991).
Employee training. An employee training program is essential to the successof a source reduction program. Employees should be trained in safe handlingof equipment, chemicals, and wastes. They should also be informed of anypotentially harmful health effects of the hazardous chemicals they handle. Aswell as being trained in proper operation of equipment and chemical handling,employees should be trained in spill cleanup and methods for detectingchemical releases (US EPA, 1991).
Maintenance programs. Maintenance programs should target bothpreventive and corrective maintenance of equipment. This means thatequipment should be regularly checked and cleaned to insure its properfunctioning, and damaged equipment should be repaired quickly. Routinecleaning, minor adjustments, testing and replacement of parts, should be a partof the maintenance program. Additionally, good record keeping of equipmentchecks, repairs, cleaning, and equipment failure will help to reduce thelikelihood of future equipment breakdowns and any associated pollutionreleases (US EPA, 1991).
Inventory control. The wide range of chemicals used in the pharmaceuticalindustry makes it essential to instigate an efficient inventory tracking system,such as a “first-in, first-out” policy and chemicals must be properly labeledwith their name, date of purchase, and date of expiration. This helps to insurethat older, un-used chemicals do not have to be needlessly discarded (USEPA, 1991). In addition, having one person responsible for the distribution ofchemicals and supplies insures a more efficient tracking system (US EPA,1995). Inventory tracking is a valuable and easy method for reducing wastes.

Pharmaceutical Industry Pollution Prevention Opportunities
Sector Notebook Project September 199791
Spill prevention and storage. Spill and leak prevention are critical topollution prevention. Tightly secured storage tanks are a key to avoidingspills. Containers should have good valves with tight stopping devices toavoid the spilling or dripping of hazardous chemicals. Storage containersshould have legible signs indicating the contents of the container, healthhazard warnings (where necessary), and spill cleanup procedures in case ofemergencies. Large drums can be raised above the ground to avoid corrosion.An organized storage area facilitates fast and easy removal of chemicals, aswell as reduction and cleanup of spills (U.S. EPA, 1991).

Pharmaceutical Industry Pollution Prevention Opportunities
Sector Notebook Project September 199792
POLLUTION PREVENTION CASE STUDIES
Good Operating Practices
&At its Kenilworth, NJ facility, Schering-Plough Pharmaceuticals has a central warehousewith a computerized inventory system. Raw materials come into the warehouse in largevolumes. Materials are weighed according to batch requirements, labeled, and then sentto different process areas throughout the facility. This eliminates excess raw materialwastes and ensures that only the amounts needed are used.
&Sandoz Pharmaceuticals has also developed a system to improve scheduling of batchoperations in their facilities worldwide and domestically. Accurate scheduling reduces thechances of excess wastes and costs, which occur when a batch changeover takes place.
&At its Nutley, NJ plant, Hoffmann La Roche was able to identify and repair more than 900sources of fugitive emissions. In addition, the company installed ultra-low temperaturecondensers to remove solvents from vent streams. The captured solvents are recycled ortreated off-site.
&The Pharmacia and Upjohn, Inc. Puerto Rico Technical Operations group was the firstoffshore location to implement the company’s pollution prevention program. The localpollution prevention team helps the plant set pollution prevention goals. The team reportsprogress toward meeting goals annually. As a result, the Butyl Alcohol recovery efficiencyat the facility has been increased to 95% and Acetone to 96%. The facility has beentracking waste indices (Tons of waste generated vs. Kilograms of product produced) andresults for several wastes show reductions over a four-year period. The pollutionprevention program has been fully implemented at all Pharmacia and Upjohn U.S. sites. Under the program individual business units set goals and report on progress annually. More than 300 pollution prevention projects, many of them in the research anddevelopment areas, have been recorded since the program started in 1990.
&The Chemical and Fermentation operation at Pharmacia and Upjohn, Inc. in Kalamazoohas begun using interlocked valve systems on jacketed coolers. The new valve systemshelp prevent the inadvertent discharge of methanol, used as refrigerant, to surface waters. They also have begun using new drip-less pipe couplers to reduce solvent losses and spillsfrom hose connections.

Pharmaceutical Industry Pollution Prevention Opportunities
Sector Notebook Project September 199793
V.D. Recycling, Recovery, and Reuse
“Recovery and recycling include direct reuse of waste material, recoveringused materials for a separate use, and removing impurities from waste toobtain relatively pure substances” (EPA 1991). Although “strict qualitycontrol requirements of the pharmaceutical industry often restrict reuseopportunities, some do exist” (EPA 1991) and are considered valuable by theindustry since they reduce the volume of raw materials used and the amountof waste generated and disposed.
Except for in-process recycling, EPA does not consider recycling, recovery,and reuse to be source reduction techniques. However, in-process recycling,which includes the reuse or recirculation of a chemical within a process andmay include recovery or reclamation, is considered a source reductiontechnique. The pharmaceutical industry often uses this form of recyclingwhich is dedicated to and physically integrated with the pharmaceuticalmanufacturing process by means of piping or another form of conveyance.
Recycling and recovery provides the pharmaceutical industry a greatopportunity to reduce the volume and toxicity of spent solvents. Asdescribed in Section 3, solvents are used for a wide range of applications,from synthesis, extraction, and purification of active ingredients to cleaningprocess equipment. The types of solvent recovery employed includedistillation, evaporation, decantation, centrifugation, and filtration. However,limitations exist with both on and off-site recycling and recovery since severaltypes of solvents (including water), reactants, and other contaminants may bepresent. These materials must be extracted to allow the solvent to be reusedeither in a pharmaceutical process or in another process. Additionally, specialtechniques and equipment must be used to break azeotropes formed duringthe chemical reactions.
In addition to solvents, some residual wastes may also be recovered andreused. For example, filter cakes from fermentation processes are usuallydisposed of in landfills. An alternative being used in some facilities is tocollect the waste filter cakes, recover any valuable by-products, and then sellthe cakes to be used as fertilizers or soil additives. To be used as a fertilizer,the nitrogen, phosphorus, and potassium content must be greater than 5%,which sometimes can be achieved by reducing the moisture content in thefilter cake (US EPA, 1991).

Pharmaceutical Industry Pollution Prevention Opportunities
Sector Notebook Project September 199794
POLLUTION PREVENTION CASE STUDIES
Recycling, Recovery, and Reuse
&Nycomed Inc. manufactures bulk pharmaceutical products by batch processing. Inprocessing a product for medical diagnostic imaging, the company installed closed loopdistillation units to recover all of its methanol washes and methanol-containing wastewater. The methanol recovery system can distill approximately 2,000 gallons per day of 70 percentmethanol to more than 99.5 percent methanol, which can be reused in the same process. Nycomed Inc. eliminated water discharges of methanol, reduced hazardous waste, andsaved approximately 680,000 pounds of methanol in the first half of 1992, saving $54,438in the same period.
&The Pharmacia and Upjohn, Inc. Chemical and Fermentation operation in Kalamazooreuses more than 195 million pounds of solvent annually. Approximately 80% of the site’stotal solvent requirement and 90% of the site’s chlorinated solvent requirement is met byreused solvent. The reused solvent demand is met through a combination of in processsolvent reuse (150 million pounds) and distillation (45 million pounds). There are now sixcentralized distillation units. On site solvent reuse and recovery in chemical processeshelped the company exceed its 33/50 Program goals. The achievement was commemoratedby a National Performance Review Environmental Champion Award given to the companyby Vice President Al Gore in 1995.
&Pharmacia and Upjohn, Inc. Chemical Process Research and Development developed aproprietary distillation process for splitting Tetrahydrofuran from a mixture of alcohol,water, and other wastes. Without the new process, Tetrahydrofuran forms azeotropicmixtures with alcohol which cannot be distilled. This process now recovers approximately1 million pounds of THF per year.
&Pharmacia and Upjohn, Inc. is evaluating the possibilities of reusing waste solventcondensate produced from their cryogenic air pollution control equipment. They haveidentified one methylene chloride rich stream to recover as a trial. An estimated 2.5 millionpounds of this waste solvent is generated annually. Recovery by an off-site recycler or onsite reclamation are being further evaluated.

Pharmaceutical Industry Pollution Prevention Opportunities
Sector Notebook Project September 199795
V.E. Pollution Prevention Research
Because of comprehensive regulations from both the FDA and the EPA,pharmaceutical companies are continuously researching new and innovativeways to reduce their wastes. Many companies are starting to look at pollutionprevention options early in development and are collaborating withuniversities and other research institutions to develop new technologies thatwill help reduce or eliminate wastes. Some of these technologies, still in theresearch and testing stages, are discussed below.
Solvent Minimization
One potential research area which has been identified is in supercriticalsolvents. Supercritical fluids are known to be very effective solvents and canfunction as an alternative to traditional chlorinated and other toxic solventsused in pharmaceutical separations. These solvents are in a supercritical state,meaning that they are at a very high temperature and/or pressure. Arelatively small change in the temperature and/or pressure in supercritical statecan lead to large changes in the solubility of chemicals in the solvent. Thisincrease in solubility is ideal for separations because the overall volume ofsolvent needed is reduced (NJIT, 1991).
Separation Improvements
Separation of active ingredients from solvents is one of the most importantprocesses in the pharmaceutical industry. Research has been conducted tofind separation methods which generate fewer by-products and less waste.
One technology with such a potential is inorganic membrane reactors. “Theyare in effect reactors with built-in separators which may have potential forreaction sequences with much better reactor utilization and productconcentrations” (NJIT, 1991). Inorganic membranes enable a continuousremoval of product and a controlled addition of reactant. This increases thepotential for higher yields and greater selectivity by chemicals, which couldreduce the volume of solvents required, thereby reducing costs and wastes.Also, because the reaction and separation are combined in a single step, theemissions associated with the traditional transfer step between reaction andseparation are eliminated (NJIT, 1991).

Pharmaceutical Industry Pollution Prevention Opportunities
Sector Notebook Project September 199796

Pharmaceutical Industry Federal Statutes and Regulations
Sector Notebook Project September 199797
VI. SUMMARY OF APPLICABLE FEDERAL STATUTES AND REGULATIONS
This section discusses the Federal regulations that may apply to this sector.The purpose of this section is to highlight and briefly describe the applicableFederal requirements, and to provide citations for more detailed information.The three following sections are included:
Section VI.A contains a general overview of major statutesSection VI.B contains a list of regulations specific to this industrySection VI.C contains a list of pending and proposed regulationsSection VI.D contains a general overview of other federal statutes applicableto the industrySection VI.E. contains a general overview of state regulations affecting theindustry.
The descriptions within Section VI are intended solely for generalinformation. Depending upon the nature or scope of the activities at aparticular facility, these summaries may or may not necessarily describe allapplicable environmental requirements. Moreover, they do not constituteformal interpretations or clarifications of the statutes and regulations. Forfurther information readers should consult the Code of Federal Regulationsand state or local regulatory agencies. EPA Hotline contacts are alsoprovided for each major statute.
VI.A. General Description of Major Statutes
Resource Conservation And Recovery Act (RCRA)
RCRA of 1976, which amended the Solid Waste Disposal Act, addresses solid(Subtitle D) and hazardous (Subtitle C) waste management activities. TheHazardous and Solid Waste Amendments (HSWA) of 1984 strengthenedRCRA’s waste management provisions and added Subtitle I, which governsunderground storage tanks (USTs).
Regulations promulgated pursuant to Subtitle C of RCRA (40 CFR Parts260-299) establish a “cradle-to-grave” system governing hazardous wastefrom the point of generation to disposal. RCRA hazardous wastes include thespecific materials listed in the regulations (commercial chemical products,designated with the code "P" or "U"; hazardous wastes from specificindustries/sources, designated with the code "K"; or hazardous wastes fromnon-specific sources, designated with the code "F") or materials which exhibita hazardous waste characteristic (ignitability, corrosivity, reactivity, or toxicityand designated with the code "D").
Regulated entities that generate hazardous waste are subject to wasteaccumulation, manifesting, and record keeping standards. Facilities must

Pharmaceutical Industry Federal Statutes and Regulations
Sector Notebook Project September 199798
obtain a permit either from EPA or from a State agency which EPA hasauthorized to implement the permitting program if they store hazardouswastes for more than 90 days before treatment or disposal. Facilities maytreat hazardous waste stored in less-than-ninety-day tanks or containerswithout a permit. Subtitle C permits contain general facility standards suchas contingency plans, emergency procedures, record keeping and reportingrequirements, financial assurance mechanisms, and unit-specific standards.RCRA also contains provisions (40 CFR Part 264 Subpart S and §264.10) forconducting corrective actions which govern the cleanup of releases ofhazardous waste or constituents from solid waste management units atRCRA-regulated facilities.
Although RCRA is a Federal statute, many States implement the RCRAprogram. Currently, EPA has delegated its authority to implement variousprovisions of RCRA to 47 of the 50 States and to two U.S. territories.Delegation has not been given to Alaska, Hawaii, or Iowa.
Most RCRA requirements are not industry specific but apply to any companythat generates, transports, treats, stores, or disposes of hazardous waste.Here are some important RCRA regulatory requirements:
Identification of Solid and Hazardous Wastes (40 CFR Part 261)lays out the procedure every generator should follow to determinewhether the material in question created is considered a hazardouswaste, solid waste, or is exempted from regulation.
Standards for Generators of Hazardous Waste (40 CFR Part 262)establishes the responsibilities of hazardous waste generators includingobtaining an EPA ID number, preparing a manifest, ensuring properpackaging and labeling, meeting standards for waste accumulationunits, and record keeping and reporting requirements. Generators canaccumulate hazardous waste for up to 90 days (or 180 days dependingon the amount of waste generated) without obtaining a permit.
Land Disposal Restrictions (LDRs) (40 CFR Part 268) areregulations prohibiting the disposal of hazardous waste on landwithout prior treatment. Under the LDRs program, materials mustmeet LDR treatment standards prior to placement in a RCRA landdisposal unit (landfill, land treatment unit, waste pile, or surfaceimpoundment). Generators of waste subject to the LDRs must providenotification of such to the designated TSD facility to ensure propertreatment prior to disposal.
Used Oil Management Standards (40 CFR Part 279) imposemanagement requirements affecting the storage, transportation,

Pharmaceutical Industry Federal Statutes and Regulations
Sector Notebook Project September 199799
burning, processing, and re-refining of the used oil. For parties thatmerely generate used oil, regulations establish storage standards. Fora party considered a used oil processor, re-refiner, burner, or marketer(one who generates and sells off-specification used oil), additionaltracking and paperwork requirements must be satisfied.
RCRA contains unit-specific standards for all units used to store,treat, or dispose of hazardous waste, including Tanks andContainers. Tanks and containers used to store hazardous wastewith a high volatile organic concentration must meet emissionstandards under RCRA. Regulations (40 CFR Part 264-265, SubpartCC) require generators to test the waste to determine theconcentration of the waste, to satisfy tank and container emissionsstandards, and to inspect and monitor regulated units. Theseregulations apply to all facilities that store such waste, including largequantity generators accumulating waste prior to shipment off-site.
Underground Storage Tanks (USTs) containing petroleum andhazardous substances are regulated under Subtitle I of RCRA.Subtitle I regulations (40 CFR Part 280) contain tank design andrelease detection requirements, as well as financial responsibility andcorrective action standards for USTs. The UST program alsoincludes upgrade requirements for existing tanks that must be met byDecember 22, 1998.
Boilers and Industrial Furnaces (BIFs) that use or burn fuelcontaining hazardous waste must comply with strict design andoperating standards. BIF regulations (40 CFR Part 266, Subpart H)address unit design, provide performance standards, require emissionsmonitoring, and restrict the type of waste that may be burned.
EPA's RCRA/Superfund/UST Hotline, at (800) 424-9346, responds toquestions and distributes guidance regarding all RCRA regulations. TheRCRA Hotline operates weekdays from 9:00 a.m. to 6:00 p.m., ET, excludingFederal holidays.
Comprehensive Environmental Response, Compensation, And Liability Act (CERCLA)
CERCLA, a 1980 law commonly known as Superfund, authorizes EPA torespond to releases, or threatened releases, of hazardous substances that mayendanger public health, welfare, or the environment. CERCLA also enablesEPA to force parties responsible for environmental contamination to clean itup or to reimburse the Superfund for response costs incurred by EPA. TheSuperfund Amendments and Reauthorization Act (SARA) of 1986 revisedvarious sections of CERCLA, extended the taxing authority for Superfund,

Pharmaceutical Industry Federal Statutes and Regulations
Sector Notebook Project September 1997100
and created a free-standing law, SARA Title III, also known as theEmergency Planning and Community Right-to-Know Act (EPCRA).
The CERCLA hazardous substance release reporting regulations (40 CFRPart 302) direct the person in charge of a facility to report to the NationalResponse Center (NRC) any environmental release of a hazardous substancewhich equals or exceeds a reportable quantity. Reportable quantities aredefined and listed in 40 CFR §302.4. A release report may trigger a responseby EPA, or by one or more Federal or State emergency response authorities.
EPA implements hazardous substance responses according to proceduresoutlined in the National Oil and Hazardous Substances Pollution ContingencyPlan (NCP) (40 CFR Part 300). The NCP includes provisions for permanentcleanups, known as remedial actions, and other cleanups referred to as"removals." EPA generally takes remedial actions only at sites on theNational Priorities List (NPL), which currently includes approximately 1300sites. Both EPA and states can act at other sites; however, EPA providesresponsible parties the opportunity to conduct removal and remedial actionsand encourages community involvement throughout the Superfund responseprocess.
EPA's RCRA/Superfund and EPCRA Hotline, at (800) 424-9346, answersquestions and references guidance pertaining to the Superfund program.The CERCLA Hotline operates weekdays from 9:00 a.m. to 6:00 p.m., ET,excluding Federal holidays.
Emergency Planning And Community Right-To-Know Act (EPCRA)
The Superfund Amendments and Reauthorization Act (SARA) of 1986created EPCRA, also known as SARA Title III, a statute designed to improvecommunity access to information about chemical hazards and to facilitate thedevelopment of chemical emergency response plans by State and localgovernments. EPCRA required the establishment of State emergencyresponse commissions (SERCs), responsible for coordinating certainemergency response activities and for appointing local emergency planningcommittees (LEPCs).
EPCRA and the EPCRA regulations (40 CFR Parts 350-372) establish fourtypes of reporting obligations for facilities which store or manage specifiedchemicals:
EPCRA §302 requires facilities to notify the SERC and LEPC of thepresence of any "extremely hazardous substance" (the list of suchsubstances is in 40 CFR Part 355, Appendices A and B) if it has suchsubstance in excess of the substance's threshold planning quantity, and
Pharmaceutical Industry Federal Statutes and Regulations
Sector Notebook Project September 1997101
directs the facility to appoint an emergency response coordinator.
EPCRA §304 requires the facility to notify the SERC and the LEPCin the event of a release equaling or exceeding the reportable quantityof a CERCLA hazardous substance or an EPCRA extremelyhazardous substance.
EPCRA §311 and §312 require a facility at which a hazardouschemical, as defined by the Occupational Safety and Health Act, ispresent in an amount exceeding a specified threshold to submit to theSERC, LEPC and local fire department material safety data sheets(MSDSs) or lists of MSDS's and hazardous chemical inventory forms(also known as Tier I and II forms). This information helps the localgovernment respond in the event of a spill or release of the chemical.
EPCRA §313 requires manufacturing facilities included in SIC codes20 through 39, which have ten or more employees, and whichmanufacture, process, or use specified chemicals in amounts greaterthan threshold quantities, to submit an annual toxic chemical releasereport. This report, commonly known as the Form R, covers releasesand transfers of toxic chemicals to various facilities and environmentalmedia, and allows EPA to compile the national Toxic ReleaseInventory (TRI) database.
All information submitted pursuant to EPCRA regulations is publiclyaccessible, unless protected by a trade secret claim.
EPA's RCRA, Superfund and EPCRA Hotline, at (800) 424-9346, answersquestions and distributes guidance regarding the emergency planning andcommunity right-to-know regulations. The EPCRA Hotline operatesweekdays from 9:00 a.m. to 6:00 p.m., ET, excluding Federal holidays.
Clean Water Act (CWA)
The primary objective of the Federal Water Pollution Control Act, commonlyreferred to as the CWA, is to restore and maintain the chemical, physical, andbiological integrity of the nation's surface waters. Pollutants regulated underthe CWA include "priority" pollutants and various toxic pollutants;"conventional" pollutants, such as biochemical oxygen demand (BOD), totalsuspended solids (TSS), fecal coliform, oil and grease, and pH; and "non-conventional" pollutants which are pollutants not identified as eitherconventional or priority.
The CWA regulates both direct and indirect discharges. The NationalPollutant Discharge Elimination System (NPDES) program (CWA §402)

Pharmaceutical Industry Federal Statutes and Regulations
Sector Notebook Project September 1997102
controls direct discharges into navigable waters. Direct discharges or "pointsource" discharges are from sources such as pipes and sewers. NPDESpermits, issued by either EPA or an authorized State (EPA has authorized 42States to administer the NPDES program), contain industry-specific,technology-based and/or water quality-based limits, and establish pollutantmonitoring requirements. A facility that intends to discharge into the nation'swaters must obtain a permit prior to initiating its discharge. A permitapplicant must provide quantitative analytical data identifying the types ofpollutants present in the facility's effluent. The permit will then set forth theconditions and effluent limitations under which a facility may make adischarge.
A NPDES permit may also include discharge limits based on Federal or Statewater quality criteria or standards that were designed to protect designateduses of surface waters, such as supporting aquatic life or recreation. Thesestandards, unlike the technological standards, generally do not take intoaccount technological feasibility or costs. Water quality criteria and standardsvary from state to state, and site to site, depending on the use classificationof the receiving body of water. Most states follow EPA guidelines, whichpropose aquatic life and human health criteria for many of the 126 prioritypollutants.
Storm Water Discharges
In 1987 the CWA was amended to require EPA to establish a program toaddress storm water discharges. In response, EPA promulgated the NPDESstorm water permit application regulations. These regulations require thatfacilities with the following storm water discharges apply for an NPDESpermit: (1) a discharge associated with industrial activity; (2) a dischargefrom a large or medium municipal storm sewer system; or (3) a dischargewhich EPA or the State determines to contribute to a violation of a waterquality standard or is a significant contributor of pollutants to waters of theUnited States.
The term "storm water discharge associated with industrial activity" means astorm water discharge from one of 11 categories of industrial activity definedat 40 CFR 122.26. Six of the categories are defined by SIC codes while theother five are identified through narrative descriptions of the regulatedindustrial activity. If the primary SIC code of the facility is one of thoseidentified in the regulations, the facility is subject to the storm water permitapplication requirements. If any activity at a facility is covered by one of thefive narrative categories, storm water discharges from those areas where theactivities occur are subject to storm water discharge permit applicationrequirements.

Pharmaceutical Industry Federal Statutes and Regulations
Sector Notebook Project September 1997103
Those facilities/activities that are subject to storm water discharge permitapplication requirements are identified below. To determine whether aparticular facility falls within one of these categories, the regulation should beconsulted.
Category i: Facilities subject to storm water effluent guidelines, newsource performance standards, or toxic pollutant effluent standards.
Category ii: Facilities classified as SIC 24-lumber and woodproducts (except wood kitchen cabinets); SIC 26-paper and alliedproducts (except paperboard containers and products); SIC 28-chemicals and allied products (except drugs and paints); SIC 291-petroleum refining; and SIC 311-leather tanning and finishing, 32(except 323)-stone, clay, glass, and concrete, 33-primary metals,3441-fabricated structural metal, and 373-ship and boat building andrepairing.
Category iii: Facilities classified as SIC 10-metal mining; SIC 12-coal mining; SIC 13-oil and gas extraction; and SIC 14-nonmetallicmineral mining.
Category iv: Hazardous waste treatment, storage, or disposalfacilities.
Category v: Landfills, land application sites, and open dumps thatreceive or have received industrial wastes.
Category vi: Facilities classified as SIC 5015-used motor vehicleparts; and SIC 5093-automotive scrap and waste material recyclingfacilities.
Category vii: Steam electric power generating facilities.
Category viii: Facilities classified as SIC 40-railroad transportation;SIC 41-local passenger transportation; SIC 42-trucking andwarehousing (except public warehousing and storage); SIC 43-U.S.Postal Service; SIC 44-water transportation; SIC 45-transportation byair; and SIC 5171-petroleum bulk storage stations and terminals.
Category ix: Sewage treatment works.
Category x: Construction activities except operations that result inthe disturbance of less than five acres of total land area.

Pharmaceutical Industry Federal Statutes and Regulations
Sector Notebook Project September 1997104
Category xi: Facilities classified as SIC 20-food and kindredproducts; SIC 21-tobacco products; SIC 22-textile mill products; SIC23-apparel related products; SIC 2434-wood kitchen cabinetsmanufacturing; SIC 25-furniture and fixtures; SIC 265-paperboardcontainers and boxes; SIC 267-converted paper and paperboardproducts; SIC 27-printing, publishing, and allied industries; SIC 283-drugs; SIC 285-paints, varnishes, lacquer, enamels, and alliedproducts; SIC 30-rubber and plastics; SIC 31-leather and leatherproducts (except leather and tanning and finishing); SIC 323-glassproducts; SIC 34-fabricated metal products (except fabricatedstructural metal); SIC 35-industrial and commercial machinery andcomputer equipment; SIC 36-electronic and other electricalequipment and components; SIC 37-transportation equipment (exceptship and boat building and repairing); SIC 38-measuring, analyzing,and controlling instruments; SIC 39-miscellaneous manufacturingindustries; and SIC 4221-4225-public warehousing and storage.
Pretreatment Program
Another type of discharge that is regulated by the CWA is one that goes to apublicly-owned treatment works (POTWs). The national pretreatmentprogram (CWA §307(b)) controls the indirect discharge of pollutants toPOTWs by "industrial users." Facilities regulated under §307(b) must meetcertain pretreatment standards. The goal of the pretreatment program is toprotect municipal wastewater treatment plants from damage that may occurwhen hazardous, toxic, or other wastes are discharged into a sewer systemand to protect the quality of sludge generated by these plants. Discharges toa POTW are regulated primarily by the POTW itself, rather than the State orEPA.
EPA has developed technology-based standards for industrial users ofPOTWs. Different standards apply to existing and new sources within eachcategory. "Categorical" pretreatment standards applicable to an industry ona nationwide basis are developed by EPA. In addition, another kind ofpretreatment standard, "local limits," are developed by the POTW in order toassist the POTW in achieving the effluent limitations in its NPDES permit.
Regardless of whether a State is authorized to implement either the NPDESor the pretreatment program, if it develops its own program, it may enforcerequirements more stringent than Federal standards.
Spill Prevention, Control and Countermeasure Plans
The 1990 Oil Pollution Act requires that facilities that could reasonably beexpected to discharge oil in harmful quantities prepare and implement more
Pharmaceutical Industry Federal Statutes and Regulations
Sector Notebook Project September 1997105
rigorous Spill Prevention Control and Countermeasure (SPCC) Plan requiredunder the CWA (40 CFR §112.7). There are also criminal and civil penaltiesfor deliberate or negligent spills of oil. Regulations covering response to oildischarges and contingency plans (40 CFR Part 300), and Facility ResponsePlans to oil discharges (40 CFR §112.20) and for PCB transformers and PCB-containing items were revised and finalized in 1995.
EPA’s Office of Water, at (202) 260-5700, will direct callers with questionsabout the CWA to the appropriate EPA office. EPA also maintains abibliographic database of Office of Water publications which can beaccessed through the Ground Water and Drinking Water resource center, at(202) 260-7786.
Safe Drinking Water Act (SDWA)
The SDWA mandates that EPA establish regulations to protect human healthfrom contaminants in drinking water. The law authorizes EPA to developnational drinking water standards and to create a joint Federal-State systemto ensure compliance with these standards. The SDWA also directs EPA toprotect underground sources of drinking water through the control ofunderground injection of liquid wastes.
EPA has developed primary and secondary drinking water standards under itsSDWA authority. EPA and authorized states enforce the primary drinkingwater standards, which are, contaminant-specific concentration limits thatapply to certain public drinking water supplies. Primary drinking waterstandards consist of maximum contaminant level goals (MCLGs), which arenon-enforceable health-based goals, and maximum contaminant levels(MCLs), which are enforceable limits set as close to MCLGs as possible,considering cost and feasibility of attainment.
The SDWA Underground Injection Control (UIC) program (40 CFR Parts144-148) is a permit program which protects underground sources of drinkingwater by regulating five classes of injection wells. UIC permits includedesign, operating, inspection, and monitoring requirements. Wells used toinject hazardous wastes must also comply with RCRA corrective actionstandards in order to have RCRA permit by rule status, and must meetapplicable RCRA land disposal restrictions standards. The UIC permitprogram is primarily state-enforced, since EPA has authorized all but a fewstates to administer the program.
The SDWA also provides for a Federally-implemented Sole Source Aquiferprogram, which prohibits Federal funds from being expended on projects thatmay contaminate the sole or principal source of drinking water for a given

Pharmaceutical Industry Federal Statutes and Regulations
Sector Notebook Project September 1997106
area, and for a State-implemented Wellhead Protection program, designed toprotect drinking water wells and drinking water recharge areas.
EPA’s Safe Drinking Water Hotline, at (800) 426-4791, answers questionsand distributes guidance pertaining to SDWA standards. The Hotlineoperates from 9:00 a.m. through 5:30 p.m., ET, excluding Federal holidays.
Toxic Substances Control Act (TSCA)
TSCA granted EPA authority to create a regulatory framework to collect dataon chemicals in order to evaluate, assess, mitigate, and control risks whichmay be posed by their manufacture, processing, and use. TSCA provides avariety of control methods to prevent chemicals from posing unreasonablerisk.
TSCA standards may apply at any point during a chemical’s life cycle. UnderTSCA §5, EPA has established an inventory of chemical substances. If achemical is not already on the inventory, and has not been excluded by TSCA,a premanufacture notice (PMN) must be submitted to EPA prior tomanufacture or import. The PMN must identify the chemical and provideavailable information on health and environmental effects. If available dataare not sufficient to evaluate the chemicals effects, EPA can imposerestrictions pending the development of information on its health andenvironmental effects. EPA can also restrict significant new uses of chemicalsbased upon factors such as the projected volume and use of the chemical.
Under TSCA §6, EPA can ban the manufacture or distribution in commerce,limit the use, require labeling, or place other restrictions on chemicals thatpose unreasonable risks. Among the chemicals EPA regulates under §6authority are asbestos, chlorofluorocarbons (CFCs), and polychlorinatedbiphenyls (PCBs).
EPA’s TSCA Assistance Information Service, at (202) 554-1404, answersquestions and distributes guidance pertaining to Toxic Substances ControlAct standards. The Service operates from 8:30 a.m. through 4:30 p.m., ET,excluding Federal holidays.
Clean Air Act (CAA)
The CAA and its amendments, including the Clean Air Act Amendments(CAAA) of 1990, are designed to “protect and enhance the nation's airresources so as to promote the public health and welfare and the productivecapacity of the population.” The CAA consists of six sections, known asTitles, which direct EPA to establish national standards for ambient air qualityand for EPA and the States to implement, maintain, and enforce thesestandards through a variety of mechanisms. Under the CAAA, many facilities

Pharmaceutical Industry Federal Statutes and Regulations
Sector Notebook Project September 1997107
will be required to obtain permits for the first time. State and localgovernments oversee, manage, and enforce many of the requirements of theCAAA. CAA regulations appear at 40 CFR Parts 50-99.Pursuant to Title I of the CAA, EPA has established national ambient airquality standards (NAAQSs) to limit levels of "criteria pollutants," includingcarbon monoxide, lead, nitrogen dioxide, particulate matter, volatile organiccompounds (VOCs), ozone, and sulfur dioxide. Geographic areas that meetNAAQSs for a given pollutant are classified as attainment areas; those that donot meet NAAQSs are classified as non-attainment areas. Under §110 of theCAA, each State must develop a State Implementation Plan (SIP) to identifysources of air pollution and to determine what reductions are required to meetFederal air quality standards. Revised NAAQSs for particulates and ozonewere proposed in 1996 and may go into effect as early as late 1997.
Title I also authorizes EPA to establish New Source Performance Standards(NSPSs), which are nationally uniform emission standards for new stationarysources falling within particular industrial categories. NSPSs are based on thepollution control technology available to that category of industrial source.
Under Title I, EPA establishes and enforces National Emission Standards forHazardous Air Pollutants (NESHAPs), nationally uniform standards orientedtowards controlling particular hazardous air pollutants (HAPs). Title I,section 112(c) of the CAA further directed EPA to develop a list of sourcesthat emit any of 189 HAPs, and to develop regulations for these categories ofsources. To date, EPA has listed 174 categories and developed a schedule forthe establishment of emission standards. The emission standards will bedeveloped for both new and existing sources based on "maximum achievablecontrol technology (MACT)." The MACT is defined as the controltechnology achieving the maximum degree of reduction in the emission of theHAPs, taking into account cost and other factors.
Title II of the CAA pertains to mobile sources, such as cars, trucks, buses,and planes. Reformulated gasoline, automobile pollution control devices, andvapor recovery nozzles on gas pumps are a few of the mechanisms EPA usesto regulate mobile air emission sources.
Title IV of the CAA establishes a sulfur dioxide emissions program designedto reduce the formation of acid rain. Reduction of sulfur dioxide releases willbe obtained by granting to certain sources limited emissions allowances,which, beginning in 1995, will be set below previous levels of sulfur dioxidereleases.
Title V of the CAA of 1990 created a permit program for all "major sources"(and certain other sources) regulated under the CAA. One purpose of theoperating permit is to include in a single document all air emissionsrequirements that apply to a given facility. States are developing the permit

Pharmaceutical Industry Federal Statutes and Regulations
Sector Notebook Project September 1997108
programs in accordance with guidance and regulations from EPA. Once aState program is approved by EPA, permits will be issued and monitored bythat State.
Title VI of the CAA is intended to protect stratospheric ozone by phasing outthe manufacture of ozone-depleting chemicals and restrict their use anddistribution. Production of Class I substances, including 15 kinds ofchlorofluorocarbons (CFCs) and chloroform, were phased out (except foressential uses) in 1996.
EPA's Clean Air Technology Center, at (919) 541-0800, provides generalassistance and information on CAA standards. The Stratospheric OzoneInformation Hotline, at (800) 296-1996, provides general information aboutregulations promulgated under Title VI of the CAA, and EPA's EPCRAHotline, at (800) 535-0202, answers questions about accidental releaseprevention under CAA §112(r). In addition, the Clean Air TechnologyCenter’s website includes recent CAA rules, EPA guidance documents, andupdates of EPA activities (www.epa.gov/ttn then select Directory and thenCATC).

Pharmaceutical Industry Federal Statutes and Regulations
Sector Notebook Project September 1997109
VI.B. Industry Specific Requirements
The pharmaceutical industry is affected by several major federalenvironmental statutes. In addition, the industry is subject to numerous lawsand regulations from state and local governments designed to protect andimprove the nation’s health, safety, and environment. A summary of themajor federal regulations affecting the pharmaceutical industry follows.
Clean Air Act (CAA)
The original CAA authorized EPA to set limits on pharmaceutical plantemissions. Some of these new source performance standards (NSPS) applyto pharmaceutical manufacturers including those for flares (40 CFR Part 60Subpart A), and storage of volatile organic liquids (40 CFR Part 60 SubpartKb). The Clean Air Act Amendments of 1990 set control standards byindustrial sources for 41 pollutants to be met by 1995 and for 148 otherpollutants to be reached by 2003. Under the air toxics provisions of theCAAA, more sources are covered including small businesses. The HazardousOrganic National Emissions Standard for Hazardous Air Pollutants, alsoknown as HON, covers hundreds of chemicals and thousands of process units.The pharmaceutical industry is affected by standards for equipment leaks (40CFR Part 63 Subpart H), equipment leaks from pharmaceutical processesusing carbon tetrachloride or methylene chloride (40 CFR Part 63 Subpart I),and standards for emissions from halogenated solvent cleaning (40 CFR Part63 Subpart T). The HON also includes innovative provisions such asemissions trading, that offer industry flexibility in complying with the rule'semissions goals.
Specific industries are regulated under other National Emission Standards forHazardous Air Pollutants (NESHAP). These standards are being developedfor the pharmaceutical industry (see Section VI. C). Title V of the CAAintroduces a new permit system that will require all major sources to obtainoperating permits to cover all applicable control requirements. States wererequired to develop and implement the program in 1993 and the first permitswere issued in 1994. In December 1994, Schering-Plough Pharmaceutical’sfacility in Kenilworth, New Jersey, was the first in the nation to receive afacility-wide permit under this Title V program.
Clean Water Act (CWA)
The Clean Water Act, first passed in 1972 and amended in 1977 and 1987,gives EPA the authority to regulate effluents from sewage treatment works,chemical plants, and other industrial sources into waters. The act sets “bestavailable” technology standards for treatment of wastes for both direct andindirect (to a Publicly Owned Treatment Works (POTW)) discharges. In1983, EPA proposed effluent guidelines for the pharmaceutical manufacturing

Pharmaceutical Industry Federal Statutes and Regulations
Sector Notebook Project September 1997110
point source category. These guidelines are currently undergoing revisions(see Section VI. C). The implementation of the guidelines is left to the stateswho issue National Pollutant Discharge Elimination System (NPDES) permitsfor each facility.
The pharmaceutical manufacturing effluent guidelines for point sourcecategory (40 CFR Part 439) is divided into process specific effluent guidelinesas follows:
Fermentation - 40 CFR Part 439 Subpart A,Natural product extraction - 40 CFR Part 439 Subpart B, Chemical synthesis - 40 CFR Part 439 Subpart C, Mixing, compounding, formulation - 40 CFR Part 439 Subpart D, and Research - 40 CFR Part 439 Subpart E.
Each Subpart consists of effluent limitations representing the amount ofeffluent reduction possible by using either best practicable controltechnologies (BPT), best conventional pollution technologies (BCT), or bestavailable technologies (BAT). BPTs are used for discharges from existingpoint sources to control conventional and non-conventional pollutants as wellas some priority pollutants. BCTs are used for discharges from point sourcesto control conventional pollutants. Finally, BATs are used to control prioritypollutants and non-conventional pollutants when directly discharged into thenation’s waters. Standards are provided for cyanide, biologic oxygen demand(BOD), chemical oxygen demand (COD), total suspended solids (TSS) andpH. Guidelines for BCT and BAT for the research category, new sourceperformance standards (NSPS), and pre-treatment standards for new andexisting sources, are being revised and are in the final rule stage (see SectionVI. C).
The Storm Water Rule (40 CFR §122.26) requires pharmaceutical facilitiesdischarging storm water associated with industrial activities (40 CFR §122.26(b)(14)(xi)) to apply for storm water permits.
Safe Drinking Water Act Underground Injection Control Program
The federal Underground Injection Control (UIC) program was establishedunder the provisions of the SDWA of 1974. This federal program prescribesminimum requirements for effective state UIC programs. Since ground wateris a major source of drinking water in the United States, the UIC programrequirements were designed to prevent contamination of UndergroundSources of Drinking Water (USDW) resulting from the operation of injectionwells. A USDW is defined as an “aquifer or its portion which supplies anypublic water system or contains a sufficient quantity of ground water tosupply a public water system, or contains less than 10,000 milligrams per litertotal dissolved solids and is not an exempted aquifer.”
Pharmaceutical Industry Federal Statutes and Regulations
Sector Notebook Project September 1997111
Since the passage of the Safe Drinking Water Act, state and federal regulatoryagencies have modified existing programs or developed new strategies toprotect ground water by establishing regulations to control the permitting,construction, operation, monitoring, and closure of injection wells. InMichigan, where all five of the pharmaceutical industry’s injection wells arelocated, the state has not sought authority to implement the federal UICprogram but does regulate use of injection wells through state law. The EPAis the responsible regulatory agency for implementing the UIC program in thestate.
The five wells used by the pharmaceutical companies in Michigan are termedhazardous Class I injection wells since they inject hazardous waste intoformations below the USDW. The process of selecting a site for a Class Idisposal well involves evaluating many conditions with the most importantbeing the determination that the underground formations possess the naturalability to contain and isolate the injected waste. A detailed study is conductedto determine the suitability of the underground formation for disposal. Thereceiving formation must be far below any usable ground waters and beseparated from them by confining layers of rock, which prevent fluidmigration into the ground water. The injection zone in the receivingformation must be of sufficient size and have sufficient pore space to acceptand maintain the injected wastes.
Class I injection wells are regulated in 40 CFR Part 146, Subpart G. SubpartG requires facilities with injection wells to submit operating reports and tosubmit plans for testing and monitoring the wastes, hydrogeologic conditions,condition of the well materials, mechanical integrity of the well, and ambientconditions in adjacent aquifers. Subpart G also sets criteria for siting ClassI hazardous waste injection wells, construction requirements, correctiveaction procedures, operating requirements, and closure plans.
Resource Conservation and Recovery Act (RCRA)
The Resource Conservation and Recovery Act (RCRA) was enacted in 1976to address problems related to hazardous and solid waste management.RCRA gives EPA the authority to establish a list of solid and hazardouswastes and to establish standards and regulations for the treatment, storage,and disposal of these wastes. Regulations in Subtitle C of RCRA address theidentification, generation, transportation, treatment, storage, and disposal ofhazardous wastes. These regulations are found in 40 CFR Part 124 and CFRParts 260-279. Under RCRA, persons who generate waste must determinewhether the waste is defined as solid waste or hazardous waste. Solid wastesare considered hazardous wastes if they are listed by EPA as hazardous or ifthey exhibit characteristics of a hazardous waste: toxicity, ignitability,corrosivity, or reactivity.

Pharmaceutical Industry Federal Statutes and Regulations
Sector Notebook Project September 1997112
Products, intermediates, and off-specification products potentially generatedat pharmaceutical facilities that are considered hazardous wastes are listed in40 CFR Part 261.33(f). Some of the handling and treatment requirements forRCRA hazardous waste generators are covered under 40 CFR Part 262 andinclude the following: determining what constitutes a RCRA hazardous waste(Subpart A); manifesting (Subpart B); packaging, labeling, and accumulationtime limits (Subpart C); and record keeping and reporting (Subpart D).
Many pharmaceutical facilities store some hazardous wastes at the facility formore than 90 days, and are therefore, a storage facility under RCRA. Storagefacilities are required to have a RCRA treatment, storage, and disposal facility(TSDF) permit (40 CFR Part 262.34). Some pharmaceutical facilities areconsidered TSDF facilities and are subject to the following regulationscovered under 40 CFR Part 264: contingency plans and emergencyprocedures (40 CFR Part 264 Subpart D); manifesting, record keeping, andreporting (40 CFR Part 264 Subpart E); use and management of containers(40 CFR Part 264 Subpart I); tank systems (40 CFR Part 264 Subpart J);surface impoundments (40 CFR Part 264 Subpart K); land treatment (40 CFRPart 264 Subpart M); corrective action of hazardous waste releases (40 CFRPart 264 Subpart S); air emissions standards for process vents of processesthat process or generate hazardous wastes (40 CFR Part 264 Subpart AA);emissions standards for leaks in hazardous waste handling equipment (40 CFRPart 264 Subpart BB); and emissions standards for containers, tanks, andsurface impoundments that contain hazardous wastes (40 CFR Part 264Subpart CC).
A number of RCRA wastes have been prohibited from land disposal unlesstreated to meet specific standards under the RCRA Land Disposal Restriction(LDR) program. The wastes covered by the RCRA LDRs are listed in 40CFR Part 268 Subpart C and include a number of wastes commonly generatedat pharmaceutical facilities. Standards for the treatment and storage ofrestricted wastes are described in Subparts D and E, respectively.
Many pharmaceutical manufacturing facilities are also subject to theunderground storage tank (UST) program (40 CFR Part 280). The USTregulations apply to facilities that store either petroleum products orhazardous substances (except hazardous waste) identified under theComprehensive Environmental Response, Compensation, and Liability Act.UST regulations address design standards, leak detection, operating practices,response to releases, financial responsibility for releases, and closurestandards.

Pharmaceutical Industry Federal Statutes and Regulations
Sector Notebook Project September 1997113
Comprehensive Environmental Response Compensation and Liability Act (CERCLA)
The Comprehensive Environmental Response Compensation and Liability Actof 1980 (CERCLA) and the Superfund Amendments and Reauthorization Actof 1986 (SARA) provide the basic legal framework for the federal“Superfund” program to clean up abandoned hazardous waste sites (40 CFRPart 305). The 1986 SARA legislation extended these taxes for five years andadopted a new broad-based corporate environmental tax, applicable to theallied chemicals (SIC 28) industry, which includes the pharmaceuticalsindustry. In 1990, Congress passed a simple reauthorization that did notsubstantially change the law but extended the program authority until 1994and the taxing authority until the end of 1995. A comprehensivereauthorization was considered in 1994, but not passed. Since the expirationof the taxing authority on December 31, 1995, taxes for Superfund have beentemporarily suspended. The taxes can only be reinstated by reauthorizationof Superfund or an omnibus reconciliation act which could specificallyreauthorize taxing authority. The allied chemical industry pays about $300million a year in Superfund chemical feedstock taxes. Superfund’s liabilitystandard is such that Potentially Responsible Parties (PRPs) may pay theentire cost of clean-up at sites, even though they may be responsible for onlya fraction of the waste.
Title III of the 1986 SARA amendments (also known as Emergency Responseand Community Right-to-Know Act, EPCRA) requires all manufacturingfacilities, including pharmaceutical facilities, to report annual information tothe public about stored toxic substances as well as release of these substancesinto the environment (42 U.S.C. 9601). This is known as the Toxic ReleaseInventory (TRI). EPCRA also establishes requirements for federal, state, andlocal governments regarding emergency planning. In 1994, over 300 morechemicals were added to the list of chemicals for which reporting is required.
Toxic Substances Control Act (TSCA)
The pharmaceutical industry is specifically excluded from some of therequirements of TSCA. Any drugs manufactured, processed, and distributedin commerce are excluded by definition from the Inventory ReportingRegulations (40 CFR Part 710.4(c)) and the Pre-Manufacturing Noticerequirements (40 CFR 720.30(a)) of TSCA.

Pharmaceutical Industry Federal Statutes and Regulations
Sector Notebook Project September 1997114
VI.C. Pending and Proposed Regulatory Requirements
Clean Air Act (CAA)
Under the Clean Air Act, National Emissions Standards for Hazardous AirPollutants (NESHAPS) are being developed for the pharmaceuticalmanufacturing industry.
Clean Water Act (CWA)
As part of the Clean Water Act revision process, the effluent guidelines forthe pharmaceutical industry (40 CFR 439) are currently being revised andreviewed. A major part of the review considers the inclusion of limitationsfor toxic and non-conventional volatile organic pollutants. Additionally, the1983 New Source Performance Standards (NSPS) for conventional pollutantswill also be reevaluated.

Pharmaceutical Industry Federal Statutes and Regulations
Sector Notebook Project September 1997115
VI.D. Other Federal Regulations Affecting the Pharmaceutical Industry
Food and Drug Administration (FDA)
The Food and Drug Administration (FDA) is part of the Department ofHealth and Human Services. FDA has the statutory authority to regulate awide range of products such as prescription and over-the-counter drugs,foods, biologics (e.g., blood plasma, vaccines), medical devices (e.g., needles,heart valves), veterinary drugs, cosmetics and consumer goods that emitradiation. This authority has been granted to FDA by Congress under variouslaws including the Federal Food, Drug and Cosmetic Act and the PublicHealth Service Act.
There are five Centers within FDA that deal with FDA-regulated articles:Center for Drug Evaluation and Research (CDER), Center for BiologicsEvaluation and Research (CBER), Center for Veterinary Medicine (CVM),Center for Devices and Radiological Health (CDRH), and Center for FoodSafety and Applied Nutrition (CFSAN). The Centers review scientificinformation provided by persons wishing to place FDA-regulated articles intointerstate commerce in order to determine whether regulatory requirementsare met. FDA has offices throughout the U.S. where testing of FDA-regulated articles is performed and where investigators are based.Investigators go to U.S. and foreign manufacturing facilities and other typesof facilities involved in FDA-regulated activities to verify that they are incompliance with FDA regulations.
FDA’s general approach to regulating various articles is similar, however, dueto the diverse nature of these products, there are regulatory requirementstailored to each type of FDA-regulated article. Below is a summary ofinformation relating to the type of products regulated by CDER. Additionalinformation on other FDA-regulated articles may be located in 21 CFR or bycontacting FDA directly.
The manufacturing facilities that produce drugs for human use are regulatedby CDER. The methods, facilities, and controls used for the manufacture,processing, and packing of a drug are reviewed by FDA to determine whetherthey are adequate to ensure and preserve the drug’s identity, strength, qualityand purity. These characteristics are critical to ensure the safety and efficacyof a drug for human use. CDER conducts a scientific review ofmanufacturing methods and process controls for the drug substance and drugproduct. Field investigators conduct on-site reviews to verify the accuracyof the information submitted to CDER and to determine facility compliancewith FDA’s Good Manufacturing Practices (GMPs).
FDA’s review of a pharmaceutical facility does not include auditingcompliance with regulations pertaining to the protection of the environment.

Pharmaceutical Industry Federal Statutes and Regulations
Sector Notebook Project September 1997116
However, in accordance with the National Environmental Policy Act of 1969(NEPA), which requires all Federal agencies to assess the environmentalimpacts of their actions, CDER has integrated the consideration of theenvironmental impacts of approving drug product applications into itsregulatory process (21 CFR Part 25). When an environmental review underNEPA is required, the review focuses on the environmental impacts ofconsumer use and disposal of the drug and is based on information submittedby the manufacturers, or on a manufacturer’s certification that an applicationfalls within an established category of applications excluded from therequirement to submit information.
After the original approval from CDER, an applicant may wish or need tomake changes in the method of manufacture, testing, etc. described in theirapplication. An applicant is required to notify FDA about each change in eachcondition established in an approved application (e.g., ingredients, solvents,processes) beyond the variations already provided for in the application (21CFR §314.70(a)). Depending on the type of change, the applicant notifiesFDA about it in (1) a supplement requiring FDA approval before the changeis made (§314.70(b)), (2) a supplement for changes that may be made beforeFDA approval (§314.70(c)), or (3) an annual report (§314.70(d)). Changesrequiring FDA approval before they are made may include changes in thesynthesis of the drug product or changes in solvents; the addition or deletionof an ingredient; and changes in the method of manufacture or in-processcontrol of the drug product manufacturing process. The regulations specifythe method of reporting certain changes. CDER also provides additionalguidance on the method of reporting changes and documentation needed tosupport changes in guidance for industry (e.g., “Guidance for Industry,Immediate Release Solid Oral Dosage Forms, Scale-Up and Post ApprovalChanges: Chemistry Manufacturing and Controls, In Vitro DissolutionTesting and In Vivo Bioequivalence Documentation,” November 1995).
The changes in a manufacturing process that a manufacturer may wish toundertake to prevent or reduce pollution would most likely be reported in asupplement requiring FDA approval before the change could be made (e.g.,§§314.70(b)(1)(iv) and 314.70(b)(2)(v)). Changes such as these often requirethe manufacturer, before submitting the supplemental application to the FDA,to generate data that demonstrate the proposed change does not adverselyaffect the identity, strength, quality or purity of the drug. An applicant mayask FDA to expedite its review if a delay in making the change would imposean extraordinary hardship on the applicant (§314.70(b)). For changes relatingto pollution prevention, “expedited review” is typically reserved for thosechanges mandated by the Federal, State or local environmental protectionagencies, which must be accomplished within a specified time frame. Thegranting of an expedited review does not change the type of documentationthat needs to be submitted to CDER to support the change.

Pharmaceutical Industry Federal Statutes and Regulations
Sector Notebook Project September 1997117
Summary of FDA Regulations Applicable to the Pharmaceutical Industry
Statutory Authority
The Federal Food Drug and Cosmetic Act, principally Sections 201, 301, 501,502, 503, 505, 506, 507, 512, 701, 704.
CDER Regulations
21 CFR Parts 300-499
Manufacturing Information Submittal
Manufacturing Information Submitted to CDER in Investigational New DrugApplications (INDs), New Drug Applications (NDAs), AntibioticApplications, Abbreviated New Drug Applications (ANDAs), andAbbreviated Antibiotic Drug Applications (AADAs)
INDs: §312.23(a)(7)(i)
Other applications: §§314.50(d)(1)(i) and 314.50(d)(1)(ii)(a)
Reporting Changes in Manufacturing Methods and Controls to CDER
IND Information amendments: §312.31
Supplements and other changes to an approved application: §314.70
Good Manufacturing Practices (GMPs)
Current Good Manufacturing Practice in Manufacturing, Processing, Packing,or Holding of Drugs; General, Part 210
Current Good Manufacturing Practice for Finished Pharmaceuticals: Part 211

Pharmaceutical Industry Federal Statutes and Regulations
Sector Notebook Project September 1997118
VI.E. Other Statutes and Regulations Affecting the Pharmaceutical Industry
State Statutes and Regulations
Most states have long-established broad-based environmental regulatoryprograms. Many of these regulatory schemes were enacted to implementfederal programs and have been granted local primacy by the USEPA.Generally, the state programs are allowed to be more restrictive than federalrequirements and, in some cases, they are.
Some states with high concentrations of pharmaceutical manufacturingfacilities, have their own regulations pertaining specifically to the industry.For example, both New York and New Jersey have Reasonably AchievableControl Technology (RACT) requirements for process specific volatileorganic compound (VOC) emissions. Other states may have similarrequirements under their own State Implementation Plans (SIPs).
International Standards
The U.S. Pharmaceutical industry is largely an international industry in whichmany companies have manufacturing facilities and sales and distributionoperations in countries other than the U.S. In addition to U.S. federal statutesand regulations there are international laws, regulations, treaties, conventionsand initiatives which are drivers of the environmental programs ofpharmaceutical companies. The Basel Convention, ISO 14000 standards, theenvironmental requirements of NAFTA, and the evolving European UnionDirectives and Regulations are a few examples of important internationalenvironmental standards and programs which affect this industry.
Drug Enforcement Administration Regulations
Pharmaceutical manufacturing operations may also be regulated under theControlled Substances Act. This Act regulates the manufacture, distribution,and dispensing of controlled substances and is enforced by the DrugEnforcement Administration (DEA). Examples of pharmaceutical productsregulated under this Act include Demerol, Percodan, Ritalin, Valium, andDarvon. A list of controlled substances can be found in l1308 of 21 CFR.

Pharmaceutical Industry Federal Statutes and Regulations
Sector Notebook Project September 1997119
The statute provides “closed” system for virtually every person wholegitimately handles controlled substances, other than the ultimate user. Asa means of controlling the distribution of regulated products, DEA sets quotaslimiting the quantities which may be manufactured or produced to thatamount which is necessary to meet the legitimate needs of the United States.The regulations set specific requirements for how such compounds arehandled and stored at a manufacturing facility. In addition, when disposed of,these substances must be destroyed in the presence of DEA personnel inaccordance with the regulations found in 21 CFR, Section 1307.21.

Page 116 intentionally left blank.
Pharmaceutical Industry Compliance and Enforcement History
Sector Notebook Project September 1997121
VII. COMPLIANCE AND ENFORCEMENT HISTORY
Background
Until recently, EPA has focused much of its attention on measuringcompliance with specific environmental statutes. This approach allows theAgency to track compliance with the Clean Air Act, the ResourceConservation and Recovery Act, the Clean Water Act, and otherenvironmental statutes. Within the last several years, the Agency has begunto supplement single-media compliance indicators with facility-specific,multimedia indicators of compliance. In doing so, EPA is in a better positionto track compliance with all statutes at the facility level, and within specificindustrial sectors.
A major step in building the capacity to compile multimedia data for industrialsectors was the creation of EPA's Integrated Data for Enforcement Analysis(IDEA) system. IDEA has the capacity to “read into” the Agency's single-media databases, extract compliance records, and match the records toindividual facilities. The IDEA system can match Air, Water, Waste,Toxics/Pesticides/EPCRA, TRI, and Enforcement Docket records for a givenfacility, and generate a list of historical permit, inspection, and enforcementactivity. IDEA also has the capability to analyze data by geographic area andcorporate holder. As the capacity to generate multimedia compliance dataimproves, EPA will make available more in-depth compliance andenforcement information. Additionally, sector-specific measures of success forcompliance assistance efforts are under development.
Compliance and Enforcement Profile Description
Using inspection, violation, and enforcement data from the IDEA system, thissection provides information regarding the historical compliance andenforcement activity of this sector. In order to mirror the facility universereported in the Toxic Chemical Profile, the data reported within this sectionconsists of records only from the TRI reporting universe. With this decision,the selection criteria are consistent across sectors with certain exceptions.For the sectors that do not normally report to the TRI program, data havebeen provided from EPA's Facility Indexing System (FINDS) which tracksfacilities in all media databases. Please note, in this section, EPA does notattempt to define the actual number of facilities that fall within each sector.Instead, the section portrays the records of a subset of facilities within thesector that are well defined within EPA databases.
As a check on the relative size of the full sector universe, most notebookscontain an estimated number of facilities within the sector according to theBureau of Census (See Section II). With sectors dominated by smallbusinesses, such as metal finishers and printers, the reporting universe within

Pharmaceutical Industry Compliance and Enforcement History
a EPA Regions include the following states: I (CT, MA, ME, RI, NH, VT); II (NJ, NY, PR, VI); III (DC, DE, MD,PA, VA, WV); IV (AL, FL, GA, KY, MS, NC, SC, TN); V (IL, IN, MI, MN, OH, WI); VI (AR, LA, NM, OK,TX); VII (IA, KS, MO, NE); VIII (CO, MT, ND, SD, UT, WY); IX (AZ, CA, HI, NV, Pacific Trust Territories); X(AK, ID, OR, WA).
Sector Notebook Project September 1997122
the EPA databases may be small in comparison to Census data. However, thegroup selected for inclusion in this data analysis section should be consistentwith this sector's general makeup.
Following this introduction is a list defining each data column presentedwithin this section. These values represent a retrospective summary ofinspections and enforcement actions, and solely reflect EPA, State, and localcompliance assurance activities that have been entered into EPA databases.To identify any changes in trends, the EPA ran two data queries, one for thefive calendar years (April 1, 1992 to March 31, 1997) and the other for themost recent twelve-month period (April 1, 1996 to March 31, 1997). Thefive-year analysis gives an average level of activity for that period forcomparison to the more recent activity.
Because most inspections focus on single-media requirements, the dataqueries presented in this section are taken from single media databases. Thesedatabases do not provide data on whether inspections are state/local or EPA-led. However, the table breaking down the universe of violations does givethe reader a crude measurement of the EPA's and states' efforts within eachmedia program. The presented data illustrate the variations across EPARegions for certain sectors.a This variation may be attributable to state/localdata entry variations, specific geographic concentrations, proximity topopulation centers, sensitive ecosystems, highly toxic chemicals used inproduction, or historical noncompliance. Hence, the exhibited data do notrank regional performance or necessarily reflect which regions may have themost compliance problems.
Compliance and Enforcement Data Definitions
General Definitions
Facility Indexing System (FINDS) -- this system assigns a common facilitynumber to EPA single-media permit records. The FINDS identificationnumber allows EPA to compile and review all permit, compliance,enforcement and pollutant release data for any given regulated facility.
Integrated Data for Enforcement Analysis (IDEA) -- is a data integrationsystem that can retrieve information from the major EPA program officedatabases. IDEA uses the FINDS identification number to link separate datarecords from EPA’s databases. This allows retrieval of records from across

Pharmaceutical Industry Compliance and Enforcement History
Sector Notebook Project September 1997123
media or statutes for any given facility, thus creating a "master list” ofrecords for that facility. Some of the data systems accessible through IDEAare: AIRS (Air Facility Indexing and Retrieval System, Office of Air andRadiation), PCS (Permit Compliance System, Office of Water), RCRIS(Resource Conservation and Recovery Information System, Office of SolidWaste), NCDB (National Compliance Data Base, Office of Prevention,Pesticides, and Toxic Substances), CERCLIS (Comprehensive Environmentaland Liability Information System, Superfund), and TRIS (Toxic ReleaseInventory System). IDEA also contains information from outside sourcessuch as Dun and Bradstreet and the Occupational Safety and HealthAdministration (OSHA). Most data queries displayed in notebook sectionsIV and VII were conducted using IDEA.
Data Table Column Heading Definitions
Facilities in Search -- are based on the universe of TRI reporters within thelisted SIC code range. For industries not covered under TRI reportingrequirements (metal mining, nonmetallic mineral mining, electric powergeneration, ground transportation, water transportation, and dry cleaning), orindustries in which only a very small fraction of facilities report to TRI (e.g.,printing), the notebook uses the FINDS universe for executing data queries.The SIC code range selected for each search is defined by each notebook'sselected SIC code coverage described in Section II.
Facilities Inspected --- indicates the level of EPA and state agencyinspections for the facilities in this data search. These values show whatpercentage of the facility universe is inspected in a one-year or five-yearperiod.
Number of Inspections -- measures the total number of inspectionsconducted in this sector. An inspection event is counted each time it isentered into a single media database.
Average Time Between Inspections -- provides an average length of time,expressed in months, between compliance inspections at a facility within thedefined universe.
Facilities with One or More Enforcement Actions -- expresses the numberof facilities that were the subject of at least one enforcement action within thedefined time period. This category is broken down further into federal andstate actions. Data are obtained for administrative, civil/judicial, and criminalenforcement actions. Administrative actions include Notices of Violation(NOVs). A facility with multiple enforcement actions is only counted oncein this column, e.g., a facility with 3 enforcement actions counts as 1 facility.
Pharmaceutical Industry Compliance and Enforcement History
Sector Notebook Project September 1997124
Total Enforcement Actions -- describes the total number of enforcementactions identified for an industrial sector across all environmental statutes. Afacility with multiple enforcement actions is counted multiple times, e.g., afacility with 3 enforcement actions counts as 3.
State Lead Actions -- shows what percentage of the total enforcementactions are taken by state and local environmental agencies. Varying levelsof use by states of EPA data systems may limit the volume of actionsrecorded as state enforcement activity. Some states extensively reportenforcement activities into EPA data systems, while other states may use theirown data systems.
Federal Lead Actions -- shows what percentage of the total enforcementactions are taken by the United States Environmental Protection Agency.This value includes referrals from state agencies. Many of these actions resultfrom coordinated or joint state/federal efforts.
Enforcement to Inspection Rate -- is a ratio of enforcement actions toinspections, and is presented for comparative purposes only. This ratio is arough indicator of the relationship between inspections and enforcement. Itrelates the number of enforcement actions and the number of inspections thatoccurred within the one-year or five-year period. This ratio includes theinspections and enforcement actions reported under the Clean Water Act(CWA), the Clean Air Act (CAA) and the Resource Conservation andRecovery Act (RCRA). Inspections and actions from the TSCA/FIFRA/EPCRA database are not factored into this ratio because most of the actionstaken under these programs are not the result of facility inspections. Also,this ratio does not account for enforcement actions arising from non-inspection compliance monitoring activities (e.g., self-reported waterdischarges) that can result in enforcement action within the CAA, CWA, andRCRA.
Facilities with One or More Violations Identified -- indicates thepercentage of inspected facilities having a violation identified in one of thefollowing data categories: In Violation or Significant Violation Status(CAA); Reportable Noncompliance, Current Year Noncompliance, SignificantNoncompliance (CWA); Noncompliance and Significant Noncompliance(FIFRA, TSCA, and EPCRA); Unresolved Violation and Unresolved HighPriority Violation (RCRA). The values presented for this column reflect theextent of noncompliance within the measured time frame, but do notdistinguish between the severity of the noncompliance. Violation status maybe a precursor to an enforcement action, but does not necessarily indicate thatan enforcement action will occur.

Pharmaceutical Industry Compliance and Enforcement History
Sector Notebook Project September 1997125
Media Breakdown of Enforcement Actions and Inspections -- fourcolumns identify the proportion of total inspections and enforcement actionswithin EPA Air, Water, Waste, and FIFRA/TSCA/EPCRA databases. Eachcolumn is a percentage of either the "Total Inspections,” or the "TotalActions” column.
VII.A. Pharmaceutical Industry Compliance History
Table 20 provides an overview of the reported compliance and enforcementdata for the pharmaceutical industry over the past five years (April 1992 toApril 1997). These data are also broken out by EPA Region therebypermitting geographical comparisons. A few points evident from the data arelisted below.
&Region II has more than twice the number of pharmaceutical facilities thanany other Region and more than half of all inspections nationally were carriedout in this Region. The high rate of inspections in relation to the number offacilities is reflected in the Region’s relatively low average time betweeninspections (6 months)
&Regions VI had only five pharmaceutical facilities (identified by the IDEAsystem) and a relatively high average time between inspections. However, inthe past five years four enforcement actions were brought against facilities inthe Region, giving it one of the highest enforcement to inspection rates.
&Region X had only one pharmaceutical facility identified by the IDEAsystem. In the past five years this facility was inspected twice and had twoenforcement action brought against it.

Pharm
aceutical IndustryC
ompliance and E
nforcement H
istory
Secto
r No
teboo
k Pro
jectS
eptember 1997
126
Table 20: Five-Year Enforcement and Compliance Summary for the Pharmaceutical Industry
A B C D E F G H I JRegion Facilities
inSearch
FacilitiesInspecte
d
Number ofInspections
AverageMonthsBetween
Inspections
Facilitieswith 1 or
MoreEnforcement
Actions
TotalEnforcemen
t Actions
PercentStateLead
Actions
PercentFederal
LeadActions
Enforcementto Inspection
Rate
I 8 5 11 44 0 0 0% 0% --
II 60 53 624 6 21 95 84% 16% 0.15
III 18 16 111 10 3 3 100% 0% 0.03
IV 24 17 227 6 4 12 83% 17% 0.05
V 22 16 143 9 4 5 60% 40% 0.03
VI 5 5 17 18 1 4 0% 100% 0.24
VII 12 8 37 19 1 1 100% 0% 0.03
VIII 6 5 22 16 0 0 0% 0% --
IX 8 3 7 69 0 0 0% 0% --
X 1 1 2 30 1 2 50% 50% 1.00
TOTAL
164 129 1,201 8 35 122 80% 20% 0.10

Pharmaceutical Industry Compliance and Enforcement History
Sector Notebook Project September 1997127
VII.B. Comparison of Enforcement Activity Between Selected Industries
Tables 21 and 22 allow the compliance history of the pharmaceutical industryto be compared with the other industries covered by the industry sectornotebooks. Comparisons between Tables 21 and 22 permit the identificationof trends in compliance and enforcement records of the industry by comparingdata covering the last five years to that of the past year. Some points evidentfrom the data are listed below.
&The pharmaceutical industry had one of the highest inspection rates asindicated by its relatively low average time between inspections (8 months)compared to other industries.
&Compared to other sectors, the pharmaceutical industry had a relatively highenforcement to inspection rate (0.07) and a relatively high percent of facilitiesinspected with violations (105 percent).
Tables 23 and 24 provide a more in-depth comparison between thepharmaceutical industry and other sectors by breaking out the compliance andenforcement data by environmental statute. As in Tables 21 and 22, the datacover the last five years (Table 23) and the previous year (Table 24) tofacilitate the identification of recent trends. A few points evident from thedata are listed below.
&Over the past five years, about 80 percent of the industry’s inspections werefor CAA and RCRA. Over the past year CAA and RCRA inspectionsaccounted for almost 90 percent of inspections. This trend is primarily dueto an increase in CAA inspections and a decrease in CWA andFIFRA/TSCA/EPCRA/Other inspections.
&The percentage of CAA enforcement actions increased from 49 percent overthe past five years to 71 percent in the past year. At the same time thepercentage of CWA enforcement actions decreased from 25 percent to 14percent.

Pharmaceutical Industry Compliance and Enforcement History
Sector Notebook Project September 1997128
Tab
le 2
1: F
ive-
Yea
r E
nfor
cem
ent
and
Com
plia
nce
Sum
mar
y fo
r S
elec
ted
Indu
strie
s
AB
CD
EF
GH
IJ
Indu
stry
Sec
tor
Fac
ilitie
sin
Sea
rch
Fac
ilitie
sIn
spec
ted
Num
ber
ofIn
spec
tions
Ave
rage
Mon
ths
Bet
wee
nIn
spec
tions
Fac
ilitie
s w
ith 1
or M
ore
Enf
orce
men
tA
ctio
ns
Tot
alE
nfor
cem
ent
Act
ions
Per
cent
Sta
te L
ead
Act
ions
Per
cent
Fed
eral
Lead
Act
ions
Enf
orce
men
tto
Insp
ectio
nR
ate
Met
al M
inin
g1
,23
23
78
1,6
00
46
63
11
15
3%
47
%0
.07
Coa
l Min
ing
3,2
56
74
13
,74
85
28
81
32
89
%1
1%
0.0
4
Oil
and
Ga
s E
xtra
ctio
n4
,67
61
,90
26
,07
14
61
49
30
97
9%
21
%0
.05
Non
-Met
alli
c M
iner
al M
inin
g5
,25
62
,80
31
2,8
26
25
38
56
22
77
%2
3%
0.0
5
Tex
tiles
35
52
67
1,4
65
15
53
83
90
%1
0%
0.0
6
Lum
ber
and
Woo
d7
12
47
32
,76
71
51
34
26
57
0%
30
%0
.10
Fu
rnitu
re4
99
38
62
,37
91
36
59
18
1%
19
%0
.04
Pu
lp a
nd P
ape
r4
84
43
04
,63
06
15
04
78
80
%2
0%
0.1
0
Prin
ting
5,8
62
2,0
92
7,6
91
46
23
84
28
88
%1
2%
0.0
6
Inor
gani
c C
hem
ica
ls4
41
28
63
,08
79
89
23
57
4%
26
%0
.08
Res
ins
and
Ma
nma
de F
iber
s3
29
26
32
,43
08
93
21
97
6%
24
%0
.09
Pha
rmac
eutic
als
164
129
1,20
18
3512
280
%20
%0.
10
Org
ani
c C
hem
ica
ls4
25
35
54
,29
46
15
34
68
65
%3
5%
0.1
1
Agr
icu
ltura
l Che
mic
als
26
31
64
1,2
93
12
47
10
27
4%
26
%0
.08
Pet
role
um
Ref
inin
g1
56
14
83
,08
13
12
47
63
68
%3
2%
0.2
5
Ru
bber
and
Pla
stic
1,8
18
98
14
,38
32
51
78
27
68
2%
18
%0
.06
Sto
ne, C
lay,
Gla
ss a
nd C
oncr
ete
61
53
88
3,4
74
11
97
27
77
5%
25
%0
.08
Iron
and
Ste
el3
49
27
54
,47
65
12
13
05
71
%2
9%
0.0
7
Met
al C
ast
ings
66
94
24
2,5
35
16
11
31
91
71
%2
9%
0.0
8
Non
ferr
ous
Met
als
20
31
61
1,6
40
76
81
74
78
%2
2%
0.1
1
Fa
bric
ate
d M
eta
l Pro
duct
s2
,90
61
,85
87
,91
42
23
65
60
07
5%
25
%0
.08
Ele
ctro
nics
1,2
50
86
34
,50
01
71
50
25
18
0%
20
%0
.06
Au
tom
obile
Ass
embl
y1
,26
09
27
5,9
12
13
25
34
13
82
%1
8%
0.0
7
Shi
pbu
ildin
g a
nd R
epa
ir4
43
72
43
92
03
28
4%
16
%0
.13
Gro
und
Tra
nspo
rta
tion
7,7
86
3,2
63
12
,90
43
63
75
77
48
4%
16
%0
.06
Wa
ter
Tra
nspo
rta
tion
51
41
92
81
63
83
67
06
1%
39
%0
.09
Air
Tra
nspo
rta
tion
44
42
31
97
32
74
89
78
8%
12
%0
.10
Fos
sil F
uel
Ele
ctric
Pow
er3
,27
02
,16
61
4,2
10
14
40
37
89
76
%2
4%
0.0
6
Dry
Cle
ani
ng6
,06
32
,36
03
,81
39
55
56
69
5%
5%
0.0
2

Pharm
aceutical IndustryC
ompliance and E
nforcement H
istory
Secto
r No
teboo
k Pro
jectS
eptember 1997
129
Table 22: One-Year Enforcement and Compliance Summary for Selected Industries
A B C D E F G HFacilities with 1 or More
ViolationsFacilities with 1 or more
Enforcement Actions TotalEnforcement
ActionsIndustry SectorFacilities in
SearchFacilitiesInspected
Number ofInspections Number Percent* Number Percent*
Enforcement toInspection Rate
Metal Mining 1,232 142 211 102 72% 9 6% 10 0.05
Coal Mining 3,256 362 765 90 25% 20 6% 22 0.03
Oil and Gas Extraction 4,676 874 1,173 127 15% 26 3% 34 0.03
Non-Metallic Mineral Mining 5,256 1,481 2,451 384 26% 73 5% 91 0.04
Textiles 355 172 295 96 56% 10 6% 12 0.04
Lumber and Wood 712 279 507 192 69% 44 16% 52 0.10
Furniture 499 254 459 136 54% 9 4% 11 0.02
Pulp and Paper 484 317 788 248 78% 43 14% 74 0.09
Printing 5,862 892 1,363 577 65% 28 3% 53 0.04
Inorganic Chemicals 441 200 548 155 78% 19 10% 31 0.06
Resins and Manmade Fibers 329 173 419 152 88% 26 15% 36 0.09
Pharmaceuticals 164 80 209 84 105% 8 10% 14 0.07
Organic Chemicals 425 259 837 243 94% 42 16% 56 0.07
Agricultural Chemicals 263 105 206 102 97% 5 5% 11 0.05
Petroleum Refining 156 132 565 129 98% 58 44% 132 0.23
Rubber and Plastic 1,818 466 791 389 83% 33 7% 41 0.05
Stone, Clay, Glass and Concrete 615 255 678 151 59% 19 7% 27 0.04
Iron and Steel 349 197 866 174 88% 22 11% 34 0.04
Metal Castings 669 234 433 240 103% 24 10% 26 0.06
Nonferrous Metals 203 108 310 98 91% 17 16% 28 0.09
Fabricated Metal 2,906 849 1,377 796 94% 63 7% 83 0.06
Electronics 1,250 420 780 402 96% 27 6% 43 0.06
Automobile Assembly 1,260 507 1,058 431 85% 35 7% 47 0.04
Shipbuilding and Repair 44 22 51 19 86% 3 14% 4 0.08
Ground Transportation 7,786 1,585 2,499 681 43% 85 5% 103 0.04
Water Transportation 514 84 141 53 63% 10 12% 11 0.08
Air Transportation 444 96 151 69 72% 8 8% 12 0.08
Fossil Fuel Electric Power 3,270 1,318 2,430 804 61% 100 8% 135 0.06
Dry Cleaning 6,063 1,234 1,436 314 25% 12 1% 16 0.01
*Percentages in Columns E and F are based on the number of facilities inspected (Column C). Percentages can exceed 100% because violations and actions canoccur without a facility inspection.
Table 23: Five-Year Inspection and Enforcement Summary by Statute for Selected Industries
Industry Sector FacilitiesInspected
TotalInspections
TotalEnforcement
Actions
Clean Air Act Clean Water Act RCRAFIFRA/TSCA/EPCRA/Other
% of TotalInspections
% ofTotal
Actions
% of TotalInspections
% ofTotal
Actions
% of TotalInspections
% ofTotal
Actions
% of TotalInspections
% ofTotal
Actions
Metal Mining 378 1,600 111 39% 19% 52% 52% 8% 12% 1% 17%
Coal Mining 741 3,748 132 57% 64% 38% 28% 4% 8% 1% 1%
Oil and Gas Extraction 1,902 6,071 309 75% 65% 16% 14% 8% 18% 0% 3%
Non-Metallic Mineral Mining 2,803 12,826 622 83% 81% 14% 13% 3% 4% 0% 3%
Textiles 267 1,465 83 58% 54% 22% 25% 18% 14% 2% 6%
Lumber and Wood 473 2,767 265 49% 47% 6% 6% 44% 31% 1% 16%
Furniture 386 2,379 91 62% 42% 3% 0% 34% 43% 1% 14%
Pulp and Paper 430 4,630 478 51% 59% 32% 28% 15% 10% 2% 4%
Printing 2,092 7,691 428 60% 64% 5% 3% 35% 29% 1% 4%
Inorganic Chemicals 286 3,087 235 38% 44% 27% 21% 34% 30% 1% 5%
Resins and Manmade Fibers 263 2,430 219 35% 43% 23% 28% 38% 23% 4% 6%
Pharmaceuticals 129 1,201 122 35% 49% 15% 25% 45% 20% 5% 5%
Organic Chemicals 355 4,294 468 37% 42% 16% 25% 44% 28% 4% 6%
Agricultural Chemicals 164 1,293 102 43% 39% 24% 20% 28% 30% 5% 11%
Petroleum Refining 148 3,081 763 42% 59% 20% 13% 36% 21% 2% 7%
Rubber and Plastic 981 4,383 276 51% 44% 12% 11% 35% 34% 2% 11%
Stone, Clay, Glass and Concrete 388 3,474 277 56% 57% 13% 9% 31% 30% 1% 4%
Iron and Steel 275 4,476 305 45% 35% 26% 26% 28% 31% 1% 8%
Metal Castings 424 2,535 191 55% 44% 11% 10% 32% 31% 2% 14%
Nonferrous Metals 161 1,640 174 48% 43% 18% 17% 33% 31% 1% 10%
Fabricated Metal 1,858 7,914 600 40% 33% 12% 11% 45% 43% 2% 13%
Electronics 863 4,500 251 38% 32% 13% 11% 47% 50% 2% 7%
Automobile Assembly 927 5,912 413 47% 39% 8% 9% 43% 43% 2% 9%
Shipbuilding and Repair 37 243 32 39% 25% 14% 25% 42% 47% 5% 3%
Ground Transportation 3,263 12,904 774 59% 41% 12% 11% 29% 45% 1% 3%
Water Transportation 192 816 70 39% 29% 23% 34% 37% 33% 1% 4%
Air Transportation 231 973 97 25% 32% 27% 20% 48% 48% 0% 0%
Fossil Fuel Electric Power 2,166 14,210 789 57% 59% 32% 26% 11% 10% 1% 5%
Dry Cleaning 2,360 3,813 66 56% 23% 3% 6% 41% 71% 0% 0%

Pharmaceutical Industry Compliance and Enforcement History
Sector Notebook Project September 1997130
Tab
le 2
4: O
ne-Y
ear
Insp
ectio
n an
d E
nfor
cem
ent
Sum
mar
y by
Sta
tute
for
Sel
ecte
d In
dust
ries
Fac
ilitie
sIn
spec
ted
Tot
alIn
spec
tions
Tot
alE
nfor
cem
ent
Act
ions
Cle
an A
ir A
ctC
lean
Wat
er A
ctR
CR
AF
IFR
A/T
SC
A/
EP
CR
A/O
ther
Indu
stry
Sec
tor
% o
f Tot
alIn
spec
tions
% o
fT
otal
Act
ions
% o
f Tot
alIn
spec
tions
% o
fT
otal
Act
ions
% o
f Tot
alIn
spec
tions
% o
fT
otal
Act
ions
% o
f Tot
alIn
spec
tions
% o
fT
otal
Act
ions
Met
al M
inin
g1
42
21
11
05
2%
0%
40
%4
0%
8%
30
%0
%3
0%
Coa
l Min
ing
36
27
65
22
56
%8
2%
40
%1
4%
4%
5%
0%
0%
Oil
and
Ga
s E
xtra
ctio
n8
74
1,1
73
34
82
%6
8%
10
%9
%9
%2
4%
0%
0%
Non
-Met
alli
c M
iner
al M
inin
g1
,48
12
,45
19
18
7%
89
%1
0%
9%
3%
2%
0%
0%
Tex
tiles
17
22
95
12
66
%7
5%
17
%1
7%
17
%8
%0
%0
%
Lum
ber
and
Woo
d2
79
50
75
25
1%
30
%6
%5
%4
4%
25
%0
%4
0%
Fu
rnitu
re2
54
45
91
16
6%
45
%2
%0
%3
2%
45
%0
%9
%
Pu
lp a
nd P
ape
r3
17
78
87
45
4%
73
%3
2%
19
%1
4%
7%
0%
1%
Prin
ting
89
21
,36
35
36
3%
77
%4
%0
%3
3%
23
%0
%0
%
Inor
gani
c C
hem
ica
ls2
00
54
83
13
5%
59
%2
6%
9%
39
%2
5%
0%
6%
Res
ins
and
Ma
nma
de F
iber
s1
73
41
93
63
8%
51
%2
4%
38
%3
8%
5%
0%
5%
Pha
rmac
eutic
als
8020
914
43%
71%
11%
14%
45%
14%
0%0%
Org
ani
c C
hem
ica
ls2
59
83
75
64
0%
54
%1
3%
13
%4
7%
34
%0
%0
%
Agr
icu
ltura
l Che
mic
als
10
52
06
11
48
%5
5%
22
%0
%3
0%
36
%0
%9
%
Pet
role
um
Ref
inin
g1
32
56
51
32
49
%6
7%
17
%8
%3
4%
15
%0
%1
0%
Ru
bber
and
Pla
stic
46
67
91
41
55
%6
4%
10
%1
3%
35
%2
3%
0%
0%
Sto
ne, C
lay,
Gla
ss a
nd C
oncr
ete
25
56
78
27
62
%6
3%
10
%7
%2
8%
30
%0
%0
%
Iron
and
Ste
el1
97
86
63
45
2%
47
%2
3%
29
%2
6%
24
%0
%0
%
Met
al C
ast
ings
23
44
33
26
60
%5
8%
10
%8
%3
0%
35
%0
%0
%
Non
ferr
ous
Met
als
10
83
10
28
44
%4
3%
15
%2
0%
41
%3
0%
0%
7%
Fa
bric
ate
d M
eta
l8
49
1,3
77
83
46
%4
1%
11
%2
%4
3%
57
%0
%0
%
Ele
ctro
nics
42
07
80
43
44
%3
7%
14
%5
%4
3%
53
%0
%5
%
Au
tom
obile
Ass
embl
y5
07
1,0
58
47
53
%4
7%
7%
6%
41
%4
7%
0%
0%
Shi
pbu
ildin
g a
nd R
epa
ir2
25
14
54
%0
%1
1%
50
%3
5%
50
%0
%0
%
Gro
und
Tra
nspo
rta
tion
1,5
85
2,4
99
10
36
4%
46
%1
1%
10
%2
6%
44
%0
%1
%
Wa
ter
Tra
nspo
rta
tion
84
14
11
13
8%
9%
24
%3
6%
38
%4
5%
0%
9%
Air
Tra
nspo
rta
tion
96
15
11
22
8%
33
%1
5%
42
%5
7%
25
%0
%0
%
Fos
sil F
uel
Ele
ctric
Pow
er1
,31
82
,43
01
35
59
%7
3%
32
%2
1%
9%
5%
0%
0%
Dry
Cle
ani
ng1
,23
41
,43
61
66
9%
56
%1
%6
%3
0%
38
%0
%0
%

Pharmaceutical Industry Compliance and Enforcement History
Sector Notebook Project September 1997131
VII.C. Review of Major Legal Actions
This section provides summary information about major cases that haveaffected this sector, and Supplementary Environmental Projects (SEPs).SEPs are compliance agreements that reduce a facility's stipulated penalty inreturn for an environmental project that exceeds the value of the reduction.Often, these projects fund pollution prevention activities that can significantlyreduce the future pollutant loadings of a facility.
VII.C.1. Review of Major Cases
As indicated in EPA’s Enforcement Accomplishments Report, FY1995 andFY1996 publications, 5 significant enforcement actions were resolved between1994 and 1996 for the pharmaceutical industry.
In the Matter of Ciba-Geigy, Inc.: On November 7, 1994, Region II issuedan administrative consent order to Ciba-Geigy, Inc., assessing a penalty of$130,000 for violations of EPCRA at its Toms River, New Jersey, facility.The order was based upon an inspection of Ciba-Geigy’s facility that resultedin a sixteen count complaint alleging that Ciba-Geigy failed to report that itused certain of the following: copper compounds; glycol ethers; chromiumcompounds; cobalt compounds; C.I. Disperse Yellow 3; diethanolamine andethylene glycol during the calendar years 1988 through 1991.
Ciba-Geigy Superfund Site: On October 18, 1995, Region II issued anadministrative order on consent under Sections 104, 107, and 122 ofCERCLA to the Ciba-Geigy Corporation. The order requires Ciba-Geigy toperform, under EPA oversight, a feasibility study for Operable Unit Two todevelop and evaluate remedial alternatives for approximately twenty-onepotential source areas of groundwater contamination on the site. Theestimated cost of the work that Ciba-Geigy will perform is $20 million. Inaddition, Ciba-Geigy will also pay all of EPA’s unreimbursed past responsecosts, $797,000, plus all of EPA’s future response costs, including oversightcosts.
The site is on the National Priorities List and located in Toms River, OceanCounty, New Jersey. Groundwater at the site is contaminated with organicand inorganic compounds, and emanates from surface and subsurface formerdisposal areas on the site. Pursuant to a settlement with EPA in 1994, Ciba-Geigy is currently remediating the groundwater contamination. EPA recentlycompleted a baseline public health risk assessment or source area surfacesoils, as well as a remedial investigation to examine the nature and extent ofthe contamination in the source areas at the site. In performing the feasibilitystudy for the source areas, Ciba-Geigy has agreed to adopt EPA’s riskassessment and remedial investigation report.

Pharmaceutical Industry Compliance and Enforcement History
Sector Notebook Project September 1997132
Takeda Chemical Products USA, Inc. (NC): On August 31, 1995, RegionIV entered into a consent agreement/consent order (CACO) resolving claimsagainst Takeda Chemical Products USA, Inc., for violations of RCRA at itsvitamin manufacturing plant in Wilmington, North Carolina. As part of asolvent extraction process, Takeda generated a by-product referred to asDAS-fuel, which Takeda intended to burn for energy recovery. Prior toreceiving any permits to burn the DAS-fuel, Takeda generated DAS-fuel andstored it on-site for a period in excess of 90 days without a permit or interimstatus, and later shipped it off-site. EPA determined that the DAS-fuel(essentially spent toluene mixed with DAS water and polymers) was F005hazardous waste. As a result, on September 24, 1994, Region IV issued acomplaint for illegal storage of hazardous waste, failure to make a hazardouswaste determination, and failure to manifest the DAS-fuel shipped off-site.The CACO requires Takeda to pay a civil penalty of $99,000, but allowsTakeda to bring DAS-fuel back on-site for reprocessing, provided Takedamanages any waste it produces as a result as a hazardous waste.
Abbott Laboratories: A consent agreement and final order was signed inSeptember 1995, concerning Abbott Laboratories Corporation’s violations ofRCRA standards applicable to the burning of hazardous waste in boilers andindustrial furnaces (BIF) at its North Chicago, Illinois facility. Negotiationswith Abbott Laboratories after issuance of the complaint in February 1994resulted in a penalty of $182,654. Abbott also agreed to conduct asupplemental environmental project (SEP) that will allow Abbott to recoverand recycle the methylene chloride produced in its manufacturing processesand will reduce fugitive methylene chloride emissions. The SEP involvesthree separate, albeit similar, operations, replacing “wet” vacuum pumpsystems with “dry” pumps and high efficiency condensers. The projected costof the SEP is $480,000.
VII.C.2. Supplementary Environmental Projects (SEPs)
Supplemental environmental projects (SEPs) are enforcement options thatrequire the non-compliant facility to complete specific projects. Informationon SEP cases can be accessed via the internet at EPA’s Enviro$en$e website:http://es.inel.gov/sep.

Page 130 intentionally left blank.VIII. COMPLIANCE ACTIVITIES AND INITIATIVES
This section highlights the activities undertaken by this industry sector andpublic agencies to voluntarily improve the sector's environmentalperformance. These activities include those independently initiated byindustrial trade associations. In this section, the notebook also contains alisting and description of national and regional trade associations.
VIII.A. Sector-related Programs and Activities
The Pharmaceutical Research and Manufacturers of America (PhRMA) andEPA are considering developing compliance and regulations guides,concerning the interactions of EPA and FDA regulations for thepharmaceutical industry.
VIII.B. EPA Voluntary Programs
33/50 Program
The 33/50 Program is a ground breaking program that has focused onreducing pollution from seventeen high-priority chemicals through voluntarypartnerships with industry. The program's name stems from its goals: a 33%reduction in toxic releases and transfers by 1992, and a 50% reduction by1995, against a baseline of 1.5 billion pounds of releases and transfers in1988. The results have been impressive: 1,300 companies have joined the33/50 Program (representing over 6,000 facilities) and have reached thenational targets a year ahead of schedule. The 33% goal was reached in 1991,and the 50% goal -- a reduction of 745 million pounds of toxic wastes -- wasreached in 1994. The 33/50 Program can provide case studies on many of thecorporate accomplishments in reducing waste.
Table 25 lists those companies participating in the 33/50 program thatreported the SIC codes 2833 and 2834 to TRI. Some of the companiesshown also listed facilities that are not producing pharmaceuticals. Thenumber of facilities within each company that are participating in the 33/50program and that report pharmaceutical SIC codes is shown. Where availableand quantifiable against 1988 releases and transfers, each company’s 33/50goals for 1995 and the actual total releases and transfers and percentreduction between 1988 and 1994 are presented. At the time of publicationof this document (August 1997) 1995 33/50 Program TRI data were notavailable.
Table 20 shows that 34 companies comprised of 160 facilities reporting SIC2833 and 2834 are participated in the 33/50 program. For those companiesshown with more than one pharmaceutical manufacturing facility, all facilitiesmay not be participating in 33/50. The 33/50 goals shown for companies withmultiple pharmaceutical facilities, however, are company-wide, potentiallyaggregating more than one facility and facilities not carrying outpharmaceutical operations. In addition to company-wide goals, individual

Pharmaceutical Industry Activities and Initiatives
Sector Notebook Project September 1997134
facilities within a company may have their own 33/50 goals or may bespecifically listed as not participating in the 33/50 program. Since the actualpercent reductions shown in the last column apply to all of the companies’pharmaceutical manufacturing facilities and only pharmaceuticalmanufacturing facilities, direct comparisons to those company goalsincorporating non-pharmaceutical facilities or excluding certain facilities maynot be possible. For information on specific facilities participating in 33/50,contact David Sarokin (202-260-6907) at the 33/50 Program Office.

Pharmaceutical Industry Activities and Initiatives
Sector Notebook Project September 1997135
Table 25: Pharmaceutical Industry Participation in the 33/50 ProgramParent Company(Headquarters Location)
Company-OwnedPharmaceutical
FacilitiesReporting 33/50
Chemicals
Company-wide% ReductionGoal1 (1988-
1995)
1988 TRIReleases andTransfers of
33/50 Chemicals(pounds)
1994 TRIReleases andTransfers of
33/50 Chemicals(pounds)
Actual %Reduction for
PharmaceuticalFacilities (1988
- 1994)
3M Minnesota Mining &Mfg.. Company -St. Paul, MN
2 70 885, 011 194, 850 78
Abbott Laboratories -North Chicago, IL
6 20 3, 017, 869 2, 869, 793 5.0
American Home ProductsCorporation -Madison ,NJ
19 50 1, 828, 970 930, 992 49
Anabolic Incorporated -Irvine, CA
1 75 39, 602 0 100
Baxter International Inc. -Deerfield, IL
8 80 921, 282 33, 312 96
Boehringer Ingelheim Corp.-Ridgefield, CT
2 50 198, 500 247, 166 -24.5
Bristol-Myers Squibb Co. -New York, NY
15 50 4, 876, 002 2, 305, 269 53
Burroughs Wellcome Co. -Durham, NC
2 26 469, 075 193, 171 59
Ciba-Geigy Company -Tarrytown, NY
14 50 2, 613, 266 1, 179, 471 55
Coating Place Incorporated -Verona, WI
1 *** 149, 000 0 100
Dow Chemical Company -Midland, MI
1 50 115, 000 109, 100 5
Eastman Kodak Company -Rochester, NY
1 50 87, 350 15, 766 82
Eli Lilly and Company -Indianapolis, IN
7 50 5, 749, 879 1, 194, 760 79
Fisons Company -Rochester, NY
1 *** 3, 395 2, 229 34
Ganes Chemicals Inc. -Carlstadt, NJ
2 *** 67, 018 19, 586 71
Hoechst Celanese Company-Corpus Christi, TX
1 50 0 0 --
Hoffmann-La Roche Inc. -Nutley, NJ
5 62 2, 154, 667 1, 230, 361 43
Johnson & Johnson -New Brunswick, NJ
2 65 258, 090 234, 444 9
Mallinckrodt Group Inc. -Saint Louis, MO
1 50 0 500 --
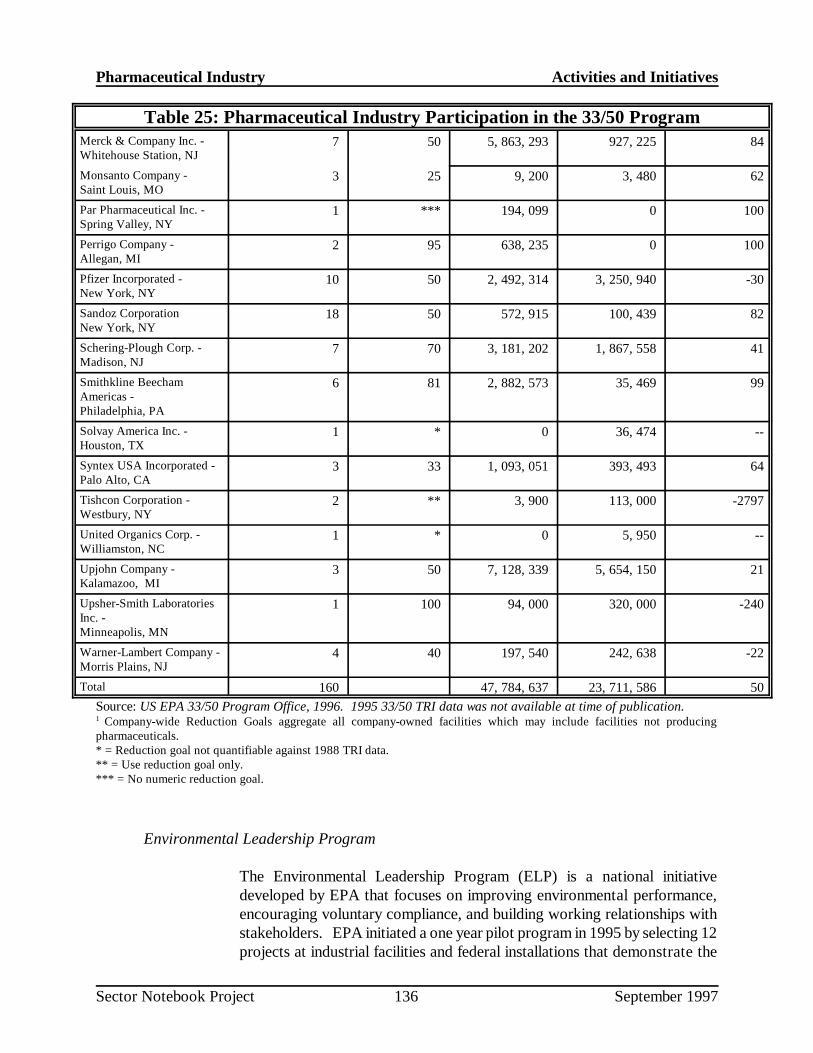
Pharmaceutical Industry Activities and Initiatives
Table 25: Pharmaceutical Industry Participation in the 33/50 Program
Sector Notebook Project September 1997136
Merck & Company Inc. -Whitehouse Station, NJ
7 50 5, 863, 293 927, 225 84
Monsanto Company -Saint Louis, MO
3 25 9, 200 3, 480 62
Par Pharmaceutical Inc. -Spring Valley, NY
1 *** 194, 099 0 100
Perrigo Company -Allegan, MI
2 95 638, 235 0 100
Pfizer Incorporated -New York, NY
10 50 2, 492, 314 3, 250, 940 -30
Sandoz CorporationNew York, NY
18 50 572, 915 100, 439 82
Schering-Plough Corp. -Madison, NJ
7 70 3, 181, 202 1, 867, 558 41
Smithkline BeechamAmericas -Philadelphia, PA
6 81 2, 882, 573 35, 469 99
Solvay America Inc. -Houston, TX
1 * 0 36, 474 --
Syntex USA Incorporated -Palo Alto, CA
3 33 1, 093, 051 393, 493 64
Tishcon Corporation -Westbury, NY
2 ** 3, 900 113, 000 -2797
United Organics Corp. -Williamston, NC
1 * 0 5, 950 --
Upjohn Company -Kalamazoo, MI
3 50 7, 128, 339 5, 654, 150 21
Upsher-Smith LaboratoriesInc. -Minneapolis, MN
1 100 94, 000 320, 000 -240
Warner-Lambert Company -Morris Plains, NJ
4 40 197, 540 242, 638 -22
Total 160 47, 784, 637 23, 711, 586 50
Source: US EPA 33/50 Program Office, 1996. 1995 33/50 TRI data was not available at time of publication.1 Company-wide Reduction Goals aggregate all company-owned facilities which may include facilities not producingpharmaceuticals.* = Reduction goal not quantifiable against 1988 TRI data.** = Use reduction goal only.*** = No numeric reduction goal.
Environmental Leadership Program
The Environmental Leadership Program (ELP) is a national initiativedeveloped by EPA that focuses on improving environmental performance,encouraging voluntary compliance, and building working relationships withstakeholders. EPA initiated a one year pilot program in 1995 by selecting 12projects at industrial facilities and federal installations that demonstrate the

Pharmaceutical Industry Activities and Initiatives
Sector Notebook Project September 1997137
principles of the ELP program. These principles include: environmentalmanagement systems, multimedia compliance assurance, third-partyverification of compliance, public measures of accountability, pollutionprevention, community involvement, and mentor programs. In return forparticipating, pilot participants received public recognition and were given aperiod of time to correct any violations discovered during these experimentalprojects.
EPA is making plans to launch its full-scale Environmental LeadershipProgram in 1997. The full-scale program will be facility-based with a 6-yearparticipation cycle. Facilities that meet certain requirements will be eligibleto participate, such as having a community outreach/employee involvementprograms and an environmental management system (EMS) in place for 2years. (Contact: http://es.inel.gov/elp or Debby Thomas, ELP DeputyDirector, at 202-564-5041)
Project XL
Project XL was initiated in March 1995 as a part of President Clinton’sReinventing Environmental Regulation initiative. The projects seek toachieve cost effective environmental benefits by providing participantsregulatory flexibility on the condition that they produce greater environmentalbenefits. EPA and program participants will negotiate and sign a Final ProjectAgreement, detailing specific environmental objectives that the regulatedentity shall satisfy. EPA will provide regulatory flexibility as an incentive forthe participants’ superior environmental performance. Participants areencouraged to seek stakeholder support from local governments, businesses,and environmental groups. EPA hopes to implement fifty pilot projects infour categories, including industrial facilities, communities, and governmentfacilities regulated by EPA. Applications are being accepted on a rollingbasis.
In 1996, EPA accepted a proposal by Merck to deliver superiorenvironmental protection while allowing flexible operation at itspharmaceutical manufacturing facility near Elkton, Virginia. Merck, alongwith its stakeholders, developed a simplified air permit for the facility that willcap total air emissions of criteria pollutants at less than recent actual levelsand allow the facility to make changes and additions to its manufacturingprocesses as soon as they are needed without prior approval. The upfrontenvironmental benefit which will enable Merck to operate flexibly under theemissions cap will come from converting the coal burning powerhouse tonatural gas. This conversion will reduce the site's actual air emissions by over900 tons per year of criteria pollutants, and 50 tons per year of hazardous airpollutants.
Under the proposal, EPA and the Virginia Department of Environmental

Pharmaceutical Industry Activities and Initiatives
Sector Notebook Project September 1997138
Quality (VADEQ) will adopt the Prevention of Significant Deterioration(PSD) permit through different mechanisms under their respectivejurisdictions. EPA plans to promulgate a site-specific rule making in order tomake adjustments to current applicable regulations to allow for the flexibleoperation of the permit. The Virginia State Air Pollution Control Board willpromulgate a variance to make the PSD permit legally enforceable under statelaws. These proposed actions and the draft permit were subject to publiccomment and it is expected that the permit will be issued to Merck during1997.
For additional information regarding XL projects, including applicationprocedures and criteria, see the May 23, 1995 Federal Register Notice.(Contact: Fax-on-Demand Hotline 202-260-8590, Web: http://www.epa.gov/ProjectXL, or Christopher Knopes at EPA’s Office of Policy, Planning andEvaluation 202-260-9298)
Climate Wise Program
Climate Wise is helping US industries turn energy efficiency and pollutionprevention into a corporate asset. Supported by the technical assistance,financing information and public recognition that Climate Wise offers,participating companies are developing and launching comprehensiveindustrial energy efficiency and pollution prevention action plans that savemoney and protect the environment. The nearly 300 Climate Wise companiesexpect to save more than $300 million and reduce greenhouse gas emissionsby 18 million metric tons of carbon dioxide equivalent by the year 2000.Some of the actions companies are undertaking to achieve these resultsinclude: process improvements, boiler and steam system optimization, aircompressor system improvements, fuel switching, and waste heat recoverymeasures including cogeneration. Created as part of the President’s ClimateChange Action Plan, Climate Wise is jointly operated by the Department ofEnergy and EPA. Under the Plan many other programs were also launchedor upgraded including Green Lights, WasteWi$e and DoE’s Motor ChallengeProgram. Climate Wise provides an umbrella for these programs whichencourage company participation by providing information on the range ofpartnership opportunities available. (Contact: Pamela Herman, EPA, 202-260-4407 or Jan Vernet, DoE, 202-586-4755)
Energy Star Buildings Program
EPA’s ENERGY STAR Buildings Program is a voluntary, profit-based programdesigned to improve the energy-efficiency in commercial and industrialbuildings. Expanding the successful Green Lights Program, ENERGY STAR
Buildings was launched in 1995. This program relies on a 5-stage strategydesigned to maximize energy savings thereby lowering energy bills, improvingoccupant comfort, and preventing pollution -- all at the same time. If

Pharmaceutical Industry Activities and Initiatives
Sector Notebook Project September 1997139
implemented in every commercial and industrial building in the United States,ENERGY STAR Buildings could cut the nation’s energy bill by up to $25 billionand prevent up to 35% of carbon dioxide emissions. (This is equivalent totaking 60 million cars of the road). ENERGY STAR Buildings participantsinclude corporations; small and medium sized businesses; local, federal andstate governments; non-profit groups; schools; universities; and health carefacilities. EPA provides technical and non-technical support includingsoftware, workshops, manuals, communication tools, and an informationhotline. EPA’s Office of Air and Radiation manages the operation of theENERGY STAR Buildings Program. (Contact: Green Light/Energy Star Hotlineat 1-888-STAR-YES or Maria Tikoff Vargas, EPA Program Director at 202-233-9178 or visit the ENERGY STAR Buildings Program website athttp://www.epa.gov/appdstar/buildings/)
Green Lights Program
EPA’s Green Lights program was initiated in 1991 and has the goal ofpreventing pollution by encouraging U.S. institutions to use energy-efficientlighting technologies. The program saves money for businesses andorganizations and creates a cleaner environment by reducing pollutantsreleased into the atmosphere. The program has over 2,345 participants whichinclude major corporations, small and medium sized businesses, federal, stateand local governments, non-profit groups, schools, universities, and healthcare facilities. Each participant is required to survey their facilities andupgrade lighting wherever it is profitable. As of March 1997, participants hadlowered their electric bills by $289 million annually. EPA provides technicalassistance to the participants through a decision support software package,workshops and manuals, and an information hotline. EPA’s Office of Air andRadiation is responsible for operating the Green Lights Program. (Contact:Green Light/Energy Star Hotline at 1-888-STARYES or Maria TikoffVargar, EPA Program Director, at 202-233-9178 the )
WasteWi$e Program
The WasteWi$e Program was started in 1994 by EPA’s Office of Solid Wasteand Emergency Response. The program is aimed at reducing municipal solidwastes by promoting waste prevention, recycling collection and themanufacturing and purchase of recycled products. As of 1997, the programhad about 500 companies as members, one third of whom are Fortune 1000corporations. Members agree to identify and implement actions to reducetheir solid wastes setting waste reduction goals and providing EPA withyearly progress reports. To member companies, EPA, in turn, providestechnical assistance, publications, networking opportunities, and national andregional recognition. (Contact: WasteWi$e Hotline at 1-800-372-9473 orJoanne Oxley, EPA Program Manager, 703-308-0199)

Pharmaceutical Industry Activities and Initiatives
Sector Notebook Project September 1997140
NICE3
The U.S. Department of Energy is administering a grant program called TheNational Industrial Competitiveness through Energy, Environment, andEconomics (NICE3). By providing grants of up to 45 percent of the totalproject cost, the program encourages industry to reduce industrial waste atits source and become more energy-efficient and cost-competitive throughwaste minimization efforts. Grants are used by industry to design, test, anddemonstrate new processes and/or equipment with the potential to reducepollution and increase energy efficiency. The program is open to allindustries; however, priority is given to proposals from participants in theforest products, chemicals, petroleum refining, steel, aluminum, metal castingand glass manufacturing sectors. (Contact: http//www.oit.doe.gov/access/nice3, Chris Sifri, DOE, 303-275-4723 or Eric Hass, DOE, 303-275-4728)
Design for the Environment (DfE)
DfE is working with several industries to identify cost-effective pollutionprevention strategies that reduce risks to workers and the environment. DfEhelps businesses compare and evaluate the performance, cost, pollutionprevention benefits, and human health and environmental risks associated withexisting and alternative technologies. The goal of these projects is toencourage businesses to consider and use cleaner products, processes, andtechnologies. For more information about the DfE Program, call (202) 260-1678. To obtain copies of DfE materials or for general information aboutDfE, contact EPA’s Pollution Prevention Information Clearinghouse at (202)260-1023 or visit the DfE Website at http://es.inel.gov/dfe.
VIII.C. Trade Association/I ndustry Sponsored Activity
VIII.C.1. Environmental Programs
The Pharmaceuticals Research and Manufacturers of America (PhRMA)coordinates the research-based pharmaceutical industry’s response toindustry-specific environmental issues, such as the pharmaceutical MACT.PhRMA works through an environmental committee, a series ofsubcommittees responsible for regulatory areas such as water and air, and adhoc work groups to address narrowly-focused issues.
The research-based pharmaceutical industry also relies on other broad-basedtrade associations for issues that affect the larger business community.Several of the PhRMA members are also members of the ChemicalManufacturers Association (CMA) and therefore are part of CMA’sResponsible Care® Initiative.

Pharmaceutical Industry Activities and Initiatives
Sector Notebook Project September 1997141
In addition, many pharmaceutical companies have been implementing theirown environmental programs and initiatives to reduce the environmentalimpacts of their products and manufacturing processes. These programs areboth company-wide and at the facility level. More information on suchprograms can be obtained by contacting individual companies and facilities.

Pharmaceutical Industry Activities and Initiatives
Sector Notebook Project September 1997142
VIII.C.2. Summary of Trade Associations
Pharmaceutical Research and Manufacturersof America (PhRMA)1100 15th Street, NWWashington, D.C. 20035Phone: (202) 835-3400Fax: (202) 835-3414
Budget:$20,000,000Staff: 80Members: 40 companiesAffiliates: 30 companies
The Pharmaceutical Research and Manufacturers of America (PhRMA) is a non-profitorganization which was established in 1958. Its main function is to assist research-based pharmaceutical companies in discovery, development, and marketing of newdrugs for humans. Comprised of most of the largest pharmaceutical companies in theUnited States, PhRMA members are primarily engaged in research and developmentof new medicines. To be a member of PhRMA, a company must be heavily involvedin research and development (R&D) and must also manufacture and market finisheddosage-form drugs under their own brand name. PhRMA member companies investnearly $19 billion a year in discovering and developing new drugs. Additionally,PhRMA members account for approximately 90% of total pharmaceutical sales in theUnited States.
Generic Pharmaceutical IndustryAssociation1620 I Street, NWWashington, D.C. 20006-4005Phone: (202) 833-9070Fax: (202) 833-9612
Budget: $1-2,000,000Staff: 6Members: 46 companies
The Generic Pharmaceutical Industry Association (GPIA) is a primary tradeassociation for manufacturers and distributors of generic drugs. Its main publicationis “GPIA News”.
National Pharmaceutical Alliance(NPA)421 King Street, Suite 222,Alexandria, VA 22314Phone: (703) 836-8816Fax: (703) 549-4749
Budget: $250-500,000Members: 165 companies
The National Pharmaceutical Alliance (NPA) is an organization which represents theinterests of small pharmaceutical companies and allied industries. Members of NPAdevelop bioequivalent versions of major branded products, create products ofalternative combinations, strengths, and/or dosage forms, and market products whichare not produced by larger companies and which would not be available to the public

Pharmaceutical Industry Activities and Initiatives
Sector Notebook Project September 1997143
otherwise. NPA assists in meeting these goals for its member companies. NPA alsopublishes a bi-monthly journal called “NPA & News, Washington Report.”
American Pharmaceutical Association(APhA)2215 Constitution Ave. NWWashington, DC 20037Phone: (202) 628-4410Fax: (202) 783-2351
Budget: $12,000,000Members: 44,000
The American Pharmaceutical Association (APhA) is a professional society thatincludes pharmacists in all practice settings, educators, students, researchers, editorsand publishers of pharmaceutical literature, pharmaceutical chemists and scientists,and food and drug officials. APhA promotes quality health care and comprehensivepharmaceutical care through the appropriate use of pharmacy services. APhA worksto: represent the interests of the profession before governmental bodies; interprets anddisseminates information on developments in health care; and assure quality pharmacyservices and patient care. APhA fosters professional education and training ofpharmacists; supports the Academy of Pharmaceutical Research and Science, theAcademy of Pharmacy Practice and Management, and the Academy of Students ofPharmacy. APhA also publishes a quarterly newsletter, Academy Reporter, andmonthly journals including, American Pharmacy (Journal of the AmericanPharmaceutical Association) and Journal of Pharmaceutical Sciences.
United States PharmacopeialConvention (USP)12601 Twinbrook Pky.Rockville, MD 20852Phone: (301) 881-0666Fax: (301) 816-8247
Budget: $20,000,000Members: 395
The United States Pharmacopeial Convention (USP) is a recognized authority inmedicine, pharmacy, and allied sciences. USP revises and publishes legallyrecognized compendia of drug standards including the National Formulary.

Pharmaceutical Industry Activities and Initiatives
Sector Notebook Project September 1997144
National Association of Pharmaceutical Manufacturers (NAPM)320 Old Country Road - Suite 205Garden City, NY 11530Phone: (516) 741-3699Fax: (516) 741-3696
Nonprescription Drug Manufacturers Association1150 Connecticut Avenue, NWWashington, DC 20036Phone: (202) 429-9260Fax: (202) 223-6835
National Wholesale Druggist’s Association1821 Michael Faraday DriveSuite 400Reston, VA 22090Phone: (703) 787-0000 ext. 240Fax: (703) 787-6930

Pharmaceutical Industry Contacts and References
a Many of the contacts listed above have provided valuable background information and comments duringdevelopment of this document. EPA appreciates this support and acknowledges that the individuals listed do notnecessarily endorse all statements made within this notebook.
Sector Notebook Project September 1997145
IX. CONTACTS/ACKNOWLEDGMENTS/REFERENCES
For further information on selected topics within the pharmaceutical industrya list of publications and contacts are provided below:
Contactsa
Name Organization Telephone Subject
Emily Chow EPA/OECA (202) 564-7071 Chemical Industry Branch,Regulatory requirements andcompliance assistance
Joanne Berman EPA/OECA (202) 564-7064 Chemical Industry Branch,Regulatory requirements andcompliance assistance
Frank Hund EPA/OW (202) 260-7182 Regulatory Requirements (CWA)
Randy McDonald EPA/OA (919)541-5402 Regulatory Requirements (CAA)
Umesh Dholakia EPA Region II (212) 637-4023 Regulatory Requirements (CAA)
Nancy Sager FDA- Center for DrugEvaluation andResearch
(301) 594-5629 Information on Human Drugs
Daniel Kearns FDA - Center forBiologics Evaluationand Research
(301) 827-3031 Information on Biologics
Charles E. Eirkson,III
FDA - Center forVeterinary Medicine
(301) 594-1683 Information on VeterinaryMedicine
Mervin Parker FDA - Center forDevices andRadiological Health
(301) 594-2186 Information on medical devicesand radiological health
Buzz L. Hoffman FDA - Center forFood Safety andApplied Nutrition
(202) 418-3005 Information on foods
Tom White PhRMA (202) 835-3546 Environmental Affairs
CAA: Clean Air ActCWA: Clean Water ActOECA: Office of Enforcement and Compliance AssuranceOA: Office of AirOW: Office of WaterFDA: Food and Drug AdministrationPhRMA: Pharmaceutical Research and Manufacturers of America

Pharmaceutical Industry Contacts and References
Sector Notebook Project September 1997146
REFERENCES
Section II: Introduction to the Pharmaceutical Industry
Opportunities and Challenges for Pharmaceutical Innovation: PhRMA Industry Profile, Pharmaceutical Research and Manufacturers of America, Washington, DC., 1996.
Standard Industrial Classification Manual, 1987, Executive Office of the President, Office ofManagement and Budget, Washington, DC., 1987.
Approved Drug Products with Therapeutic Equivalence Evaluations. FDA, Sixteenth Edition, 1996.
United States 1992 Census of Manufacturers for Drugs, Industry Series, US Department ofCommerce, Bureau of the Census, Washington, DC., 1992, (MC92-I-28C).
United States Industrial Outlook 1994, US Department of Commerce, International TradeAdministration, Washington, DC., 1994, chapter 43.
Section III: I ndustrial Process Description
Encyclopedia of Polymer Science and Engineering, Vol.6, John Wiley and Sons, Inc., New York,1986, p.514-515.
Guidelines to Pollution Prevention: The Pharmaceutical Industry, US EPA, Washington, DC.,October 1991, (EPA/625/7-91/017).
Development Document for Proposed Effluent Limitations Guidelines and Standards for thePharmaceutical Point Source Category, US EPA, Washington, DC., February, 1995,(EPA/821-R-95-019).
Control of Volatile Organic Compound Emissions from Batch Processes, US EPA GuidelineSeries, Research Triangle Park, NC., November, 1993, (EPA-453/R-93-017).
Guidance for Industry: Manufacture, Processing or Holding of Active Pharmaceutical Ingredients,U.S. Food and Drug Administration, August 1996.
Kirk-Othmer Encyclopedia of Chemical Technology, Fourth Edition, John Wiley and Sons, NewYork, 1994.
Remington: The Science of Practice of Pharmacy, 19th edition, Mack Publishing Co., Easton,Pennsylvania, 1995.
Riegel’s Handbook of Industrial Chemistry, Chapter 25: The Pharmaceutical Industry, Jeffrey H.Watthey, Van Nostrand Reinhold, New York, 1992.

Pharmaceutical Industry Contacts and References
Sector Notebook Project September 1997147
Perry’s Chemical Engineers’ Handbook, Sixth Edition, McGraw-Hill Book Company, 1984.
Personal Communication, Schering-Plough Pharmaceuticals, Kenilworth, New Jersey, October,1996.
Air Pollution Engineering Manual - Chapter 16: Pharmaceutical Industry, Richard Crume andJeffrey Portzer, eds. Buonicore, A.J., and Davis, W.T., Air and Waste ManagementAssociation, Van Nostrand Reinhold, New York, 1992.
Air Pollution Control Equipment, Volume II Gases, Louis Theodore, and Anthony J. Buonicore,CFC Press, 1998.
Section V: Pollution Prevention Opportunities
Pharmaceutical Industry Waste Minimization Initiatives (White Paper), Pharmaceutical Researchand Manufacturers of America, 1997.
Guidelines to Pollution Prevention: The Pharmaceutical Industry, US EPA, Washington, DC.,October 1991, (EPA/625/7-91/017).
Profile of the Inorganic Chemical Industry, US EPA, Washington DC., September, 1995, (EPA,310-R-95-004).
Pollution Prevention Research Opportunities in the Pharmaceutical Industry, New JerseyInstitute of Technology, Emissions Reduction Research Center, New Jersey, April 1991.